Embed Size (px)
Citation preview
ICANS-XIV
14th Meeting of the International Collaboration on
Advanced Neutron Sources
June 14-19,1998
Starved Rock Lodge Utica,IIIinois,USA
Analyses on Pressure Wave Propagation and Dynamic Stress in Mercury Targets
Syuiti Ishikura, Masanori Kaminaga, Akira Susuki, Ryutaro Hino
Japan Atomic Energy Research Institute,JAPAN
Iwao Harada, Kosuke Kamba and Motoaki Sakashita
Hitachi Ltd., JAPAN
ABSTRACT
Stress and pressure are analyzed for solving the main design problem in the
JAERI 5MW liquid mercury target. Two different codes are used to evaluate the
stress and pressure waves under a single pulsed heating. They are the structural
a.nalysis code and a developed liquid mercury program. Stress waves are computed
in an axisymmetric target container coupled with liquid approximated as solid
with compressibility, Pressure waves are computed in the target liquid treated as
a purely liquid mercury extending TVD(Tota1 Variational Diminishing) in gas to
liquid.
The maximum stress 170MPa appears as the meridional stress at the window
center, because the bending stress increases for a rectangular beam profile. As
beam profiles change from rectangular to parabola, the meridional stress decreases
at the value of lOOMPa which is smaller than the circumferential stress value 110-
130MPa.
The developed program well shows generation, propagation and reflection of
the pressure wave. Pressures become lOOMPa at the window center and 60 MPa
at the cylinder surface.
1 Introduction
A major design problem in neutron spallation source is how to design the
structure of the target in consisting with complicated dynamic load generated by
pressure waves. A liquid mercury target has been expected as a next generation
liquid metal target to produce much more neutrons than a solid target. They are
288
planning as SNS(Spallation Neutron Source), ESS(European Spallation Source)
and NSF(Neutron Spallation Facility) of JAERI using the 5MW liquid mercury
target.
From a view point of physical understanding, elastic or stress waves generated
in solid have been well known by Love’s famous study [l] . Also, stress waves can
be computed by the structural analysis code such as ANSYS or ABAQUS. A solid
target can be designed within structural dynamics.
A few means exist to know the pressure wave mechanism generated in liq-
uid, because liquid state is not clarified comparing with solid and gas. Skala
and Bauer[2] computed the pressure wave using the extension from the structural
analysis. The PSI developed KASKA program[3] based on the Lagrange/Finite
Difference Method. However, the equation of state is not given such as an equation
of perfect gas so that the lack of the equation of state causes a difficulty of liquid
metal target design. Solving this difficulty, the liquid program based on TVD
(Total Variational Diminishing) have been developed reconstructing TVD theory
in gas dynamics to apply the liquid mercury target.
In this report, stress and pressure are independently analyzed for the JAERI
5MW liquid mercury target under a single pulsed heating by using ABAQUS-
Explicit code and the developed program. Stress waves are computed in an ax-
isymmetric target container coupled with liquid approximated as a solid with com-
pressibility. Pressure wave is computed in detail as the process of generation,
propagation and reflection of the compression and rarefaction waves.
2 Analysis models of 5MW mercury targets
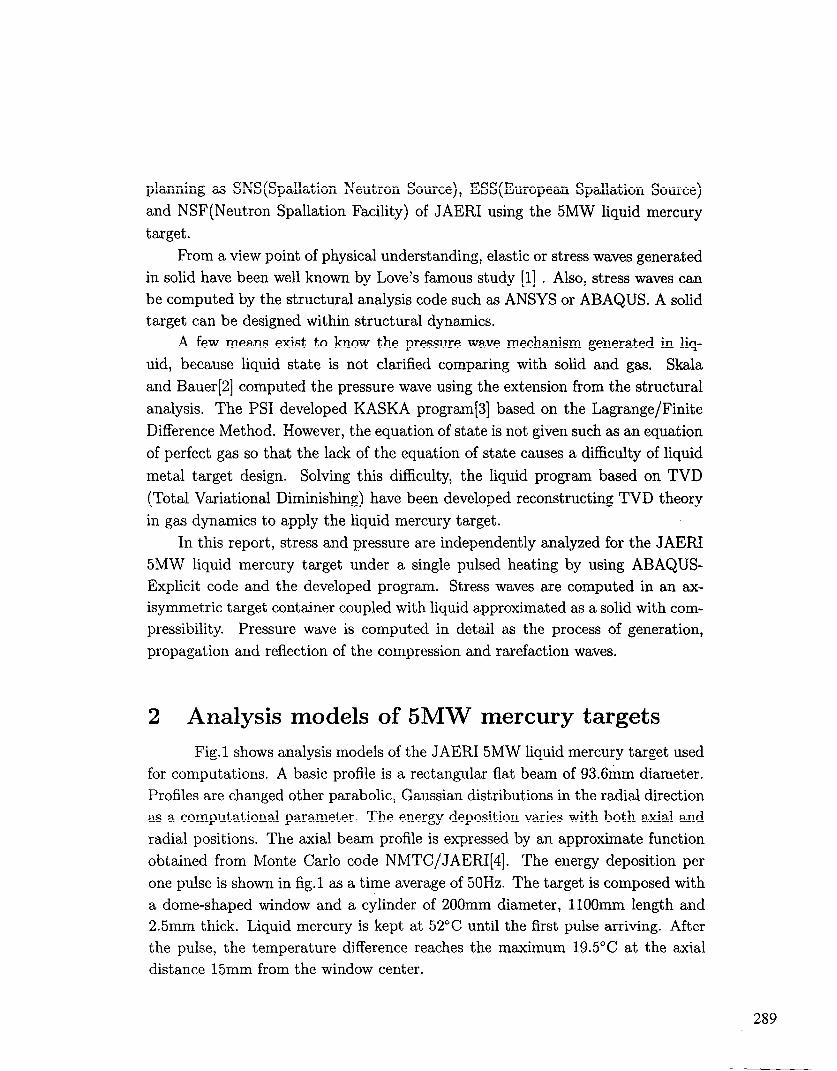
Fig.1 shows analysis models of the JAERI 5MW liquid mercury target used
for computations. A basic profile is a rectangular flat beam of 93.6mm diameter.
Profiles are changed other parabolic, Gaussian distributions in the radial direction
as a computational parameter. The energy deposition varies with both axial and
radial positions. The axial beam profile is expressed by an approximate function
obtained from Monte Carlo code NMTC/JAERI[4]. The energy deposition per
one pulse is shown in fig.1 as a time average of 50Hz. The target is composed with
a dome-shaped window and a cylinder of 200mm diameter, 1lOOmm length and
2.5mm thick. Liquid mercury is kept at 52°C until the first pulse arriving. After
the pulse, the temperature difference reaches the maximum 19.5”C at the axial
distance 15mm from the window center.
289
Target Container
93.6
/ ,.,.,..,.. \. ., ~.:+.I- ;.;:-;;.y:; ‘.,I;::. .:. : ; ‘ : .. .: .,.,. . . ... ,,_ :
Window Center z=O
(a) Axisymmetrlc target model
Fig.1 Stress wave analysis model of 5MW mercury targets
xexp(-O.O69935(z + 9.5499))
(b)Energy deposition
3 Structural analysis
3.1 Computational parameters
An axisymmetric co-ordinate system r and z is used through both analyses,
where T and z are coordinates in the radial and axial direction, respectively. The
window center locates at z = 0. Computations are made on the shell container
coupled with liquid mercury by using ABAQUS-Explicit FEM code. Liquid mer-
cury is modeled as an incompressible solid, where modulus of elasticity 6.6MPa is
small enough and the Poisson’s ratio 0.49995 is close to 0.5. Numbers of elements
are 235 and 11125 in the container and liquid mercury, respectively. The size of
elements is 2mm in the radial direction, and is from 2mm to 1Omm in the axial
direction.
3.2 Stress on a target container
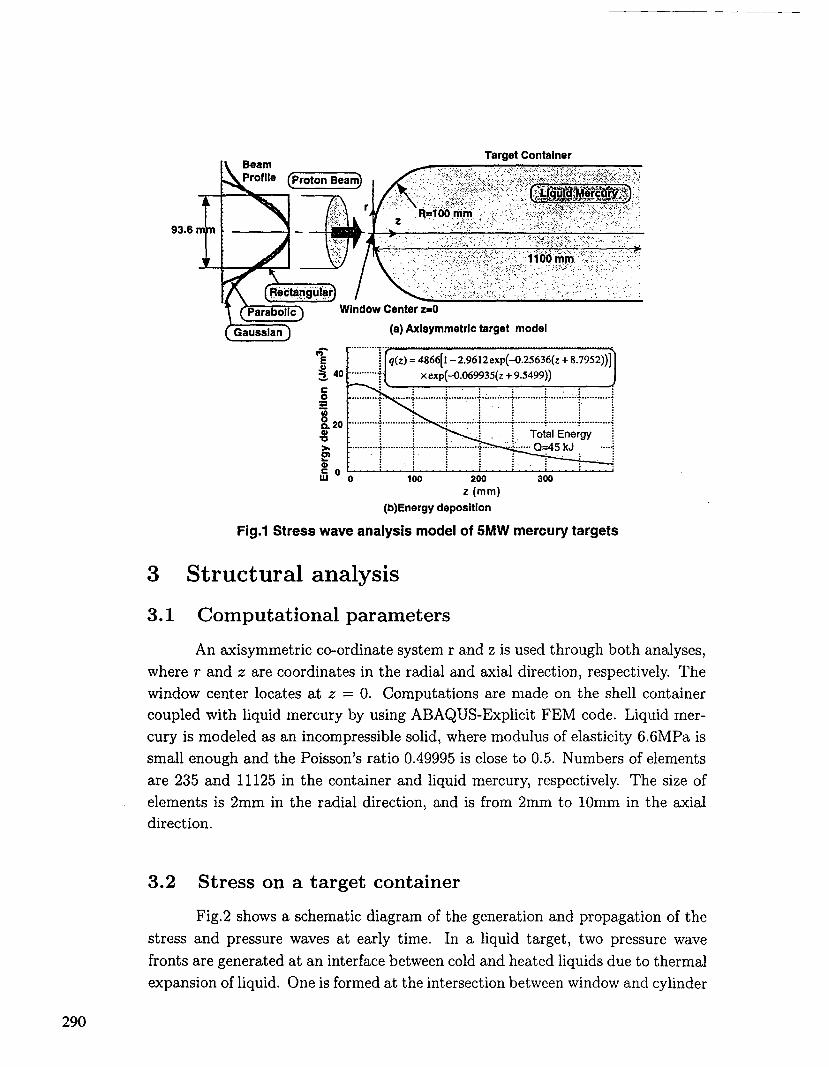
Fig.2 shows a schematic diagram of the generation and propagation of the
stress and pressure waves at early time. In a liquid target, two pressure wave
fronts are generated at an interface between cold and heated liquids due to thermal
expansion of liquid. One is formed at the intersection between window and cylinder
290
of beam diameter near the window center. The other is the liquid surface of the
cylinder which has the same beam diameter. The first wave continuously acts
on the window wall in the axial direction from an initial time. The second wave
reaches lately to the cylinder surface of the container traveling the cold liquid in the
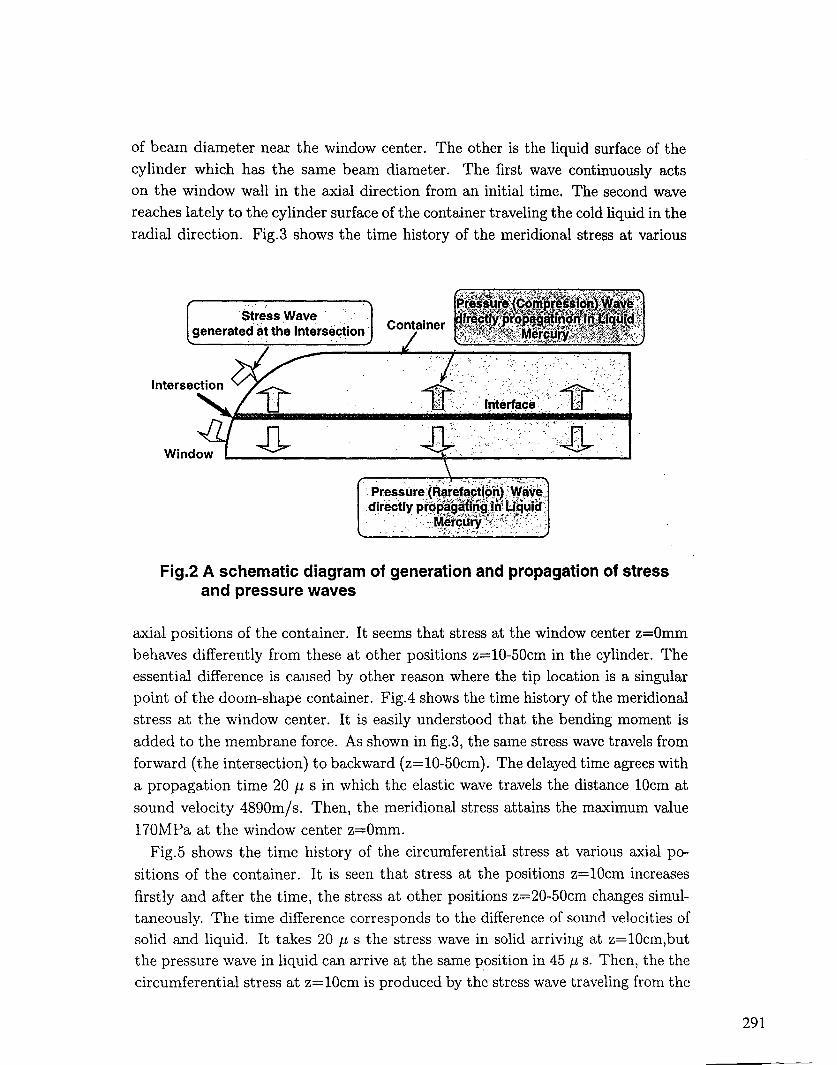
radial direction. Fig.3 shows the time history of the meridional stress at various
Fig.2 A schematic diagram of generation and propagation of stress and pressure waves
axial positions of the container. It seems that stress at the window center z=Omm
behaves differently from these at other positions z=lO-50cm in the cylinder. The
essential difference is caused by other reason where the tip location is a singular
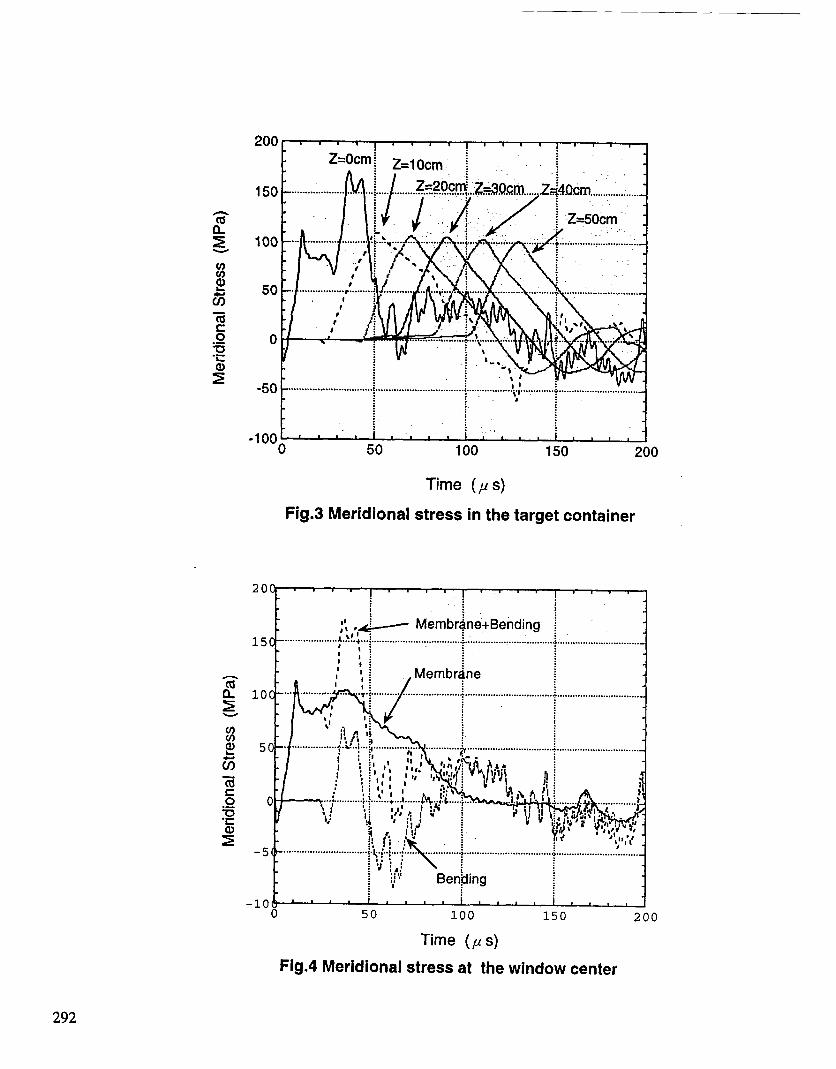
point of the doom-shape container. Fig.4 shows the time history of the meridional
stress at the window center. It is easily understood that the bending moment is
added to the membrane force. As shown in fig.3, the same stress wave travels from
forward (the intersection) to backward (z=lO-50cm). The delayed time agrees with
a propagation time 20 b s in which the elastic wave travels the distance 1Ocm at
sound velocity 4890m/s. Then, the meridional stress attains the maximum value
170MPa at the window center z=Omm.
Fig.5 shows the time history of the circumferential stress at various axial po-
sitions of the container. It is seen that stress at the positions z=lOcm increases
firstly and after the time, the stress at other positions z=20-50cm changes simul-
taneously. The time difference corresponds to the difference of sound velocities of
solid and liquid. It takes 20 p s the stress wave in solid arriving at z=lOcm,but
the pressure wave in liquid can arrive at the same position in 45 p s. Then, the the
circumferential stress at z=lOcm is produced by the stress wave traveling from the
291
150 ...................
100 .......................... .;.
50 ......................
0
-50 t-
. . . . . . . . . . . . . . . . . . . . . . . . . . . . . . . i. I ’ : . . . . . . . . . . . . . . . . . . . . . . . . . . . . . . . . . i’.................
: i’ ,............. + . . . . . . . . . . . . . . . . . . . . . . . . . . . . . . . a - 1
-root ’ ’ ’ ’ ’ ’ ’ ’ ’ ’ ’ ‘ ’ ’ ’ ’ ’ * ’ 1 : . : . . . .
0 50 100 150 200
Time ( /I( s)
Fig.3 Meridional stress in the target container
20 ! ” ” ! ” ” ! ‘I v *
__ .f - :: - e MemtIrQne+Bending ..#I :
15 . . . . . . . . . . . . . . . . . . . . J...:+...: . . . . . . . . . . . . . . . . . . . . . . . . . . . . . . . . . . . . . . . . . . . . . . . . . . . . . . . . . . . . . . . . . . . . . * . . . . . . . . . . . . . . . . . . . . . . . . . . . . . . . . , , i I t , i * Ii
F - - - . . . 8. . . . ._...... L.!.! xMembrTne A.. . . . . . . . . . . . . . . . . . . _
g l” ~... ..:fJ . . . . . . . . . . . . . . . . . . . . . ~ . . . . . . . . . . . . . . . . . . . . . . . . . . . . . f .._ .._.___
2 $J 50
i-Q :i ’ 2
:, . . . . . . . . . . . . . . . . . . +.;...: ?
. . . . . . . . . . . . .
G ! :., I ‘1 i’ . . . . . . . . . . . . . ;;..
I iu . . . . . . . . . . . . . . . . . . . . . . . . . . . . . . . . . 4 . . . . . . . . . . . . . . . . . . . . . . . . . . . . . . . .
;I I:!$ :
.I.
& 5..
,“,$IU :
z -5 . . . . . . . . . . . . . . . . . . . . . . . . . . . . . . . Yf!&.a:...g
$ iJ 1 ‘i~~~~,$@~~~~~
!‘;” +; . ..a . . . . . . . . . i. . . . . . . . . . . .
4 . . . . . . . . . . . . . . . . . . . . . . . . . . . . . . . . . . . . . . . . . . . . . . . . . . . . . . . . . . .
Time (p s)
Fig.4 Meridional stress at the window center
292
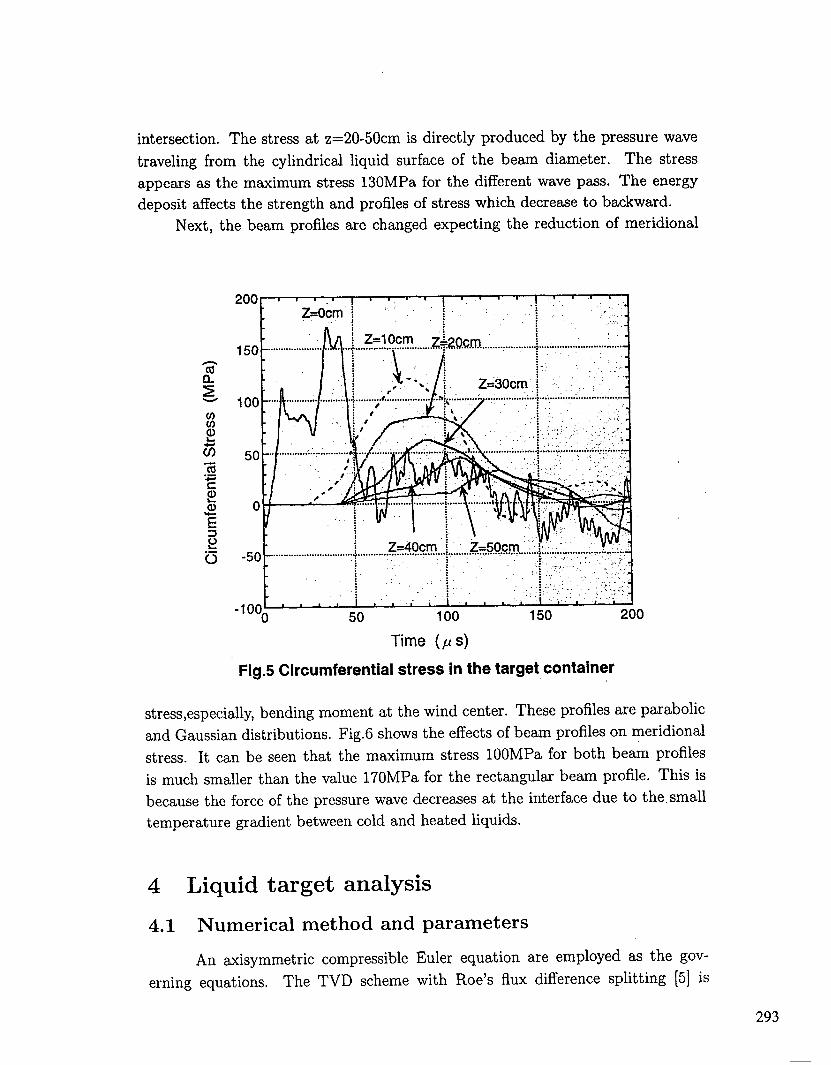
intersection. The stress at z=20-50cm is directly produced by the pressure wave
traveling from the cylindrical liquid surface of the beam diameter. The stress
appears as the maximum stress 130MPa for the different wave pass. The energy
deposit affects the strength and profiles of stress which decrease to backward.
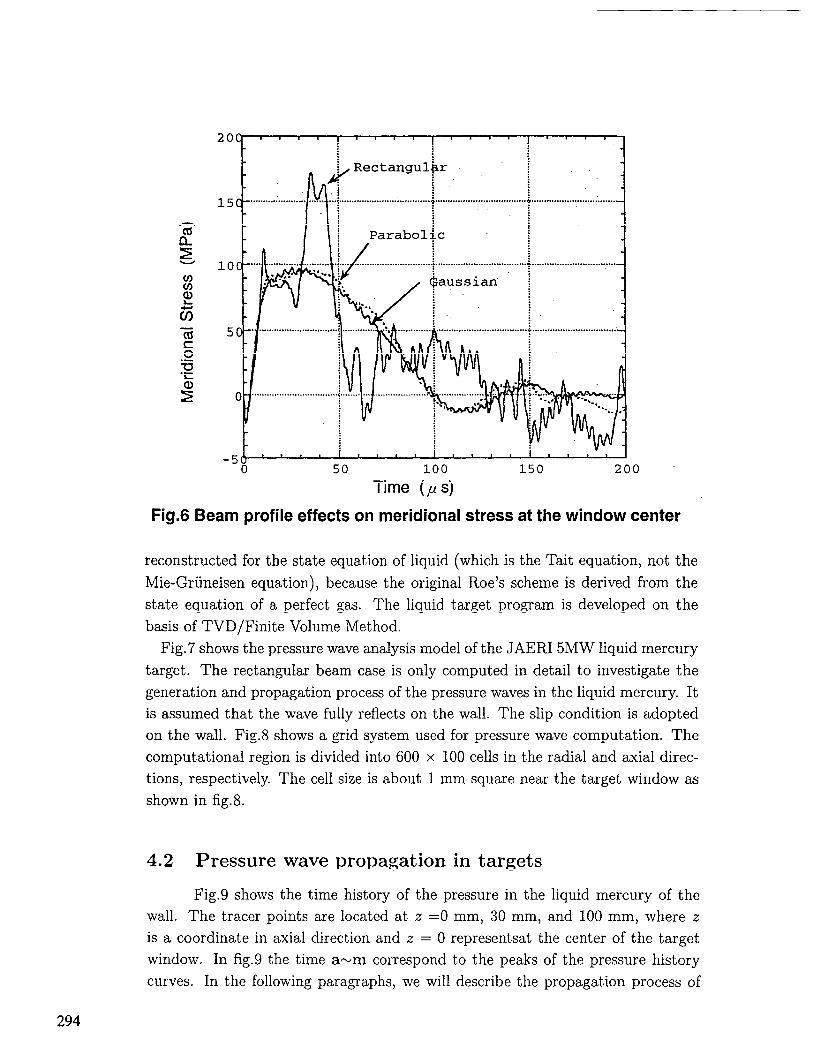
Next, the beam profiles are changed expecting the reduction of meridional
Time (p s)
Fig.5 Circumferential stress in the target container
stress,especially, bending moment at the wind center. These profiles are parabolic
and Gaussian distributions. Fig.6 shows the effects of beam profiles on meridional
stress. It can be seen that the maximum stress lOOMPa for both beam profiles
is much smaller than the value 170MPa for the rectangular beam profile. This is
because the force of the pressure wave decreases at the interface due to the,small
temperature gradient between cold and heated liquids.
4 Liquid target analysis
4.1 Numerical method and parameters
An &symmetric compressible Euler equation are employed as the gov-
erning equations. The TVD scheme with Roe’s flux difference splitting [5] is
293
0 50 100 150 20
Time (,u s) 0
Fig.6 Beam profile effects on meridional stress at the window center
reconstructed for the state equation of liquid (which is the Tait equation, not the
Mie-Griineisen equation), because the original Roe’s scheme is derived from the
state equation of a perfect gas. The liquid target program is developed on the
basis of TVD/Finite Volume Method.
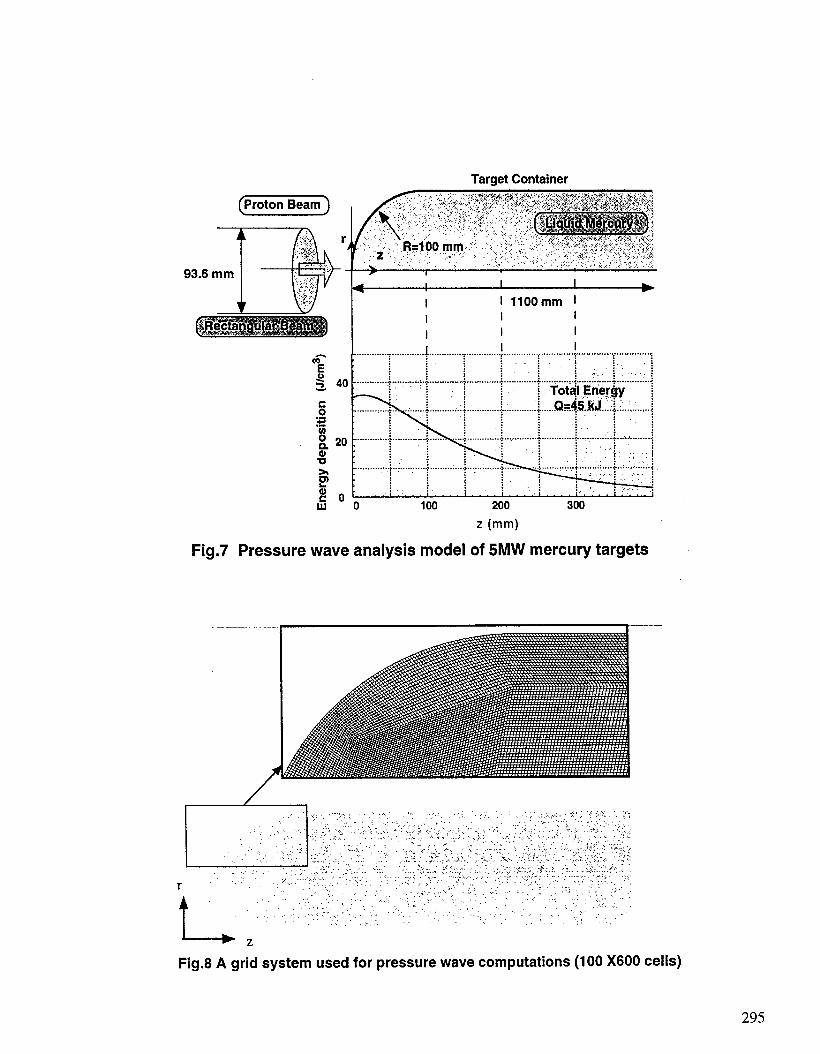
Fig.7 shows the pressure wave analysis model of the JAERI 5MW liquid mercury
target. The rectangular beam case is only computed in detail to investigate the
generation and propagation process of the pressure waves in the liquid mercury. It
is assumed that the wave fully reflects on the wall. The slip condition is adopted
on the wall. Fig.8 shows a grid system used for pressure wave computation. The
computational region is divided into 600 x 100 cells in the radial and axial direc-
tions, respectively. The cell size is about 1 mm square near the target window as
shown in fig.8.
4.2 Pressure wave propagation in targets
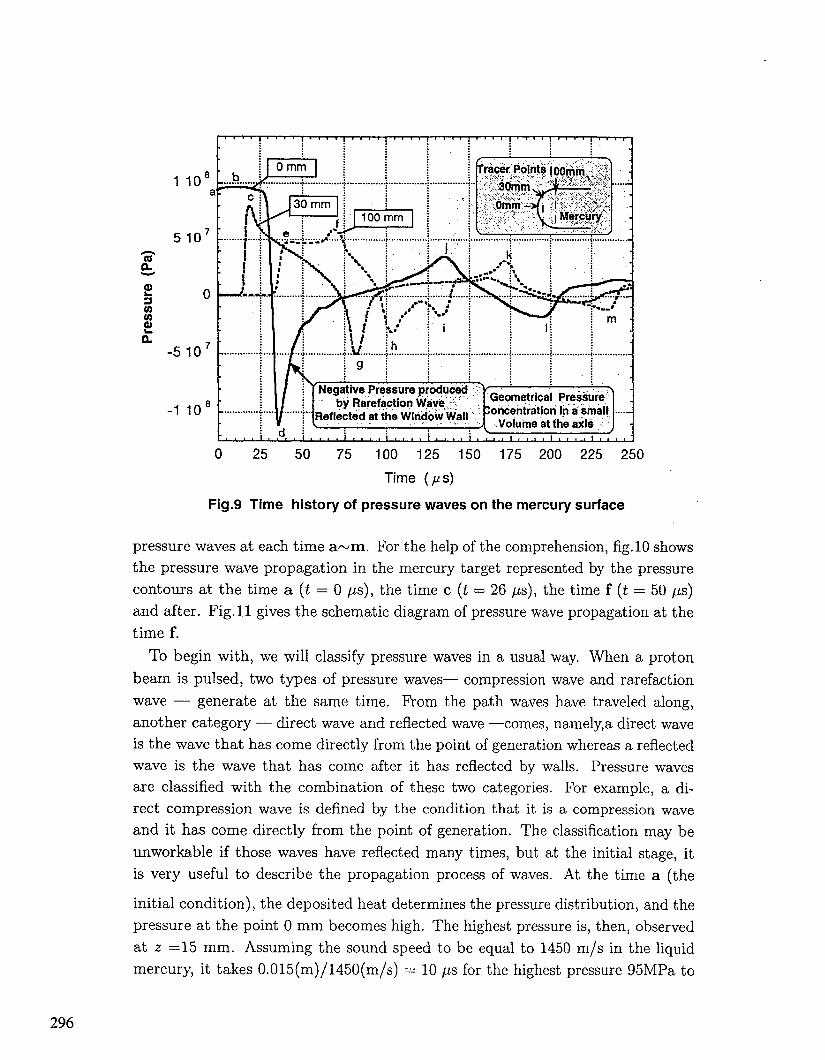
Fig.9 shows the time history of the pressure in the liquid mercury of the
wall. The tracer points are located at z =0 mm, 30 mm, and 100 mm, where z
is a coordinate in axial direction and z = 0 representsat the center of the target
window. In fig.9 the time a-m correspond to the peaks of the pressure history
curves. In the following paragraphs, we will describe the propagation process of
294
Target Container
(Proton)
I I I I b I I 11OOmm 1
1 I I
I I I
,........... I . . . . . . . . . . . . a ..‘..........f.............; . . . . . . . . . . . . . T . . . . . ..I... :.I I........... :‘~ . . . . . . . . . . . . _
. . . . . . . . . . . . . . . . . . . . . . . :i . . . . . . . . _ . . . . t’........,... +..- . . . . . . . . . . f . . . . . . . . ..I.. i ‘...“...,..... f .,.....e... :..:
; a&ii:::~;.; . . . . . . . . . . J :~~~
.__.. i .__.___.___... >.._._ . . . . . . . . . . .._........_ i ““.‘< . . . . ;_+_.i . . . . . . . . j
. . . . . . . . :...i..: . . . f . . . . . . . . . . . . . . . . . . . . . i . . . ..> . . . . . . . . ..,... (........ :: _..... y.: . ..i...... (
. : . . . t:.._i . . t . i _... I I’.... 8.. .._I 100 200 300
2 (mm)
Fig.7 Pressure wave analysis model of 5MW mercury targets
Fig.8 A grid system used for pressure wave computations (100 X600 cells)
295
-5
-1 1 0 8 E ____ ;Vofuine at the axis‘ I ‘,
0 25 50 75 100 125 150 175 200 225 250
Time (ps)
Fig.9 Time history of pressure waves on the mercury surface
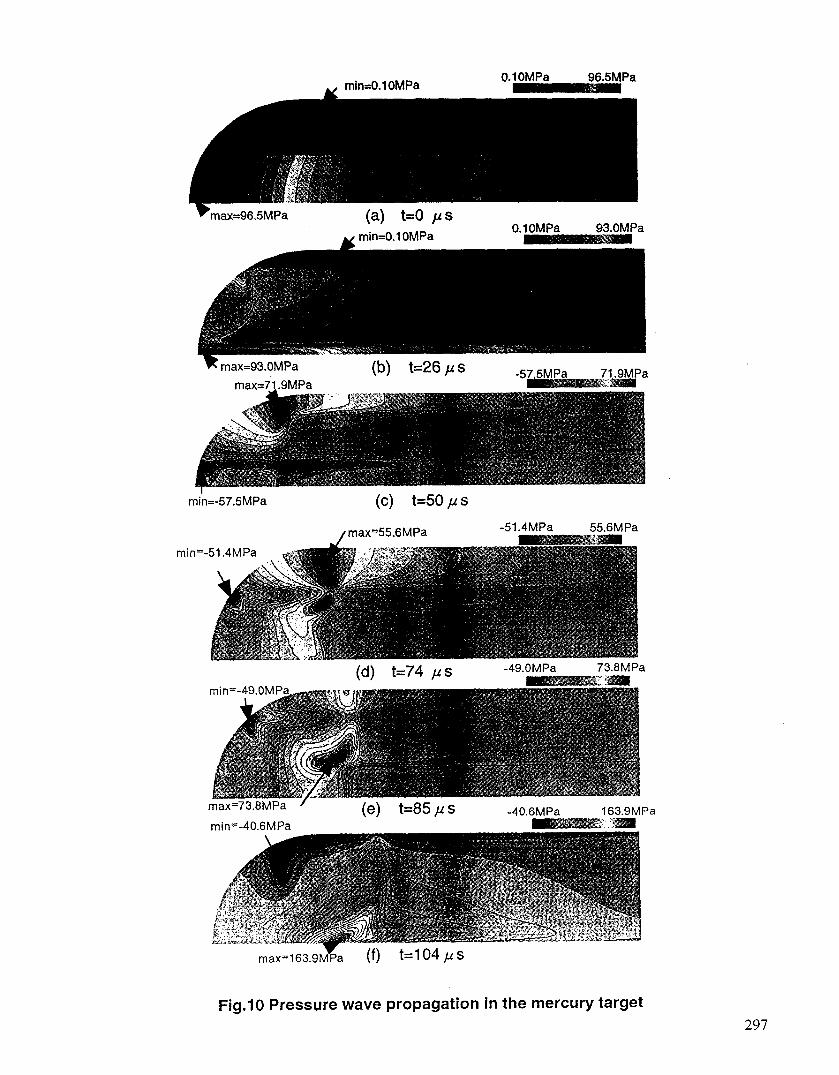
pressure waves at each time a-m. For the help of the comprehension, fig.10 shows the pressure wave propagation in the mercury target represented by the pressure contours at the time a (t = 0 ,us), the time c (t = 26 pus), the time f (t = 50 ,VS)
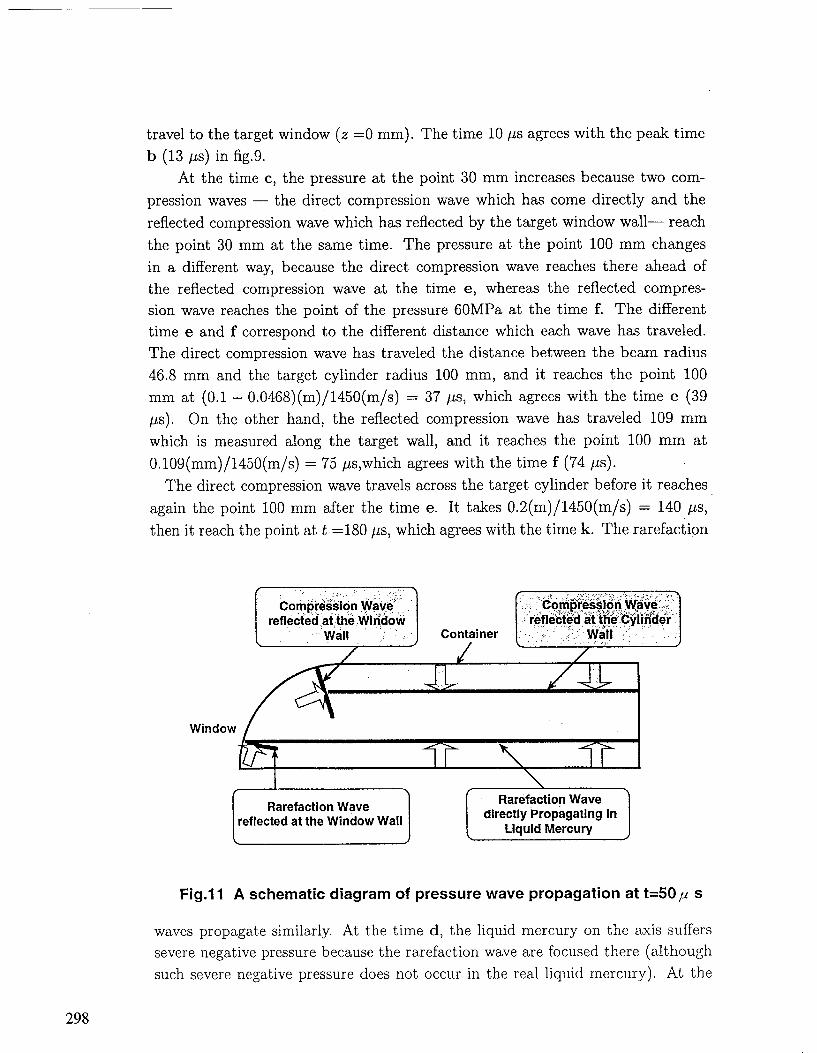
and after. Fig.11 gives the schematic diagram of pressure wave propagation at the
time f.
To begin with, we will classify pressure waves in a usual way. When a proton
beam is pulsed, two types of pressure waves- compression wave and rarefaction
wave - generate at the same time. From the path waves have traveled along, another category - direct wave and reflected wave -comes, namely,a direct wave is the wave that has come directly from the point of generation whereas a reflected wave is the wave that has come after it has reflected by walls. Pressure waves are classified with the combination of these two categories. For example, a di- rect compression wave is defined by the condition that it is a compression wave
and it has come directly from the point of generation. The classification may be
unworkable if those waves have reflected many times, but at the initial stage, it
is very useful to describe the propagation process of waves. At the time a (the
initial condition), the deposited heat determines the pressure distribution, and the
pressure at the point 0 mm becomes high. The highest pressure is, then, observed
at z =15 mm. Assuming the sound speed to be equal to 1450 m/s in the liquid
mercury, it takes O.O15(m)/1450(m/s) = 10 ,XS for the highest pressure 95MPa to
296
u mins0.1 OMPa
l max=96.5MPa (a) t=O j..fs miw0.1 OMPa
O.lOMPa 93.OMPa
k max=93.OMPa
may=71 QMPn
(b) t=26 /AS
m/n=-57.5MPa (c) t=50ps
min=-51.4MPa
-51.4MPa 55.6MPa
max=73.8MPa /
min=-40 6MPa (e) t=85ps -40.6MPa 163.9MPa
. ._.- -
Fig.10 Pressure wave propagation in the mercury target 297
travel to the target window (z =0 mm). The time 10 pus agrees with the peak time
b (13 ps) in fig.9.
At the time c, the pressure at the point 30 mm increases because two com-
pression waves - the direct compression wave which has come directly and the
reflected compression wave which has reflected by the target window wall- reach
the point 30 mm at the same time. The pressure at the point 100 mm changes
in a different way, because the direct compression wave reaches there ahead of
the reflected compression wave at the time e, whereas the reflected compres-
sion wave reaches the point of the pressure 6OMPa at the time f. The different
time e and f correspond to the different distance which each wave has traveled.
The direct compression wave has traveled the distance between the beam radius
46.8 mm and the target cylinder radius 100 mm, and it reaches the point 100
mm at (0.1 - O.O468)(m)/1450(m/s) = 37 I_L s, which agrees with the time e (39
ps). On the other hand, the reflected compression wave has traveled 109 mm
which is measured along the target wall, and it reaches the point 100 mm at
0.109(mm)/1450(m/s) = 75 ps,which agrees with the time f (74 ,QS).
The direct compression wave travels across the target cylinder before it reaches
again the point 100 mm after the time e. It takes 0.2(m)/1450(m/s) = 140 ,us,
then it rea.ch the point at t =180 ,US, which agrees with the time k. The rarefaction
Window
Fig.1 1 A schematic diagram of pressure wave propagation at t=50p s
waves propagate similarly. At the time d, the liquid mercury on the axis suffers
severe negative pressure because the rarefaction wave are focused there (although
such severe negative pressure does not occur in the real liquid mercury). At the
298
time g, the pressure at the point 30 mm become negative because two rarefaction
waves - the direct rarefaction wave which has come directly and the reflected
rarefaction wave which has reflected by the target window wall-reach there at
the same time. The direct rarefaction wave reaches the point 100 mm ahead of
the reflected rarefaction waves at the time h, and the reflected rarefaction wave
reaches the point at the time i. Like the case of compression waves, the different
time h and i correspond to the different distance each wave has traveled, though
the difference 31 ~_ls is shorter than the difference 37 ,!LS observed in the case of
compression waves.
The direct rarefaction wave reaches the point 100 mm at 140 ps after the time
h, i.e., at t =250 ,CH, which agrees with the peak at the time m.
In the later stage, compression waves and rarefaction waves discussed above go
on propagating. The time histories of the pressure become complicated because
more reflected waves are generated at the target window and they interfere each
other,but they still oscillate in the same cycle 140 pus.
5 Summary
Stress and pressure are analyzed for solving the main design problem in the
JAERI 5MW liquid mercury target. Two different codes are used to evaluate the
stress and pressure waves under a single pulsed heating. They are the structural
analysis ABAQUS-Explicit code and a developed liquid mercury program. Stress
waves are computed in an axisymmetric target container coupled with liquid ap-
proximated as a solid with compressibility. Pressure waves are computed in target
liquid treated as a purely liquid mercury extending TVD(Tota1 Variational Dimin-
ishing) in gas to liquid.
The maximum stress 170MPa appears as the meridional stress at the wind
center, because the bending stress increases for a rectangular beam profile. As
beam profiles change from rectangular to parabola, bending stress decreases at
the tip. Then meridional stress decreases at the value of lOOMPa which is smaller
than the circumferential stress value 110-130MPa.
The developed program well shows generation, propagation and reflection of
the compression and rarefaction waves. Pressures become lOOMPa at the window
center and 60 MPa at the cylinder surface.
In the present analyses, the stress is not so high, but this is the first step
to evaluate the dynamic stress generated in liquid metal target. The next steps
have to be considered are to predict accurate stress values. First, it is necessary to
combine liquid and structure analyses for comparing numerical results with exper-
299
iments. Secondly, the target is approximated as an axisymmetric container that
is a suitable geometry to experiments. The practical shape is between two and
three dimensional, so that three dimensional analysis is required to make practical
design.
References
[l] A.E.H. Love, “A Treatise on the Mathematical Theory of Elasticity” Dover
Publications, New York,( 1963)
[2] K.Skala and G.S.Bauer, “On the pressure wave problem in liquid metal tar-
gets for pulsed spallation neutron sources “, ICANS-XIII, Vo1.2, Switzerland,
(1995)
[3] L.Ni, (private communication)
[4] H.Takada, N.Yoshizawa, K.Kosaka and K.Ishibashi, “An Upgrade Version of
the Nucleon Transport Code:NMTC/JAERI97”, JAERI-Data/Code, 98-005.
in Japanese, (1998)
[5] P.L.Roe, “Approximate Riemann Solvers, Parameter Vectors, and Difference
Schemes”, Journal of Computational Physics 43, p.357-372, (1981)
300