Embed Size (px)
Citation preview
Analysing and Interpreting Financial Statements
Dr. Christoph Stork
Wednesday, 8 August 12
QuizWhat is the difference between Net Income and Net Profit?What I the difference between:
Cash receivedIncomeProfit
What is the difference between:Money paidCostLoss
Wednesday, 8 August 12
IntroductionAnalysing financial statements is important for investors, creditors, regulators as well as managers running the companySimilar to a GPS on open sea. It tells you where you are and the direction the company is going
Wednesday, 8 August 12
Financial StatementBalance SheetIncome StatementCash Flow Statement
Wednesday, 8 August 12

Balance Sheet
Wednesday, 8 August 12
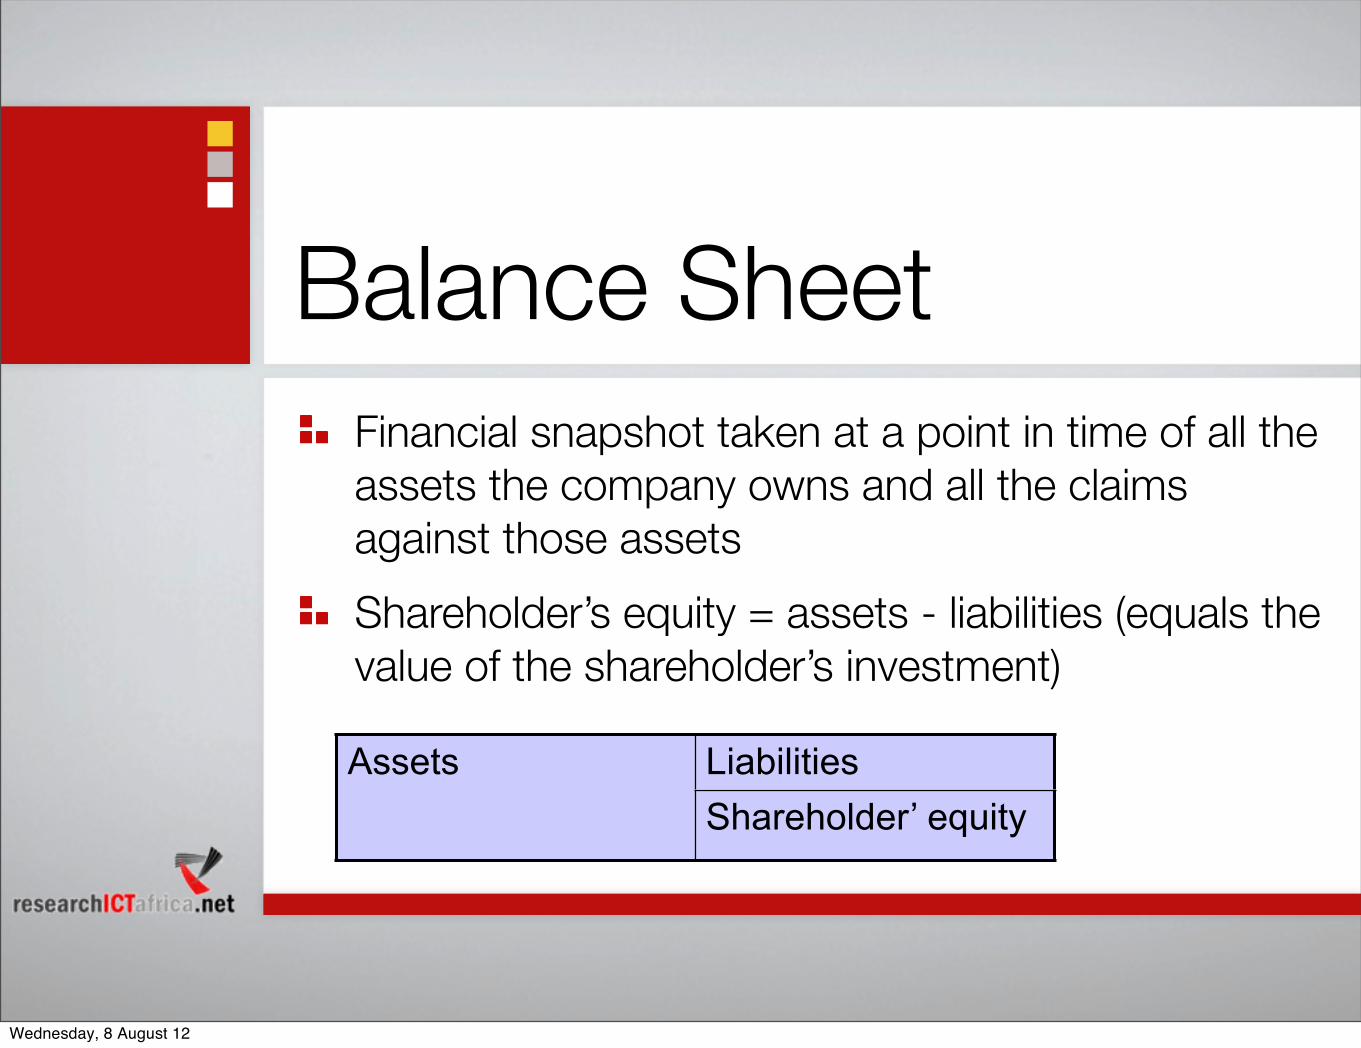
Balance SheetFinancial snapshot taken at a point in time of all the assets the company owns and all the claims against those assetsShareholder’s equity = assets - liabilities (equals the value of the shareholder’s investment)
Assets LiabilitiesAssetsShareholder’ equity
Wednesday, 8 August 12
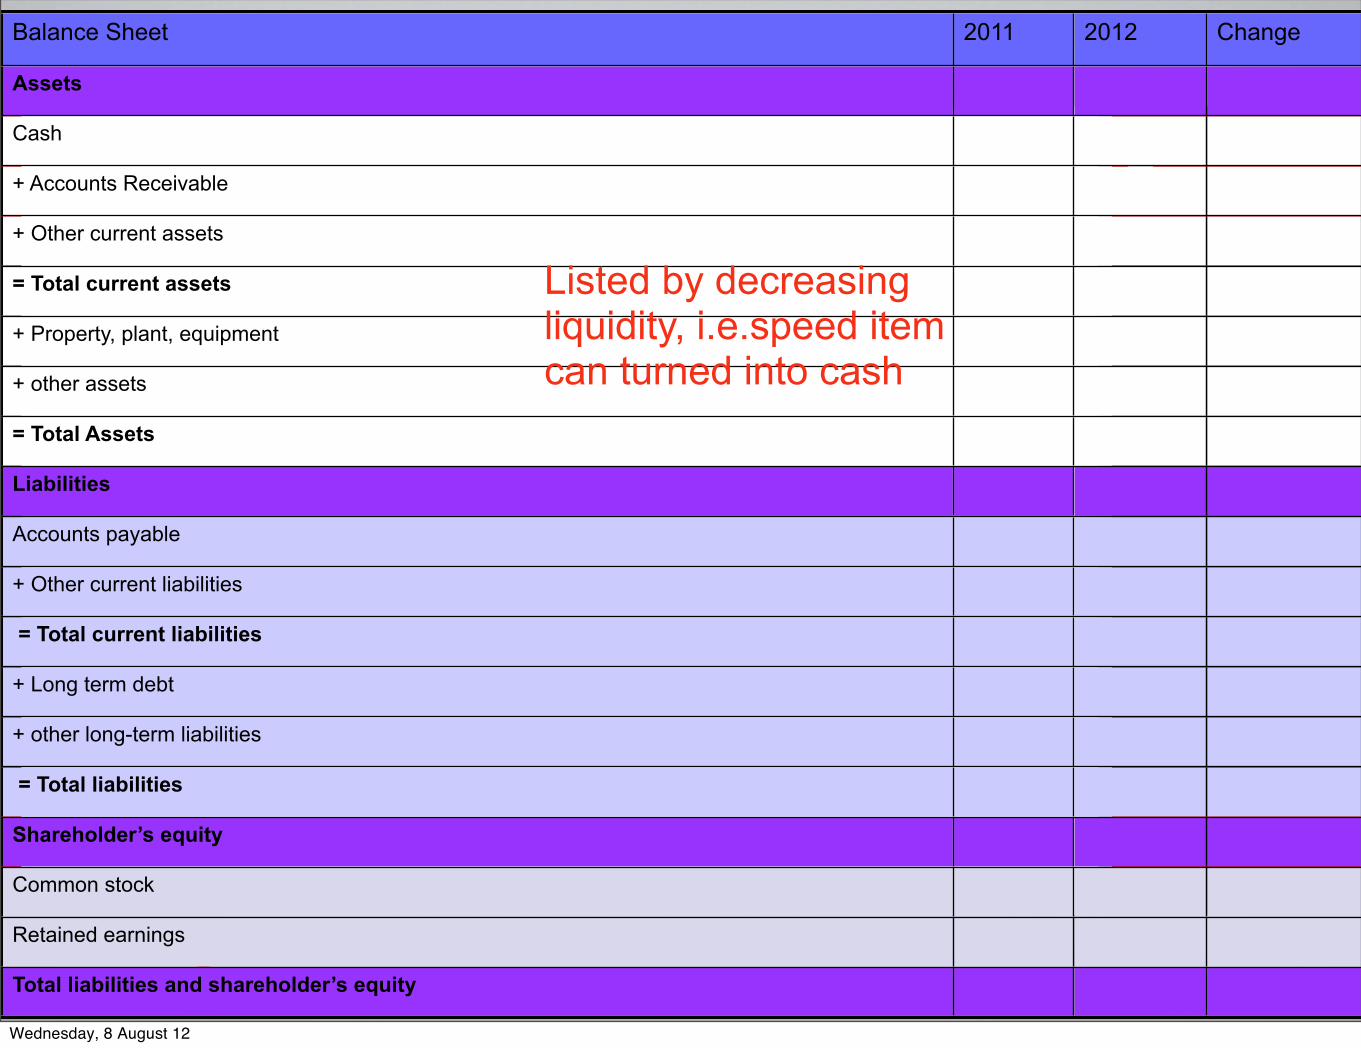
Balance Sheet 2011 2012 Change
Assets
Cash
+ Accounts Receivable
+ Other current assets
= Total current assets
+ Property, plant, equipment
+ other assets
= Total Assets
Liabilities
Accounts payable
+ Other current liabilities
= Total current liabilities
+ Long term debt
+ other long-term liabilities
= Total liabilities
Shareholder’s equity
Common stock
Retained earnings
Total liabilities and shareholder’s equity
Listed by decreasing liquidity, i.e.speed item can turned into cash
Wednesday, 8 August 12
QuizHow does the shareholder’s equity change if:
The company takes a loan ZAR 1 millionThe company receives ZAR 10,000 payment from customer
Wednesday, 8 August 12
Income & Cash Flow Statement
Wednesday, 8 August 12
Income & Cash Flow Statement
If balance sheet equals a snapshot then income and cash flow statements equal a video recording of two accounts of the balance sheet.Income statement: displays revenues and expenses for the financial year (Revenues - expenses = net income)Cash flow statement provides detailed look at the changes of the companies cash balance over time
Wednesday, 8 August 12
Accrual Accounting 1) Identify the revenues for a period2) Match the corresponding costsRevenue is not the same as cash received!Revenue is recognised as soon as the effort required to generate the sale is substantially complete...and payment “certain”...Example: an increase in accounts receivable from one year to the next implies that more revenue was made than cash received.
Wednesday, 8 August 12
DepreciationFixed assets often last longer than 1 year, i.e. they contribute to revenue generation for longer than 1 yearExample: a newly purchased Taxi. Treating the purchase as an expense in the year the taxi was bought would mean that in this year the net profit would be lower and in subsequent years higherDistortion can be avoided by using depreciation: spreading the cost of the Taxi over its expected life
Wednesday, 8 August 12
TaxesOften companies file two financial statements, 1 for the shareholders and 1 for Ministry of Finance
Shareholders: accurately portray the company’s financial performanceTax: minimise taxes
Example: depreciation - using the most rapid method of depreciation over the shortest useful life that the tax authority allows
Wednesday, 8 August 12
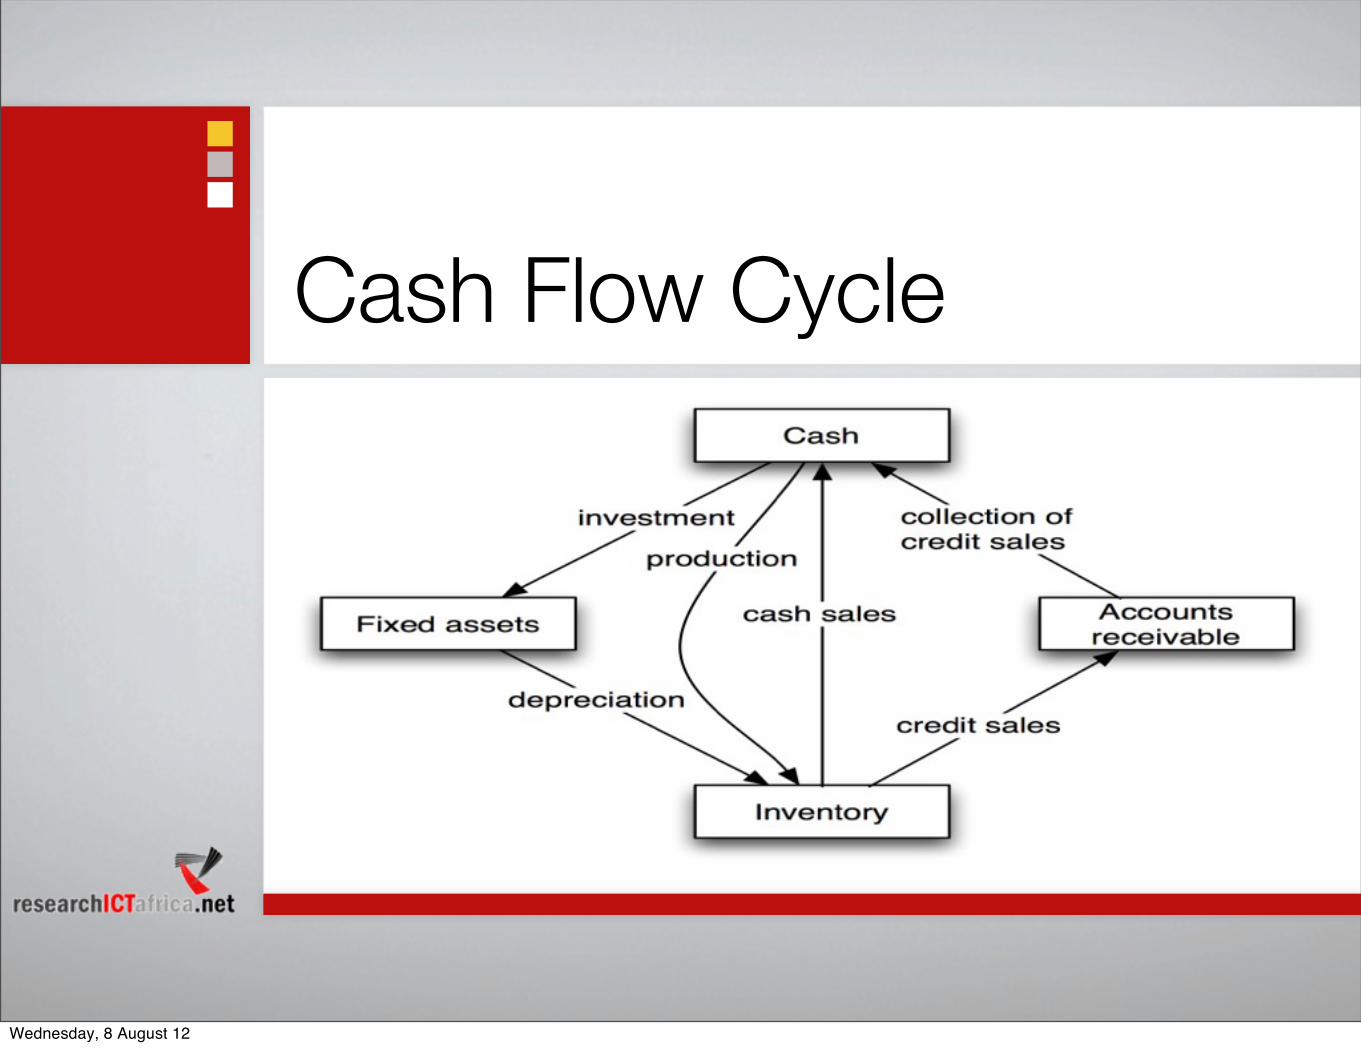
Cash Flow Cycle
Wednesday, 8 August 12
Cash FlowTimely conversion of cash into inventory, accounts receivable and back into cash is the lifeblood of any companyIf severely interrupted, company might become insolventCash flow does not equal profitCash in does not equal revenuesCash out does not equal expenses
Wednesday, 8 August 12

QuizA company can make a profit in a financial year and still be insolvent: How?
Wednesday, 8 August 12
Cash Flow DefinitionsNet Cash Flow = Net Income (Profit)+ Non-cash items
Also known as cash earningsMore or less net income + depreciation (both taken from income statement)
Cash Flow from Operating Activities = Net Cash Flow +/- changes in current assets and liabilities
Companies have to report this in most countriesAvoids changes in current assets and liabilities to distort the pictureRemember! Net Income= Revenues -Expenses, increase in current assets (inventory e.g.) are expenses, so one would slap that on top.
Wednesday, 8 August 12
Value ProblemMarket vs. Book Value
Property bought 50 years ago is more worth than it is in the book for e.g.Value of a brand name and consumer loyaltyShareholder’s equity does not refer to the future but the end of the last financial yearMarket value= shares(outstanding)* share price
Economic Income vs. Accounting incomeDifference between realized and unrealized incomeExample: shares bought and dividends
accountant - only dividend is income; economist-also change in value of shares is income
Imputed CostsIncome statement does not take into account the cost of equity (dividends)
Wednesday, 8 August 12
Analysing the Income Statement
How did the company do in the last period?How might it do in the future?
Wednesday, 8 August 12
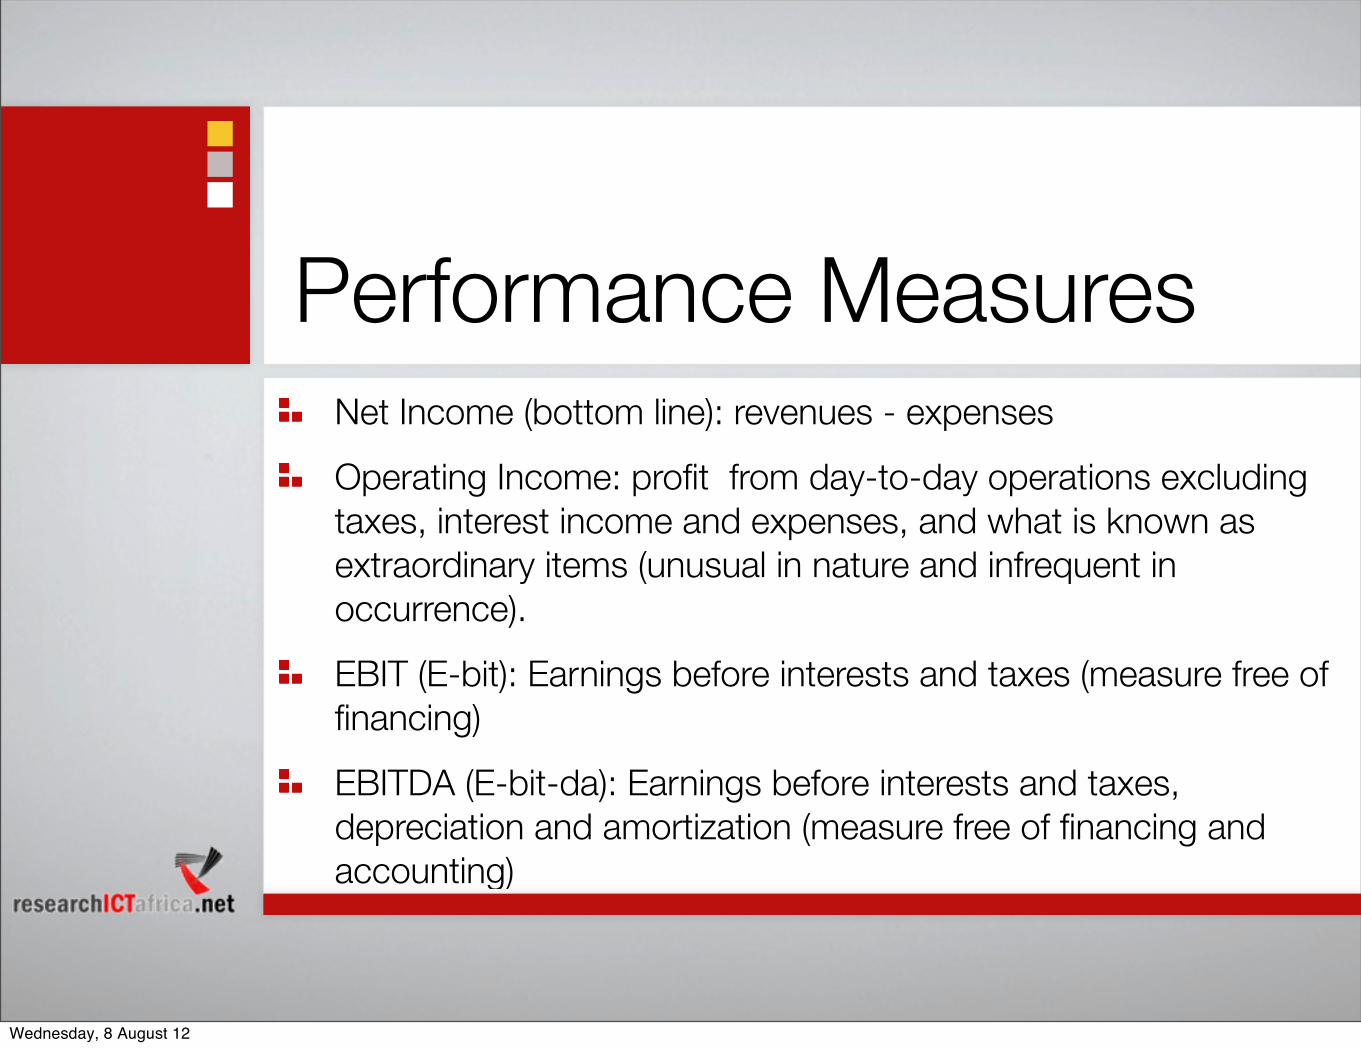
Performance MeasuresNet Income (bottom line): revenues - expensesOperating Income: profit from day-to-day operations excluding taxes, interest income and expenses, and what is known as extraordinary items (unusual in nature and infrequent in occurrence).EBIT (E-bit): Earnings before interests and taxes (measure free of financing)EBITDA (E-bit-da): Earnings before interests and taxes, depreciation and amortization (measure free of financing and accounting)
Wednesday, 8 August 12
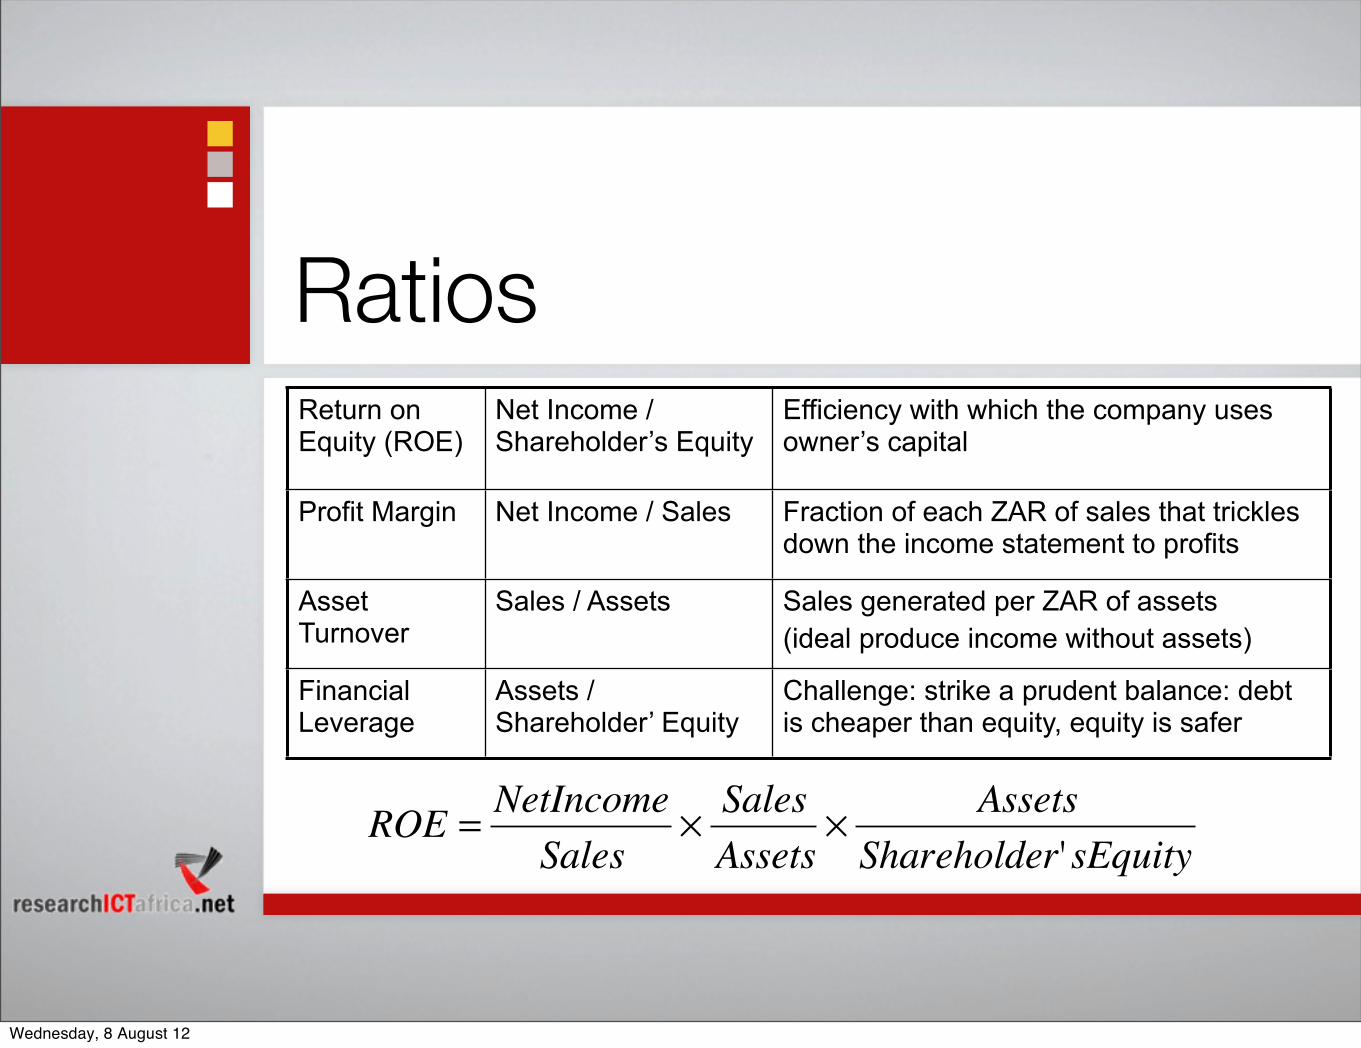
RatiosReturn on Equity (ROE)
Net Income / Shareholder’s Equity
Efficiency with which the company uses owner’s capital
Profit Margin Net Income / Sales Fraction of each ZAR of sales that trickles down the income statement to profits
Asset Turnover
Sales / Assets Sales generated per ZAR of assets(ideal produce income without assets)
Financial Leverage
Assets / Shareholder’ Equity
Challenge: strike a prudent balance: debt is cheaper than equity, equity is safer
�
ROE = NetIncomeSales
× SalesAssets
× AssetsShareholder'sEquity
Wednesday, 8 August 12
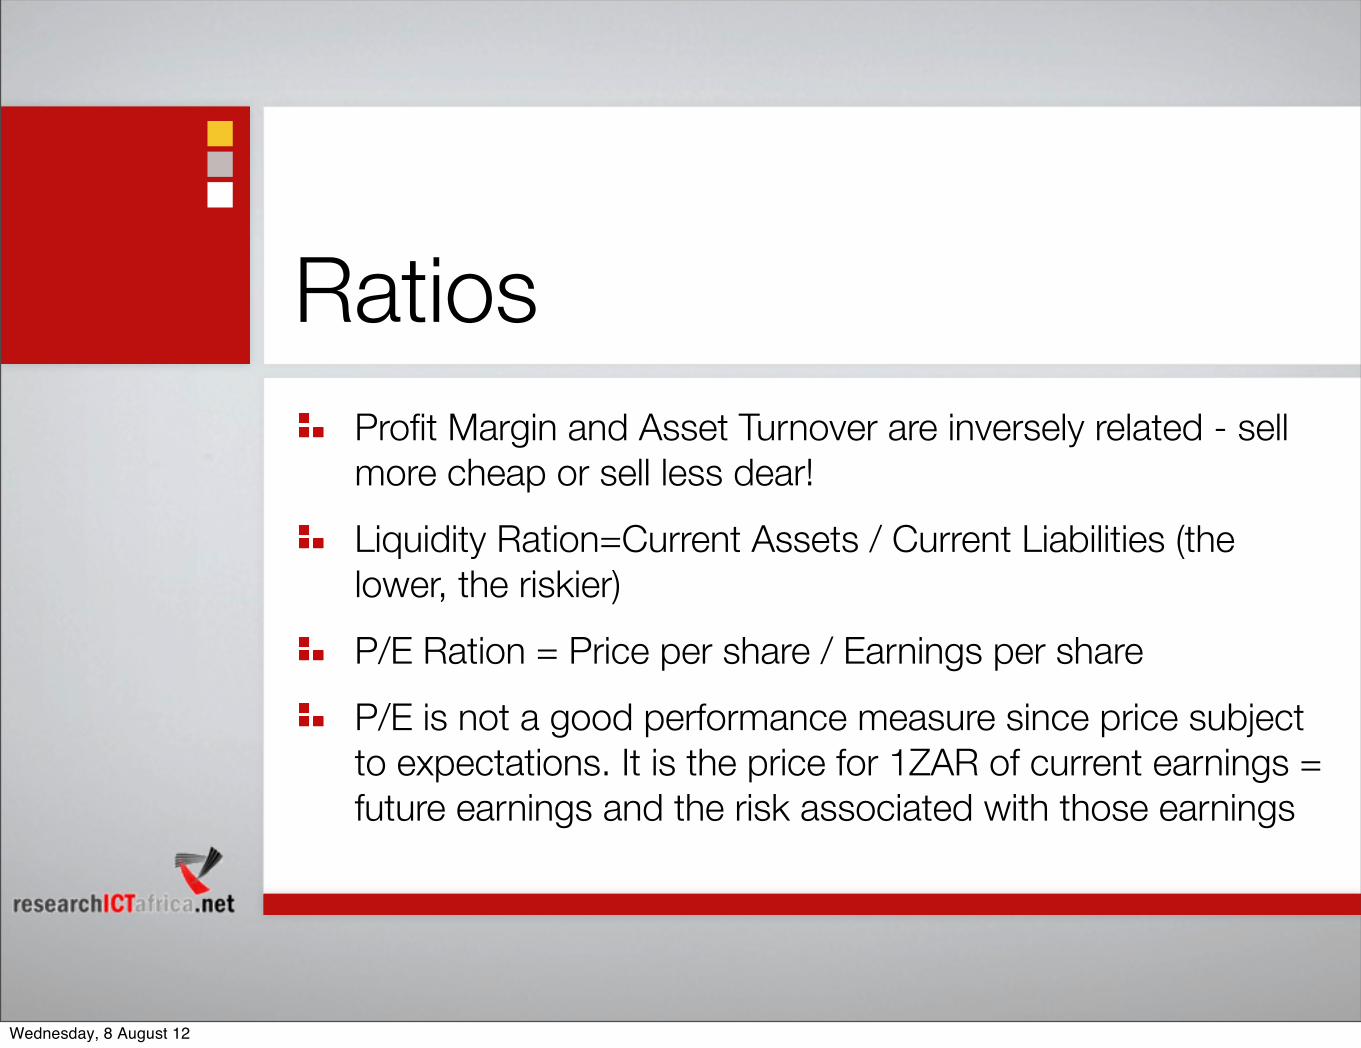
RatiosProfit Margin and Asset Turnover are inversely related - sell more cheap or sell less dear!Liquidity Ration=Current Assets / Current Liabilities (the lower, the riskier)P/E Ration = Price per share / Earnings per shareP/E is not a good performance measure since price subject to expectations. It is the price for 1ZAR of current earnings = future earnings and the risk associated with those earnings
Wednesday, 8 August 12
ExerciseWorkgroup: Calculate for Telecom Namibia and MTC 2010/2011
RoE Profit MarginFinancial leverage
Interpret the Ratios
Wednesday, 8 August 12
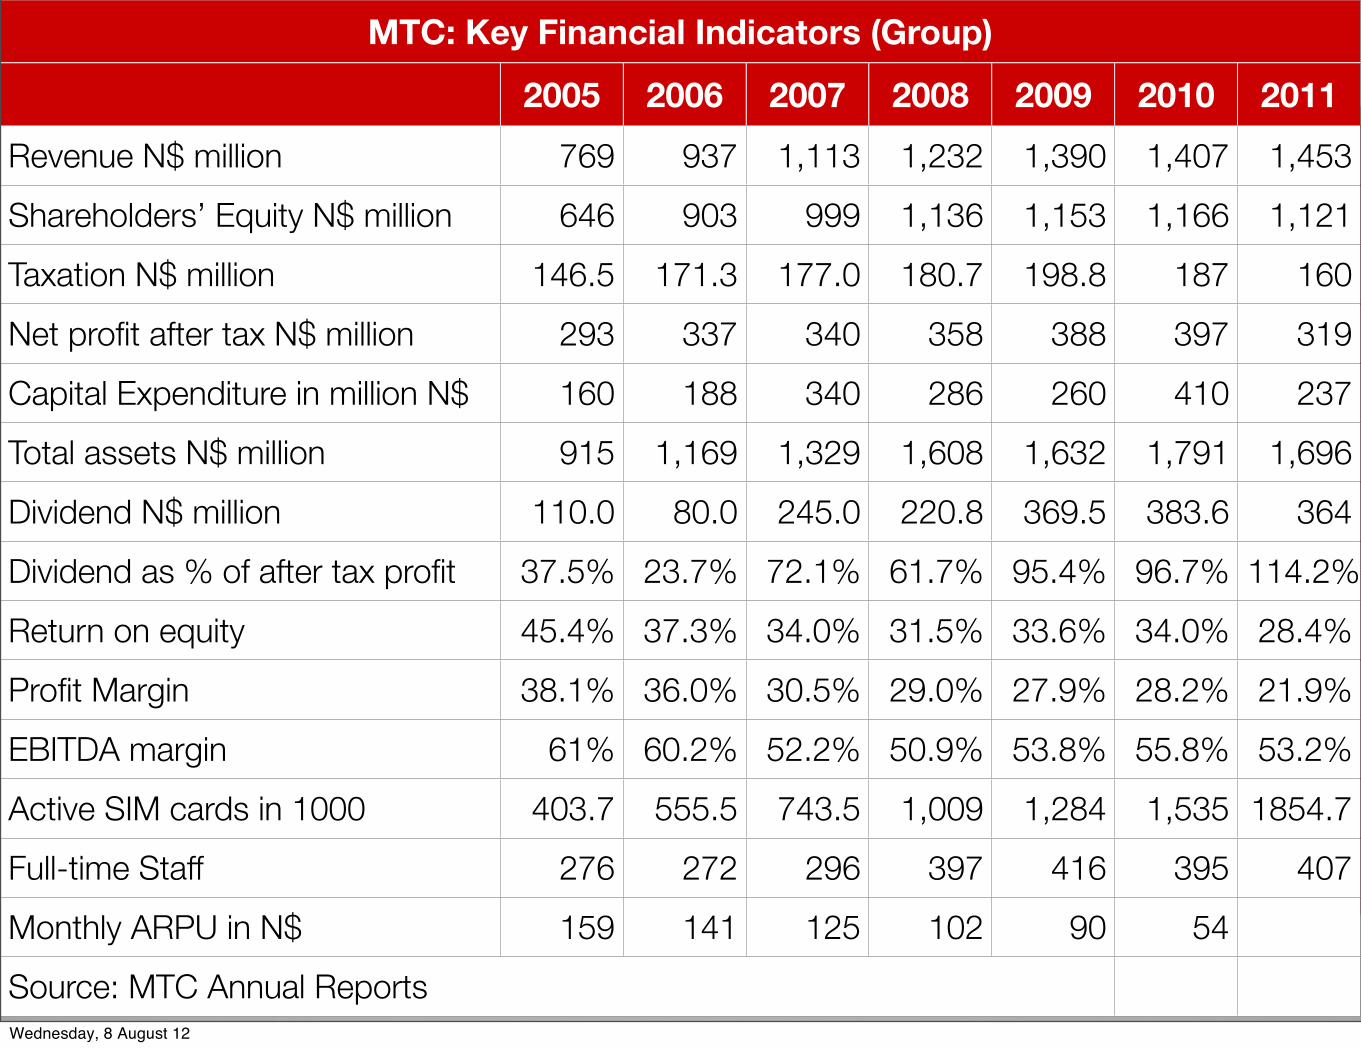
MTC: Key Financial Indicators (Group)MTC: Key Financial Indicators (Group)MTC: Key Financial Indicators (Group)MTC: Key Financial Indicators (Group)MTC: Key Financial Indicators (Group)MTC: Key Financial Indicators (Group)MTC: Key Financial Indicators (Group)MTC: Key Financial Indicators (Group)2005 2006 2007 2008 2009 2010 2011
Revenue N$ million 769 937 1,113 1,232 1,390 1,407 1,453Shareholders’ Equity N$ million 646 903 999 1,136 1,153 1,166 1,121Taxation N$ million 146.5 171.3 177.0 180.7 198.8 187 160Net profit after tax N$ million 293 337 340 358 388 397 319Capital Expenditure in million N$ 160 188 340 286 260 410 237Total assets N$ million 915 1,169 1,329 1,608 1,632 1,791 1,696Dividend N$ million 110.0 80.0 245.0 220.8 369.5 383.6 364Dividend as % of after tax profit 37.5% 23.7% 72.1% 61.7% 95.4% 96.7% 114.2%Return on equity 45.4% 37.3% 34.0% 31.5% 33.6% 34.0% 28.4%Profit Margin 38.1% 36.0% 30.5% 29.0% 27.9% 28.2% 21.9%EBITDA margin 61% 60.2% 52.2% 50.9% 53.8% 55.8% 53.2%Active SIM cards in 1000 403.7 555.5 743.5 1,009 1,284 1,535 1854.7Full-time Staff 276 272 296 397 416 395 407Monthly ARPU in N$ 159 141 125 102 90 54Source: MTC Annual ReportsSource: MTC Annual ReportsSource: MTC Annual ReportsSource: MTC Annual ReportsSource: MTC Annual ReportsSource: MTC Annual ReportsWednesday, 8 August 12
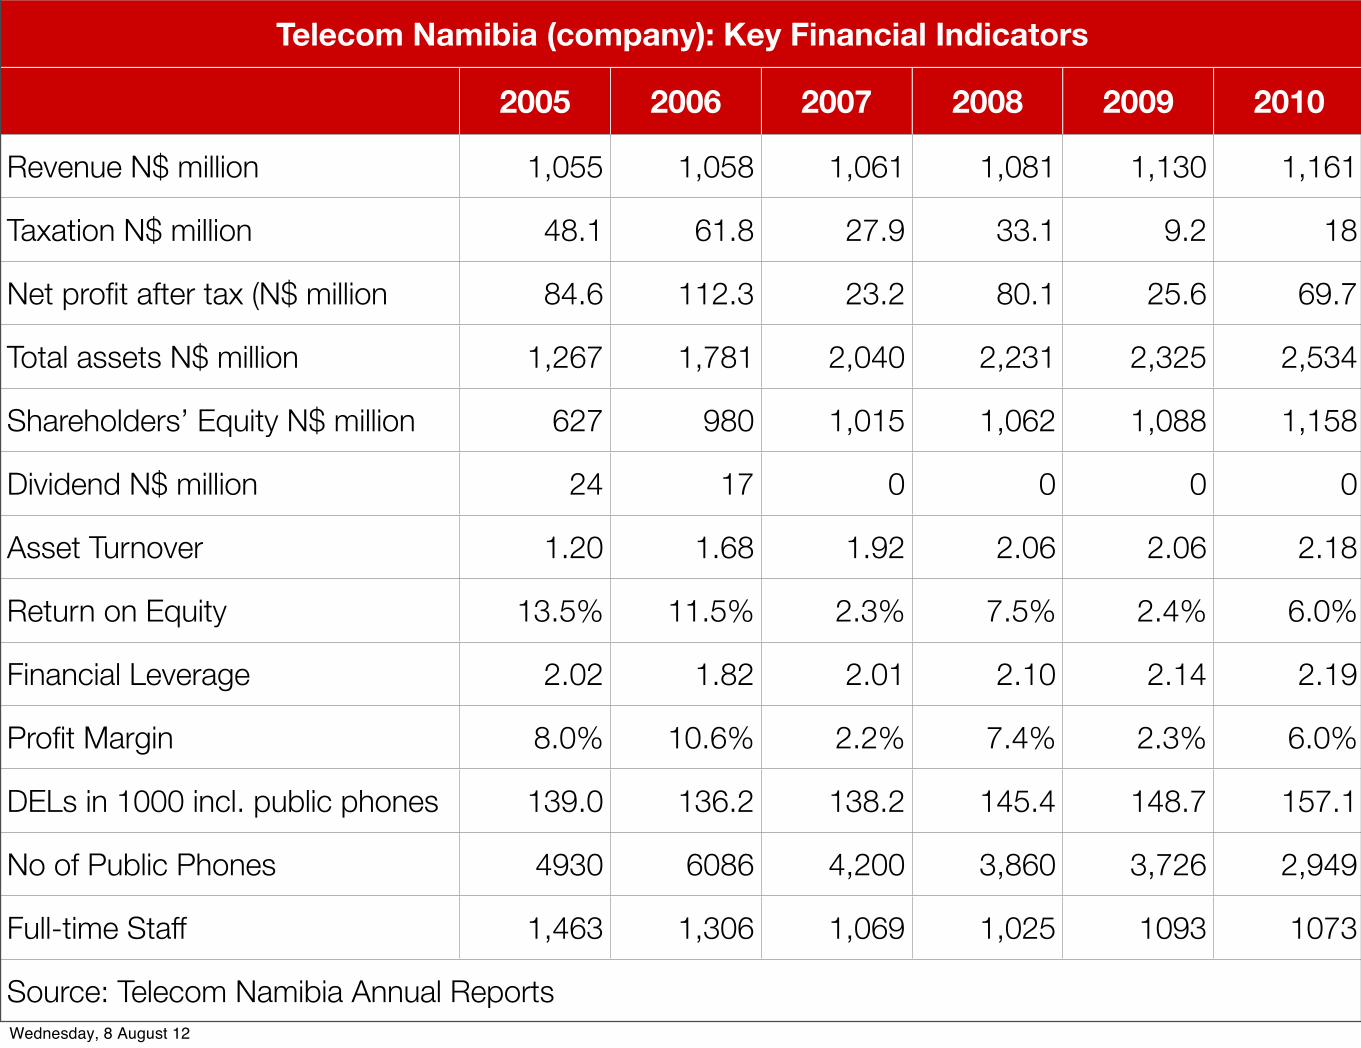
Telecom Namibia (company): Key Financial IndicatorsTelecom Namibia (company): Key Financial IndicatorsTelecom Namibia (company): Key Financial IndicatorsTelecom Namibia (company): Key Financial IndicatorsTelecom Namibia (company): Key Financial IndicatorsTelecom Namibia (company): Key Financial IndicatorsTelecom Namibia (company): Key Financial Indicators
2005 2006 2007 2008 2009 2010
Revenue N$ million 1,055 1,058 1,061 1,081 1,130 1,161
Taxation N$ million 48.1 61.8 27.9 33.1 9.2 18
Net profit after tax (N$ million 84.6 112.3 23.2 80.1 25.6 69.7
Total assets N$ million 1,267 1,781 2,040 2,231 2,325 2,534
Shareholders’ Equity N$ million 627 980 1,015 1,062 1,088 1,158
Dividend N$ million 24 17 0 0 0 0
Asset Turnover 1.20 1.68 1.92 2.06 2.06 2.18
Return on Equity 13.5% 11.5% 2.3% 7.5% 2.4% 6.0%
Financial Leverage 2.02 1.82 2.01 2.10 2.14 2.19
Profit Margin 8.0% 10.6% 2.2% 7.4% 2.3% 6.0%
DELs in 1000 incl. public phones 139.0 136.2 138.2 145.4 148.7 157.1
No of Public Phones 4930 6086 4,200 3,860 3,726 2,949
Full-time Staff 1,463 1,306 1,069 1,025 1093 1073
Source: Telecom Namibia Annual ReportsSource: Telecom Namibia Annual ReportsSource: Telecom Namibia Annual ReportsSource: Telecom Namibia Annual ReportsSource: Telecom Namibia Annual ReportsSource: Telecom Namibia Annual ReportsSource: Telecom Namibia Annual ReportsWednesday, 8 August 12
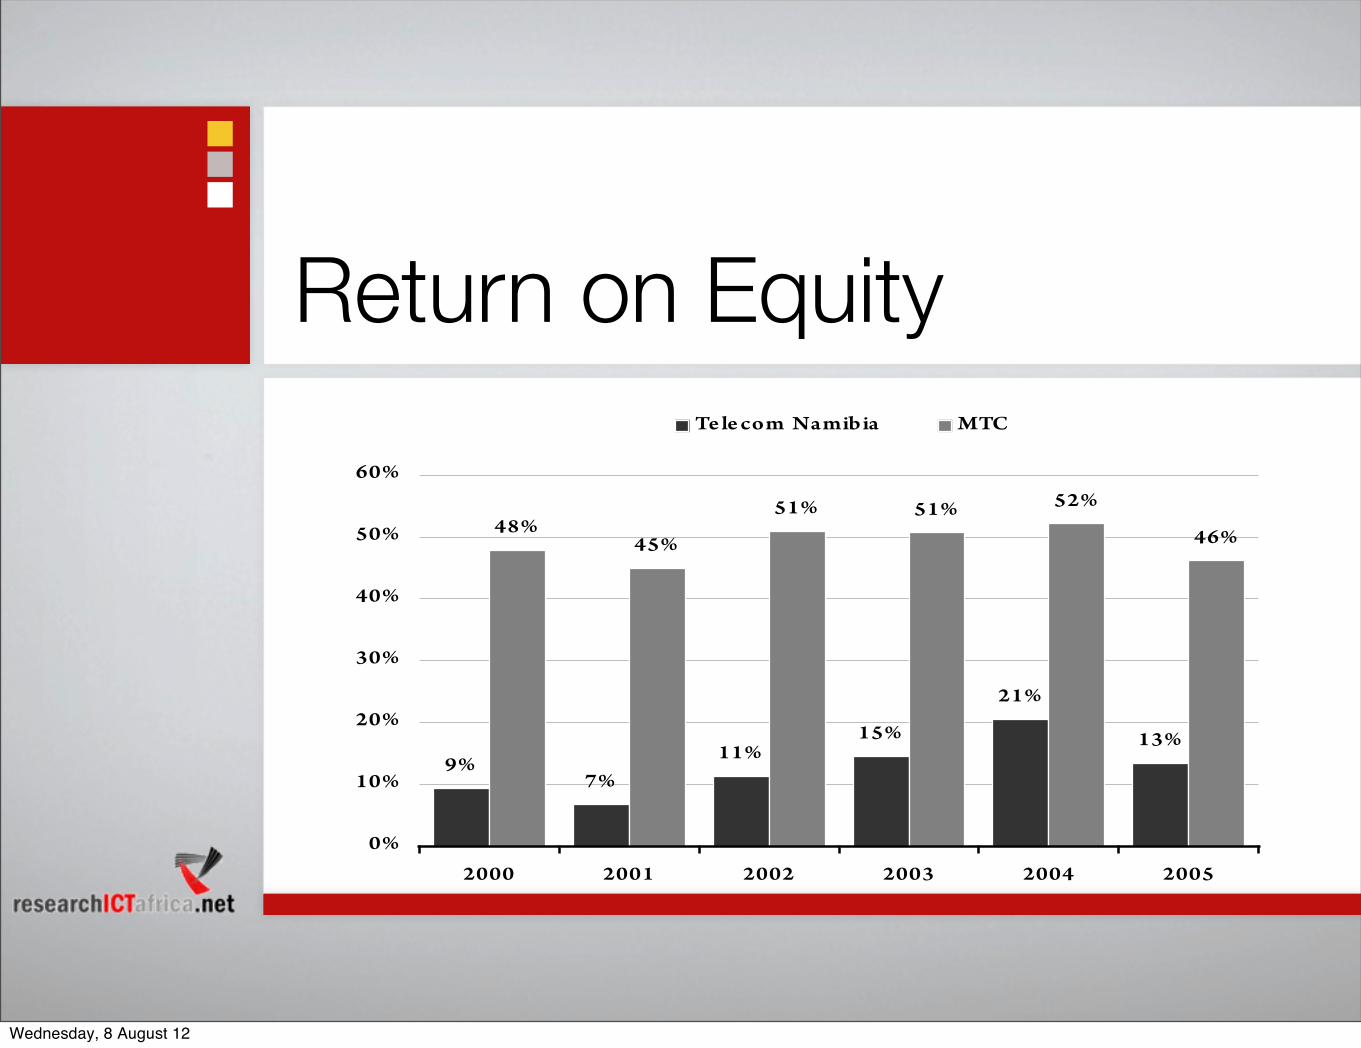
Return on Equity
9%7%
11%15%
21%
13%
48%45%
51% 51% 52%
46%
0%
10%
20%
30%
40%
50%
60%
2000 2001 2002 2003 2004 2005
Te le com Namibia MTC
Wednesday, 8 August 12
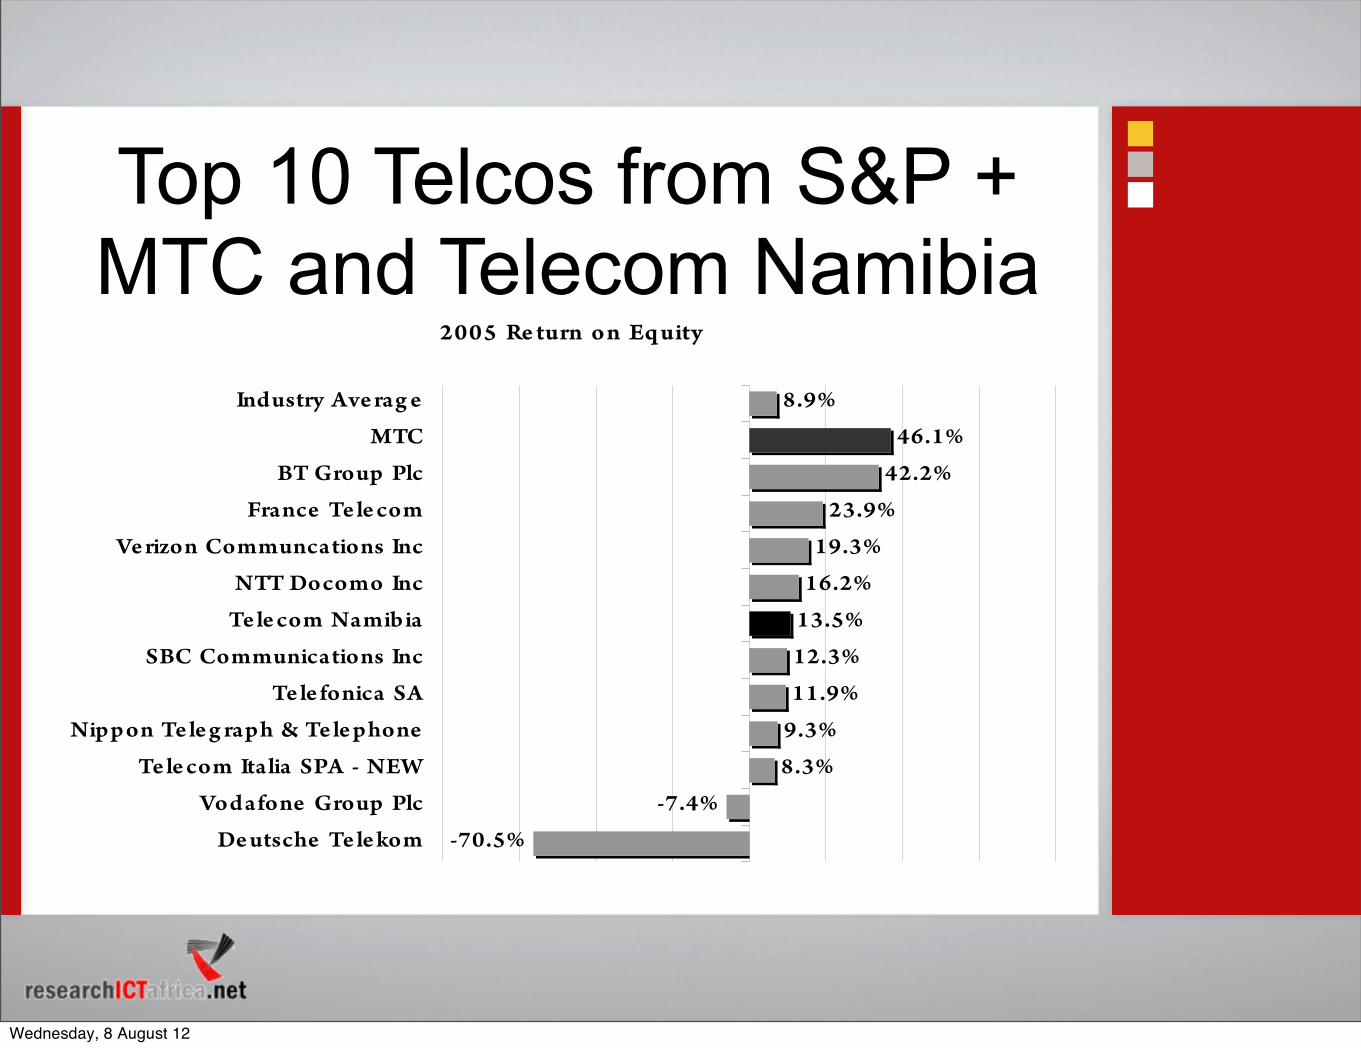
2005 Re turn o n Eq uity
-70.5%
-7.4%
8.3%
9.3%
11.9%
12.3%
13.5%
16.2%
19.3%
23.9%
42.2%
46.1%
8.9%
De utsche Te le kom
Vodafone Group Plc
Te le com Italia SPA - NEW
Nippon Te le g raph & Te le phone
Te le fonica SA
SBC Communications Inc
Te le com Namibia
NTT Docomo Inc
Ve rizon Communcations Inc
France Te le com
BT Group Plc
MTC
Industry Ave rag e
Top 10 Telcos from S&P + MTC and Telecom Namibia
Wednesday, 8 August 12
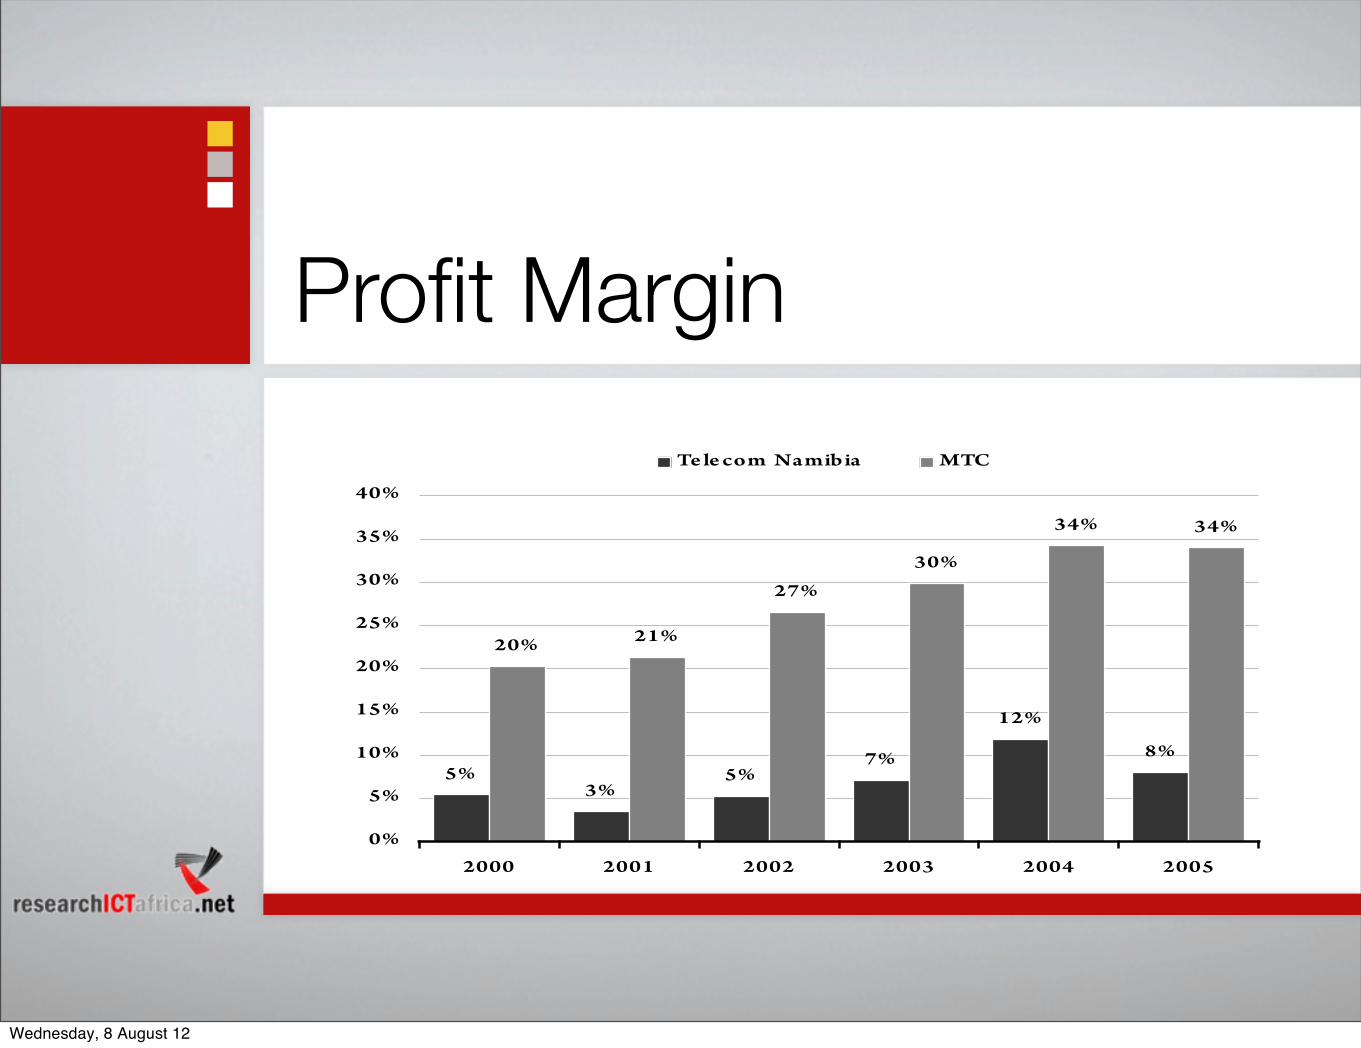
Profit Margin
5%3%
5%7%
12%
8%
20% 21%
27%
30%
34% 34%
0%
5%
10%
15%
20%
25%
30%
35%
40%
2000 2001 2002 2003 2004 2005
Te le com Namibia MTC
Wednesday, 8 August 12
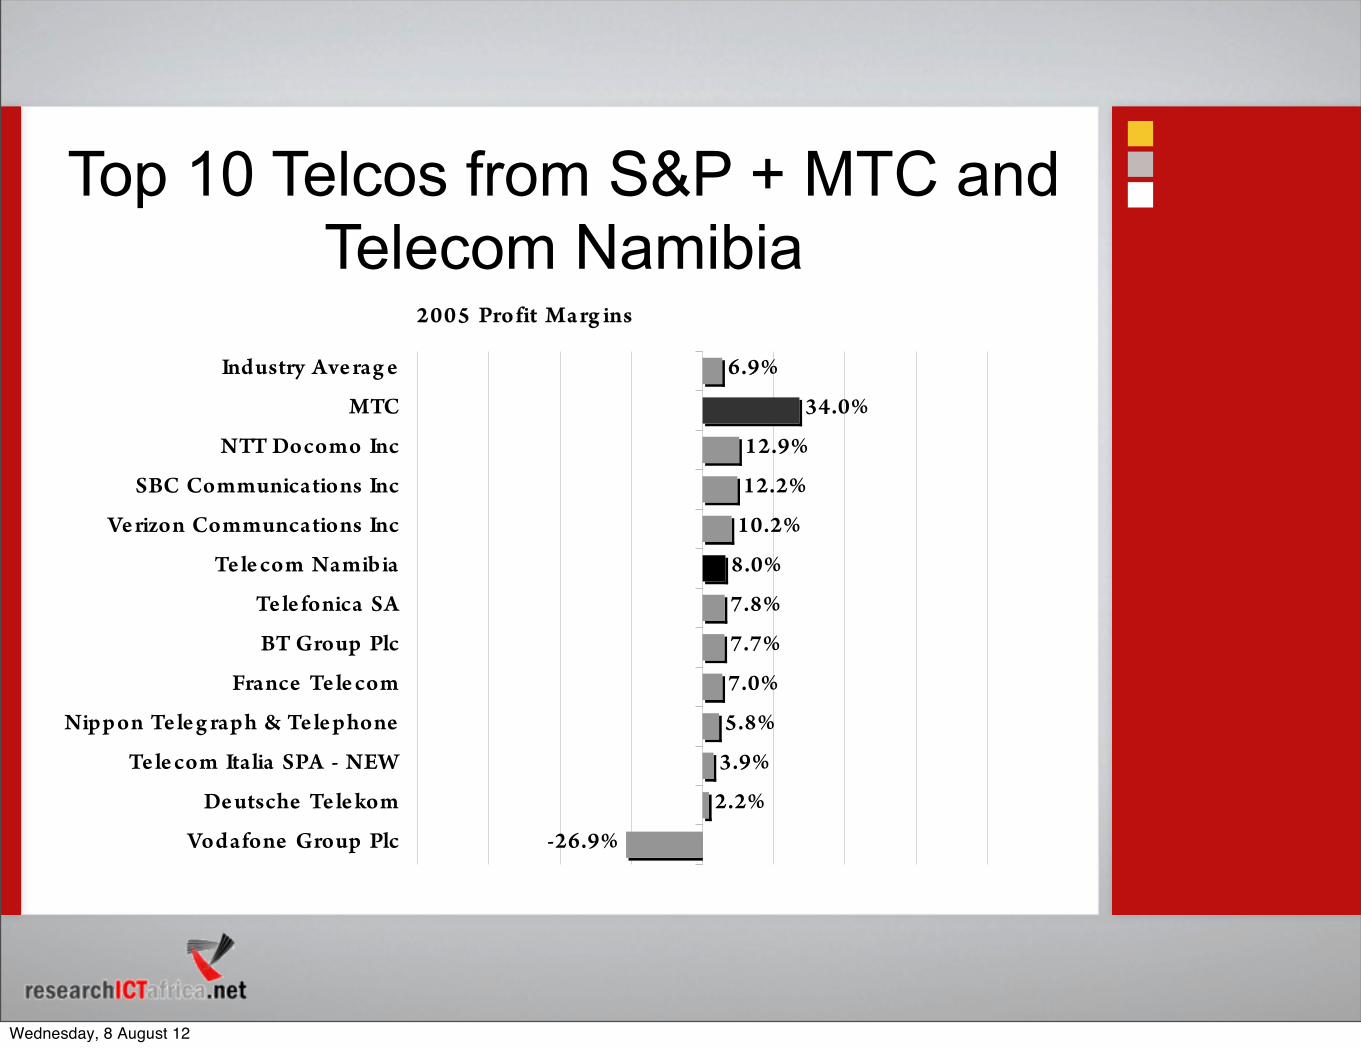
2005 Pro fit Ma rg ins
-26.9%
2.2%
3.9%
5.8%
7.0%
7.7%
7.8%
8.0%
10.2%
12.2%
12.9%
34.0%
6.9%
Vodafone Group Plc
De utsche Te le kom
Te le com Italia SPA - NEW
Nippon Te le g raph & Te le phone
France Te le com
BT Group Plc
Te le fonica SA
Te le com Namibia
Ve rizon Communcations Inc
SBC Communications Inc
NTT Docomo Inc
MTC
Industry Ave rag e
Top 10 Telcos from S&P + MTC and Telecom Namibia
Wednesday, 8 August 12
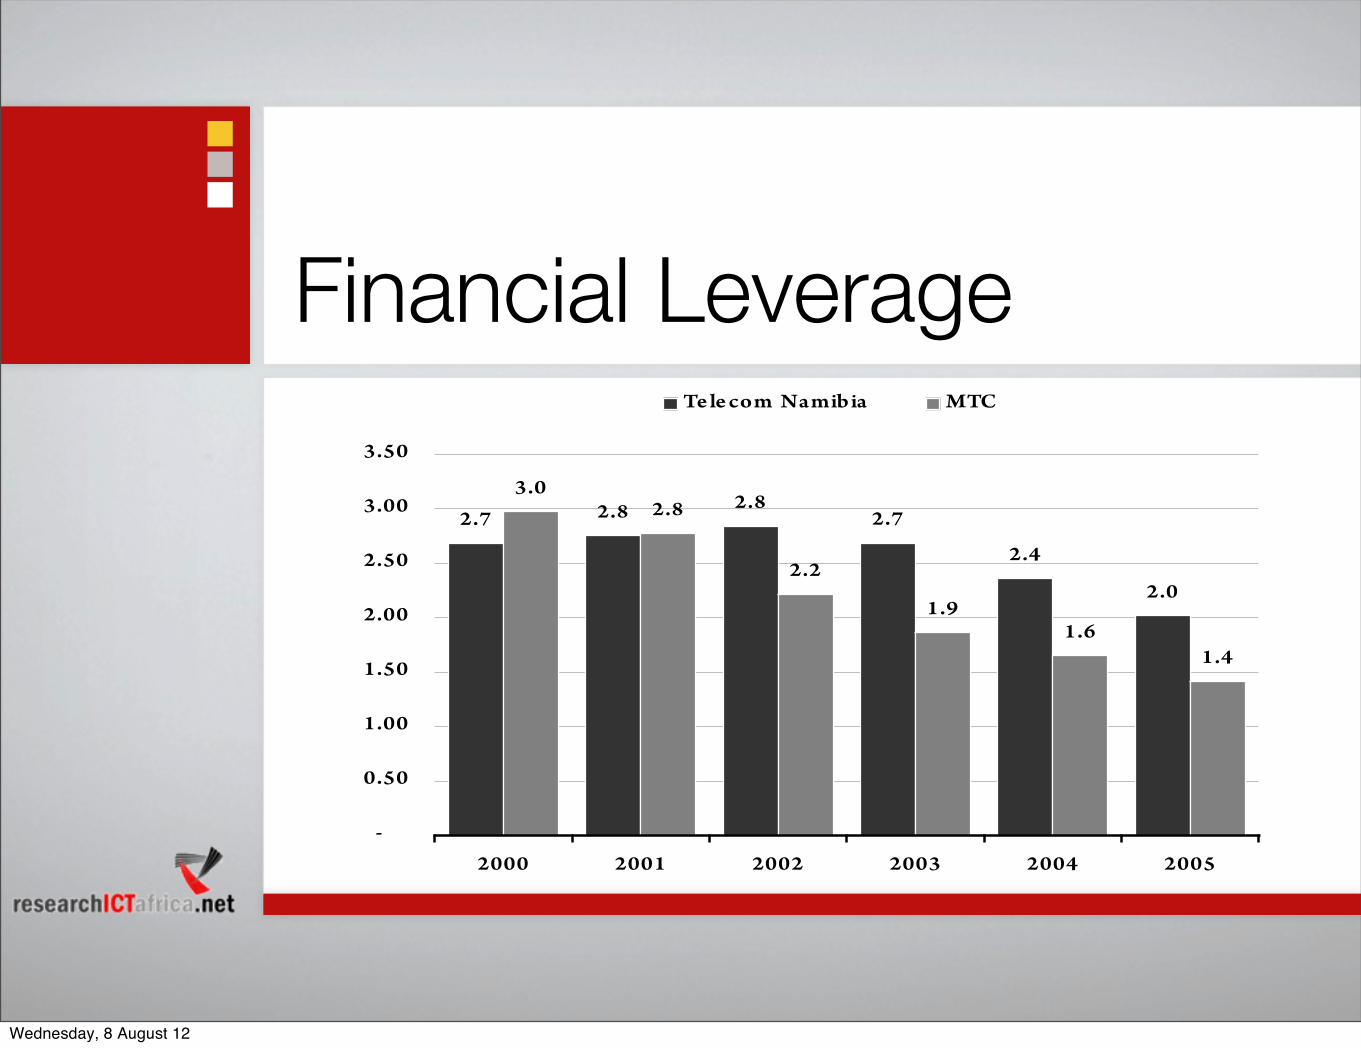
Financial Leverage
2.7 2.8 2.82.7
2.4
2.0
3.02.8
2.2
1.91.6
1.4
-
0.50
1.00
1.50
2.00
2.50
3.00
3.50
2000 2001 2002 2003 2004 2005
Te le com Namibia MTC
Wednesday, 8 August 12
MTC
Wednesday, 8 August 12
9
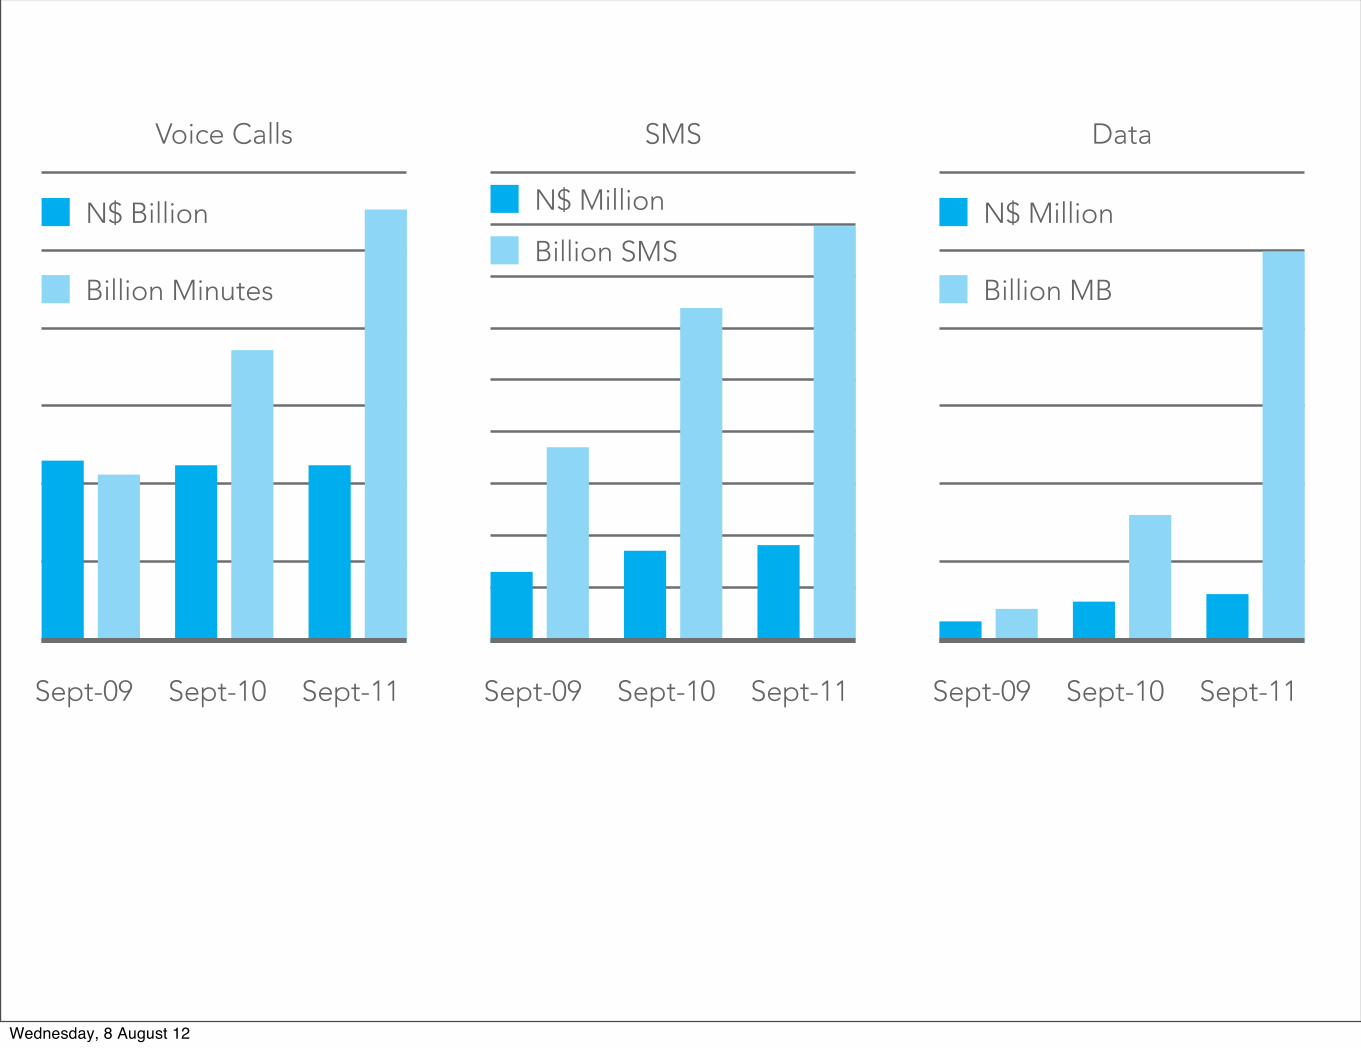
The year 2011, as we predicted in 2010, showed real maturity
in the voice business. Although voice usage still increased
substantially as a result of the drop in price per minutes in a
competitive environment, revenues slightly dropped by 1%.
Penetration in Namibia has now passed 108% consisting
of 1,854,700 active MTC customers (active sim card that
made any communication even that was chargeable in the
past three months) and an additional 435,000 for the other
Mobile Operators.
Despite the mentioned slight decrease in voice call revenues,
SMS and mainly data usage (mobile internet access) grew by
TWO� DIGITS� IN� REVENUES � DUE� TO� THE� SIGNI�CANT� USAGE� OF� BOTH�
services. Message usage increased by 24% during the reviewed
12 months, where the average MTC customer sent more than
400 messages per month. We believe this is the highest-level
usage in Africa resulting from the free SMSs in several post and
prepaid packages. Data usage, result of the strong demand
of Internet access doubled usage during the year ended 30
September of 2011.
Data is gaining more momentum as a result of the investment
in an advanced network and the commercial activities around
our NetMan product that enhanced our focus since June 2010.
Sept-11
109%
Sept-06
28%
Sept-07
39%
Sept-08
59%
Sept-09
76%
Sept-10
93%
Sept-09 Sept-10 Sept-11
Voice Calls
N$ Billion
Billion Minutes
Sept-09 Sept-10 Sept-11
SMS
N$ Million
Billion SMS
Sept-09 Sept-10 Sept-11
Data
N$ Million
Billion MB
Wednesday, 8 August 12
19
The fi nancial year that ended 30 September 2011 has been rewarding for stakeholders. Despite the uncertainties associated with the aftermath of the global fi nancial crisis and regulatory pressure to decrease interconnect rates, MTC achieved acceptable growth on subscriber numbers and revenue. The major contributor to improved performance came from revenue generated by MTC’s pre-paid services.
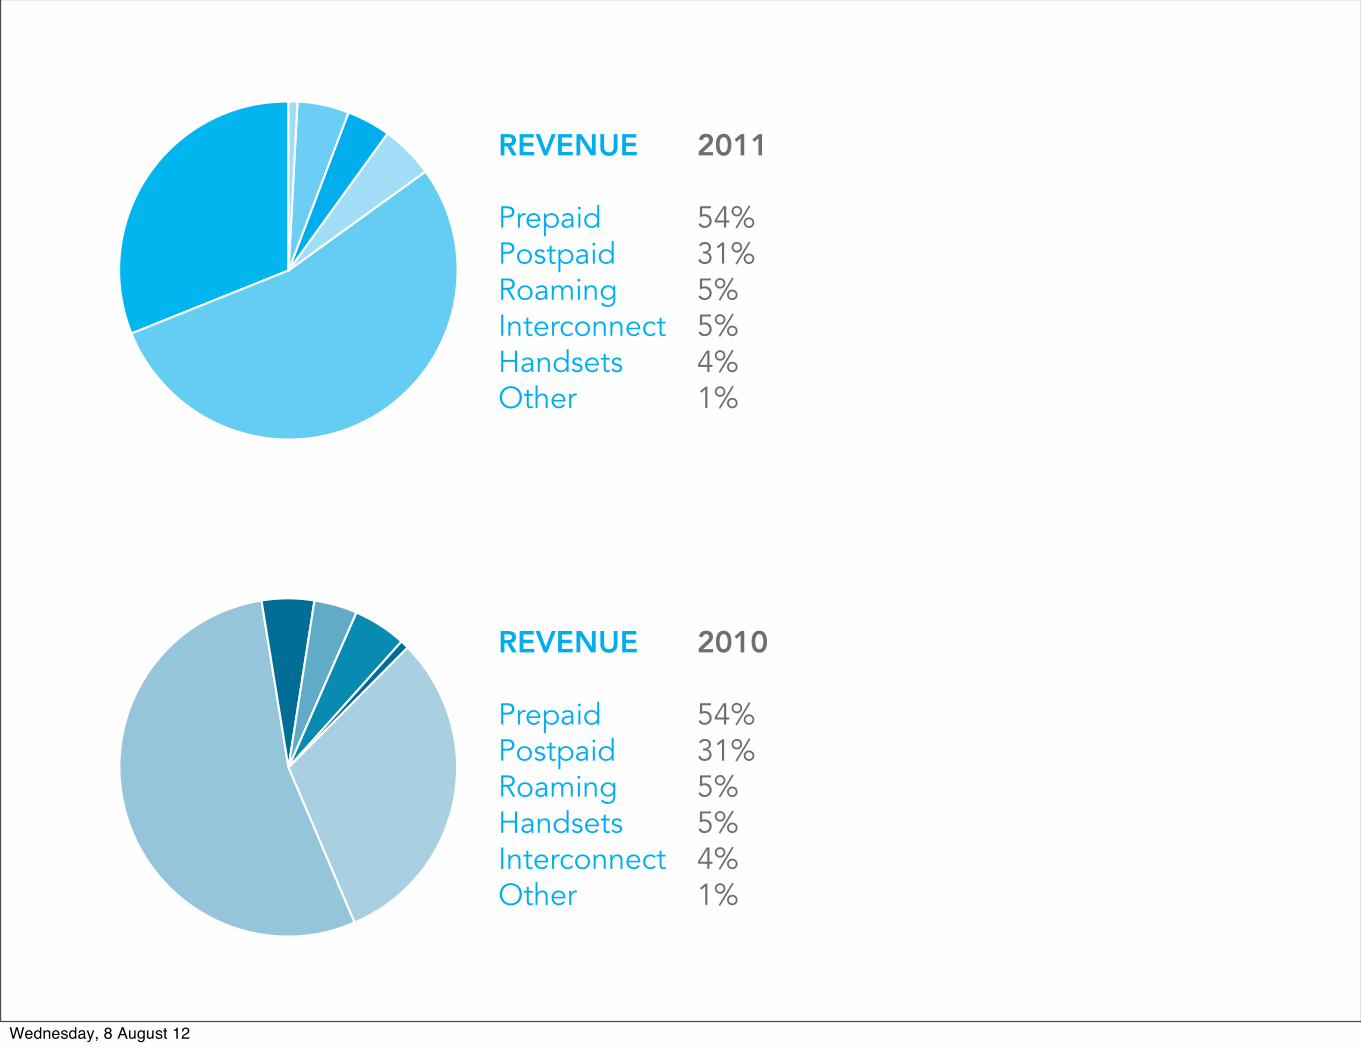
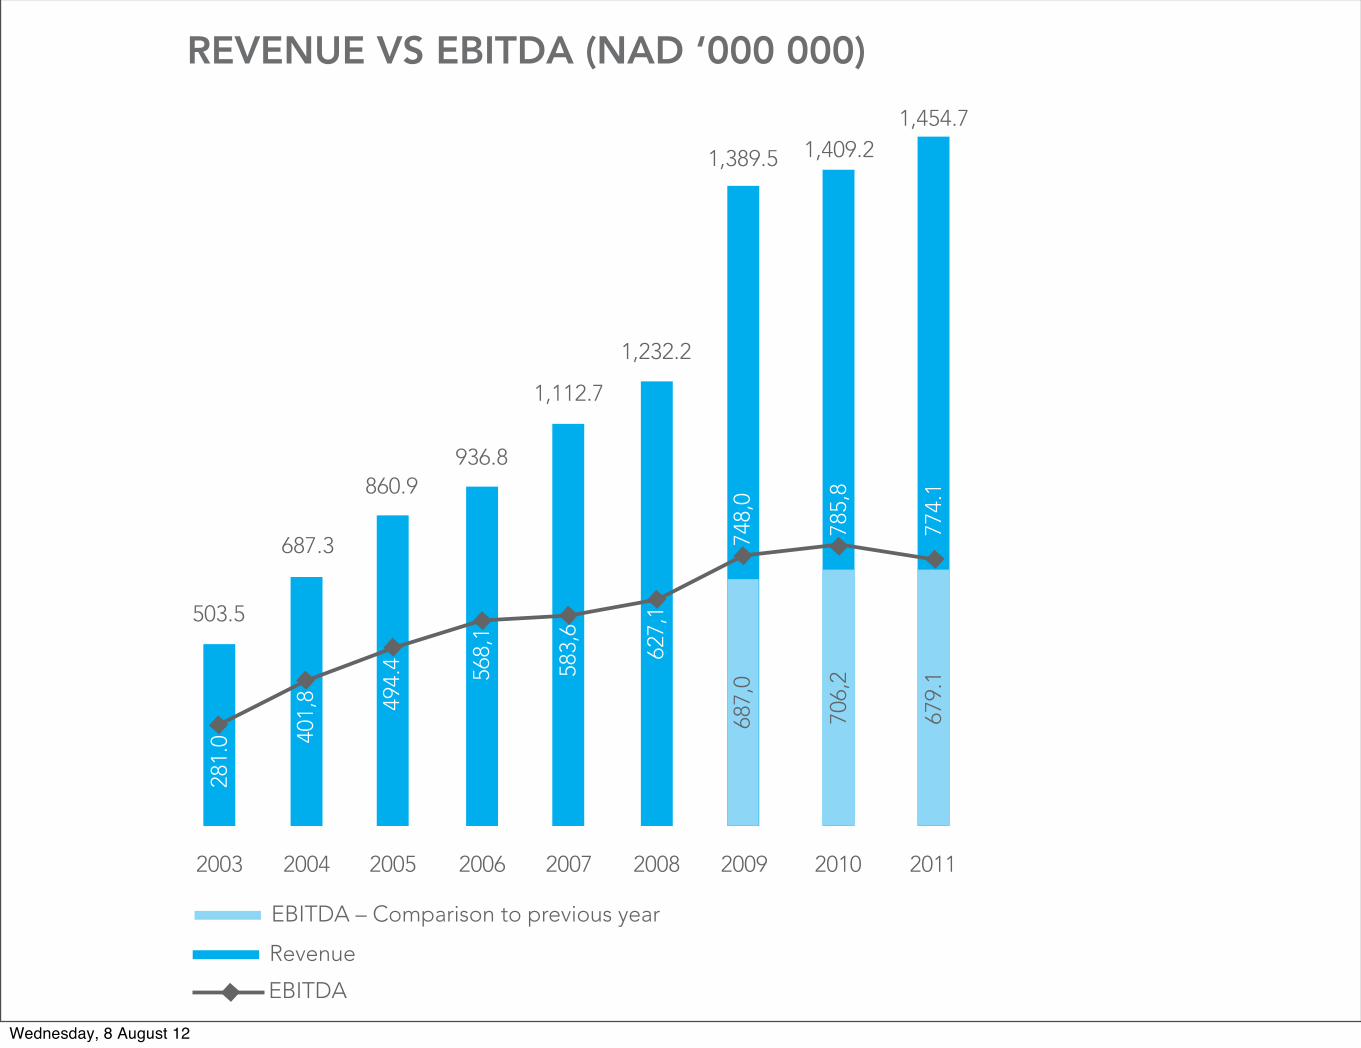
Total Revenue
A revenue growth from N$ 1,409 billion to N$ 1,454.7 billion was accounted, which resulted in a growth of 3,2% year on year. As a result of proper management on the segments of the market the split between the different revenue accounting vote remained the same with the only exception of a 1% move between interconnect income and handset sales. The decrease accounted on interconnect revenue was a direct result of regulatory interference whereby revenue was decreased from N$ 0.50 to N$ 0.30 as from 1 January 2011. As stated under note 3 from the fi nancial statements, handset sales increased by 17% compared to the previous fi nancial year.
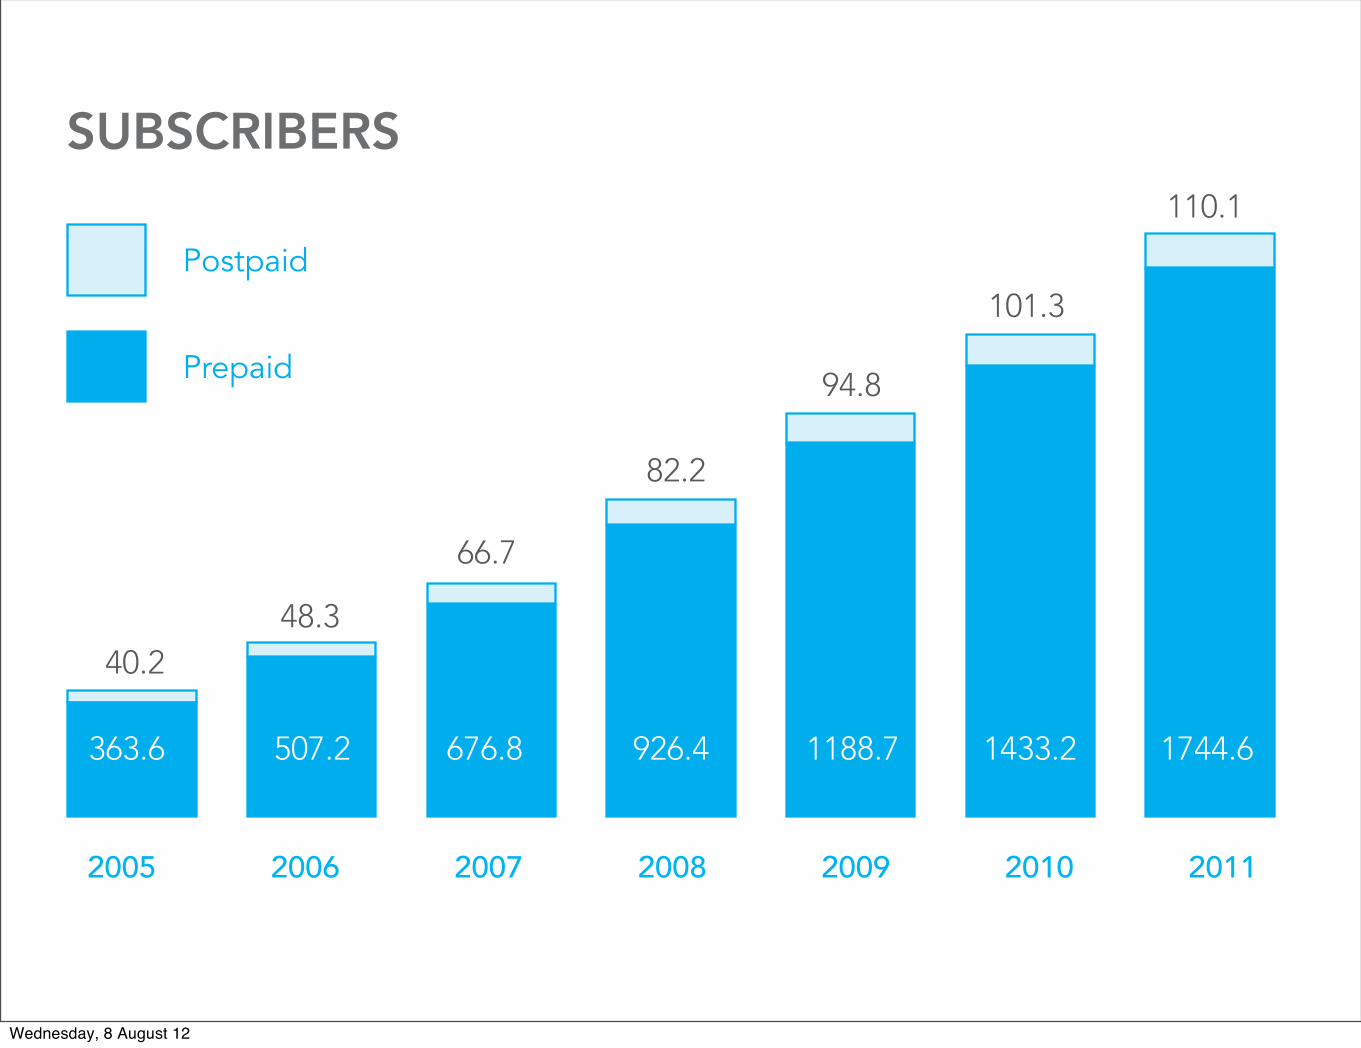
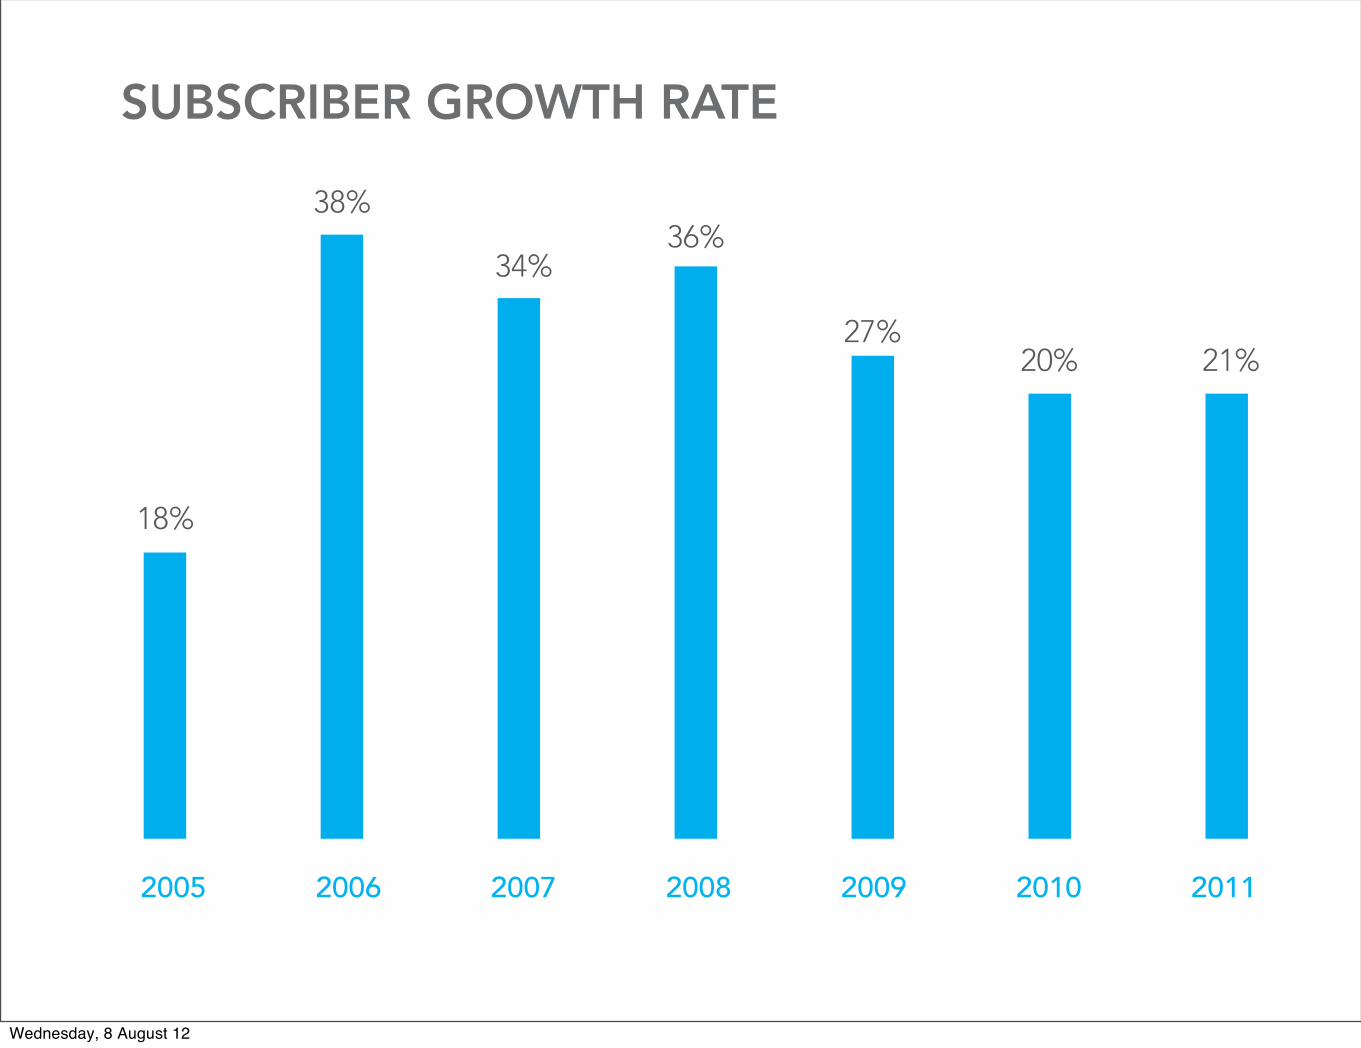
Subscribers
The number of customers increased by 21% to 1,854.7 million. This was largely due to MTC’s strategy of retaining current customers and achieving 60% of the net adds for the industry. The number customers reported at 30 September 2011 were 1,745 million for prepaid and 110,000 for postpaid.
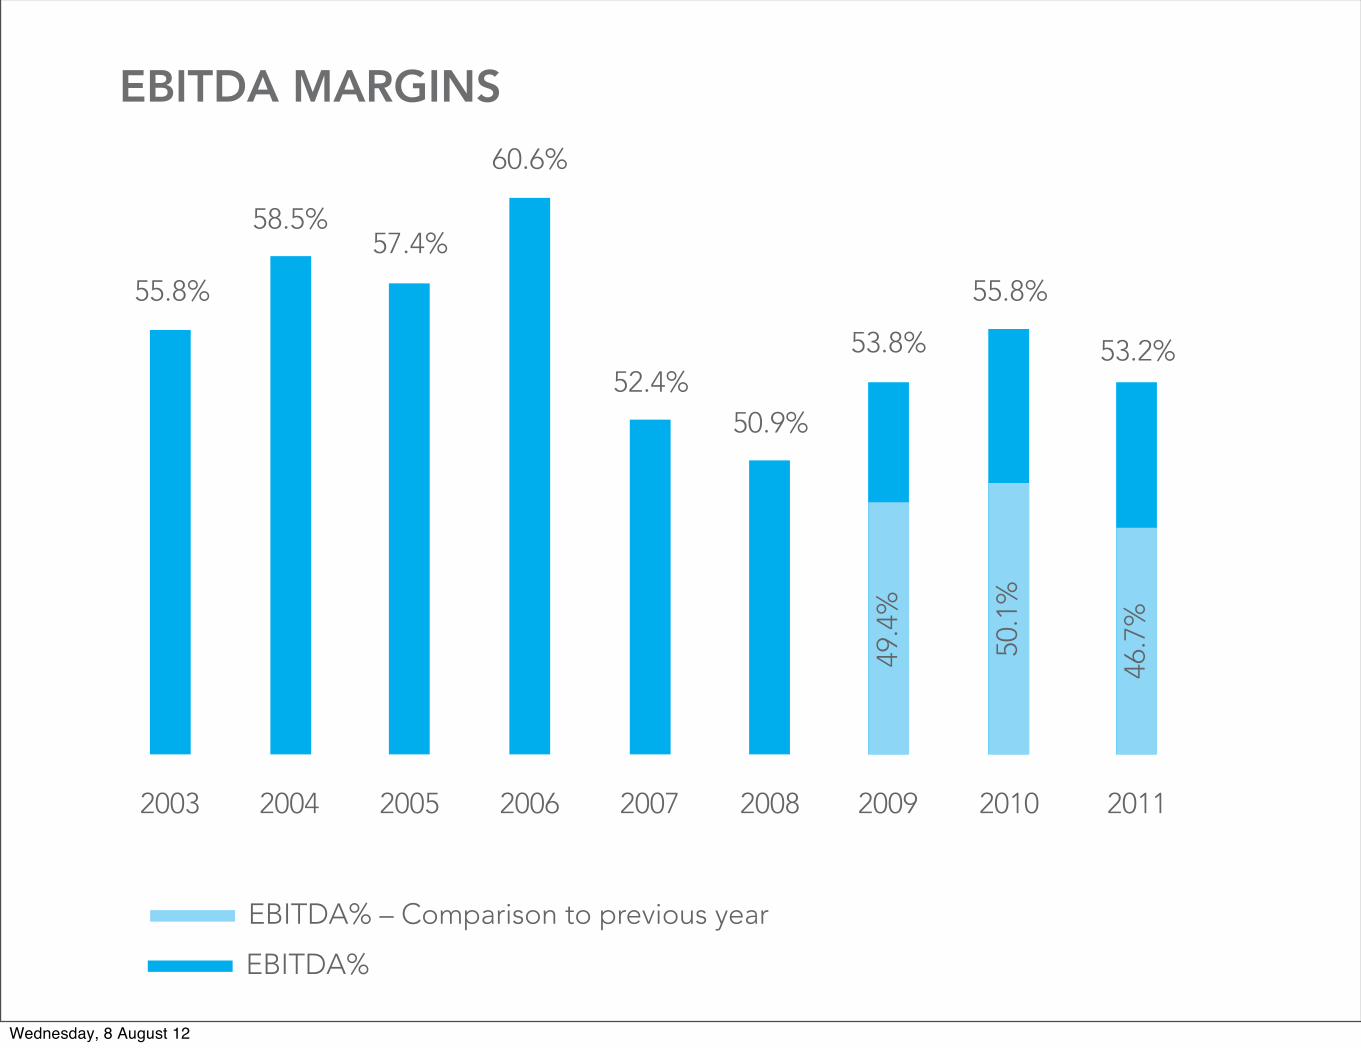
EBITDA (Earnings before interest, taxes, depreciation and amortisation)
MTC’s EBITDA margin decreased from 55,8% to 53,2% for the year under review as a result of numerous factors. An increase in direct cost and direct network operating cost was led by higher rental cost of leased lines and network repair and maintenance
THE FINANCIAL YEARFOR THE PERIOD ENDED 30 SEPTEMBER 2011 UNDER REVIEW
REVENUE 2010
Prepaid 54%Postpaid 31%Roaming 5%
5%Interconnect 4%Other 1%
SUBSCRIBER GROWTH RATE
18%
38%
34%36%
27%20% 21%
SUBSCRIBERS
363.6 507.2 676.8 926.4 1188.7 1433.2 1744.6
40.248.3
66.7
82.2
94.8
101.3
110.1
Postpaid
Prepaid
REVENUE 2011
Prepaid 54%Postpaid 31%Roaming 5%Interconnect 5%
4%Other 1%
Wednesday, 8 August 12
19
The fi nancial year that ended 30 September 2011 has been rewarding for stakeholders. Despite the uncertainties associated with the aftermath of the global fi nancial crisis and regulatory pressure to decrease interconnect rates, MTC achieved acceptable growth on subscriber numbers and revenue. The major contributor to improved performance came from revenue generated by MTC’s pre-paid services.
Total Revenue
A revenue growth from N$ 1,409 billion to N$ 1,454.7 billion was accounted, which resulted in a growth of 3,2% year on year. As a result of proper management on the segments of the market the split between the different revenue accounting vote remained the same with the only exception of a 1% move between interconnect income and handset sales. The decrease accounted on interconnect revenue was a direct result of regulatory interference whereby revenue was decreased from N$ 0.50 to N$ 0.30 as from 1 January 2011. As stated under note 3 from the fi nancial statements, handset sales increased by 17% compared to the previous fi nancial year.
Subscribers
The number of customers increased by 21% to 1,854.7 million. This was largely due to MTC’s strategy of retaining current customers and achieving 60% of the net adds for the industry. The number customers reported at 30 September 2011 were 1,745 million for prepaid and 110,000 for postpaid.
EBITDA (Earnings before interest, taxes, depreciation and amortisation)
MTC’s EBITDA margin decreased from 55,8% to 53,2% for the year under review as a result of numerous factors. An increase in direct cost and direct network operating cost was led by higher rental cost of leased lines and network repair and maintenance
THE FINANCIAL YEARFOR THE PERIOD ENDED 30 SEPTEMBER 2011 UNDER REVIEW
REVENUE 2010
Prepaid 54%Postpaid 31%Roaming 5%
5%Interconnect 4%Other 1%
SUBSCRIBER GROWTH RATE
18%
38%
34%36%
27%20% 21%
SUBSCRIBERS
363.6 507.2 676.8 926.4 1188.7 1433.2 1744.6
40.248.3
66.7
82.2
94.8
101.3
110.1
Postpaid
Prepaid
REVENUE 2011
Prepaid 54%Postpaid 31%Roaming 5%Interconnect 5%
4%Other 1%
Wednesday, 8 August 12
20
costs to support the network expansion, as well as the increase in traffic volumes. The cost of leased lines increased by 24,8% and the repair and maintenance of the network by 32,7%. The unfavourable foreign exchange movement for the Namibia Dollar impacted EBITDA negatively as well. MTC reported an EBITDA of 53,2% after the capitalisation of the free handsets offered on the contract connect packages compared to the 55,8% of the previous financial year. An amount of N$ 95 million was capitalised.
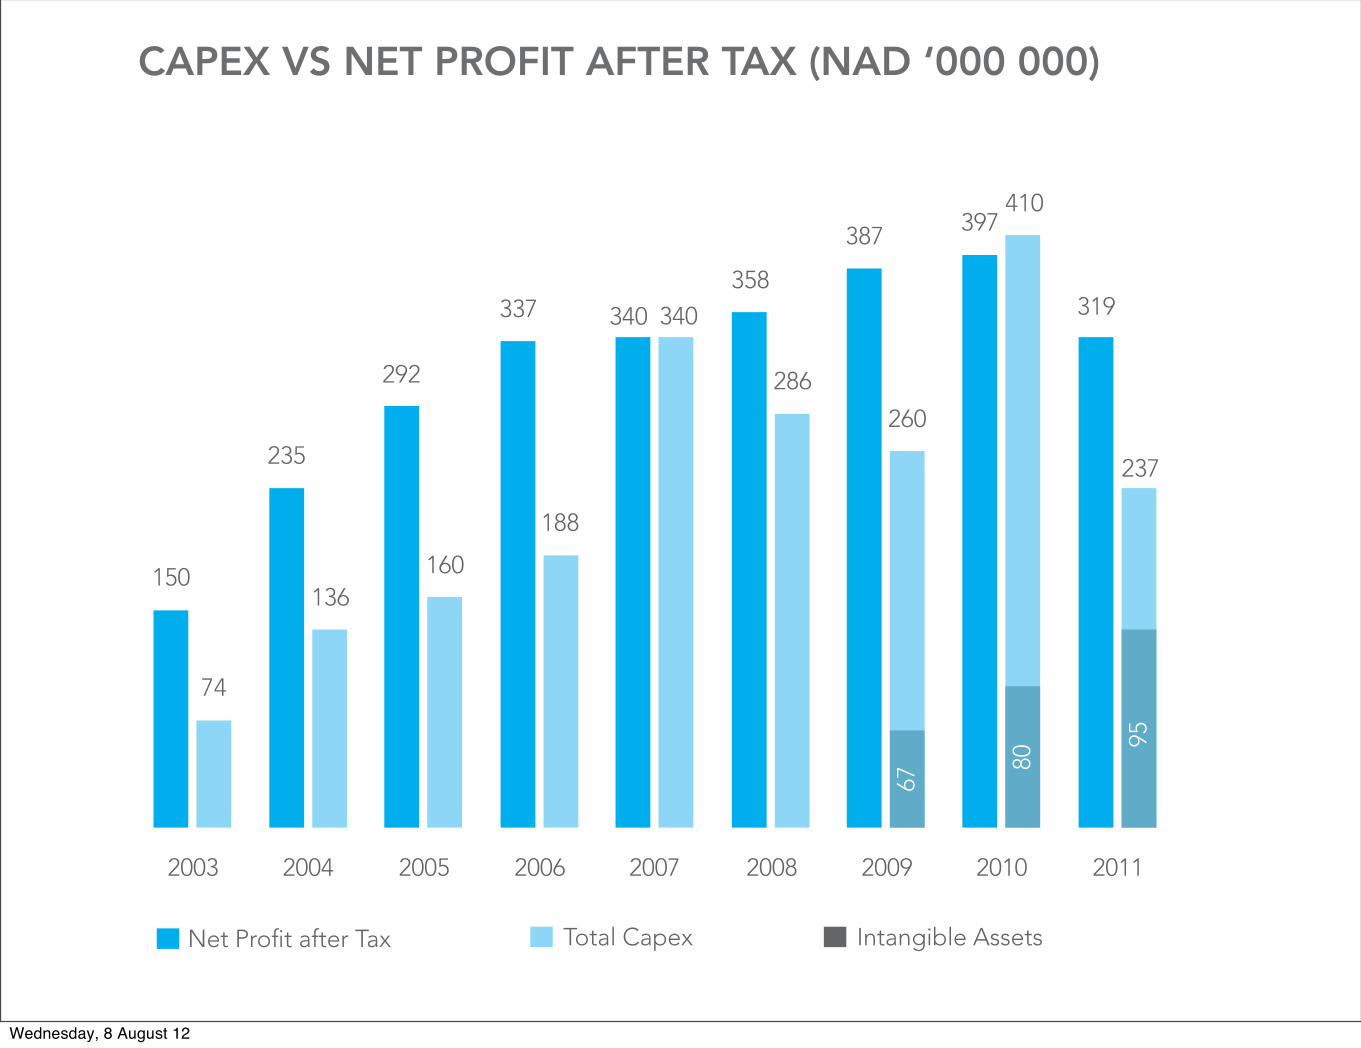
Capital Investments
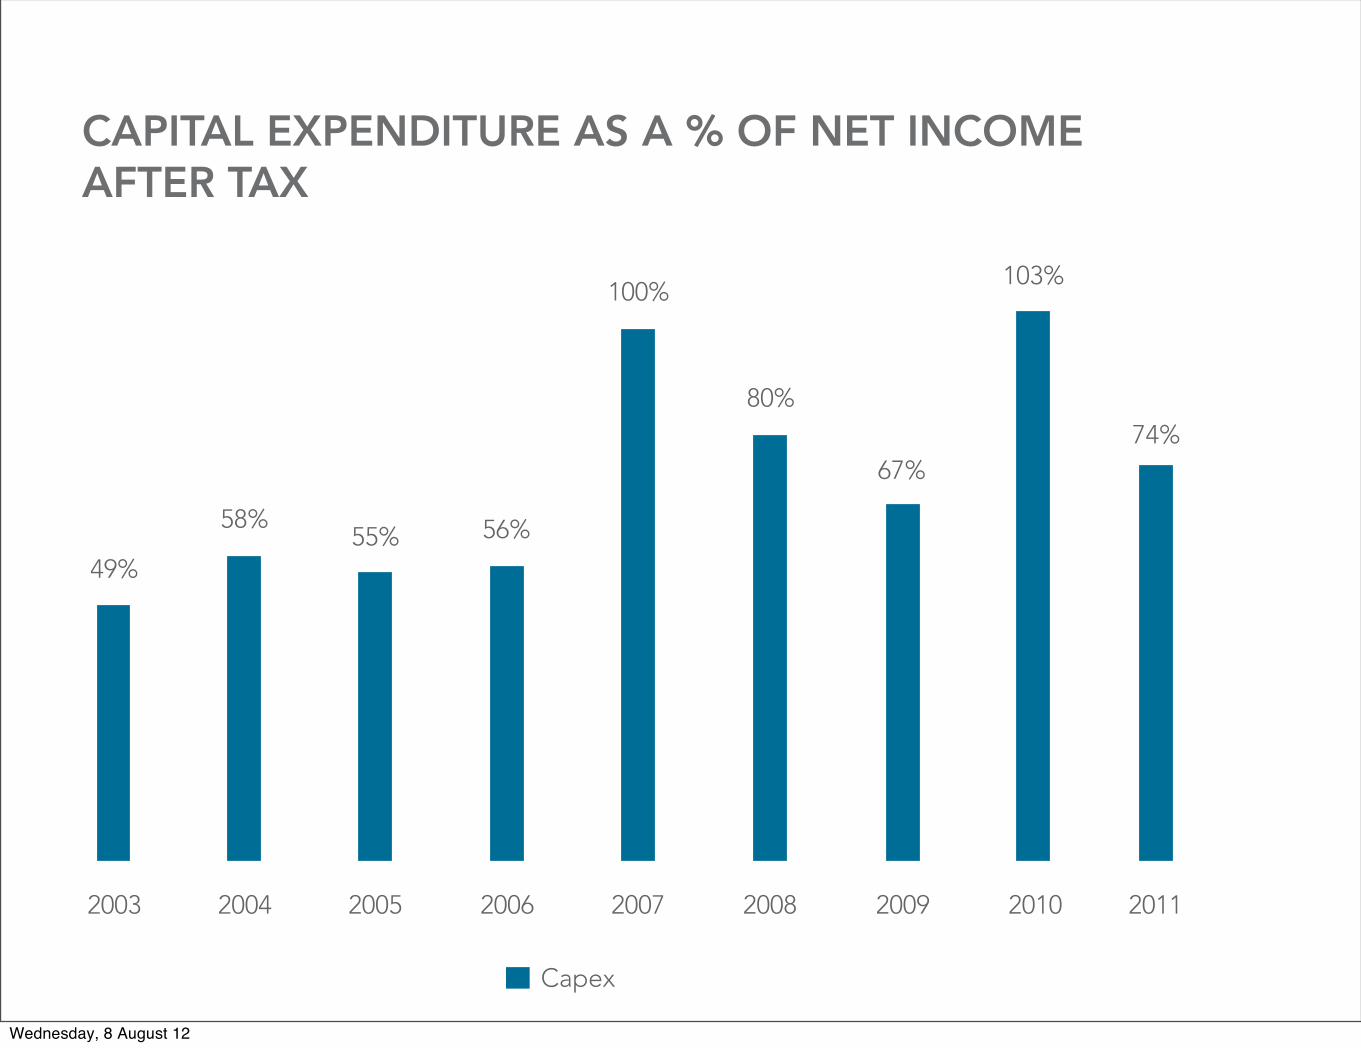
Capital expenditure slowed down compared to the previous financial year, but still encompassed a substantial amount of net income after tax. The amount invested for the financial year under review amounted N$ 236,6 million, and 74% of profit after tax. All capital expenditure was incurred at the ruling exchange rate on the transaction date.
A major portion of the capital investment was made on technical aspects to ensure capacity at the demand of customers as well as providing excellent service to customers. All capital projects were funded from own resources, resulting from MTC’s positive cash flow position.
2005 2006 2007 2008 200920042003 2010 2011
55.8%
58.5%57.4%
60.6%
52.4%50.9%
53.8%
55.8%
53.2%
49.4
%
50.1
%
46.7
%
EBITDA%
EBITDA% – Comparison to previous year
EBITDA MARGINS
REVENUE VS EBITDA (NAD ‘000 000)
2005 2006 2007 2008 2009
Revenue
2004
EBITDA
401,
8 494.
4 568,
1
583,
6
627,
1
687.3
860.9936.8
1,112.7
1,232.2
748,
0
1,389.5
2003
281.
0
503.5
EBITDA – Comparison to previous year
687,
0
2010 201170
6,2
679.
1
785,
8
774.
1
1,409.21,454.7
CAPEX VS NET PROFIT AFTER TAX (NAD ‘000 000)
150
.ET�0ROÚT�AFTER�4AX 4OTAL�#APEX Intangible Assets
2005 2006 2007 2008 200920042003 2010 2011
74
235
136160
292
337
188
340 340358
286
387
260
397
319
410
237
80
95
67
CAPITAL EXPENDITURE AS A % OF NET INCOME AFTER TAX
2005 2006 2007 2008 20112009 2010
55% 56%
100%
80%74%
67%
103%
#APEX
20042003
58%
49%
Wednesday, 8 August 12
20
costs to support the network expansion, as well as the increase in traffic volumes. The cost of leased lines increased by 24,8% and the repair and maintenance of the network by 32,7%. The unfavourable foreign exchange movement for the Namibia Dollar impacted EBITDA negatively as well. MTC reported an EBITDA of 53,2% after the capitalisation of the free handsets offered on the contract connect packages compared to the 55,8% of the previous financial year. An amount of N$ 95 million was capitalised.
Capital Investments
Capital expenditure slowed down compared to the previous financial year, but still encompassed a substantial amount of net income after tax. The amount invested for the financial year under review amounted N$ 236,6 million, and 74% of profit after tax. All capital expenditure was incurred at the ruling exchange rate on the transaction date.
A major portion of the capital investment was made on technical aspects to ensure capacity at the demand of customers as well as providing excellent service to customers. All capital projects were funded from own resources, resulting from MTC’s positive cash flow position.
2005 2006 2007 2008 200920042003 2010 2011
55.8%
58.5%57.4%
60.6%
52.4%50.9%
53.8%
55.8%
53.2%
49.4
%
50.1
%
46.7
%
EBITDA%
EBITDA% – Comparison to previous year
EBITDA MARGINS
REVENUE VS EBITDA (NAD ‘000 000)
2005 2006 2007 2008 2009
Revenue
2004
EBITDA
401,
8 494.
4 568,
1
583,
6
627,
1
687.3
860.9936.8
1,112.7
1,232.2
748,
0
1,389.5
2003
281.
0
503.5
EBITDA – Comparison to previous year
687,
0
2010 2011
706,
2
679.
1
785,
8
774.
1
1,409.21,454.7
CAPEX VS NET PROFIT AFTER TAX (NAD ‘000 000)
150
.ET�0ROÚT�AFTER�4AX 4OTAL�#APEX Intangible Assets
2005 2006 2007 2008 200920042003 2010 2011
74
235
136160
292
337
188
340 340358
286
387
260
397
319
410
237
80
95
67
CAPITAL EXPENDITURE AS A % OF NET INCOME AFTER TAX
2005 2006 2007 2008 20112009 2010
55% 56%
100%
80%74%
67%
103%
#APEX
20042003
58%
49%
Wednesday, 8 August 12
21
Depreciation and Amortization
MTC’s depreciation increased by N$ 84 million to N$ 303 million for the financial year ended 30 September 2011. This was due to the high capital investment made during the last few years.
Accounting environment
The financial statements are compliant with International Financial Reporting Standards.
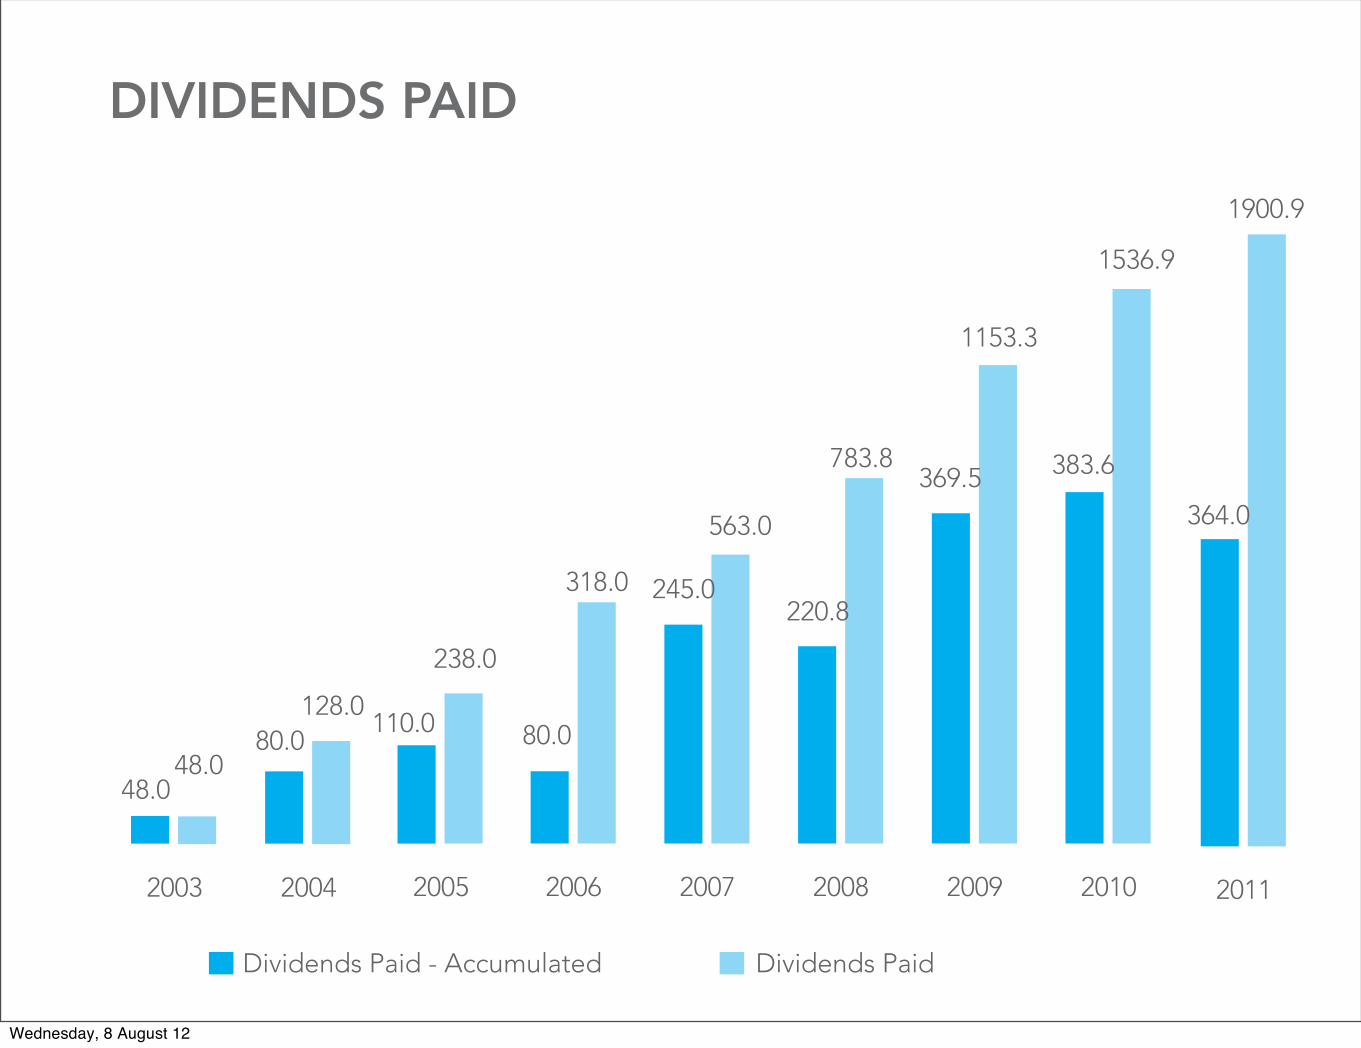
DIVIDENDS PAID
2007 2008 200920062005 2010 2011
80.0
Dividends Paid - Accumulated Dividends Paid
110.0
238.0
318.0 245.0
563.0
220.8
783.8369.5
1153.3
1536.9
1900.9
383.6
364.0
2004
80.0128.0
2003
48.048.0
Dividends paid for the year under review decreased by N$ 19.6 million or 5.1% mainly as a result of the decreased profit after tax. The payment of dividends as declared by the board was 100% of profit after tax as the previous financial year.
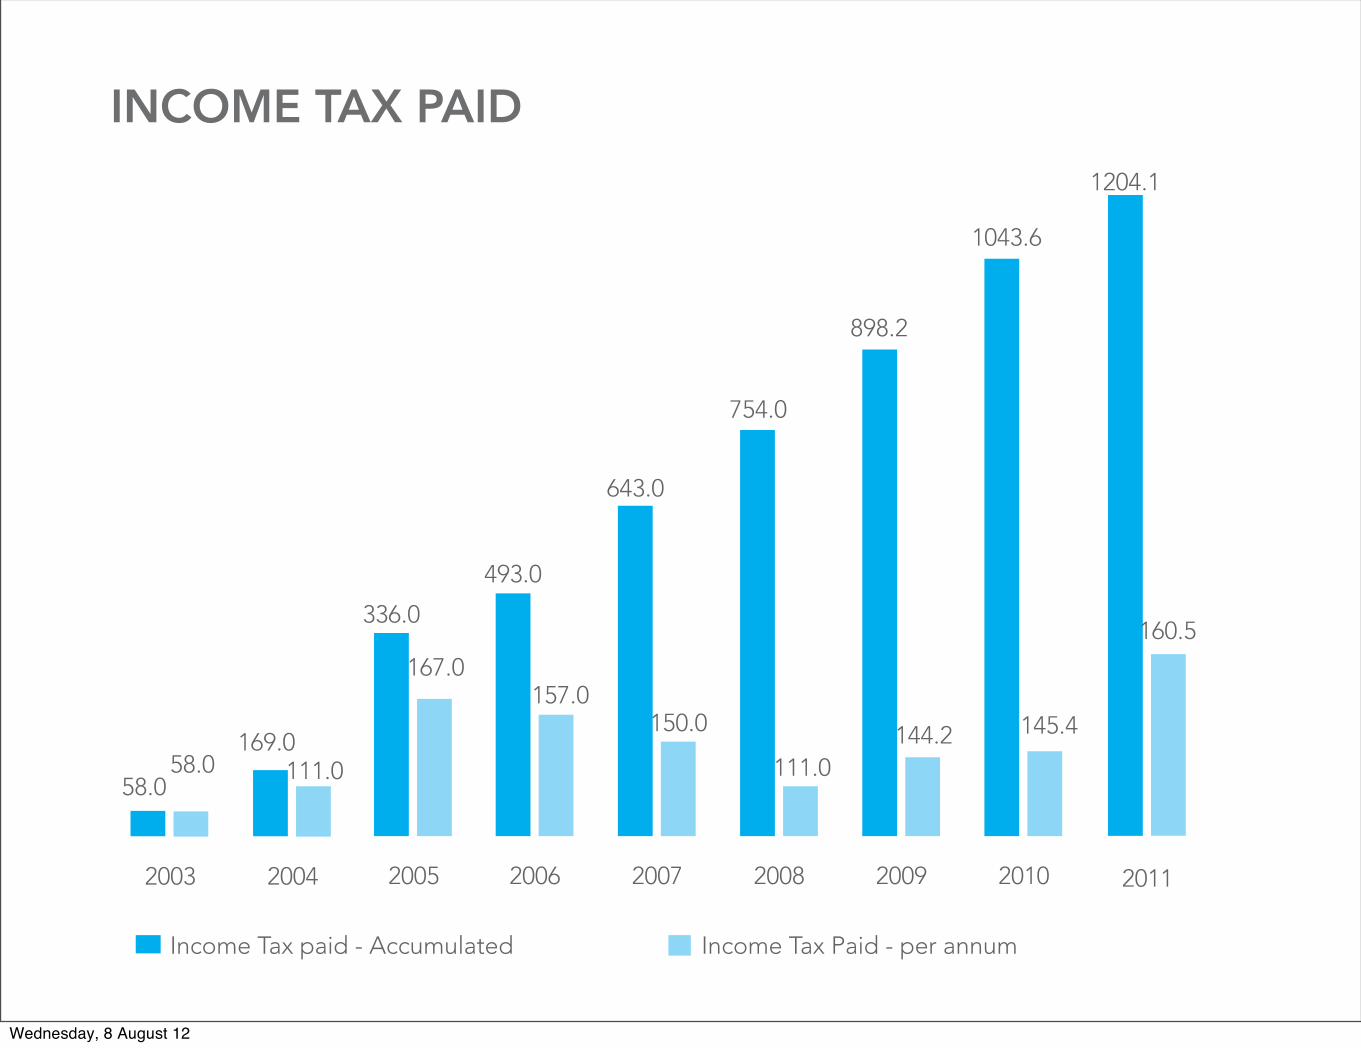
INCOME TAX PAID
2007 2008 200920062005 2010 2011
493.0
)NCOME�4AX�PAID� �!CCUMULATED )NCOME�4AX�0AID� �PER�ANNUM
336.0
167.0157.0
643.0
150.0
754.0
111.0
898.2
144.2 145.4
160.5
1043.6
1204.1
2004
169.0111.0
2003
58.058.0
Company income tax paid for the financial year ended increased from N$ 145,4 million to N$ 160,50 million mainly as a result of the wear and tear allowance as per Tax legislation of Namibia.
Wednesday, 8 August 12

21
Depreciation and Amortization
MTC’s depreciation increased by N$ 84 million to N$ 303 million for the financial year ended 30 September 2011. This was due to the high capital investment made during the last few years.
Accounting environment
The financial statements are compliant with International Financial Reporting Standards.
DIVIDENDS PAID
2007 2008 200920062005 2010 2011
80.0
Dividends Paid - Accumulated Dividends Paid
110.0
238.0
318.0 245.0
563.0
220.8
783.8369.5
1153.3
1536.9
1900.9
383.6
364.0
2004
80.0128.0
2003
48.048.0
Dividends paid for the year under review decreased by N$ 19.6 million or 5.1% mainly as a result of the decreased profit after tax. The payment of dividends as declared by the board was 100% of profit after tax as the previous financial year.
INCOME TAX PAID
2007 2008 200920062005 2010 2011
493.0
)NCOME�4AX�PAID� �!CCUMULATED )NCOME�4AX�0AID� �PER�ANNUM
336.0
167.0157.0
643.0
150.0
754.0
111.0
898.2
144.2 145.4
160.5
1043.6
1204.1
2004
169.0111.0
2003
58.058.0
Company income tax paid for the financial year ended increased from N$ 145,4 million to N$ 160,50 million mainly as a result of the wear and tear allowance as per Tax legislation of Namibia.
Wednesday, 8 August 12
6
Notes 2011 2010 2011 2010 N$’000 N$’000 N$’000 N$’000
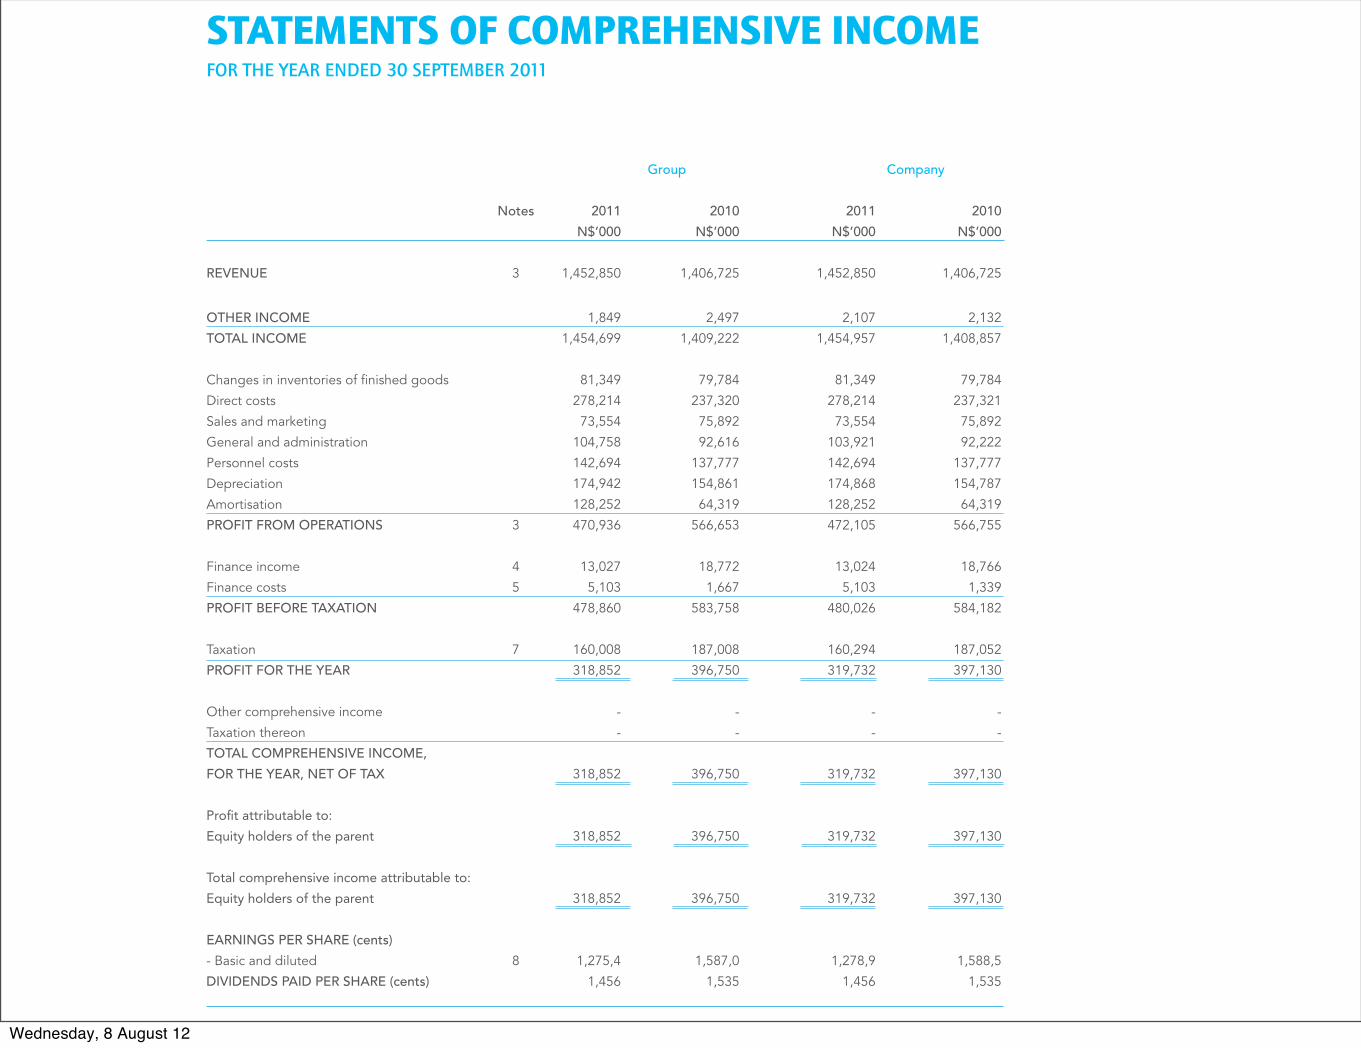
REVENUE 3 1,452,850 1,406,725 1,452,850 1,406,725
OTHER INCOME 1,849 2,497 2,107 2,132 1,454,699 1,409,222 1,454,957 1,408,857
Changes in inventories of fi nished goods 81,349 79,784 81,349 79,784Direct costs 278,214 237,320 278,214 237,321Sales and marketing 73,554 75,892 73,554 75,892General and administration 104,758 92,616 103,921 92,222Personnel costs 142,694 137,777 142,694 137,777Depreciation 174,942 154,861 174,868 154,787Amortisation 128,252 64,319 128,252 64,319PROFIT FROM OPERATIONS 3 470,936 566,653 472,105 566,755
Finance income 4 13,027 18,772 13,024 18,766Finance costs 5 5,103 1,667 5,103 1,339 PROFIT BEFORE TAXATION 478,860 583,758 480,026 584,182
Taxation 7 160,008 187,008 160,294 187,052PROFIT FOR THE YEAR 318,852 396,750 319,732 397,130
Other comprehensive income - - - - Taxation thereon - - - -
318,852 396,750 319,732 397,130
Profi t attributable to:
Equity holders of the parent 318,852 396,750 319,732 397,130 Total comprehensive income attributable to:
Equity holders of the parent 318,852 396,750 319,732 397,130
- Basic and diluted 8 1,275,4 1,587,0 1,278,9 1,588,5
1,456 1,535 1,456 1,535
STATEMENTS OF COMPREHENSIVE INCOMEFOR THE YEAR ENDED 30 SEPTEMBER 2011
Wednesday, 8 August 12
7
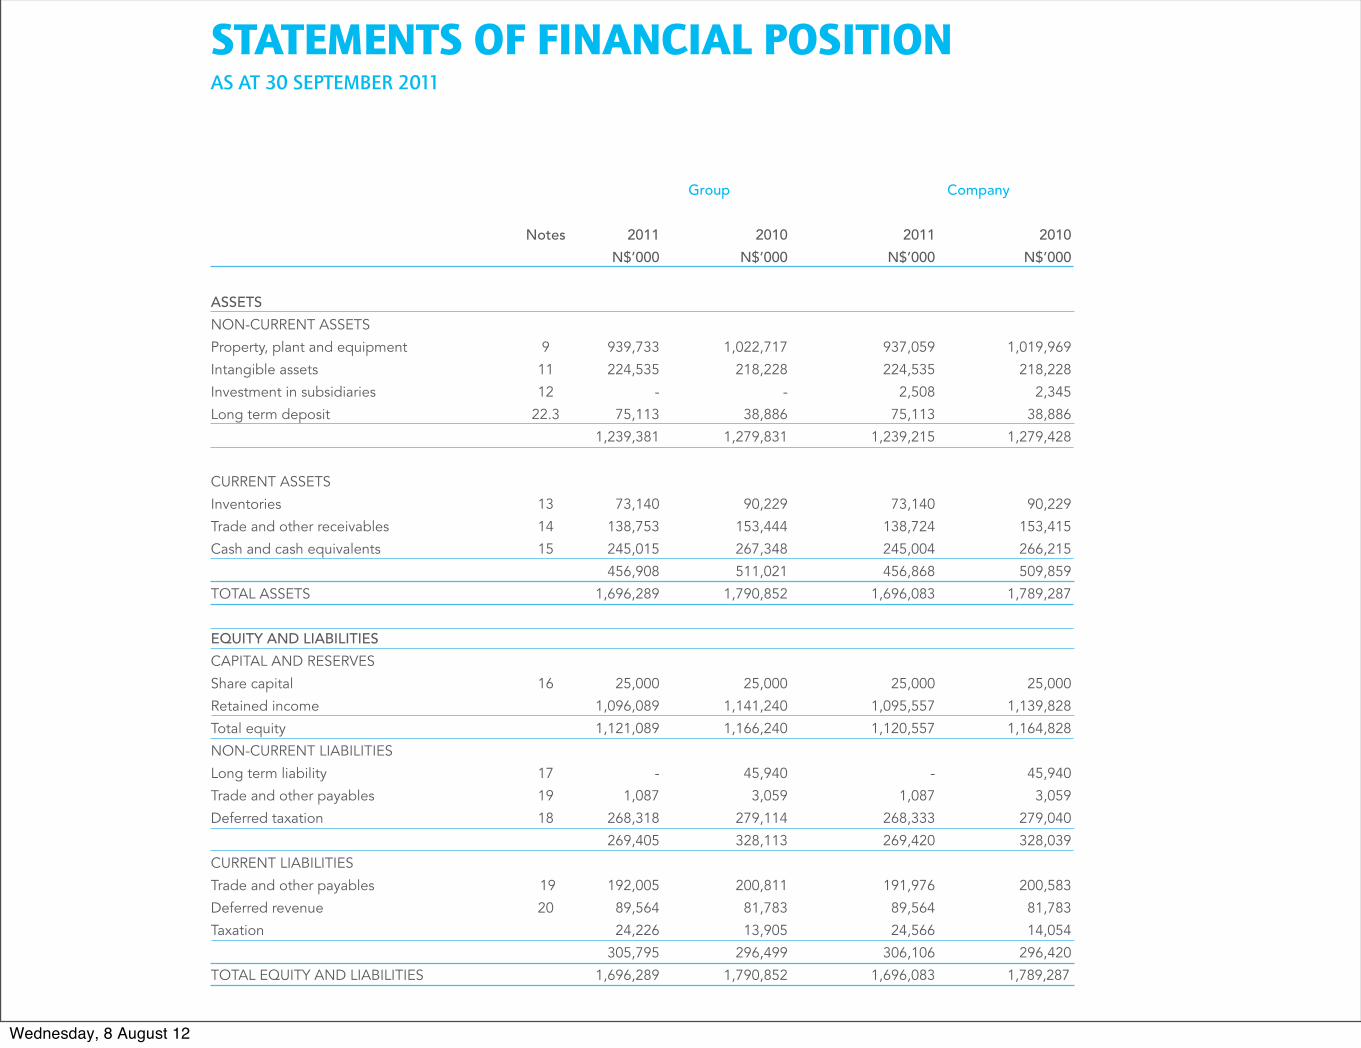
Notes 2011 2010 2011 2010 N$’000 N$’000 N$’000 N$’000
ASSETS NON-CURRENT ASSETS Property, plant and equipment 9 939,733 1,022,717 937,059 1,019,969Intangible assets 11 224,535 218,228 224,535 218,228Investment in subsidiaries 12 - - 2,508 2,345 Long term deposit 22.3 75,113 38,886 75,113 38,886 1,239,381 1,279,831 1,239,215 1,279,428
CURRENT ASSETS Inventories 13 73,140 90,229 73,140 90,229 Trade and other receivables 14 138,753 153,444 138,724 153,415 Cash and cash equivalents 15 245,015 267,348 245,004 266,215 456,908 511,021 456,868 509,859TOTAL ASSETS 1,696,289 1,790,852 1,696,083 1,789,287
Share capital 16 25,000 25,000 25,000 25,000Retained income 1,096,089 1,141,240 1,095,557 1,139,828Total equity 1,121,089 1,166,240 1,120,557 1,164,828NON-CURRENT LIABILITIES Long term liability 17 - 45,940 - 45,940 Trade and other payables 19 1,087 3,059 1,087 3,059Deferred taxation 18 268,318 279,114 268,333 279,040 269,405 328,113 269,420 328,039CURRENT LIABILITIES Trade and other payables 19 192,005 200,811 191,976 200,583Deferred revenue 20 89,564 81,783 89,564 81,783Taxation 24,226 13,905 24,566 14,054 305,795 296,499 306,106 296,420TOTAL EQUITY AND LIABILITIES 1,696,289 1,790,852 1,696,083 1,789,287
STATEMENTS OF FINANCIAL POSITIONAS AT 30 SEPTEMBER 2011
Wednesday, 8 August 12
9
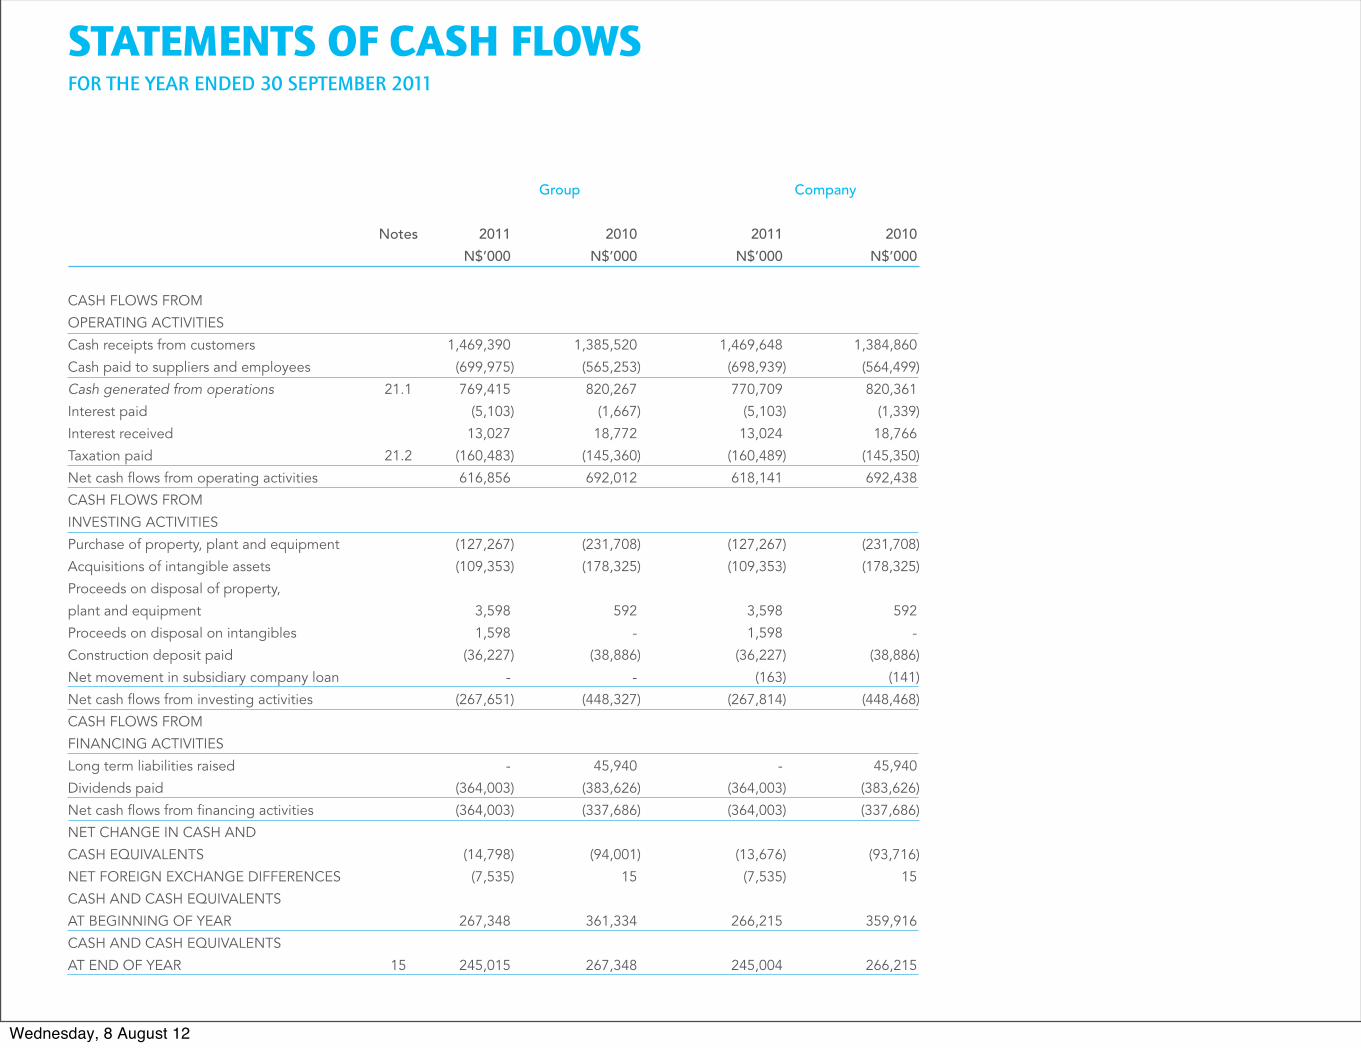
Notes 2011 2010 2011 2010 N$’000 N$’000 N$’000 N$’000
Cash receipts from customers 1,469,390 1,385,520 1,469,648 1,384,860Cash paid to suppliers and employees (699,975) (565,253) (698,939) (564,499)Cash generated from operations 21.1 769,415 820,267 770,709 820,361Interest paid (5,103) (1,667) (5,103) (1,339)Interest received 13,027 18,772 13,024 18,766Taxation paid 21.2 (160,483) (145,360) (160,489) (145,350)Net cash fl ows from operating activities 616,856 692,012 618,141 692,438
Purchase of property, plant and equipment (127,267) (231,708) (127,267) (231,708)Acquisitions of intangible assets (109,353) (178,325) (109,353) (178,325)Proceeds on disposal of property, plant and equipment 3,598 592 3,598 592 Proceeds on disposal on intangibles 1,598 - 1,598 - Construction deposit paid (36,227) (38,886) (36,227) (38,886)Net movement in subsidiary company loan - - (163) (141)Net cash fl ows from investing activities (267,651) (448,327) (267,814) (448,468)
Long term liabilities raised - 45,940 - 45,940 Dividends paid (364,003) (383,626) (364,003) (383,626)Net cash fl ows from fi nancing activities (364,003) (337,686) (364,003) (337,686)
AT BEGINNING OF YEAR 267,348 361,334 266,215 359,916
AT END OF YEAR 15 245,015 267,348 245,004 266,215
STATEMENTS OF CASH FLOWSFOR THE YEAR ENDED 30 SEPTEMBER 2011
Wednesday, 8 August 12
Telecom Namibia
Wednesday, 8 August 12
Telecom Namibia Limited Annual Report 2009/108
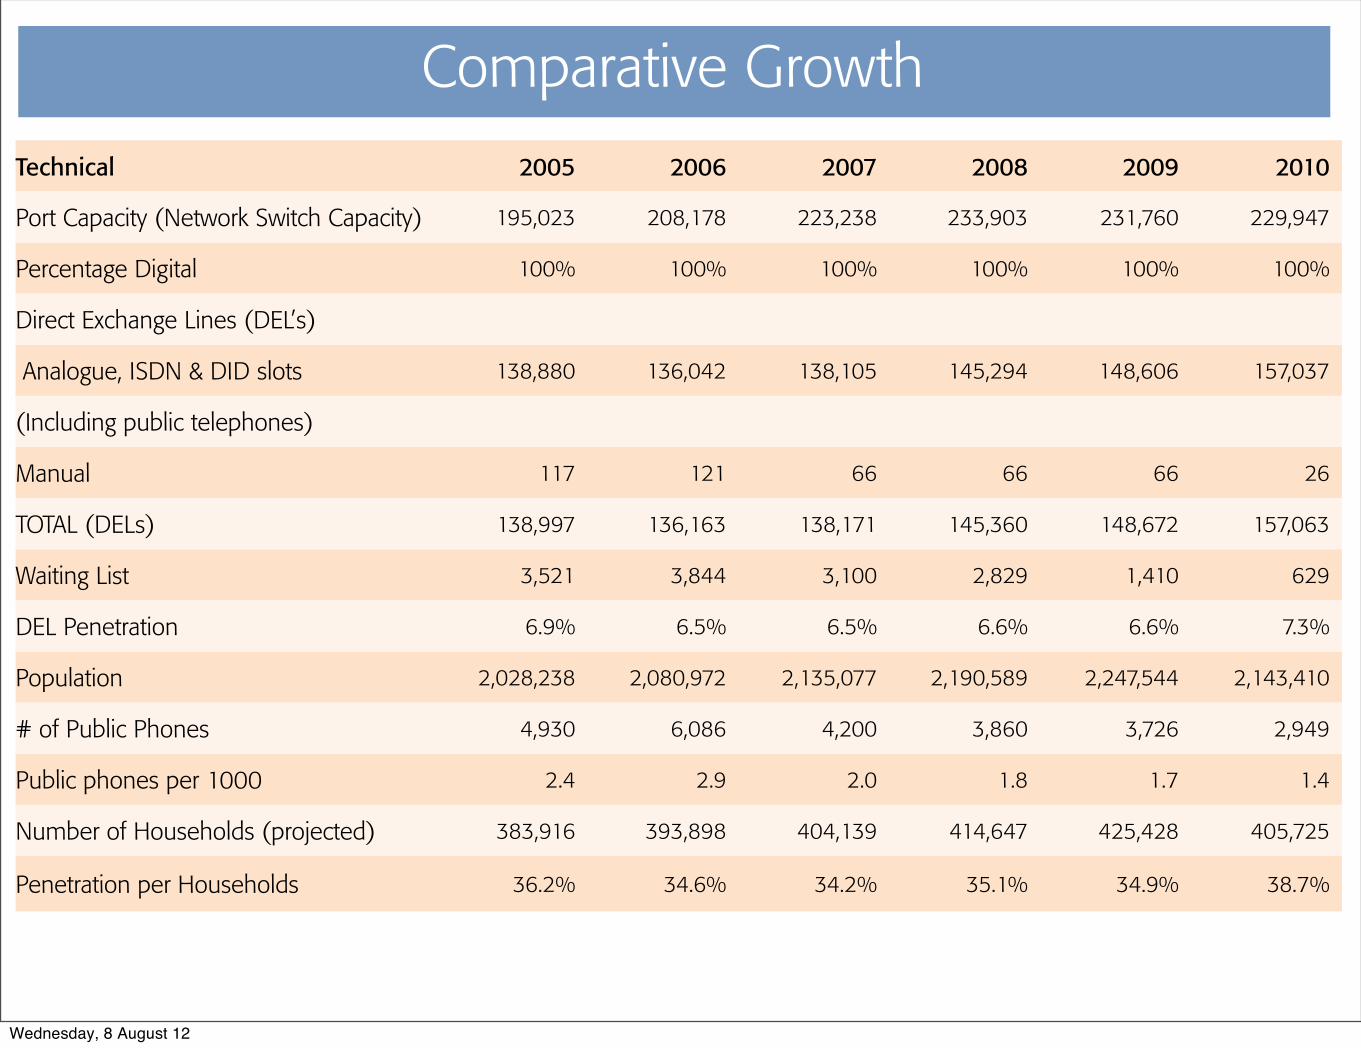
Technical 2005 2006 2007 2008 2009 2010
Port Capacity (Network Switch Capacity) 195,023 208,178 223,238 233,903 231,760 229,947
Percentage Digital 100% 100% 100% 100% 100% 100%
Direct Exchange Lines (DEL’s)
Analogue, ISDN & DID slots 138,880 136,042 138,105 145,294 148,606 157,037
(Including public telephones)
Manual 117 121 66 66 66 26
TOTAL (DELs) 138,997 136,163 138,171 145,360 148,672 157,063
Waiting List 3,521 3,844 3,100 2,829 1,410 629
DEL Penetration 6.9% 6.5% 6.5% 6.6% 6.6% 7.3%
Population 2,028,238 2,080,972 2,135,077 2,190,589 2,247,544 2,143,410
# of Public Phones 4,930 6,086 4,200 3,860 3,726 2,949
Public phones per 1000 2.4 2.9 2.0 1.8 1.7 1.4
Number of Households (projected) 383,916 393,898 404,139 414,647 425,428 405,725
Penetration per Households 36.2% 34.6% 34.2% 35.1% 34.9% 38.7%
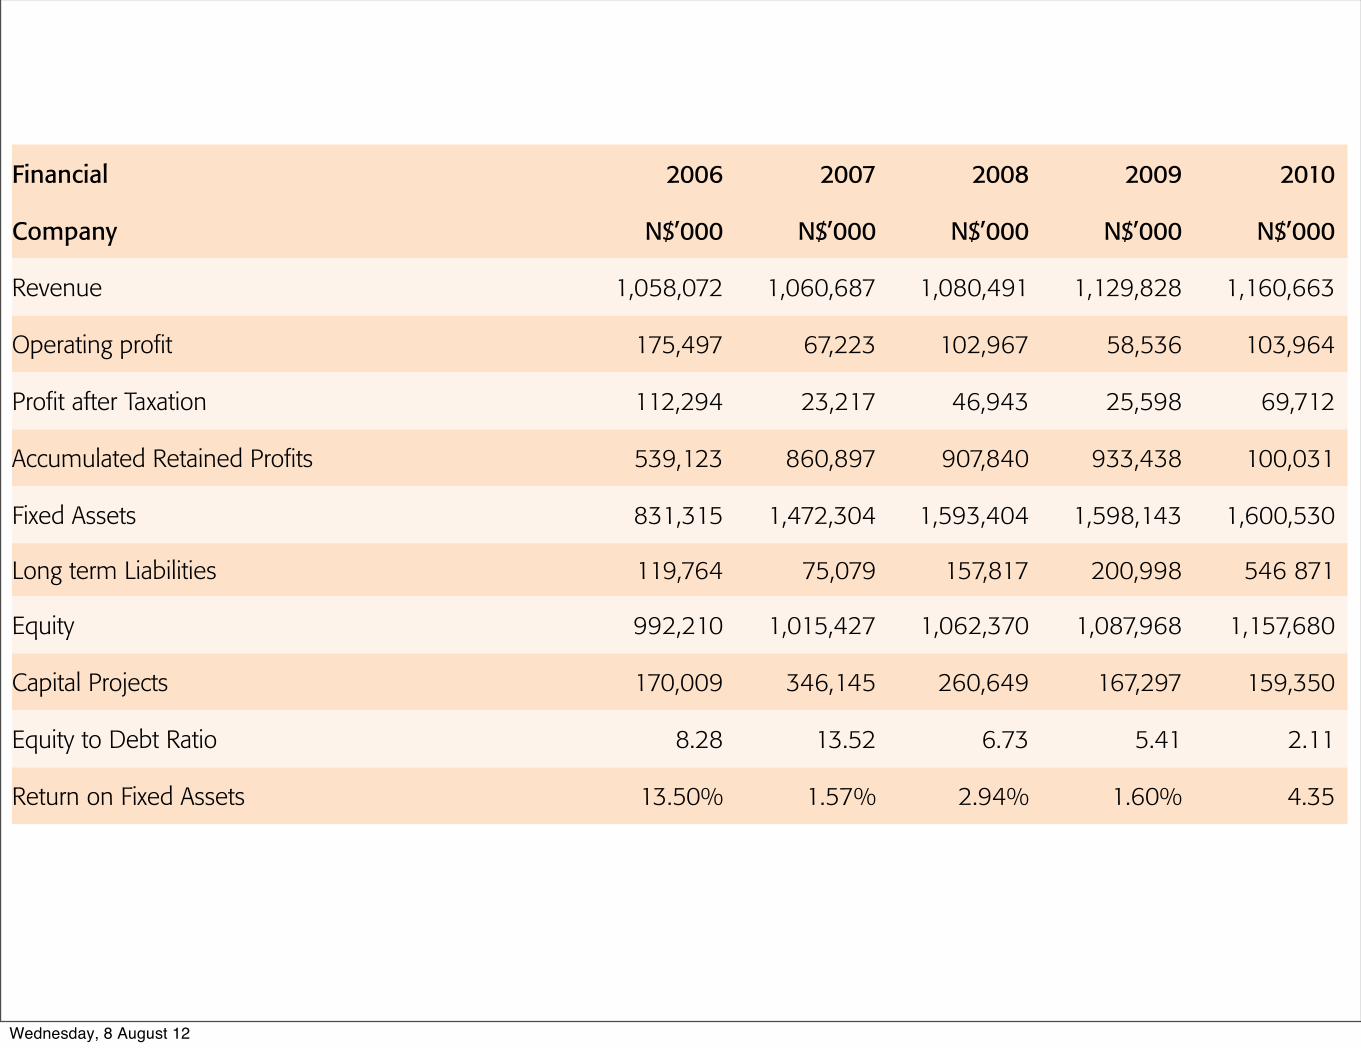
Financial 2006 2007 2008 2009 2010
Company N$’000 N$’000 N$’000 N$’000 N$’000
Revenue 1,058,072 1,060,687 1,080,491 1,129,828 1,160,663
Operating profit 175,497 67,223 102,967 58,536 103,964
Profit after Taxation 112,294 23,217 46,943 25,598 69,712
Accumulated Retained Profits 539,123 860,897 907,840 933,438 100,031
Fixed Assets 831,315 1,472,304 1,593,404 1,598,143 1,600,530
Long term Liabilities 119,764 75,079 157,817 200,998 546 871
Equity 992,210 1,015,427 1,062,370 1,087,968 1,157,680
Capital Projects 170,009 346,145 260,649 167,297 159,350
Equity to Debt Ratio 8.28 13.52 6.73 5.41 2.11
Return on Fixed Assets 13.50% 1.57% 2.94% 1.60% 4.35
Comparative Growth
Technical & Financial Highlights for the years 2005 to 2010
Wednesday, 8 August 12
Telecom Namibia Limited Annual Report 2009/108
Technical 2005 2006 2007 2008 2009 2010
Port Capacity (Network Switch Capacity) 195,023 208,178 223,238 233,903 231,760 229,947
Percentage Digital 100% 100% 100% 100% 100% 100%
Direct Exchange Lines (DEL’s)
Analogue, ISDN & DID slots 138,880 136,042 138,105 145,294 148,606 157,037
(Including public telephones)
Manual 117 121 66 66 66 26
TOTAL (DELs) 138,997 136,163 138,171 145,360 148,672 157,063
Waiting List 3,521 3,844 3,100 2,829 1,410 629
DEL Penetration 6.9% 6.5% 6.5% 6.6% 6.6% 7.3%
Population 2,028,238 2,080,972 2,135,077 2,190,589 2,247,544 2,143,410
# of Public Phones 4,930 6,086 4,200 3,860 3,726 2,949
Public phones per 1000 2.4 2.9 2.0 1.8 1.7 1.4
Number of Households (projected) 383,916 393,898 404,139 414,647 425,428 405,725
Penetration per Households 36.2% 34.6% 34.2% 35.1% 34.9% 38.7%
Financial 2006 2007 2008 2009 2010
Company N$’000 N$’000 N$’000 N$’000 N$’000
Revenue 1,058,072 1,060,687 1,080,491 1,129,828 1,160,663
Operating profit 175,497 67,223 102,967 58,536 103,964
Profit after Taxation 112,294 23,217 46,943 25,598 69,712
Accumulated Retained Profits 539,123 860,897 907,840 933,438 100,031
Fixed Assets 831,315 1,472,304 1,593,404 1,598,143 1,600,530
Long term Liabilities 119,764 75,079 157,817 200,998 546 871
Equity 992,210 1,015,427 1,062,370 1,087,968 1,157,680
Capital Projects 170,009 346,145 260,649 167,297 159,350
Equity to Debt Ratio 8.28 13.52 6.73 5.41 2.11
Return on Fixed Assets 13.50% 1.57% 2.94% 1.60% 4.35
Comparative Growth
Technical & Financial Highlights for the years 2005 to 2010
Wednesday, 8 August 12
Telecom Namibia Limited Annual Report 2009/1022
ADSL
Telecom Namibia has been blessed with an unmatched copper wire line network that stretches across the length and breadth of the coun-try. This is the network which supported the company’s earliest tele-communication services. Today, this copper-based network continues to be an invaluable medium, delivering the Company’s broadband technologies such as ADSL.
ADSL is a data communications technology known as Asymmetrical Digital Subscriber Line that provides a faster data transmission over copper telephone lines. ADSL access has the highlights with high bandwidth, reliability and security.
ADSL was initially rolled out in December 2006, and was intended to provide short term solution serving as an early start of the serv-ice. The solution presented many restrictions in terms of capacity and flexibility due to non-availability of supporting networks. With the supporting network (MPLS and Metro Ethernet network) roll outs, the ADSL expansion continued to expand to other regions throughout the country including remote areas. Sites with minimal backhaul capacity were also redesigned and migrated to high bandwidth networks to avoid bottlenecks while ensuring high availability, and preparing the network for fixed broadband access (FBA)services.
FBA were completed and packaged and have since grown in popular-ity. A 10MB package was added at the end of the financial year. To deliver such a broadband package to urban customers, an additional 5,431 ports were added to the ADSL DSLAM infrastructure. Currently 109 DSLAM’s cater for a 22,382 ports capacity in total of which 13,274 were connected at end of the year. All DSLAM’s are now backhauled by means of the new IP/MPLS standards and network.
ADSL services have made remarkable progress as seen in the number of ports rolled out countrywide and the number of customers acquired to date. Currently there are 22 657 numbers of ports.
WiMAX
The Worldwide Interoperability for Microwave Access (WiMAX) is a wireless technology suitable to support multiple service delivery and is a key component of our suite of core technologies, being an all-IP, all-packet technology with no legacy telephony, which makes opera-tional expenses very low.
WiMAX is today a field proven technology embraced by a growing number of countries across the world. What it brought to Telecom Namibia and its customers is a low cost, wireless broadband option that supports the company’s broadband strategy. Its scalability ensures it can embrace quad play services when they come on stream.
Fixed broadband services are transported to rural/farming customers by means of the WiMAX platform, providing broadband/internet serv-ices to the rural community. The WiMAX connectivity became very popular among the farming community due to the powerful data/internet service and performance.
During the year, 17 new WiMAX base stations were added success-fully (Eersterus, Adrianopel, Wilheben, Eliesenheim, Omandumba, Doreen, Blumfelde, Ohorongo, Emmabrunn, Grootfontein, Ruacana, Uutapi, Lusese, Kamuchonga, Katwitwi, Bergquelle, Onguari).
Three new sites were installed and are currently in the testing phase (Summerdown, Steinhausen, Mbela). Another 13 sites are in dif- ferent stages of rollout. Except one remaining, all base stations are now backhauled via the IP/MPLS network. This makes WiMAX our only true end-to-end IP access network at this stage.
VSAT
The new VSAT platform was implemented in June/July 2010, which is IP and is based on Gilat’s SkyEdge II product. It offers reliable internet and voice services. The new platform is also serving as back-haul transmission to eight small digital exchanges (SDEs), connecting remotely located communities such as Tsumkwe, Koes, Gam, etc.
A new VSAT hub and system was installed – the full-IP SkyEdge II VSAT (SEII) platform. The hub was commissioned in July 2010 and the total old Faraway VSAT services were migrated across to SEII.
The VSAT upgrade is aimed at replacing the outdated FaraWay and DialAway VSAT platforms in order to improve VSAT service delivery, retain current VSAT customers on a growing competitive market and offer broadband satellite services to new applicants in remote areas.
Currently, all Dialaway services of Telecom Namibia are being mig-rated as customers take up the new product. To date, 209 SEII VSATs are in service with another 27 in the process of construction works for migration. This new SEII VSAT system will bring our standard broad-band services and packages across the country into an “anywhere – anytime” mode. The objective of this transformation is to replace old obsolete technologies like open wire infrastructure, Magneto, Magnolia and SOR-18.
The roll-out of broadband access networks (ADSL, WiMAX and VSAT) will continue at a much higher pace to connect as many customers and as quick as possible so that the backbone network can be loaded with traffic and driven by attractive broadband packages and features.
Fibre Backbone Network Upgrade
To carry all broadband traffic, our fibre backbone network requires constant capacity upgrades. During the previous year up to mid 2009, the total northern backbone network (i.e. north of Wind-hoek and inclusive) was closed into ring networks (Erongo, Kunene and Omaheke rings) and also upgraded to SDH STM-64 capacities (excluding Grootfontein-Katima Mulilo).
During the year, the southern backbone network was partially upgraded in a phased approach. The route Gobabis-Aranos-Stam-priet-Maltahöhe-Aus-Bethanien-Keetmanshoop was upgraded from STM-16 to STM-64 capacity. The recovered STM-16 equipment from the north was installed onto separate fibre pairs to provide additional parallel STM-16 capacity between Aus–Oranjemund as well as Keet-manshoop-Karasburg as an interim measure to provide additional circuits from Windhoek to South Africa for big customers and interna-tional transit routes in the interim solution until the very far south is also upgraded to STM-64 level.
This additional capacity in the south enabled Telecom Namibia to utilise the new interconnection at Velloorsdrift to Neotel and at the same time provide access to SEACOM. The Neotel interconnec-tion was in December 2009.
In the same project, a new upgraded Network Element Management System was installed to handle the new technologies as well as a geographical redundancy at Pioniers Park.
Similarly, the single spur fibre cable route from Grootfontein to Katima Mulilo was upgraded by adding a STM-16 system onto an-other fibre pair in addition to the existing STM-4 system. This allowed for a 400% capacity increase to Katima Mulilo with the view also to provide cross border interconnect services to Zambia.
Technically, Telecom Namibia has reached the target to provide and operate a broadband network as well as several fit-for-all-purpose broadband access networks.
The basic NGN backbone network is now in place, but demand requires ever growing capacities which forces Telecom Namibia to get a 40G backbone capacity in place on existing fibre infrastructure and to continue expanding the fibre infrastructure and capacity on an ongoing basis.
DCA Project
The unique and special project for the Namibian Department of Civil Aviation (DCA) was to roll out 36 remote stations with Telecom Namibia backbone backhauling to a centralised control centre in Windhoek (for a national air traffic management system to secure the Namibian air space and increase air safety as demanded by international air traffic control-
Wednesday, 8 August 12
Telecom Namibia Limited Annual Report 2009/1010
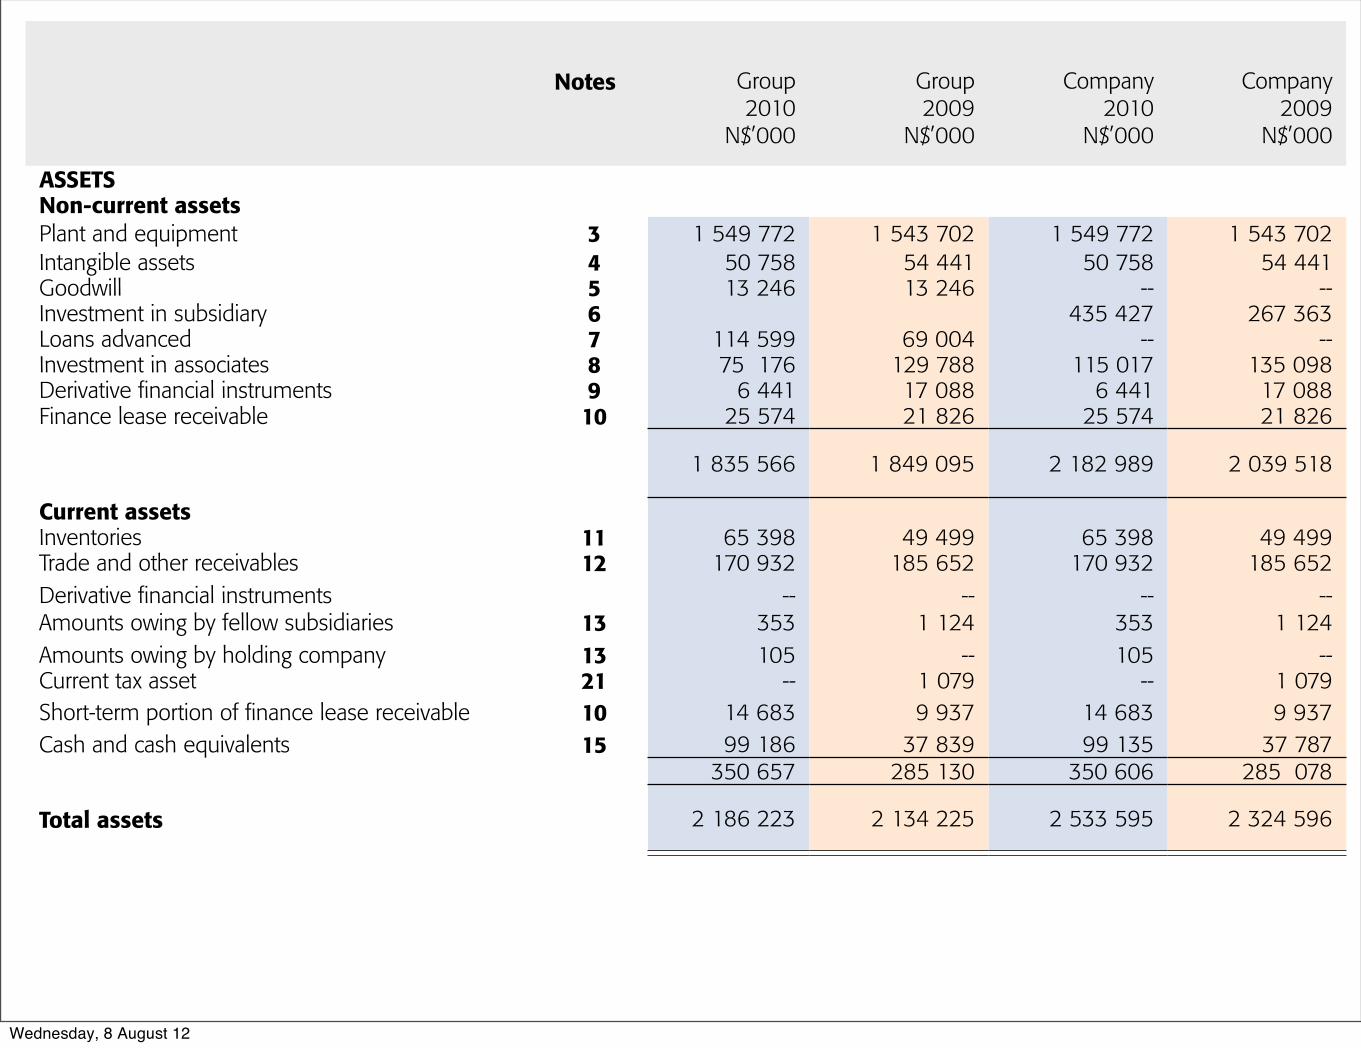
Statements of Financial Position as at 30 September 2010
Notes Group 2010
N$’000
Group2009
N$’000
Company2010
N$’000
Company2009
N$’000
ASSETSNon-current assetsPlant and equipment 3 1 549 772 1 543 702 1 549 772 1 543 702Intangible assets 4 50 758 54 441 50 758 54 441Goodwill 5 13 246 13 246 -- --Investment in subsidiary 6 435 427 267 363Loans advanced 7 114 599 69 004 -- --Investment in associates 8 75 176 129 788 115 017 135 098Derivative financial instruments 9 6 441 17 088 6 441 17 088Finance lease receivable 10 25 574 21 826 25 574 21 826
1 835 566 1 849 095 2 182 989 2 039 518
Current assetsInventories 11 65 398 49 499 65 398 49 499Trade and other receivables 12 170 932 185 652 170 932 185 652Derivative financial instrumentsAmounts owing by fellow subsidiaries 13
--353
--1 124
--353
--1 124
Amounts owing by holding company 13 105 -- 105 --Current tax asset 21 -- 1 079 -- 1 079Short-term portion of finance lease receivable 10 14 683 9 937 14 683 9 937Cash and cash equivalents 15 99 186 37 839 99 135 37 787
350 657 285 130 350 606 285 078
Total assets 2 186 223 2 134 225 2 533 595 2 324 596
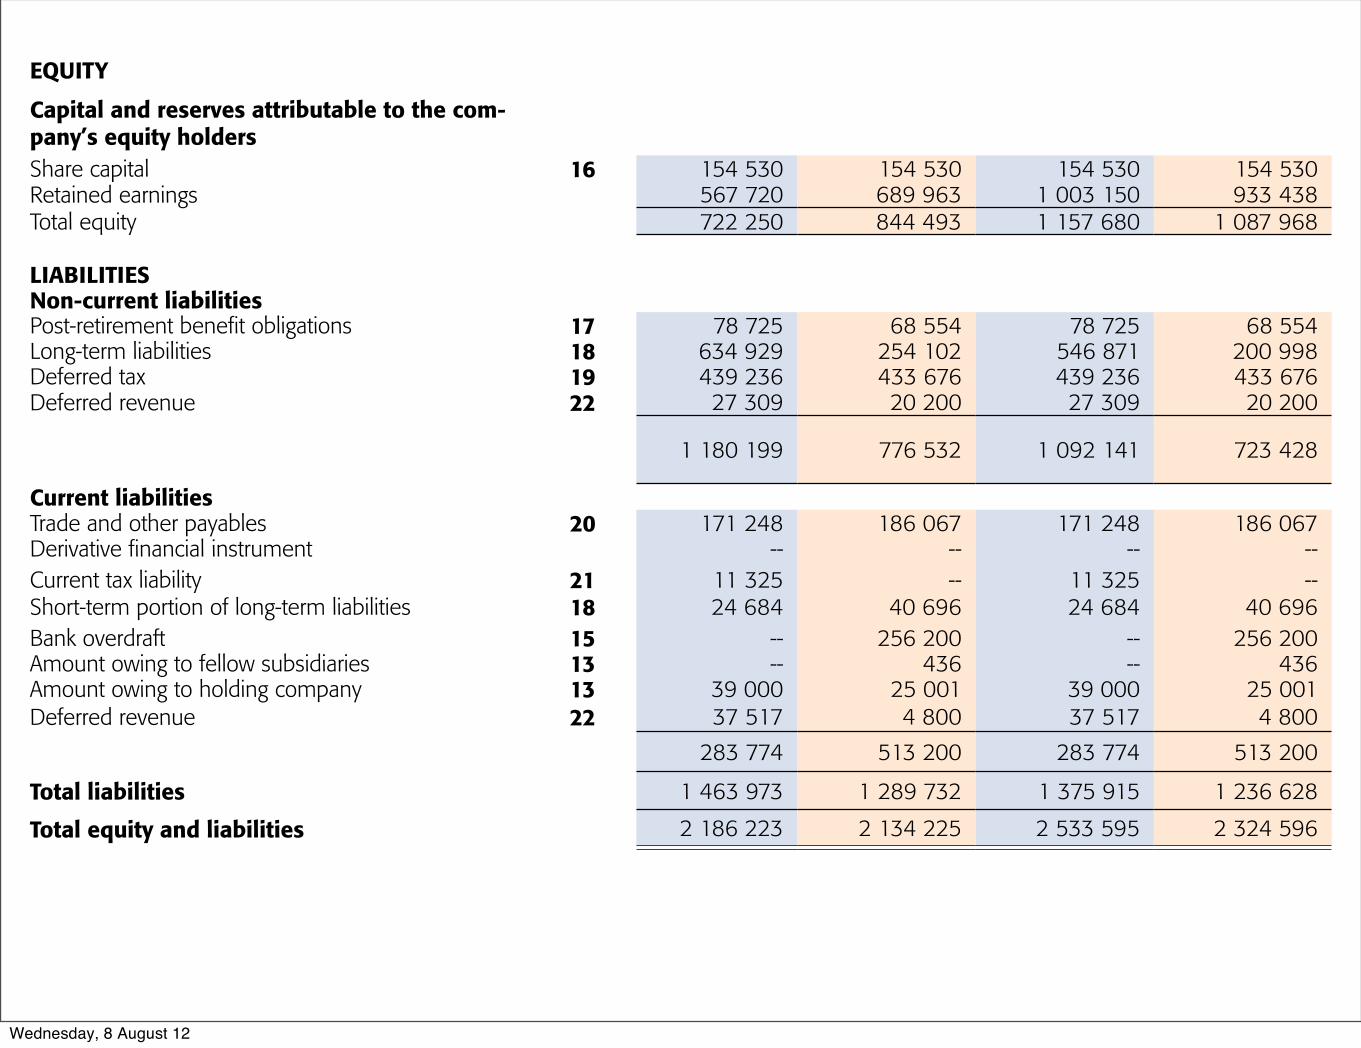
EQUITY
Capital and reserves attributable to the com-pany’s equity holdersShare capital 16 154 530 154 530 154 530 154 530Retained earnings 567 720 689 963 1 003 150 933 438Total equity 722 250 844 493 1 157 680 1 087 968
LIABILITIESNon-current liabilities Post-retirement benefit obligations 17 78 725 68 554 78 725 68 554Long-term liabilities 18 634 929 254 102 546 871 200 998Deferred tax 19 439 236 433 676 439 236 433 676Deferred revenue 22 27 309 20 200 27 309 20 200
1 180 199 776 532 1 092 141 723 428
Current liabilitiesTrade and other payables 20 171 248 186 067 171 248 186 067Derivative financial instrument -- -- -- --Current tax liabilityShort-term portion of long-term liabilities
2118
11 32524 684
--40 696
11 32524 684
--40 696
Bank overdraft 15 -- 256 200 -- 256 200Amount owing to fellow subsidiaries 13 -- 436 -- 436Amount owing to holding company 13 39 000 25 001 39 000 25 001Deferred revenue 22 37 517 4 800 37 517 4 800
283 774 513 200 283 774 513 200
Total liabilities 1 463 973 1 289 732 1 375 915 1 236 628
Total equity and liabilities 2 186 223 2 134 225 2 533 595 2 324 596
Wednesday, 8 August 12
Telecom Namibia Limited Annual Report 2009/1010
Statements of Financial Position as at 30 September 2010
Notes Group 2010
N$’000
Group2009
N$’000
Company2010
N$’000
Company2009
N$’000
ASSETSNon-current assetsPlant and equipment 3 1 549 772 1 543 702 1 549 772 1 543 702Intangible assets 4 50 758 54 441 50 758 54 441Goodwill 5 13 246 13 246 -- --Investment in subsidiary 6 435 427 267 363Loans advanced 7 114 599 69 004 -- --Investment in associates 8 75 176 129 788 115 017 135 098Derivative financial instruments 9 6 441 17 088 6 441 17 088Finance lease receivable 10 25 574 21 826 25 574 21 826
1 835 566 1 849 095 2 182 989 2 039 518
Current assetsInventories 11 65 398 49 499 65 398 49 499Trade and other receivables 12 170 932 185 652 170 932 185 652Derivative financial instrumentsAmounts owing by fellow subsidiaries 13
--353
--1 124
--353
--1 124
Amounts owing by holding company 13 105 -- 105 --Current tax asset 21 -- 1 079 -- 1 079Short-term portion of finance lease receivable 10 14 683 9 937 14 683 9 937Cash and cash equivalents 15 99 186 37 839 99 135 37 787
350 657 285 130 350 606 285 078
Total assets 2 186 223 2 134 225 2 533 595 2 324 596
EQUITY
Capital and reserves attributable to the com-pany’s equity holdersShare capital 16 154 530 154 530 154 530 154 530Retained earnings 567 720 689 963 1 003 150 933 438Total equity 722 250 844 493 1 157 680 1 087 968
LIABILITIESNon-current liabilities Post-retirement benefit obligations 17 78 725 68 554 78 725 68 554Long-term liabilities 18 634 929 254 102 546 871 200 998Deferred tax 19 439 236 433 676 439 236 433 676Deferred revenue 22 27 309 20 200 27 309 20 200
1 180 199 776 532 1 092 141 723 428
Current liabilitiesTrade and other payables 20 171 248 186 067 171 248 186 067Derivative financial instrument -- -- -- --Current tax liabilityShort-term portion of long-term liabilities
2118
11 32524 684
--40 696
11 32524 684
--40 696
Bank overdraft 15 -- 256 200 -- 256 200Amount owing to fellow subsidiaries 13 -- 436 -- 436Amount owing to holding company 13 39 000 25 001 39 000 25 001Deferred revenue 22 37 517 4 800 37 517 4 800
283 774 513 200 283 774 513 200
Total liabilities 1 463 973 1 289 732 1 375 915 1 236 628
Total equity and liabilities 2 186 223 2 134 225 2 533 595 2 324 596
Wednesday, 8 August 12
Telecom Namibia Limited Annual Report 2009/10 11
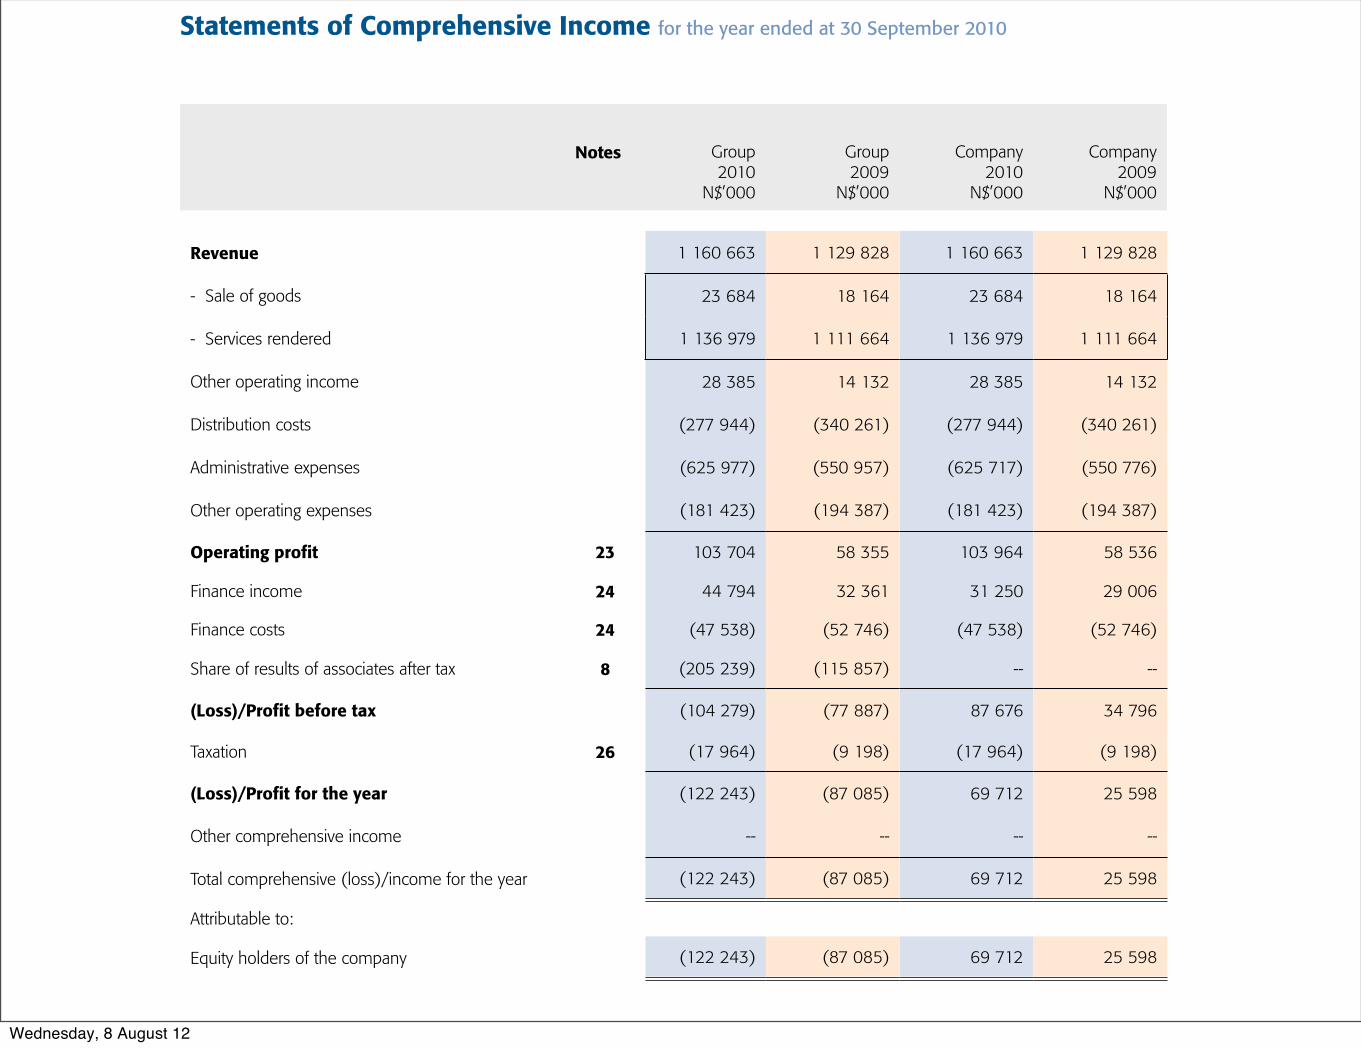
Statements of Comprehensive Income for the year ended at 30 September 2010
Notes Group2010
N$’000
Group2009
N$’000
Company2010
N$’000
Company2009
N$’000
Revenue 1 160 663 1 129 828 1 160 663 1 129 828
- Sale of goods 23 684 18 164 23 684 18 164
- Services rendered 1 136 979 1 111 664 1 136 979 1 111 664
Other operating income 28 385 14 132 28 385 14 132
Distribution costs (277 944) (340 261) (277 944) (340 261)
Administrative expenses (625 977) (550 957) (625 717) (550 776)
Other operating expenses (181 423) (194 387) (181 423) (194 387)
Operating profit 23 103 704 58 355 103 964 58 536
Finance income 24 44 794 32 361 31 250 29 006
Finance costs 24 (47 538) (52 746) (47 538) (52 746)
Share of results of associates after tax 8 (205 239) (115 857) -- --
(Loss)/Profit before tax (104 279) (77 887) 87 676 34 796
Taxation 26 (17 964) (9 198) (17 964) (9 198)
(Loss)/Profit for the year (122 243) (87 085) 69 712 25 598
Other comprehensive income -- -- -- --
Total comprehensive (loss)/income for the year (122 243) (87 085) 69 712 25 598
Attributable to:
Equity holders of the company (122 243) (87 085) 69 712 25 598
Wednesday, 8 August 12