Embed Size (px)
Citation preview
UNIVERSITÉ DE GENÈVE FACULTÉ DES SCIENCES Département de botanique et biologie végétale Laboratoire de bioénergétique et microbiologie Professeur R. J. Strasser
Analysis and Application of the Fast Chl a Fluorescence (OJIP)
Transient Complemented with
Simultaneous 820 nm Transmission Measurements
THÈSE
présentée à la Faculté des sciences de l’Université de Genève pour obtenir le grade de Docteur ès sciences, mention biologique
par
Szilvia Zita TÓTH
de Hongrie
Thèse N° 3741
GENÈVE Atelier de reproduction de la Section de physique
2006
3
... observation is the tug that tows the ship of theory
W. V. O. Quine

4
5
TABLE OF CONTENTS
List of publications 11 Abbreviations 13
Résumé ANALYSE ET APPLICATION DE LA CINETIQUE RAPIDE DE FLUORESCENCE (OJIP) COMPLEMENTEES AVEC DES MESURES SIMULTANEES DE TRANSMISSION A 820 NM 15 Summary 25
CHAPTER I. GENERAL INTRODUCTION 27 I. 1. Introduction to photosynthetic electron transport processes
I. 1.a Chloroplast structure I. 1.b Structure of the main protein components of the photosynthetic electron transport chain I. 1.c Light absorption and photosynthetic electron transport
I. 2. Introduction to chl a fluorescence I. 2.a Approaches to measure chl a fluorescence I.2.b Complementary techniques of chl a fluorescence
I. 3. The aims and the essential results of this thesis
CHAPTER II. MEASURING EQUIPMENTS: THE HANSATECH FLUOROMETERS 45 II. 1. Handy-PEA instrument, standard version II. 2. Special Handy-PEA instruments II. 3. PEA Senior instrument
PART 1. STUDIES ON THE CHL A FLUORESCENCE (OJIP) TRANSIENT 49
CHAPTER III. IN INTACT LEAVES, THE MAXIMUM FLUORESCENCE VALUE (FM) IS
INDEPENDENT OF THE REDOX STATE OF THE PLASTOQUINONE POOL 51 III. 1. Summary III. 2. Introduction III. 3. Materials and Methods
III.3.a Plant material III.3.b Thylakoid isolation III.3.c DCMU treatments III.3.d Measuring equipments
III. 4. Results III.4.a OJIP transients of submerged leaves treated or not with DCMU
6
III.4.b Simultaneous 820 nm transmission and chl a fluorescence measurements III.4.c F0 and FM values in leaves of different plant species treated with DCMU
via stem III.4.d Variations of F0 and FM under different experimental conditions
III. 5. Discussion III.5.a Treatment conditions III.5.b The effect of DCMU on the F0 value III.5.c The effect of DCMU on the FM value
CHAPTER IV. THE SPECIFIC RATE OF QA REDUCTION AND PHOTOSYSTEM II HETEROGENEITY 63
IV. 1. Summary IV. 2. Introduction IV. 3. Materials and Methods
IV.3.a Plant material IV.3.b DCMU treatments IV.3.c Measuring equipment
IV. 4. Results and Discussion
CHAPTER V. METHYLVIOLOGEN AND DIBROMOTHYMOQUINONE TREATMENTS OF PEA LEAVES REVEAL THE ROLE OF PHOTOSYSTEM I IN THE OJIP TRANSIENT 71
V. 1. Summary V. 2. Introduction V. 3. Materials and Methods
V.3.a Plant material V.3.b MV treatment V.3.c DBMIB treatment V.3.d Measuring equipments
V. 4. Results V.4.a Effects on the OJIP transient V.4.b Dark adaptation kinetics of the OJIP transient V.4.c Effects of MV and DBMIB on the 820 nm transmission kinetics
during red and FR illuminations V.4.d MV and PQ-pool reduction V.4.e Light intensity dependence of the OJIP transients V.4.f Re-reduction kinetics of PC+ and P700+ in darkness following a FR
pre-pulse V.4.g FR light-induced transmission changes in dark adapted leaves
7
V. 5. Discussion V.5.a Explanations for the IP phase V.5.b MV selectively affects the IP phase V.5.c IP phase in thylakoid membranes V.5.d DBMIB-effects V.5.e DBMIB as an electron shuttle V.5.f Re-reduction kinetics of PC+ and P700+ V.5.g MV and cyclic PSI electron transport V.5.h Concluding remarks
PART 2. APPLICATIONS OF THE CHL A FLUORESCENCE (OJIP) TRANSIENT 91 CHAPTER VI. A NON-INVASIVE AND IN VIVO METHOD FOR THE DETERMINATION
OF THE REDOX STATE OF THE PQ-POOL 93 VI. 1. Summary VI. 2. Introduction VI. 3. Materials and Methods
VI.3.a Plant material VI.3.b Anaerobiosis treatment VI.3.c DCMU treatment VI.3.d Measuring equipments
VI. 4. Results VI.4.a Effects of anaerobiosis VI.4.b Assay for the determination of the PQ-pool redox state VI.4.c F20µs and energetic connectivity or grouping
VI. 5. Discussion VI.5.a The apparent F0 or F20µs VI.5.b The initial slope VI.5.c FJ value VI.5.d Area above the OJ phase VI.5.e FR light induced oxidation of the electron transport chain VI.5.f Earlier studies on the effects of anaerobiosis on the chl a fluorescence
transient VI.5.g Connectivity or grouping VI.5.h Equilibrium constant VI.5.i The assay for the determination of the PQ-pool redox state
8
CHAPTER VII. BIOPHYSICAL STUDIES ON PHOTOSYSTEM II-RELATED RECOVERY PROCESSES AFTER A HEAT PULSE IN BARLEY SEEDLINGS (HORDEUM VULGARE L.) 109
VII. 1. Summary VII. 2. Introduction VII. 3. Materials and Methods
VII.3.a Plant material and growth conditions VII.3.b Heat pulse and plant growth conditions following the treatment VII.3.c Chl a fluorescence measurements VII.3.d Isolation of thylakoid membranes VII.3.e Measurement of oxygen evolving activity VII.3.f Thermoluminescence (TL) measurements VII.3.g Measurement of flash-induced electrochromic absorbance transients
(∆A515) VII.3.h Determination of antioxidant enzyme activities and TBARS content
VII. 4. Results VII.4.a Chl a fluorescence (OJIP) transients VII.4.b Oxygen evolution VII.4.c Thermoluminescence (TL) VII.4.d Flash-induced electrochromic absorbance transients (∆A515) VII.4.e Activity of several antioxidant enzymes and the amount of thiobarbituric-
acid reactive substances (TBARS) VII. 5. Discussion
VII.5.a Primary heat stress effects on PSII and on membrane permeability VII.5.b Measurements related to oxidative stress VII.5.c The FV/FM value VII.5.d The K step and the AT band VII.5.e Recovery of PSII
CHAPTER VIII. ALTERNATIVE ELECTRON DONORS OF PHOTOSYSTEM II FUNCTION
EFFICIENTLY IN HEAT-TREATED LEAVES 125 VIII. 1. Summary VIII. 2. Introduction VIII. 4. Materials and Methods
VIII.3.a Plant material and growth conditions VIII.3.b Heat pulse VIII.3.c DCMU+heat treatment VIII.3.d Heat+anaerobiosis treatment VIII.3.e Methylviologen (MV)+heat treatment
9
VIII.3.f Chl a fluorescence and 820 nm transmission measurements VIII. 5. Results
VIII.4.a Chl a fluorescence transients of heat-treated barley leaves measured at different light intensities VIII.4.b Detection of alternative electron donors with short repetitive light
pulses VIII.4.c Regeneration of the K step after heat pulses of 50-54°C VIII.4.d Chl a fluorescence transients and 820 nm transmission kinetics of
DCMU+heat-treated leaves VIII.4.e Double-pulse experiments VIII.4.f MV treatments VIII.4.g Re-reduction of P700+ and PC+ in darkness VIII.4.h Chl a fluorescence transients of anaerobic samples
VIII. 6. Discussion VIII.5.a Electron donation to PSII by alternative sources VIII.5.b PSI acceptor side VIII.5.c Dark-reduction of the PQ-pool VIII.5.d Interpretation of the OJIP transient: K and J steps
CHAPTER IX. GENERAL DISCUSSION 141 IX.1. Interpretation of the OJIP transient
IX.1.a The photochemical (OJ) phase of the OJIP transient IX.1.b Is QA the only determinant of the fluorescence yield? IX.1.c The JI phase of the chl a fluorescence transient IX.1.d The IP phase of the chl a fluorescence transient IX.1.e The effect of light gradient and leaf anatomy on the OJIP transient
IX.2. Applications of the OJIP transient IX.2.a The FV/FM value IX.2.b The FJ value as an indicator of the PQ-pool redox state IX.2.c F20µs as an indicator of the redox state of QA at the onset of illumination IX.2.d Technical novelties in measuring fluorescence: short light pulses and
very high light intensities IX.2.e 820 nm transmission measurements
Acknowledgements 151
References 153

10
11
LIST OF PUBLICATIONS
PUBLICATIONS IN REFEREED JOURNALS
Tóth SZ, Schansker G, Kissimon J, Kovács L, Garab G, Strasser RJ (2005) Biophysical
studies of photosystem II-related recovery processes after a heat pulse in barley seedlings (Hordeum vulgare L) J Plant Physiol 162: 181-194
Schansker G, Tóth SZ, Strasser RJ (2005) Methylviologen and dibromothymoquinone treatments of pea leaves reveal the role of Photosystem I in the Chl a fluorescence rise OJIP. Biochim Biophys Acta 1706: 250-261
Tóth SZ, Schansker G, Strasser RJ (2005) In intact leaves the maximum fluorescence level (FM) is independent of the redox state of the plastoquinone pool: A DCMU-inhibition study. Biochim Biophys Acta 1708: 275-282
Schansker G, Tóth SZ, Strasser RJ (2006) Dark recovery of the chl a fluorescence induction transient (OJIP) after light adaptation: The qT-component of non-photochemical quenching is related to an activated photosystem I acceptor side. Biochim Biophys Acta 1757: 787-797
Tóth SZ, Schansker G, Strasser RJ (2006) A non-invasive and in vivo method for the determination of the redox state of the PQ-pool (submitted)
Tóth SZ, Schansker G, Garab G, Strasser RJ (2006) Photosynthetic electron transport activity in heat-treated barley leaves: The role of internal alternative electron donors to photosystem II (submitted)
PROCEEDINGS
Tóth SZ, Strasser RJ (2005) The specific rate of QA reduction and photosystem II heterogeneity. In: Van Est A, Bruce D (eds) Photosynthesis: Fundamental Aspects to Global Perspectives, pp 198-200. Allen Press Inc, Lawrence
Schansker G, Tóth SZ, Strasser RJ (2005) Photosystem I and the fluorescence induction kinetics in vivo: the effects of DBMIB and methylviologen. In: Van Est A, Bruce D (eds) Photosynthesis: Fundamental Aspects to Global Perspectives, pp 561-563. Allen Press Inc, Lawrence
Tóth SZ, Schansker G, Garab G, Strasser RJ (2005) Alternative electron donors to photosystem II play an important role in the reduction of the electron transport chain in heat-treated barley leaves. Proceedings of the 8th Hungarian Congress on Plant Physiology and the 6th Hungarian Conference on Photosynthesis. Acta Biol Szeged 49: 181-183
12
ABSTRACTS AND POSTERS
Tóth SZ, Strasser RJ (2002) The rate constant of primary photochemistry depends on the redox state of the electron acceptor QA. Book of abstracts of the 13th FESPP (Federation of European Societies of Plant Physiology) Congress, p 479
Tóth SZ, Kissimon J, Schansker G, Kovács L, Garab G, Strasser RJ (2003) Characterization of recovery processes related to photosystem II after a heat pulse in barley seedlings. J Exp Bot 55: 1270. (Special issue: Novel Approaches to Understanding Photosynthetic Performance)
Tóth SZ, Schansker G, Strasser RJ (2004) Under optimal conditions, the addition of DCMU does not affect the F0 and FM-values. Book of abstracts of the Photosynthesis and Post-Genomic Era Satellite Meeting, Trois-Rivières, Canada, p 168
Tóth SZ, Strasser RJ (2004) The specific rate of QA reduction increases as a function of the initial QA- concentration. 13th International Congress of Photosynthesis, Program and Abstracts, p 120
Schansker G, Tóth SZ, Strasser RJ (2004) Photosystem I and the fluorescence induction kinetics in vivo: the effects of DBMIB and methylviologen. 13th International Congress of Photosynthesis, Program and Abstracts, p 170
Tóth SZ, Strasser RJ (2004) Effects of mycorrhiza and copper stress on the photosynthesis of grapevine studied in vivo by chlorophyll a fluorescence and 820 nm transmission measurements. Cost Action 8.38 8th Management Meeting, Scientific Programme and Meeting, p 83
Tóth SZ, Schansker G, Garab G, Strasser RJ (2005) Does back flow of electrons from the PQ-pool contribute to the reduction of QA in heat-treated leaves? FEBS J 272 (suppl. 1): 453 (2005 FEBS Congress and IUBMB Conference)
ORAL PRESENTATIONS
Tóth SZ, Schansker G, Garab G, Strasser RJ (2005) Alternatív fotoszintetikus elektrontranszport folyamatok vizsgálata klorofill a fluoreszcencia indukció (OJIP) és 820 nm transzmisszió segítségével [Alternative electron transfer processes studied by chlorophyll a fluorescence induction and 820 nm transmission measurements]. 8th Hungarian Congress on Plant Physiology and the 6th Hungarian Conference on Photosynthesis. Szeged, Hungary, 22-25 August, 2005
Tóth SZ, Schansker G, Strasser RJ (2005) Can the experimentally measured F0 be used as an indicator of the redox state of the PQ-pool? Photosynthesis and Stress Conference, Brno, Czech Republic, 15-16 September, 2005
13
ABBREVIATIONS
A area a.u. arbitrary units ABS/CS absorption flux per CS ABS/RC absorption flux per RC APX ascorbate peroxidase Asc ascorbate B the number of closed RCs B0 the number of closed RCs at 20 µs chl chlorophyll CS cross section cyt cytochrome DA dark adapted DBMIB dibromothymoquinone, 2,5-dibromo-3-methyl-6-isopropyl-p-benzoquinone DCMU 3-(3’,4’-dichlorophenyl)-1,1-dimethylurea DW distilled water ET0/CS electron transport flux per CS (at t=0) ET0/RC electron transport flux per RC (at t=0) F0 initial fluorescence (usually at 20 µs), all PSII RCs are open F100ms fluorescence intensity at 100 ms F20µs initial fluorescence intensity (independently of the redox state of QA) FI fluorescence intensity at 30 ms FJ fluorescence intensity at 2 or 3 ms (at 3000 µmol photons m-2s-1) FJ-FR FJ value after FR pre-illumination FM maximum fluorescence, all PSII RCs are closed FNR ferredoxin-NADP+-reductase FP maximum measured fluorescence intensity, FP=FM only when all PSII RCs
are closed FR far-red light GPX guaiacol peroxidase I step in the OJIP transient at 30 ms I820nm photocurrent, a measure for the transmitted light at 820 nm I820nm-10s FR transmission value obtained after 10 s of FR illumination J step in the OJIP transient at 2 or 3 ms (at 3000 µmol photons m-2s-1) K step in the OJIP transient at 0.3 or 0.4 ms (at 3000 µmol photons m-2s-1) LED light-emitting diode LHCII light-harvesting chlorophyll a/b protein complex of PSII
14
LI light intensity MDA malondialdehyde MV methylviologen, 1,1’-dimethyl-4,4’-bipyridinium-dichloride OJIP chl a fluorescence transient defined by the names of its intermediate steps P680 primary electron donor of PSII P700 primary electron donor of PSI PC plastocyanin PQ plastoquinone PSI photosystem I PSII photosystem II QA primary electron acceptor quinone of PSII QB secondary electron acceptor quinone of PSII RC reaction center SOD superoxide dismutase SP saturating light pulse ST single turnover flash TBARS thiobarbituric-acid reactive substances TL thermoluminescence TR0/CS trapped energy flux per CS (at t=0) TR0/RC trapped energy flux per RC (at t=0) TyrZ tyrozin Z V relative variable fluorescence, V= (Ft-F0)/(FM-F0) ∆A515 flash-induced electrochromic absorbance transient measured at 515 nm φPo maximum quantum yield for primary photochemistry ψo probability (at time 0) that a trapped exciton moves an electron into the
electron transport chain beyond QA-
15
RESUME
1. INTERPRETATION DE LA CINETIQUE DE LA FLUORESCENCE DE CHL A (OJIP)
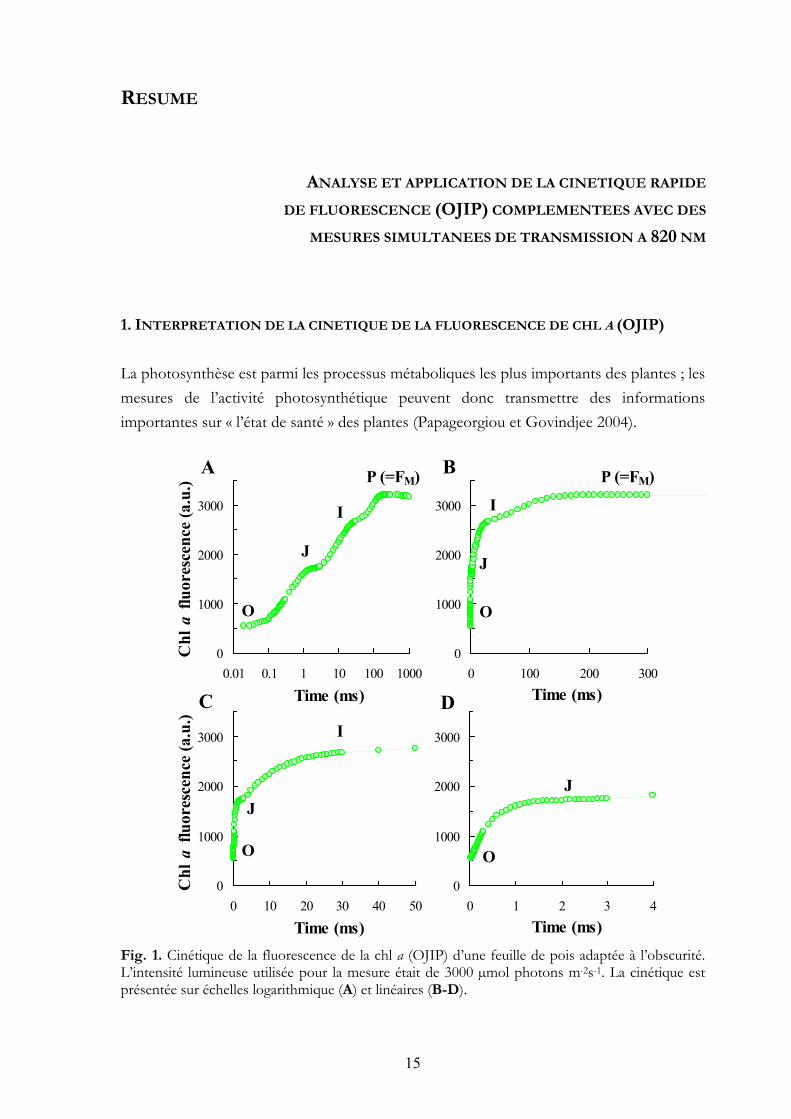
La photosynthèse est parmi les processus métaboliques les plus importants des plantes ; les mesures de l’activité photosynthétique peuvent donc transmettre des informations importantes sur « l’état de santé » des plantes (Papageorgiou et Govindjee 2004). Fig. 1. Cinétique de la fluorescence de la chl a (OJIP) d’une feuille de pois adaptée à l’obscurité. L’intensité lumineuse utilisée pour la mesure était de 3000 µmol photons m-2s-1. La cinétique est présentée sur échelles logarithmique (A) et linéaires (B-D).
ANALYSE ET APPLICATION DE LA CINETIQUE RAPIDE
DE FLUORESCENCE (OJIP) COMPLEMENTEES AVEC DES
MESURES SIMULTANEES DE TRANSMISSION A 820 NM
0
1000
2000
3000
0.01 0.1 1 10 100 1000
J
I
O
0
1000
2000
3000
0 100 200 300
J
I
O
0
1000
2000
3000
0 10 20 30 40 50
J
I
O
0
1000
2000
3000
0 1 2 3 4
J
O
Time (ms) Time (ms)
Time (ms) Time (ms)
P (=FM) P (=FM)
Chl
a fl
uore
scen
ce (a
.u.)
Chl
a fl
uore
scen
ce (a
.u.)
A B
C D
16
Dans le domaine de la recherche de la photosynthèse, la fluorescence de la chl a est parmi les méthodes les plus courantes, dans les recherches fondamentales et également appliquées. C’est une méthode très sensible qui permet de mesurer in vivo l’activité photosynthétique. Elle peut être appliquée sur n’importe quel type d’échantillon photosynthétique sans préparations standardisées ou compliquées.
Cependant, il y a plusieurs questions fondamentales concernant l’interprétation de la cinétique de la fluorescence qui peut être liée au fait que plusieurs facteurs peuvent la modifier. Un des buts principaux de cette thèse était de contribuer à l’interprétation de la fluorescence de chl a.
La fluorescence de chl a est de la lumière émise par l’antenne des unités de photosystème II pendant l’illumination (Fig. 1). A l’aide d’un appareil nommé Handy-PEA on peut illuminer l’échantillon et en même temps mesurer la fluorescence. La longueur d’onde de la lumière de fluorescence est différente de la lumière émise par le Handy-PEA. Nous utilisons cette caractéristique pour faire la distinction entre la lumière émise par l’appareil et l’échantillon traité (à l’aide d’un filtre de lumière).
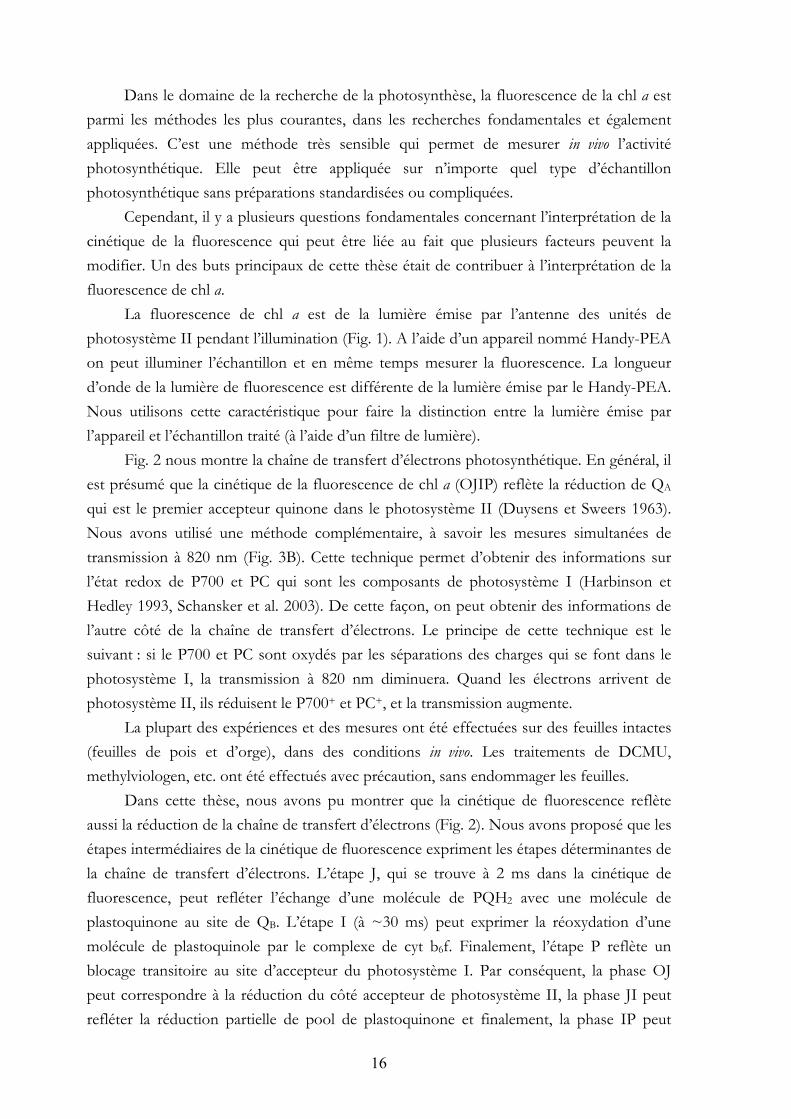
Fig. 2 nous montre la chaîne de transfert d’électrons photosynthétique. En général, il est présumé que la cinétique de la fluorescence de chl a (OJIP) reflète la réduction de QA qui est le premier accepteur quinone dans le photosystème II (Duysens et Sweers 1963). Nous avons utilisé une méthode complémentaire, à savoir les mesures simultanées de transmission à 820 nm (Fig. 3B). Cette technique permet d’obtenir des informations sur l’état redox de P700 et PC qui sont les composants de photosystème I (Harbinson et Hedley 1993, Schansker et al. 2003). De cette façon, on peut obtenir des informations de l’autre côté de la chaîne de transfert d’électrons. Le principe de cette technique est le suivant : si le P700 et PC sont oxydés par les séparations des charges qui se font dans le photosystème I, la transmission à 820 nm diminuera. Quand les électrons arrivent de photosystème II, ils réduisent le P700+ et PC+, et la transmission augmente.
La plupart des expériences et des mesures ont été effectuées sur des feuilles intactes (feuilles de pois et d’orge), dans des conditions in vivo. Les traitements de DCMU, methylviologen, etc. ont été effectués avec précaution, sans endommager les feuilles.
Dans cette thèse, nous avons pu montrer que la cinétique de fluorescence reflète aussi la réduction de la chaîne de transfert d’électrons (Fig. 2). Nous avons proposé que les étapes intermédiaires de la cinétique de fluorescence expriment les étapes déterminantes de la chaîne de transfert d’électrons. L’étape J, qui se trouve à 2 ms dans la cinétique de fluorescence, peut refléter l’échange d’une molécule de PQH2 avec une molécule de plastoquinone au site de QB. L’étape I (à ~30 ms) peut exprimer la réoxydation d’une molécule de plastoquinole par le complexe de cyt b6f. Finalement, l’étape P reflète un blocage transitoire au site d’accepteur du photosystème I. Par conséquent, la phase OJ peut correspondre à la réduction du côté accepteur de photosystème II, la phase JI peut refléter la réduction partielle de pool de plastoquinone et finalement, la phase IP peut
17
représenter la réduction du côté accepteur de photosystème I. Dans les sections suivantes, notre connaissance des différentes phases est résumée et évaluée.
Fig. 2. La chaîne de transferts d’électrons photosynthétique. Abréviations: PSII, photosystème II; YZ, tyrosine Z; P680, molécule de chl au centre de photosystème II, Phe, molécule de phéophytine ; QA, quinone A, QB, molécule de quinone B ; PQH2, plastoquinole ; PQ, plastoquinone ; cyt b6f, complexe de cytochrome composé des unités b6 et f ; PSI, photosystème I ; PC, plastocyanine ; P700, molécule de chl au centre de photosystème I ; A0 molécule de chl ; A1, une molécule de phylloquinone ; FX, FB, FA, protéines sulfurées et ferreux ; Fd, molécule de ferredoxine.
1.a La phase photochimique (OJ) de la cinétique de fluorescence (OJIP)
La phase OJ est la phase photochimique de la cinétique OJIP qui veut dire qu’elle est fortement influencée par l’intensité lumineuse utilisée pour provoquer la fluorescence. Dans le cas d’une illumination usuelle (3000 µmol photons m-2s-1), la phase OJ se termine à ~2 ms (où se situe l’étape J ; Strasser et al. 1995). Il y a plusieurs facteurs qui peuvent influencer la cinétique OJ : l’hétérogénéité de l’antenne de photosystème II (chapitre IV, Tóth et Strasser 2005), l’état du site QB (occupé ou non par une molécule de QB) qui est lié à l’état redox du pool de plastoquinone (chapitre VI, Tóth et al. 2006a), limitations du côté donneur du photosystème II (chapitres VII et VIII, Tóth et al. 2005a, Tóth et al. 2006b) et groupement des antennes des photosystèmes II (chapitre IV, Tóth et Strasser 2005). Hétérogénéité et groupement des antennes des photosystèmes II
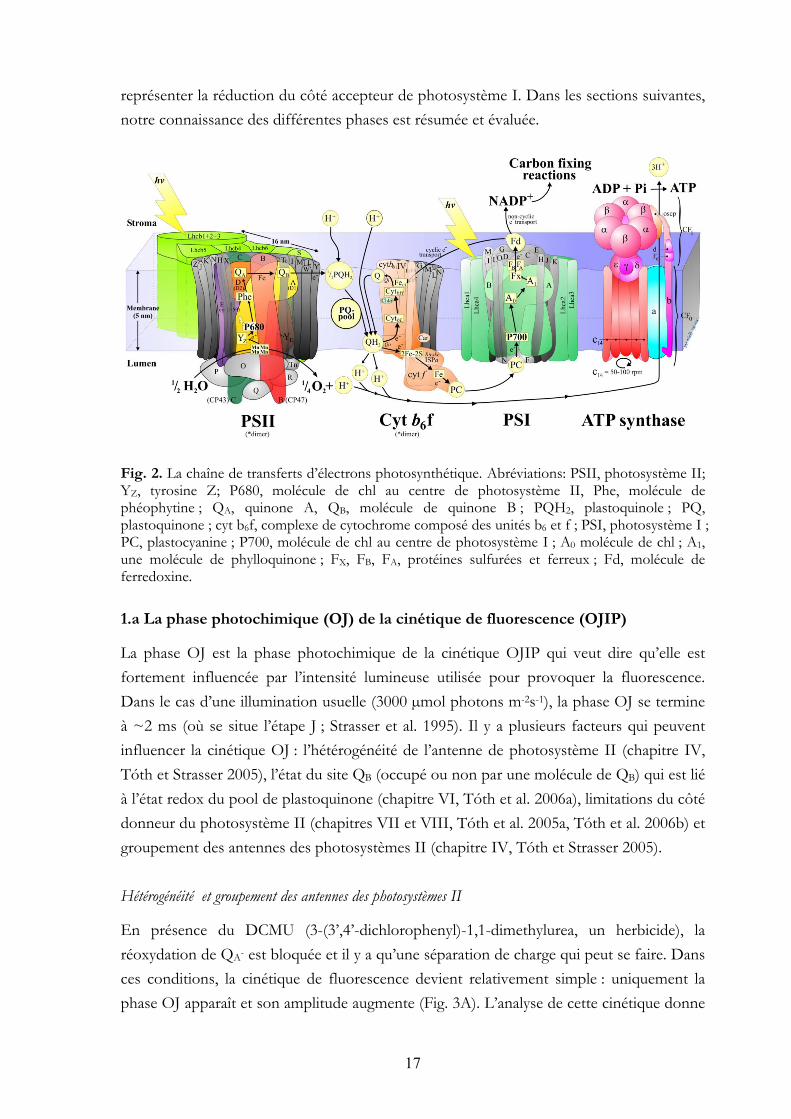
En présence du DCMU (3-(3’,4’-dichlorophenyl)-1,1-dimethylurea, un herbicide), la réoxydation de QA- est bloquée et il y a qu’une séparation de charge qui peut se faire. Dans ces conditions, la cinétique de fluorescence devient relativement simple : uniquement la phase OJ apparaît et son amplitude augmente (Fig. 3A). L’analyse de cette cinétique donne
18
de l’information sur l’hétérogénéité et groupement des antennes des photosystèmes II (Melis et Homann 1976). Il existe trois composants dans la cinétique qui peuvent représenter trois types d’unités de photosystème II : les unités α, dont l’antenne est la plus grande représentent le plus important groupe d’unités. Les antennes des unités β et γ sont plus petites. Leurs fermeture (réduction) et réouverture ont été étudiées dans le chapitre IV (Tóth et Strasser 2005). En comparant les cinétiques des phases OJ en présence et en absence du DCMU on peut constater qu’ils sont très similaires ce qui indique que leurs origines sont communes. Fig. 3. Cinétique de fluorescence (A) et transmission à 820 nm (B) en absence et présence d’un inhibiteur de photosystème II (DCMU) mesurées simultanément sur les feuilles intactes de pois. Combien de séparations de charge se font pendant la phase OJ ?
En général, on présume que la phase OJ correspond à une séparation de charge et uniquement de la réduction de QA. Ceci est basé sur sa nature photochimique et sur la similarité entre les phases OJ en présence et absence du DCMU (voir plus haut et Chapitre IX).
En revanche, 2 ms peuvent apparaître trop longues pour une séparation de charge. Si on prend en considération l’intensité lumineuse, la taille moyenne de l’antenne de photosystème II, le temps nécessaire pour la réoxydation de QA, on peut constater qu’il est fort possible que deux ou trois séparations de charge se fassent pendant la phase OJ (chapitres VI, VIII et IX, Tóth et al. 2006a, Tóth et al. 2006b).
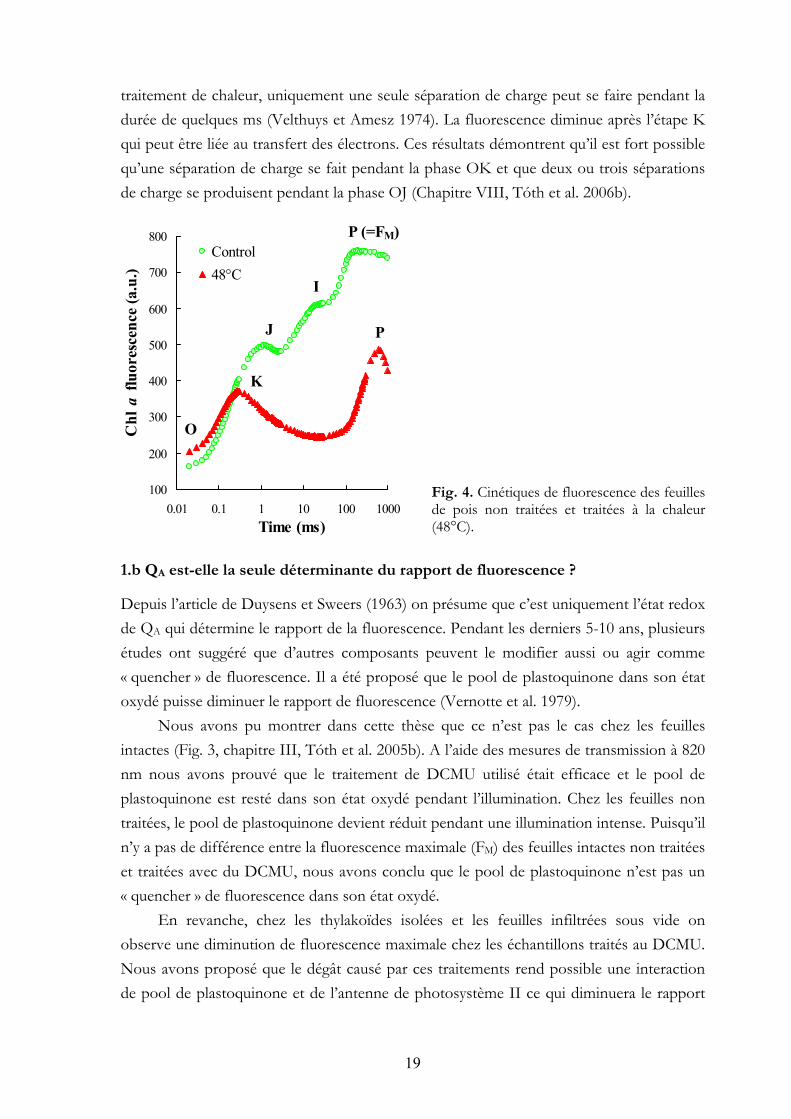
Dans le cas des feuilles traitées à une température élevée (~48°C ; Fig. 4), l’étape J et I disparaissent et une nouvelle étape, la K apparaît à ~400 µs (Srivastava et al. 1997). Les cinétiques des phases OJ et OK se chevauchent pendant les premiers ~100 µs (Chapitre VIII, Tóth et al. 2006b). Si le côté donneur du photosystème II est inactivé par le
0
500
1000
1500
2000
2500
3000
3500
0.01 0.1 1 10 100 1000
O
I
J
P
Chl
a fl
uore
scen
ce (a
.u.)
Time (ms)
DCMUUntreated
0.1 1 10 100 1000
Untreated
DCMU
Time (ms)
820
nm tr
ansm
issio
n (a
.u.)
A B
19
traitement de chaleur, uniquement une seule séparation de charge peut se faire pendant la durée de quelques ms (Velthuys et Amesz 1974). La fluorescence diminue après l’étape K qui peut être liée au transfert des électrons. Ces résultats démontrent qu’il est fort possible qu’une séparation de charge se fait pendant la phase OK et que deux ou trois séparations de charge se produisent pendant la phase OJ (Chapitre VIII, Tóth et al. 2006b).
Fig. 4. Cinétiques de fluorescence des feuilles de pois non traitées et traitées à la chaleur (48°C).
1.b QA est-elle la seule déterminante du rapport de fluorescence ?
Depuis l’article de Duysens et Sweers (1963) on présume que c’est uniquement l’état redox de QA qui détermine le rapport de la fluorescence. Pendant les derniers 5-10 ans, plusieurs études ont suggéré que d’autres composants peuvent le modifier aussi ou agir comme « quencher » de fluorescence. Il a été proposé que le pool de plastoquinone dans son état oxydé puisse diminuer le rapport de fluorescence (Vernotte et al. 1979).
Nous avons pu montrer dans cette thèse que ce n’est pas le cas chez les feuilles intactes (Fig. 3, chapitre III, Tóth et al. 2005b). A l’aide des mesures de transmission à 820 nm nous avons prouvé que le traitement de DCMU utilisé était efficace et le pool de plastoquinone est resté dans son état oxydé pendant l’illumination. Chez les feuilles non traitées, le pool de plastoquinone devient réduit pendant une illumination intense. Puisqu’il n’y a pas de différence entre la fluorescence maximale (FM) des feuilles intactes non traitées et traitées avec du DCMU, nous avons conclu que le pool de plastoquinone n’est pas un « quencher » de fluorescence dans son état oxydé.
En revanche, chez les thylakoïdes isolées et les feuilles infiltrées sous vide on observe une diminution de fluorescence maximale chez les échantillons traités au DCMU. Nous avons proposé que le dégât causé par ces traitements rend possible une interaction de pool de plastoquinone et de l’antenne de photosystème II ce qui diminuera le rapport
100
200
300
400
500
600
700
800
0.01 0.1 1 10 100 1000
Control48°C
Chl
a fl
uore
scen
ce (a
.u.)
K
J
I
P (=FM)
Time (ms)
O
P
20
de fluorescence. Malgré ce résultat, il est bien possible qu’il existe un autre modificateur du rapport de fluorescence que QA.
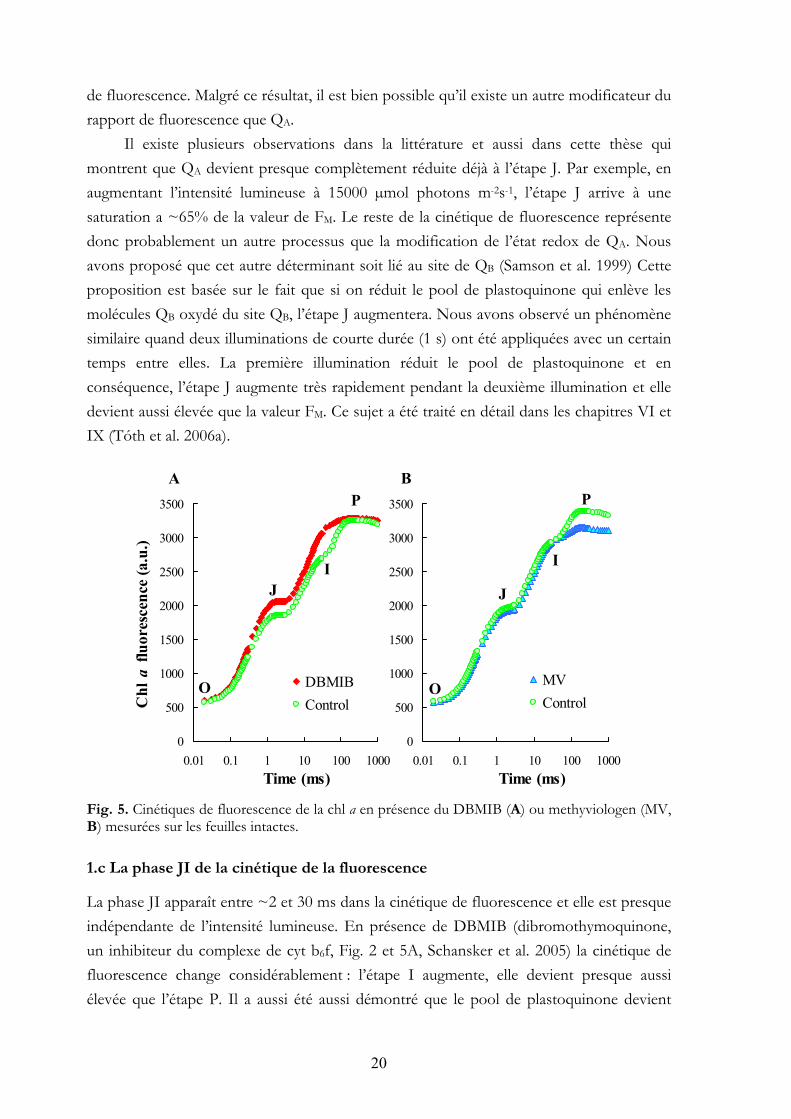
Il existe plusieurs observations dans la littérature et aussi dans cette thèse qui montrent que QA devient presque complètement réduite déjà à l’étape J. Par exemple, en augmentant l’intensité lumineuse à 15000 µmol photons m-2s-1, l’étape J arrive à une saturation a ~65% de la valeur de FM. Le reste de la cinétique de fluorescence représente donc probablement un autre processus que la modification de l’état redox de QA. Nous avons proposé que cet autre déterminant soit lié au site de QB (Samson et al. 1999) Cette proposition est basée sur le fait que si on réduit le pool de plastoquinone qui enlève les molécules QB oxydé du site QB, l’étape J augmentera. Nous avons observé un phénomène similaire quand deux illuminations de courte durée (1 s) ont été appliquées avec un certain temps entre elles. La première illumination réduit le pool de plastoquinone et en conséquence, l’étape J augmente très rapidement pendant la deuxième illumination et elle devient aussi élevée que la valeur FM. Ce sujet a été traité en détail dans les chapitres VI et IX (Tóth et al. 2006a). Fig. 5. Cinétiques de fluorescence de la chl a en présence du DBMIB (A) ou methyviologen (MV, B) mesurées sur les feuilles intactes.
1.c La phase JI de la cinétique de la fluorescence
La phase JI apparaît entre ~2 et 30 ms dans la cinétique de fluorescence et elle est presque indépendante de l’intensité lumineuse. En présence de DBMIB (dibromothymoquinone, un inhibiteur du complexe de cyt b6f, Fig. 2 et 5A, Schansker et al. 2005) la cinétique de fluorescence change considérablement : l’étape I augmente, elle devient presque aussi élevée que l’étape P. Il a aussi été aussi démontré que le pool de plastoquinone devient
0
500
1000
1500
2000
2500
3000
3500
0.01 0.1 1 10 100 1000
DBMIBControl
0
500
1000
1500
2000
2500
3000
3500
0.01 0.1 1 10 100 1000
MVControl
O
J
II
P
J
O
P
Chl
a fl
uore
scen
ce (a
.u.)
Time (ms) Time (ms)
A B
21
réduit pendant la phase JI (Schreiber et al. 1989). Ces résultats et le fait que la réduction de pool de plastoquinone se traduit par une diminution de l’amplitude de la phase JI indiquent que cette phase correspond à la réduction partielle du pool de plastoquinone (chapitres V, VI et IX). 1.d La phase IP de la cinétique de la fluorescence
La phase IP a été analysée en détail dans cette thèse (chapitre V, Schansker et al. 2005). Il existe huit hypothèses différentes dans la littérature pour expliquer la phase IP (Kautsky et al. 1960, Munday et Govindjee 1969, Schreiber et Vidaver 1974, Satoh 1981, Schreiber et Vidaver 1976, Neubauer et Schreiber 1987, Hsu et Leu 2003, Schreiber et al. 1989, Schreiber 2002, Vredenberg et Bulychev 2003, Strasser et Govindjee 1992b, Schreiber et Krieger 1996, Schreiber 2002).
La cinétique de fluorescence des feuilles intactes qui ont été traitées avec du DBMIB montre que le transfert d’électron après le complexe cyt b6f est nécessaire pour la formation de la phase IP (Fig. 5A).
Chez les feuilles adaptées à l’obscurité, le côté accepteur du photosystème I est inactif et pour cette raison, les électrons y sont bloqués. Ce blocage peut être évité en traitant les feuilles avec du methylviologen. C’est un produit qui accepte des électrons du côté accepteur du photosystème I. La phase IP ne se développe pas dans la cinétique de fluorescence chez les feuilles traitées avec du methylviologen (Fig. 5B). Ce résultat nous montre qu’un blocage du côté accepteur du photosystème I est aussi nécessaire pour le développement de la phase IP.
Nous avons étudié en détail les processus de transfert d’électrons chez les feuilles traitées avec du DBMIB et methylviologen avec des mesures de transmission à 820 nm. Nous discutons et remettons en question les hypothèses qui existent dans la littérature pour expliquer la phase IP (chapitre V, Schansker et al. 2005). 2. APPLICATIONS DE LA CINETIQUE DE FLUORESCENCE
Le deuxième but de cette thèse était d’étendre l’applicabilité de la cinétique de la fluorescence. Trois chapitres (VI, VII, VIII) ont été consacrés à ce sujet. 2.a La régénération de la photosynthèse après un traitement de chaleur
Le stress de chaleur déclenche la destruction du côté donneur du photosystème II, plus précisément le complexe de manganèse (Enami et al. 1994, Yamane et al. 1998). Le rôle de ce complexe est de scinder l’eau, qui est la source d’oxygène et d’électrons, pour la chaîne de transfert d’électrons. Dans le chapitre VII (Tóth et al. 2005a), nous avons utilisé la technique de fluorescence et d’autres techniques de biophysique (thermoluminescence,
22
mesures d’absorption à 515 nm, mesures d’émission d’oxygène) pour étudier le mécanisme de régénération du photosystème II.
Nous avons utilisé un traitement de chaleur très court, de 20 s ou 40 s à 50°C pour détruire rapidement le côté donneur du photosystème II en évitant les effets secondaires. La cinétique de régénération a été suivie pendant 48 heures, en lumière et en obscurité.
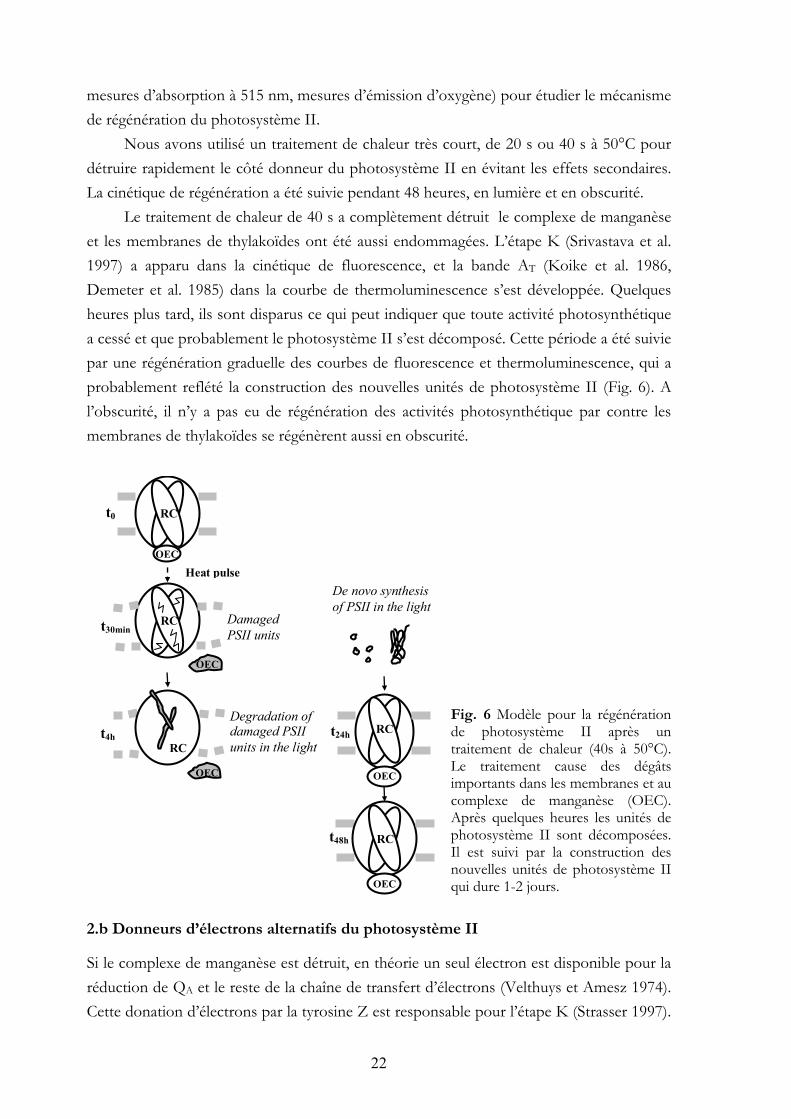
Le traitement de chaleur de 40 s a complètement détruit le complexe de manganèse et les membranes de thylakoïdes ont été aussi endommagées. L’étape K (Srivastava et al. 1997) a apparu dans la cinétique de fluorescence, et la bande AT (Koike et al. 1986, Demeter et al. 1985) dans la courbe de thermoluminescence s’est développée. Quelques heures plus tard, ils sont disparus ce qui peut indiquer que toute activité photosynthétique a cessé et que probablement le photosystème II s’est décomposé. Cette période a été suivie par une régénération graduelle des courbes de fluorescence et thermoluminescence, qui a probablement reflété la construction des nouvelles unités de photosystème II (Fig. 6). A l’obscurité, il n’y a pas eu de régénération des activités photosynthétique par contre les membranes de thylakoïdes se régénèrent aussi en obscurité.
Fig. 6 Modèle pour la régénération de photosystème II après un traitement de chaleur (40s à 50°C). Le traitement cause des dégâts importants dans les membranes et au complexe de manganèse (OEC). Après quelques heures les unités de photosystème II sont décomposées. Il est suivi par la construction des nouvelles unités de photosystème II qui dure 1-2 jours.
2.b Donneurs d’électrons alternatifs du photosystème II
Si le complexe de manganèse est détruit, en théorie un seul électron est disponible pour la réduction de QA et le reste de la chaîne de transfert d’électrons (Velthuys et Amesz 1974). Cette donation d’électrons par la tyrosine Z est responsable pour l’étape K (Strasser 1997).
De novo synthesisof PSII in the light
OEC
t24h
OEC
t48h
RC
RC
t30min
Degradation of damaged PSII units in the light
OEC
RC
RC
OEC
Heat pulse
t0
t4h RC
OEC
Damaged PSII units
23
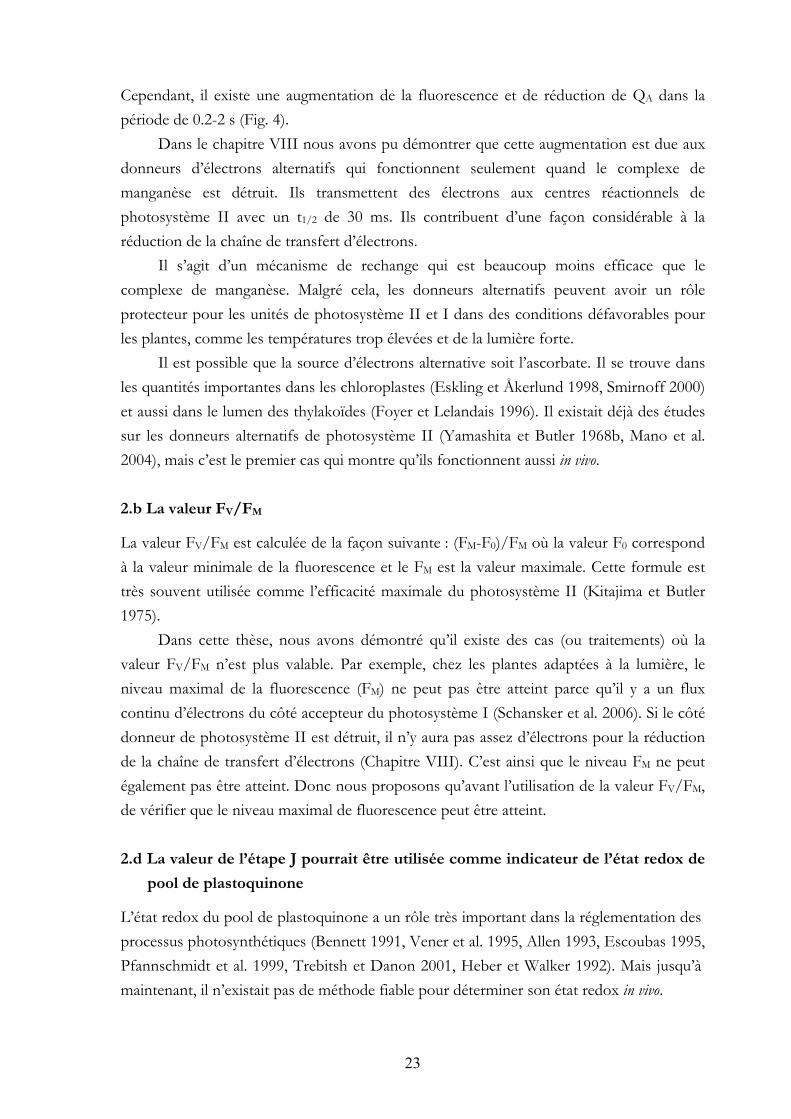
Cependant, il existe une augmentation de la fluorescence et de réduction de QA dans la période de 0.2-2 s (Fig. 4).
Dans le chapitre VIII nous avons pu démontrer que cette augmentation est due aux donneurs d’électrons alternatifs qui fonctionnent seulement quand le complexe de manganèse est détruit. Ils transmettent des électrons aux centres réactionnels de photosystème II avec un t1/2 de 30 ms. Ils contribuent d’une façon considérable à la réduction de la chaîne de transfert d’électrons.
Il s’agit d’un mécanisme de rechange qui est beaucoup moins efficace que le complexe de manganèse. Malgré cela, les donneurs alternatifs peuvent avoir un rôle protecteur pour les unités de photosystème II et I dans des conditions défavorables pour les plantes, comme les températures trop élevées et de la lumière forte.
Il est possible que la source d’électrons alternative soit l’ascorbate. Il se trouve dans les quantités importantes dans les chloroplastes (Eskling et Åkerlund 1998, Smirnoff 2000) et aussi dans le lumen des thylakoïdes (Foyer et Lelandais 1996). Il existait déjà des études sur les donneurs alternatifs de photosystème II (Yamashita et Butler 1968b, Mano et al. 2004), mais c’est le premier cas qui montre qu’ils fonctionnent aussi in vivo. 2.b La valeur FV/FM
La valeur FV/FM est calculée de la façon suivante : (FM-F0)/FM où la valeur F0 correspond à la valeur minimale de la fluorescence et le FM est la valeur maximale. Cette formule est très souvent utilisée comme l’efficacité maximale du photosystème II (Kitajima et Butler 1975).
Dans cette thèse, nous avons démontré qu’il existe des cas (ou traitements) où la valeur FV/FM n’est plus valable. Par exemple, chez les plantes adaptées à la lumière, le niveau maximal de la fluorescence (FM) ne peut pas être atteint parce qu’il y a un flux continu d’électrons du côté accepteur du photosystème I (Schansker et al. 2006). Si le côté donneur de photosystème II est détruit, il n’y aura pas assez d’électrons pour la réduction de la chaîne de transfert d’électrons (Chapitre VIII). C’est ainsi que le niveau FM ne peut également pas être atteint. Donc nous proposons qu’avant l’utilisation de la valeur FV/FM, de vérifier que le niveau maximal de fluorescence peut être atteint.
2.d La valeur de l’étape J pourrait être utilisée comme indicateur de l’état redox de
pool de plastoquinone
L’état redox du pool de plastoquinone a un rôle très important dans la réglementation des processus photosynthétiques (Bennett 1991, Vener et al. 1995, Allen 1993, Escoubas 1995, Pfannschmidt et al. 1999, Trebitsh et Danon 2001, Heber et Walker 1992). Mais jusqu’à maintenant, il n’existait pas de méthode fiable pour déterminer son état redox in vivo.
24
Nous avons pu développer une méthode simple. Elle est basée sur la cinétique de fluorescence, plus particulièrement sur l’étape J (Chapitre VI, Tóth et al. 2006a). Nous avons utilisé le fait que l’anaérobie induit une réduction graduelle de pool de plastoquinone.
Sous l’anaérobie la cinétique de la fluorescence change d’une façon considérable. La fluorescence initiale (F20µs), la pente initiale (F70µs-F20µs) et la valeur de fluorescence à l’étape J augmentent, et l’air au-dessus de la cinétique de fluorescence diminue. Nous avons aussi choisi un paramètre de transmission à 820 nm : le niveau de transmission mesuré après 10 s de lumière rouge lointaine. Des relations linéaires ont été trouvées entre ces paramètres, à l’exception de F20µs qui a donné une hyperbole avec les autres paramètres, probablement à cause de la connectivité des antennes de photosystèmes II (Joliot et Joliot 1964). Il est possible que les autres paramètres puissent servir d’indicateurs de l’état redox de pool de plastoquinone. Nous proposons que ce soit la valeur de fluorescence à l’étape J soit considérée car elle est la plus fiable et la plus simple à utiliser.
2.e La valeur F0 comme indicateur de l’état redox de QA au début d’une
illumination
La valeur F0 (F20µs plus précisément) peut être utilisée comme indicateur de l’état redox de QA au début d’une illumination. Cette méthode permet de suivre la cinétique de la réoxydation de QA après une illumination. Cette cinétique peut varier selon les espèces, les traitements ou le stress que la plante a subis. 3. CONCLUSIONS
La cinétique de fluorescence est très riche en information. Elle est liée au fait qu’il existe plusieurs facteurs et composants de la chaîne de transfert d’électrons qui peuvent l’influencer. Cette thèse a probablement beaucoup contribué à l’interprétation de la cinétique de fluorescence (voir aussi la liste de publications, page 11), son utilisation pourrait donc devenir plus sûre.
25
SUMMARY
Chl a fluorescence is one of the most wide-spread methods in photosynthesis research. It is a form of energy “waste” that may give information about photosynthetic activity and plant vitality. Chl a fluorescence originates mainly from PSII. It is generally assumed that in dark adapted samples the redox state of QA determines the fluorescence yield. The OJIP transient is the fast chl a fluorescence rise, measured at high light intensities (generally at 3000 µmol photons m-2s-1). The OJIP transient starts at O or F0 (minimum fluorescence, all QA is oxidized) and reaches a maximum called P or FM (all QA is reduced) in ~200 ms. The intermediate steps are called J and I and they are situated at ~2 ms and ~30 ms.
In spite of the prevalent use of chl a fluorescence, there is a number of questions concerning the interpretation. The main goal of this thesis was to contribute to the understanding of the OJIP transient and to extend its use. Most of the experiments were carried out on intact leaves. Several technical advancements of the Hansatech fluorometers helped this work: very strong (15000 µmol photons m-2s-1) or short (min. 100 µs) light pulses and simultaneous 820 nm transmission measurements (PEA Senior instrument).
In the presence of DCMU (3-(3’,4’-dichlorophenyl)-1,1-dimethylurea), the re-oxidation of QA- by forward electron transport is inhibited and FM is reached shortly after the OJ phase, which is the photochemical phase of the chl a fluorescence transient. In several publications it was found that a DCMU treatment causes a lowering of FM that has been attributed to quenching of fluorescence by the oxidized PQ-pool. In Chapter III it is shown that if the DCMU treatment is done in complete darkness and DCMU is allowed to diffuse slowly into the leaves, the F0 and FM values do not change. Simultaneous 820 nm transmission measurements (indicator of the redox state of PC and P700) have proven that in intact leaves the FM value is independent of the redox state of the PQ-pool. On the other hand, in vacuum-infiltrated leaf discs and in isolated thylakoid membranes the FM values decrease upon a DCMU treatment. It is concluded that the FM-decrease (i.e. PQ-pool quenching) is caused by a mechanical damage of the thylakoid membranes.
In Chapter IV it is shown that when fluorescence measurements are carried out on DCMU-treated samples that are not completely dark adapted, the initial slope of the OJ phase becomes considerably faster than that of the dark adapted sample. It seems as if QA-reduction became faster by increasing the initial amount of QA-. This phenomenon is explained by the connectivity of PSII units that allows energy transfer from closed to open reaction centers. By analyzing the area growth kinetics above the fluorescence transient, it is shown that antenna size heterogeneity of PSII units is also an important factor.
In Chapter V, the effects of dibromothymoquinone (DBMIB) and methylviologen (MV) on the OJIP transient were studied. DBMIB inhibits the re-oxidation of plastoquinol
26
by binding to the cyt b6f complex. MV accepts electrons at the acceptor side of PSI and it allows electrons to bypass the block that is transiently imposed by FNR (inactive in dark adapted leaves). In the presence of DBMIB, the IP phase disappears but the P (=FM) is not affected. MV suppresses the IP phase and the FM is not reached. These observations indicate that PSI-activity plays an important role in the kinetics of the OJIP transient. Two requirements for the IP phase are electron transfer beyond the cyt b6f complex (blocked by DBMIB) and a transient block at the acceptor side of PSI (bypassed by MV).
The plastoquinone (PQ) pool plays an important role in the regulation of the electron transport capacity and it forms a crossing point for several pathways of electron transport. In Chapter VI five parameters (F20µs, initial slope (F70µs-F20µs), FJ, area above the OJ phase and a 820 nm transmission parameter (I820nm-10s FR)) were evaluated with respect to their usefulness as indicators of the redox state of the PQ-pool. The redox state of the PQ-pool was manipulated in darkness by anaerobiosis. Four of the five parameters were linearly related to each other. The non-linearity between F20µs and the other four parameters is explained in terms of PSII antenna connectivity. The data show that the FJ value seems to be a reliable and simple indicator of the redox state of the PQ-pool.
In Chapter VII, the time course and mechanism of PSII recovery was investigated, using chl a fluorescence and other biophysical techniques. Leaves were subjected to heat pulses (50 °C for 20 or 40 s) to inhibit partially or fully oxygen evolution. The heat-treated samples were characterized by typical symptoms: decrease of FV/FM value, appearance of the K step (F~400 µs) in the fluorescence transient, loss of oxygen evolution, emergence of the AT thermoluminescence band and a strong increase in membrane permeability. In the first 4 h in the light following the heat pulse, the K step and the AT band disappeared indicating the loss of this restricted activity of PSII. This was followed by gradual recovery in the light. In darkness no recovery, except for the membrane permeability, was observed. A model is presented, which accounts for (i) the damage induced by the heat pulse on the membrane architecture and on the PSII donor side, (ii) the light-dependent removal of the impaired RCs from the disorganized membrane, and (iii) the light-independent restoration of the membrane permeability and the de novo synthesis of the PSII RCs in the light.
In Chapter VIII, electron transport processes were investigated in leaves of which the oxygen-evolution was fully inhibited by a heat pulse. The K step reflects partial QA reduction resulting from one charge separation. Additional QA- accumulation occurs after the K step in the 0.2-2 s time range. It is shown by simultaneous chl a fluorescence and 820 nm transmission measurements and applying short light pulses (5-ms light pulses spaced 2.3-500 ms apart) that alternative electron sources donate electrons to photosystem II with a t1/2 ~30 ms and they significantly contribute to the reduction of QA and the electron transport chain. Another requirement for the emergence of the fluorescence rise in the 0.2-2 s range is inactive ferredoxin-NADP+-reductase at the acceptor side of PSI.
27
CHAPTER I
I.1. INTRODUCTION TO PHOTOSYNTHETIC ELECTRON TRANSPORT PROCESSES
I.1.a Chloroplast structure
Life on Earth is driven essentially by photosynthetic solar energy conversion. Photosynthetic organisms use light energy for the synthesis of organic molecules. In the case of plants, algae and cyanobacteria oxygen is emitted into the atmosphere as a by-product of photosynthesis.
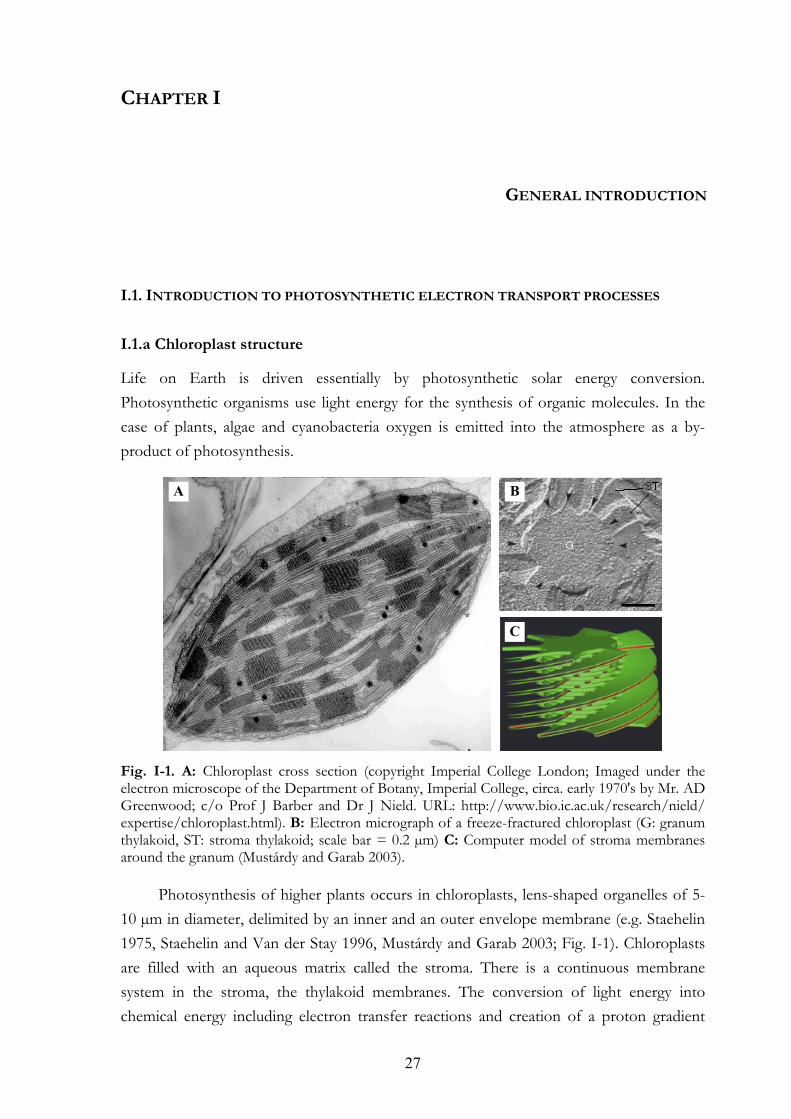
Fig. I-1. A: Chloroplast cross section (copyright Imperial College London; Imaged under the electron microscope of the Department of Botany, Imperial College, circa. early 1970's by Mr. AD Greenwood; c/o Prof J Barber and Dr J Nield. URL: http://www.bio.ic.ac.uk/research/nield/ expertise/chloroplast.html). B: Electron micrograph of a freeze-fractured chloroplast (G: granum thylakoid, ST: stroma thylakoid; scale bar = 0.2 µm) C: Computer model of stroma membranes around the granum (Mustárdy and Garab 2003).
Photosynthesis of higher plants occurs in chloroplasts, lens-shaped organelles of 5-10 µm in diameter, delimited by an inner and an outer envelope membrane (e.g. Staehelin 1975, Staehelin and Van der Stay 1996, Mustárdy and Garab 2003; Fig. I-1). Chloroplasts are filled with an aqueous matrix called the stroma. There is a continuous membrane system in the stroma, the thylakoid membranes. The conversion of light energy into chemical energy including electron transfer reactions and creation of a proton gradient
GENERAL INTRODUCTION
A
C
B
28
takes place in the thylakoid membranes. The thylakoid membranes are organized into grana (stacked) and stroma lamellae (unstacked). Grana are cylindrical in shape and consist of 10-20 layers that are interconnected by the stroma lamellae. Thylakoid membranes surround an inner aqueous phase, the thylakoid lumen.
The main protein complexes of the photosynthetic electron transport chain are photosystem II (PSII), the cytochrome (cyt) b6f complex, photosystem I (PSI) and ATP synthase. The majority of the PSII reaction centers (RC) with their main light-harvesting complex, LHCII, are located in the grana, whereas PSI and its light harvesting complex, the LHCI are found in the stroma membranes and grana margins. ATP synthase is located in the stroma membranes and cyt b6f complex may exist in both areas of the membrane (Andersson and Anderson 1980, recently reviewed by Dekker and Boekema 2005). I.1.b Structure of the main protein components of the photosynthetic electron
transport chain
The structure of PSII
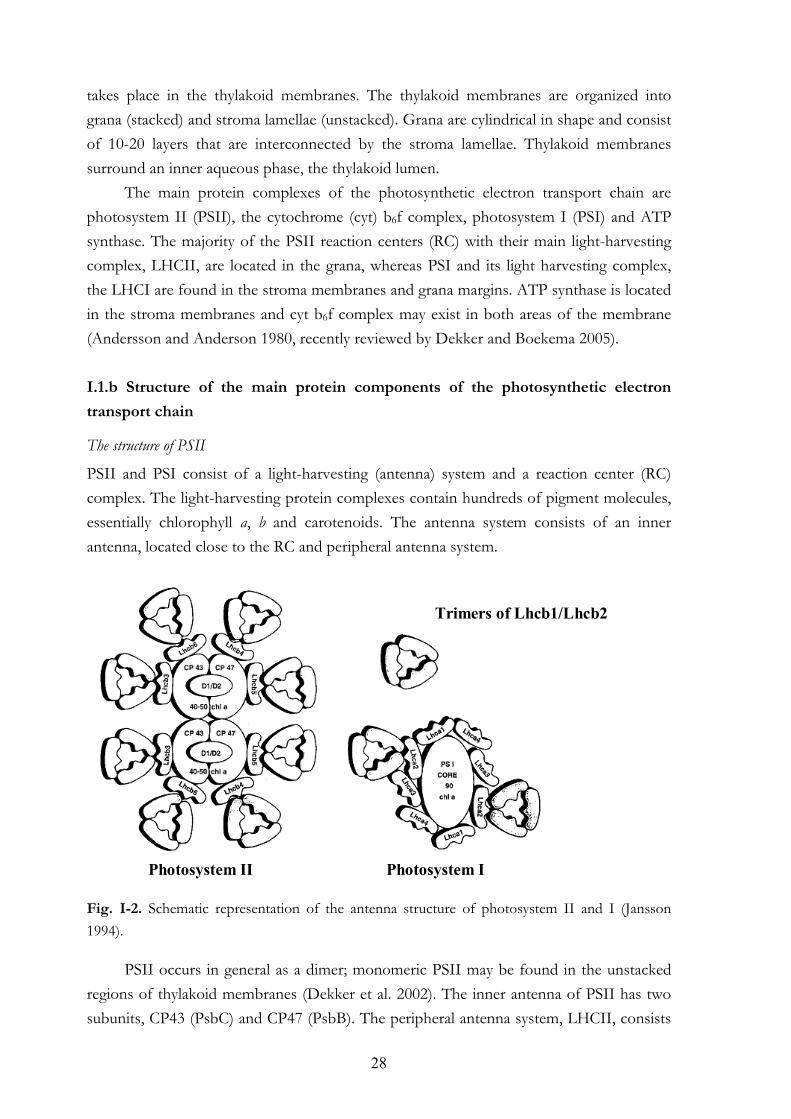
PSII and PSI consist of a light-harvesting (antenna) system and a reaction center (RC) complex. The light-harvesting protein complexes contain hundreds of pigment molecules, essentially chlorophyll a, b and carotenoids. The antenna system consists of an inner antenna, located close to the RC and peripheral antenna system.
Fig. I-2. Schematic representation of the antenna structure of photosystem II and I (Jansson 1994).
PSII occurs in general as a dimer; monomeric PSII may be found in the unstacked regions of thylakoid membranes (Dekker et al. 2002). The inner antenna of PSII has two subunits, CP43 (PsbC) and CP47 (PsbB). The peripheral antenna system, LHCII, consists
Trimers of Lhcb1/Lhcb2
Photosystem II Photosystem I
29
of several subunits (Fig. I-2A; Jansson 1994, Dekker and Boekema 2005 for reviews). The antenna size of PSII units is heterogeneous. The antenna size of the so-called α-centers is estimated to be 2-3-fold larger than that of the β-type centers. The β-centers form the smaller population of PSII units and they are probably located in the grana stacks (e.g. Melis and Homann 1975, section IV.2).
The PSII RC core is a heterodimer and it shows axial symmetry (Fig. I-3). It is formed by two protein subunits, D1 (PsbA) and D2 (PsbD). Four chl molecules are located in the center of the D1 and D2 subunits. The P1 and P2 chls are located between the D1 and D2 subunits. The P3 and P4 chl molecules (the accessory chls) are symmetrically situated on the D1 and D2 proteins. A pheophytine (Pheo) molecule is bound to the D1 protein and another one is bound to D2. The primary quinone acceptor molecule, QA, is located on the D2 protein, while the secondary quinone acceptor molecule, QB is on the D1 protein. There is a non-heme iron between them.
The donor side of PSII includes (1) two tyrosine residues, TyrZ (or YZ) and TyrD (YD) located on the D1 and D2 proteins, respectively, (2) a cluster of four Mn-ions with a Ca2+ and a Cl- that are bound mainly to the D1 protein (3) three extrinsic proteins that shield the manganese cluster from the lumen. In general, the term oxygen-evolving complex (OEC) or water-oxidizing complex (WOC) refers to the manganese cluster including its ligands together with the Ca2+ and Cl- cofactors and TyrZ.
Other components of the PSII RC are cyt b559, a two-subunit (PsbE and PsbF) heme protein and various small membrane intrinsic subunits (PsbH-PsbY).
In the last few years the inner core of PSII has been crystallized from the thermophilic cyanobacteria Thermosynechococcus elongatus and T. vulcanus and its three dimensional structure was determined at medium, 3.8-3.0 Å resolution (Zouni et al. 2001, Kamiya and Shen 2003, Ferreira et al. 2004, Biesiadka et al. 2004, Loll et al. 2005).
The structure of PSI
The peripheral antenna of PSI, LHCI consists of subunits Lhca1, Lhca2, Lhca3 that surround the PSI core. Trimers of Lhcb1/Lhcb2 may be connected to these subunits (Jansson 1994, Fig. I-2B). Similarly to PSII, the core of the PSI RC is also a heterodimer, formed by two subunits, the PsaA and PsaB proteins (Fig. I-3). The primary electron donor, P700 (probably a special chl a pair), is located between these two subunits. There are two nearly symmetrical branches in PSI, A and B. There is an ongoing discussion if only one or both of them are active (Fairclough et al. 2003, Cohen et al. 2004, Holzwarth et al. 2006). The primary stable electron acceptor is probably a monomeric chl a molecule, A0. The other electron acceptors are A1 (a phylloquinone molecule), three iron-sulfur proteins (FX, FB, FA), ferredoxin (Fd) and NADP+. The A0, A1 and FX are bound to the PsaA subunit, while the FA, FB are bound to PsaC, which is an extrinsic subunit of PSI.
30
The PsaD subunit provides the docking site for Fd on the stromal side. The electron donor to PSI is plastocyanin (PC); its docking site is formed by PsaF.
The crystal structures of cyanobacterial and plant PSI are available at high (2.5 Å) and medium (4.4 Å) resolutions, respectively (Jordan et al. 2001, Grotjohann et al. 2004, Ben-Shem et al. 2003, Fromme et al. 2006).
The structure of cyt b6f complex
The cyt b6f is a dimeric integral membrane protein complex. Cyt b6f contains three small and four large subunits: cyt b6, cyt f, Rieske iron-sulfur protein and subunit IV (Fig. I-3). The cyt b6 component contains two b-hemes: the low-potential b-heme is situated on the lumenal side and the high-potential b-heme molecule is on the stromal side. The redox active component of cyt f is a heme iron. The crystal structure of the cyt b6f complex is determined at medium (3-3.1 Å) resolution (Kurisu et al. 2003, Stroebel et al. 2003).
The structure of ATP synthase
The ATP synthase complex is composed of two major subunits, CF0 and CF1. The CF0 subunit spans the photosynthetic membrane and forms a proton channel through the membrane. The CF1 subunit is attached to the top of the CF0 on the stromal side of the membrane. CF1 is composed of several different protein subunits that contain also the catalytic sites for ATP synthesis. The structure of ATPase from beef heart mitochondria has been determined by Abrahams et al. (1994).
Mobile components of the photosynthetic electron transport chain
The mobile components (PQ, PC and Fd) of the electron transport chain connect PSII, cyt b6f complex, PSI and the Fd-NADP+-oxidoreductase (FNR). PQ molecules connect PSII units and the cyt b6f complex. They form a pool of 4-6 molecules per PSII RC in the hydrophobic core of the thylakoid membrane. In the stacked membrane the rapid diffusion of PQ is largely restricted to small domains formed by 1-2 PSII units. In the unstacked membranes larger domains are found for PQ diffusion (Kirchoff et al. 2000).
PC is a small (10.5 kDa) Cu-containing protein that shuttles between the cyt b6f complex and the PSI complex. There are 0.5-5 PC molecules per PSI RC (Klughammer and Schreiber 1991, Schöttler et al. 2004). Ferredoxins (Fd) are small (10.5-11 kDa) Fe2S-containing proteins located on the acceptor side of PSI.
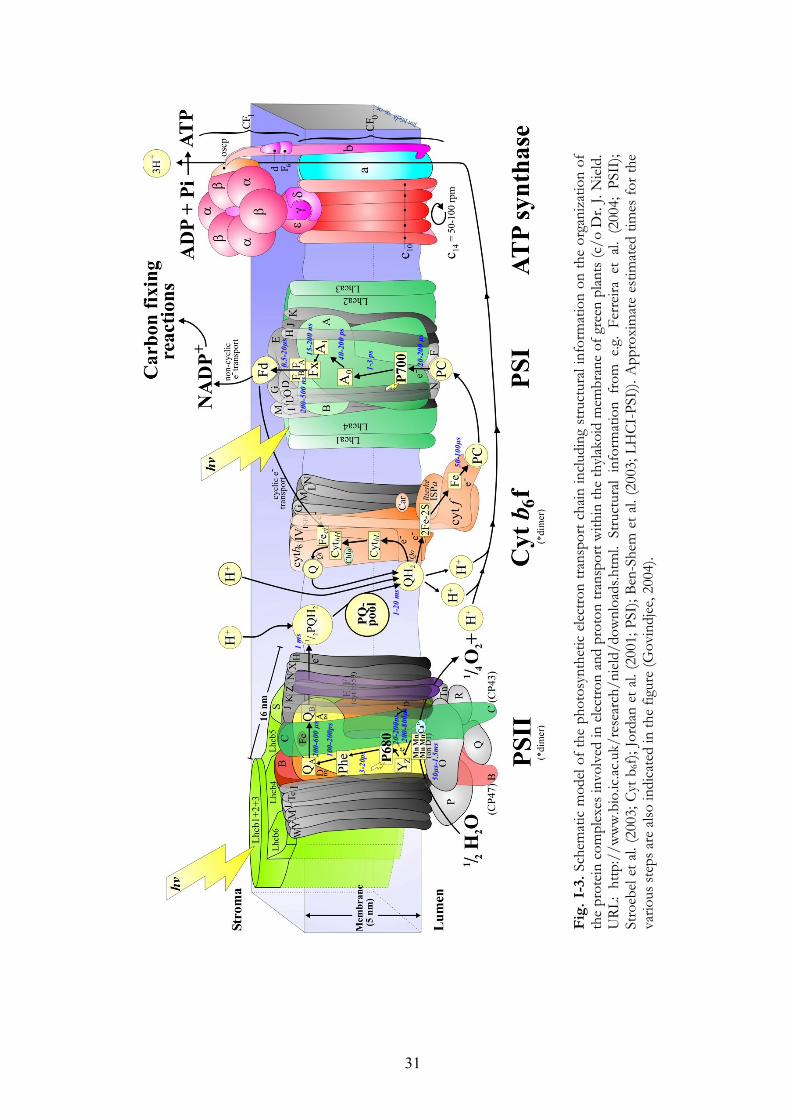
31
Fig
. I-
3. S
chem
atic
mod
el of
the
phot
osyn
thet
ic e
lectro
n tra
nspo
rt ch
ain in
clud
ing
stru
ctur
al in
form
atio
n on
the
orga
niza
tion
of
the
prot
ein
com
plex
es in
volv
ed in
elec
tron
and
prot
on tr
ansp
ort w
ithin
the
thyl
akoi
d m
embr
ane
of g
reen
plan
ts (c
/o D
r. J.
Nie
ld.
URL
: ht
tp:/
/ww
w.b
io.ic
.ac.u
k/re
sear
ch/n
ield
/dow
nloa
ds.h
tml.
Stru
ctur
al in
form
atio
n fr
om e
.g.
Ferr
eira
et
al. (
2004
; PS
II);
Stro
ebel
et a
l. (2
003;
Cyt
b6f)
; Jor
dan
et a
l. (2
001;
PSI
); Be
n-Sh
em e
t al.
(200
3; L
HCI
-PSI
)). A
ppro
xim
ate
estim
ated
tim
es fo
r the
va
rious
step
s are
also
indi
cate
d in
the
figur
e (G
ovin
djee
, 200
4).
50µs
-1.5
ms
3-20
ps
100-
200p
s
200-
600
µs
1 m
s
1-20
ms
50-1
00µs
1-3
ps
40-2
00 p
s
15-2
00 n
s 20
0-50
0 ns
20-2
00 µ
s
200-
800µ
s 20
-200
ns
0.5-
20µs
32
I.1.c Light absorption and photosynthetic electron transport
Plant photosynthesis is driven essentially by visible light (400-700 nm wavelengths). The first step in the conversion of light energy into chemical energy is the absorption of photons by the antenna system. Light absorption occurs in ~1 fs and causes a transition from the electronic ground state (S0) to an excited state (S1, S2, S3, etc.). Molecules go to the S1 state from the higher excitation states by loosing the extra energy as heat. Within the different excited states there are several vibrational sublevels. A part of the excitation energy is lost as heat during the transition to lower sublevels. Molecules can return from -in general- the lowest S1 sublevel to any S0 sublevel by heat or light emission, which is called fluorescence. Fluorescence is emitted at longer wavelengths than the absorption wavelengths because of the partial de-excitation (see above; for more details see Nobel 1991, Clegg 2004).
The excitation energy of a chl molecule has a high probability of being transferred by resonance energy transfer to a neighbor chl molecule. The antenna systems serve the RCs of PSII and PSI, where the excitation energy can induce charge separations. This charge separation is reversible and therefore the excitation energy may return to the antenna and be lost as heat or fluorescence (e.g. Schatz et al. 1987, Cinque et al. 2000, Renger et al. 2001, Gobets and Van Grondelle 2002).
Upon charge separation, an electron is transferred from the primary electron donor to Pheo. It was generally believed that the primary electron donor, P680, is a dimer, formed by the P1-P2 chls. However, recent structural studies (Zouni et al. 2001, Kamiya and Shen 2003, Ferreira et al. 2004, Biesiadka et al. 2004) showed that the two chls cannot be strongly excitonically coupled and therefore they should be regarded as monomers. According to Fromme et al. (2006) the cationic radical state (P680+•) may be localized on P1, whereas the excited state P680* may be delocalized among all four chls. At low temperature, the P3 chl molecule has been postulated as being the primary electron donor (Prokhorenko and Holzwarth 2000).
In PSI, P700* gives an electron to A0, producing P700+ and A0-. These reactions take a few ps. Subsequent electron transfer steps are energetically downhill and they gradually decrease the probability of charge recombination.
P680+ is re-reduced by TyrZ (time constant 20 ns-200 µs). TyrZ+ is in turn re-reduced by the Mn-cluster in 200-800 µs. The final source of electrons is water. The OEC has 5 oxidation states (S0, S1, S2, S3 and S4). The advancement from the S0 to S4 states (i.e. the removal of four electrons) is driven by photochemical reactions. Upon the splitting of water in the S4 state the OEC spontaneously reverts to the S0 state and an O2 molecule is released. During a complete cycle of the OEC, four protons are released into the lumen. These reactions take place in 50-1500 µs. One of the most exciting and most debated research fields in photosynthesis is the mechanism of water oxidation. For recent reviews
33
on the OEC, see Goussias et al. 2002, Carrel et al. 2002, Britt et al. 2004, Rutherford et al. 2004, Petrouleas et al. 2005.
Following a charge separation the electron is transferred through a series of redox reactions to PSI where it can serve as the electron source for a second charge separation (see Fig. I-3). In PSII, the electron transfer from Pheo- to QA takes ~200 ps. QB can accept two electrons from QA. The transfer of the first and the second electron takes 100-200 µs and 400-600 µs, respectively. QB2- compensates its negative charge by taking two protons from the stroma and then it leaves its binding site. PQH2 (QBH2) molecules diffuse to the cyt b6f complex where the electrons are passed on to the Rieske protein (an FeS protein) and then to cyt f. The re-oxidation of PQ is accompanied by a release of two protons into the lumen. These protons contribute to the proton motive force (pmf, see below) across the membrane. It is generally assumed that the slowest step in the electron transport chain is the re-oxidation of PQH2 by the cyt b6f complex. This step involves the diffusion of PQH2, its oxidation by FeS and the consequent release of two protons into the lumen.
According to the Q-cycle theory (Hope 2000, Crofts 2004, Allen 2004, Osyczka et al. 2005, see also Fig. I-3), only one of the two electrons that PQH2 can donate goes to the Rieske FeS protein whereas the other one is transferred to the low and then to the high potential cyt b6 heme. On re-oxidation of a second PQH2 molecule both hemes become reduced and a PQ molecule on the stromal side of cyt b6f is doubly reduced. The PQ2--molecule picks up two protons from the stromal side and diffuses to the lumen side of the cyt b6f complex. This way the Q-cycle increases the number of protons released into the lumen per transferred electrons.
Electron transfer from cyt f to PC occurs in 50-100 µs and PC passes the electron on to P700+ in 20-200 µs. The electron on A0 is passed to A1 (the time constant is 40-200 ps), several FeS-clusters (15-500 ns), Fd (0.5-20 µs), the FNR enzyme and finally to NADP+ (Fig. I-3).
PSI is able to work also independently of PSII. In the case of the PSI cyclic electron transfer, an electron is transferred from Fd or from NADPH (Bendall and Manasse 1995, Joët et al. 2002a, Munekage et al. 2002, Bukhov and Carpentier 2004, Havaux et al. 2005) to NAD(P)H dehydrogenase (NDH) or ferredoxin-quinone oxidoreductase (FQR) that are possibly bound to the cyt b6f complex. These enzymes can reduce PQ and from there the electrons are transferred back to P700. Cyclic electron transfer mediates the transfer of protons from stroma to lumen.
The converted solar energy is stored in the form of NADPH and ATP that provide energy for CO2 assimilation. The ATP synthase uses the trans-thylakoid electrochemical gradient of protons (also termed proton motive force, pmf) to create ATP from inorganic phosphate and ADP. The pmf comprises the proton gradient (∆pH) and electric field (∆ψ) across the thylakoid membrane created by water oxidation, the reduction and oxidation of
34
plastoquinone molecules and charge separations in the RCs. For recent reviews on the function of the ATP synthase, see Stock et al. (2000), Avenson et al. (2005).
Atmospheric CO2-assimilation (i.e. the Calvin-Benson cycle) occurs in the stroma and involves a series of enzymatic reactions. One of the most important steps of the Calvin-Benson cycle is catalyzed by the protein Rubisco (D-ribulose 1,5-bisphosphate carboxylase/oxygenase), the most abundant protein on the Earth.
I.2. INTRODUCTION TO CHLOROPHYLL A FLUORESCENCE
Photosynthesis is one of the most important metabolic processes in plants; therefore, measuring its activity provides information also about the general “health status” of the plant. In photosynthesis research, chl a fluorescence is one of the most widespread methods, both in basic and ecophysiological studies (Papageorgiou and Govindjee 2004). It is a non-invasive and very sensitive method, though chl a fluorescence represents only 2-10% of the absorbed energy. It can be applied to any kind of photosynthetic sample from global scale down to PSII particles without the need of standardized or complicated preparations. The fluorescence signal is affected by many factors; therefore, it can provide a lot of information, but this also complicates its interpretation. I.2.a Approaches to measure chl a fluorescence
Chl a fluorescence transients
According to our nomenclature, chl a fluorescence transient is the fluorescence of a photosynthetic sample measured with continuous illumination. The same light source (in general red light, ~650 nm peak wavelength) serves for excitation of the photosynthetic sample and fluorescence induction. Fluorescence is emitted at longer wavelengths (see section I.1.c) therefore it is possible to separate fluorescence emission from the excitation light by applying optical filters. This technique is also called direct fluorescence. In general, measurements are carried out on dark-adapted leaves and they last ~1 s.
In the case of PSII RCs containing oxidized QA (open RCs) ~2% of the absorbed light is emitted as fluorescence whereas PSII RCs containing reduced QA (closed RCs) the yield of fluorescence emission is ~8-10% (Trissl et al. 1993). Several minutes of dark adaptation is needed prior to measurements for the opening of RCs. During continuous illumination, fluorescence rises from the minimum yield F0 or O (open state) to a peak fluorescence level (FP) as RCs are getting closed by charge separations occurring in PSII. Then the fluorescence intensity decreases through intermediate steps (S, M) in a few minutes until a final steady state level (T) is reached.
35
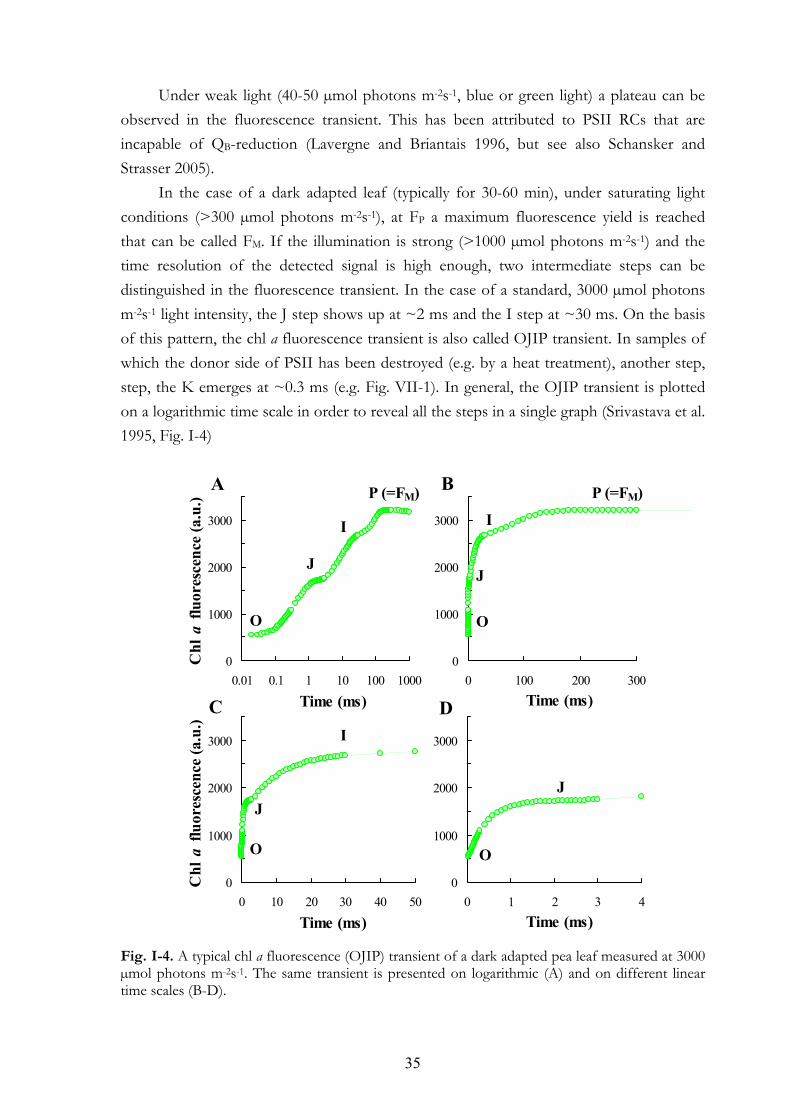
Under weak light (40-50 µmol photons m-2s-1, blue or green light) a plateau can be observed in the fluorescence transient. This has been attributed to PSII RCs that are incapable of QB-reduction (Lavergne and Briantais 1996, but see also Schansker and Strasser 2005).
In the case of a dark adapted leaf (typically for 30-60 min), under saturating light conditions (>300 µmol photons m-2s-1), at FP a maximum fluorescence yield is reached that can be called FM. If the illumination is strong (>1000 µmol photons m-2s-1) and the time resolution of the detected signal is high enough, two intermediate steps can be distinguished in the fluorescence transient. In the case of a standard, 3000 µmol photons m-2s-1 light intensity, the J step shows up at ~2 ms and the I step at ~30 ms. On the basis of this pattern, the chl a fluorescence transient is also called OJIP transient. In samples of which the donor side of PSII has been destroyed (e.g. by a heat treatment), another step, step, the K emerges at ~0.3 ms (e.g. Fig. VII-1). In general, the OJIP transient is plotted on a logarithmic time scale in order to reveal all the steps in a single graph (Srivastava et al. 1995, Fig. I-4)
Fig. I-4. A typical chl a fluorescence (OJIP) transient of a dark adapted pea leaf measured at 3000 µmol photons m-2s-1. The same transient is presented on logarithmic (A) and on different linear time scales (B-D).
0
1000
2000
3000
0.01 0.1 1 10 100 1000
J
I
O
0
1000
2000
3000
0 100 200 300
J
I
O
0
1000
2000
3000
0 10 20 30 40 50
J
I
O
0
1000
2000
3000
0 1 2 3 4
J
O
Time (ms) Time (ms)
Time (ms) Time (ms)
P (=FM) P (=FM)
Chl
a fl
uore
scen
ce (a
.u.)
Chl
a fl
uore
scen
ce (a
.u.)
A B
C D
36
The chl a fluorescence transient with high time resolution was measured first by Morin (1964) and Delosme (1967). Delosme used a setup where a fast shutter (5 µs opening time) was created by using a gun whose bullet blew away a metal plate isolating the sample and the light source. He could distinguish one intermediate step that was called i. The i step appeared at ~2 ms and this probably corresponds to our J step. The I step was not detected by Delosme (1967).
Schreiber et al. (1986) and Schreiber and Vidaver (1987) using a PAM fluorometer (see the section below) detected two intermediate steps, which they called I1 and I2. The shutter opening time of this instrument was ~800 µs and the F0 was determined by the modulated measuring beam in the absence of actinic light.
The opening time of the shutter has limited the detection of the fluorescence signal for a long time. In the PEA instrument (Hansatech Instruments Ltd, Norfolk, UK) there is no shutter, light emitting diodes (LEDs) serve as a light source and they reach their maximum light intensity within a few µs. With this instrument it became possible to measure the complete fluorescence transient at high light intensity (up to 3000 µmol photons m-2s-1), high time resolution and with a very good signal-to-noise ratio (Strasser and Govindjee 1992a, Strasser et al. 1995). The first reliably measured point in the chl a fluorescence transient was at 50 µs and the J and I steps were detected. Strasser et al. (1995) showed that these steps correspond to the I1 and I2 steps of the chl a fluorescence transient measured by Schreiber et al (1986). In the last 10 years, the term OJIP transient became accepted.
Pulse-amplitude-modulation (PAM) fluorometry and the quenching analysis method
The pulse-amplitude-modulation (PAM) fluorometry is mainly used for light adaptation and steady state experiments (Fig. I-5). In the case of PAM fluorometry the light that serves for excitation of the photosynthetic sample (actinic light) is different from the light source used for detecting the fluorescence (measuring light). Fluorescence is detected by non-actinic modulated light consisting of very short (µs-range) pulses. For closing PSII RCs strong light pulses are applied. These so-called saturating pulses are similar in length (200-800 ms) and intensity to a standard light pulse used for inducing the OJIP transient, but the maximum light intensity is reached much more slowly. The advantage of the PAM-fluorometry over the direct fluorescence technique is that fluorescence yield is detected and not intensity (fluorescence intensity is proportional to the excitation light intensity therefore it can vary by several orders of magnitude).
Schreiber et al. introduced the PAM fluorometer made by Walz (Effeltrich, Germany) in 1986. This instrument was essentially the same as the measuring system used today; only the intensity and the quality of the saturating pulses were changed (from 6000 µmol photons m-2 s-1 white light to 10000 µmol photons m-2 s-1 red light) in order to ensure full closure of all RCs.
37
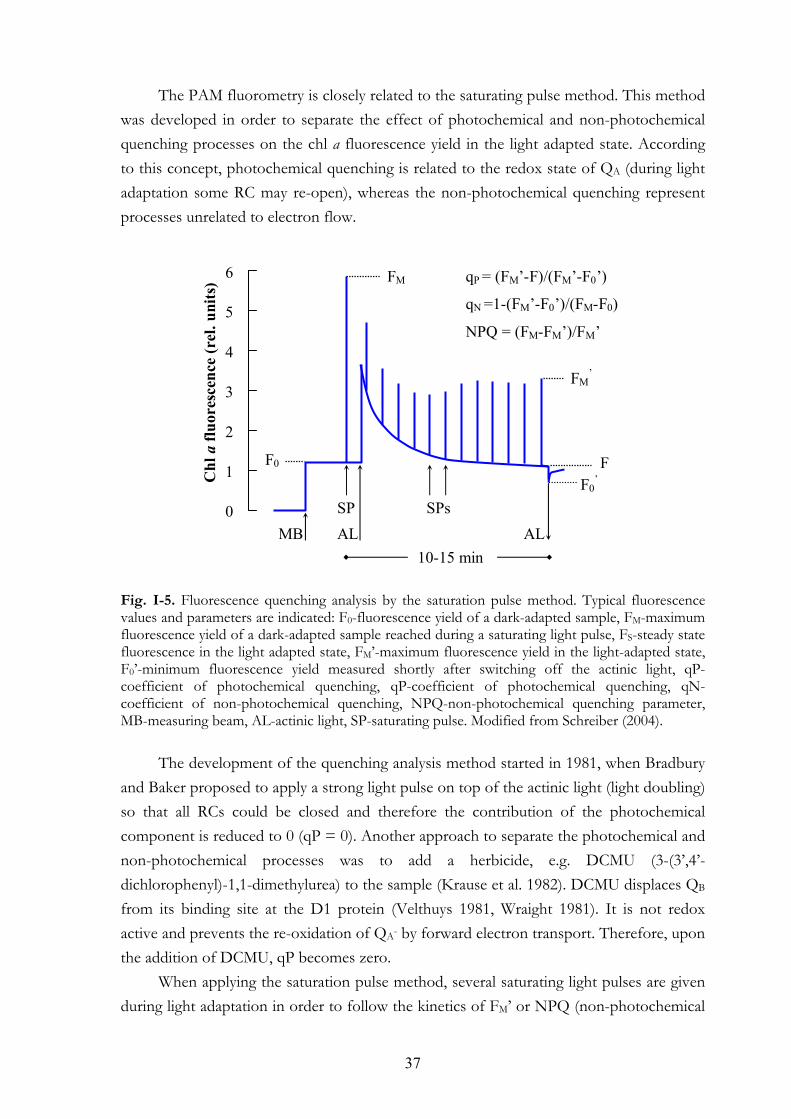
The PAM fluorometry is closely related to the saturating pulse method. This method was developed in order to separate the effect of photochemical and non-photochemical quenching processes on the chl a fluorescence yield in the light adapted state. According to this concept, photochemical quenching is related to the redox state of QA (during light adaptation some RC may re-open), whereas the non-photochemical quenching represent processes unrelated to electron flow.
Fig. I-5. Fluorescence quenching analysis by the saturation pulse method. Typical fluorescence values and parameters are indicated: F0-fluorescence yield of a dark-adapted sample, FM-maximum fluorescence yield of a dark-adapted sample reached during a saturating light pulse, FS-steady state fluorescence in the light adapted state, FM’-maximum fluorescence yield in the light-adapted state, F0’-minimum fluorescence yield measured shortly after switching off the actinic light, qP-coefficient of photochemical quenching, qP-coefficient of photochemical quenching, qN-coefficient of non-photochemical quenching, NPQ-non-photochemical quenching parameter, MB-measuring beam, AL-actinic light, SP-saturating pulse. Modified from Schreiber (2004).
The development of the quenching analysis method started in 1981, when Bradbury
and Baker proposed to apply a strong light pulse on top of the actinic light (light doubling) so that all RCs could be closed and therefore the contribution of the photochemical component is reduced to 0 (qP = 0). Another approach to separate the photochemical and non-photochemical processes was to add a herbicide, e.g. DCMU (3-(3’,4’-dichlorophenyl)-1,1-dimethylurea) to the sample (Krause et al. 1982). DCMU displaces QB from its binding site at the D1 protein (Velthuys 1981, Wraight 1981). It is not redox active and prevents the re-oxidation of QA- by forward electron transport. Therefore, upon the addition of DCMU, qP becomes zero.
When applying the saturation pulse method, several saturating light pulses are given during light adaptation in order to follow the kinetics of FM’ or NPQ (non-photochemical
FM
FM’
F0 F F0
’
MB SP AL AL
SPs
10-15 min
0
3
2
1
4
5
6 qP = (FM’-F)/(FM’-F0’)
qN =1-(FM’-F0’)/(FM-F0)
NPQ = (FM-FM’)/FM’
Chl
a fl
uore
scen
ce (r
el. u
nits
)
38
quenching parameter). After 10-15 min of light adaptation the actinic light is switched off and after 1-3 s of darkness or FR-light illumination, the F0’ can be determined. FM’ and F0’ are used for calculating a coefficient of photochemical (qP) and non-photochemical quenching (qN). A theoretical treatment of this approach has been presented by Havaux et al. (1991).
The non-photochemical quenching processes have different components that may be analyzed on the basis of the dark-relaxation kinetics (Demmig and Winter 1988, Horton and Hague 1988). The fastest component, referred to as qE, relaxes during the first 100 s of dark adaptation. It is related to the pH of the lumen and sensitive to the presence of zeaxanthin (e.g. Horton and Hague 1988). The slowest component relaxing over many hours, qI, is thought to be related to processes like photoinhibition that necessitate the re-synthesis of the D1 protein although other slowly relaxing processes may also be involved (reviewed in Krause and Jahns 2004). The medium component, qT, has a dark-relaxation halftime of ~8 min. It has been associated with (de)phosphorylation of LHCII. However, we have shown the qT-component of non-photochemical quenching is related to an activated photosystem I acceptor side (Schansker et al. 2006).
The pulse-amplitude-modulation (PAM) fluorometry is widely used today, especially in ecophysiological research. It can be useful in for assessment of stress-induced damage of photosynthetic organisms. For a recent review on this technique, see Schreiber (2004).
The pump-and-probe technique and the fast repetition rate (FRR) fluorescence method
In the case of the pump-and-probe technique and the fast repetition rate (FRR) fluorescence methods, the maximum fluorescence yield (FST) is determined by a single turnover flash. The idea is that with such a flash only QA becomes reduced and the redox state of the PQ-pool is not affected. The FST is ~30-35% lower than the FM measured with multiple turnover pulses.
Measuring chl a fluorescence as a function of the number of single turnover flashes can provide a lot of information about the donor side of PSII (Ioannidis et al. 2000) and electron transport processes between QA and QB (Kramer et al. 1990, Crofts et al. 1992).
The single turnover pump flash of the pump-and-probe technique is a few µs long and its intensity is variable. The re-oxidation of QA- is followed on a µs to ms time scale by the fluorescence yield induced by a probe flash. By varying the intensity of the pump flash from 0 to saturating light, the F0, FST (the maximum fluorescence yield that can be achieved with a single turnover saturating flash) and functional absorbance cross-section of PSII (σPSII, that is used as a direct measure of the PS II effective light harvesting efficiency; Ley and Mauzerall 1982) can be determined.
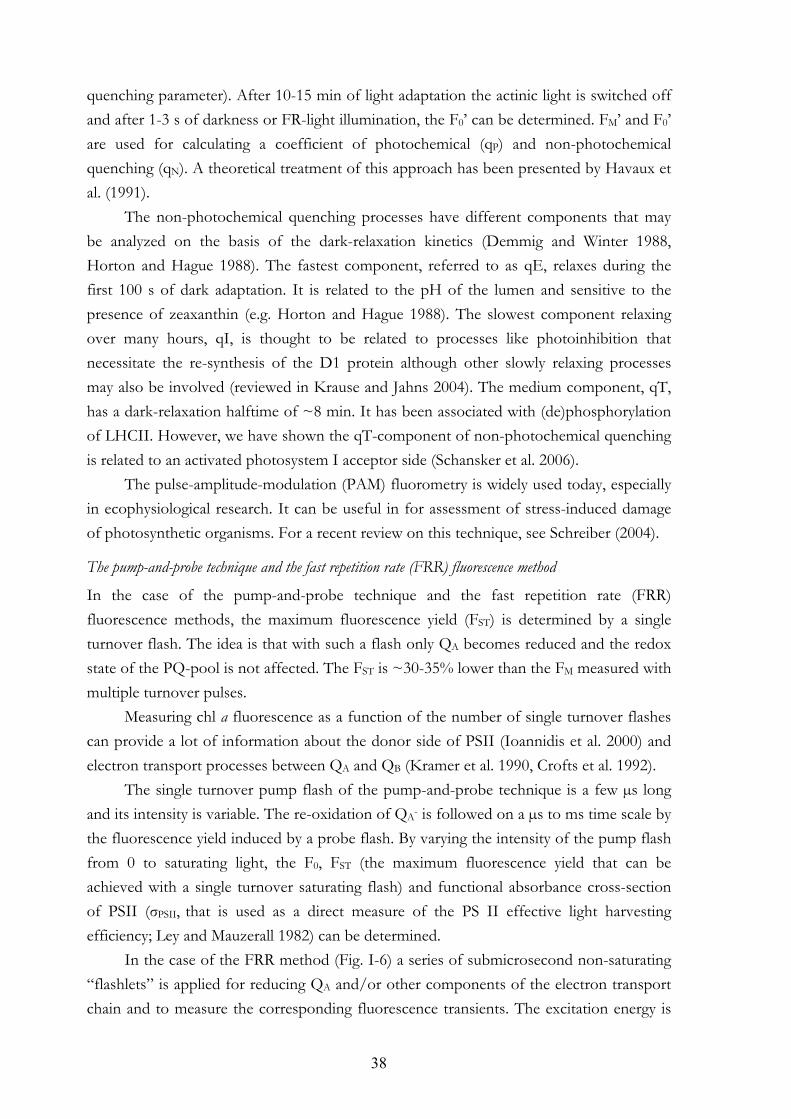
In the case of the FRR method (Fig. I-6) a series of submicrosecond non-saturating “flashlets” is applied for reducing QA and/or other components of the electron transport chain and to measure the corresponding fluorescence transients. The excitation energy is
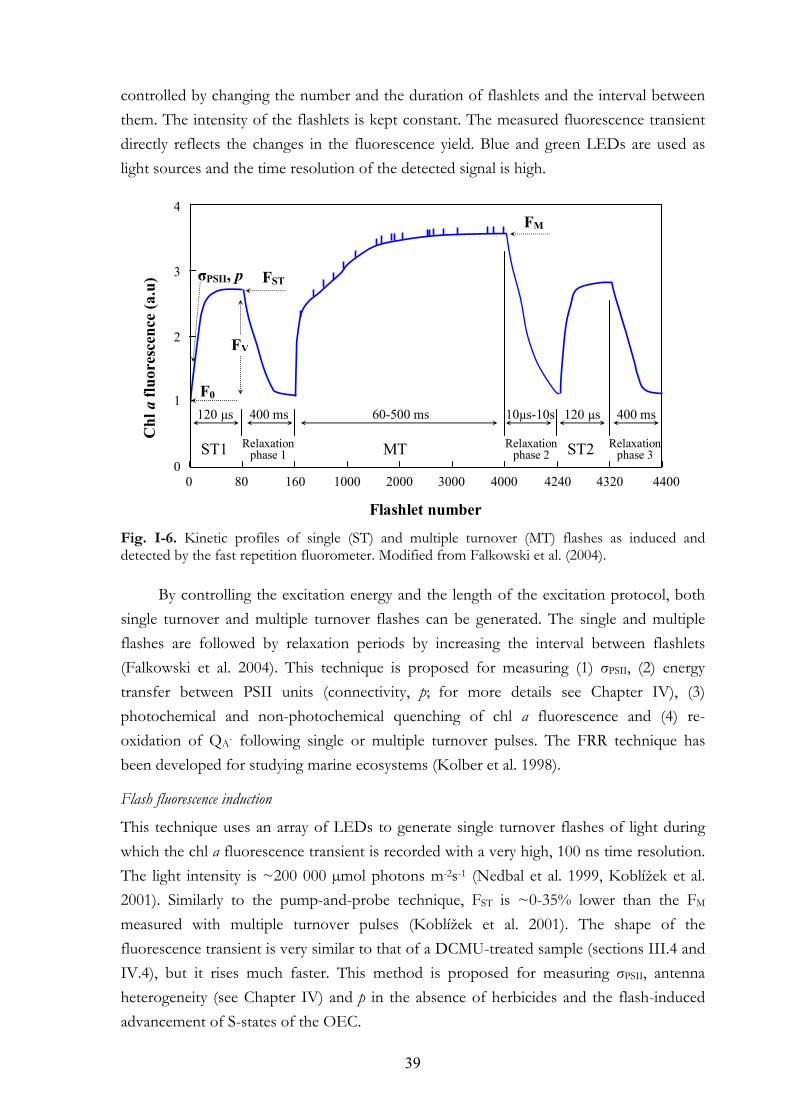
39
controlled by changing the number and the duration of flashlets and the interval between them. The intensity of the flashlets is kept constant. The measured fluorescence transient directly reflects the changes in the fluorescence yield. Blue and green LEDs are used as light sources and the time resolution of the detected signal is high. Fig. I-6. Kinetic profiles of single (ST) and multiple turnover (MT) flashes as induced and detected by the fast repetition fluorometer. Modified from Falkowski et al. (2004).
By controlling the excitation energy and the length of the excitation protocol, both
single turnover and multiple turnover flashes can be generated. The single and multiple flashes are followed by relaxation periods by increasing the interval between flashlets (Falkowski et al. 2004). This technique is proposed for measuring (1) σPSII, (2) energy transfer between PSII units (connectivity, p; for more details see Chapter IV), (3) photochemical and non-photochemical quenching of chl a fluorescence and (4) re-oxidation of QA- following single or multiple turnover pulses. The FRR technique has been developed for studying marine ecosystems (Kolber et al. 1998).
Flash fluorescence induction
This technique uses an array of LEDs to generate single turnover flashes of light during which the chl a fluorescence transient is recorded with a very high, 100 ns time resolution. The light intensity is ~200 000 µmol photons m-2s-1 (Nedbal et al. 1999, Koblížek et al. 2001). Similarly to the pump-and-probe technique, FST is ~0-35% lower than the FM measured with multiple turnover pulses (Koblížek et al. 2001). The shape of the fluorescence transient is very similar to that of a DCMU-treated sample (sections III.4 and IV.4), but it rises much faster. This method is proposed for measuring σPSII, antenna heterogeneity (see Chapter IV) and p in the absence of herbicides and the flash-induced advancement of S-states of the OEC.
MT ST2 ST1
FST
F0 60-500 ms400 ms 400 ms120 µs 10µs-10s 120 µs
FV
Relaxation phase 1
Relaxation phase 3
Relaxation phase 2
σPSII, p
4
3
1
2
0 0 80 160 1000 2000 3000 4240 4000 4400 4320
Chl
a fl
uore
scen
ce (a
.u)
Flashlet number
FM
40
Picosecond and subpicosecond time-resolved fluorescence techniques
In the case of (sub-)ps fluorescence experiments a photosynthetic sample is excited by a very short (a few ns) laser pulse which is followed by fluorescence measurements. Decay kinetics can be collected at any particular fluorescence yield level (i.e. F0, FST, FM). The response times of the different instruments are 30 ps (single-photon-timing), 3 ps (synchroscan streak camera) or 100 fs (fluorescence upconversion).
Energy transfer steps between neighboring chls are detectable with the fastest fluorescence method, fluorescence upconversion (Du et al. 1993, Kennis et al. 2001) or with fs transient absorption. Energy equilibration among chls in the antenna and the overall trapping process of the photosynthetic unit can be studied by a combination of the above-mentioned three techniques.
The simulation of the obtained fluorescence decay data with a suitable descriptive analysis or kinetic model is essential in the use of this technique (Van Grondelle and Gobets 2004, Bruce and Vasil’ev 2004, Clegg 2004).
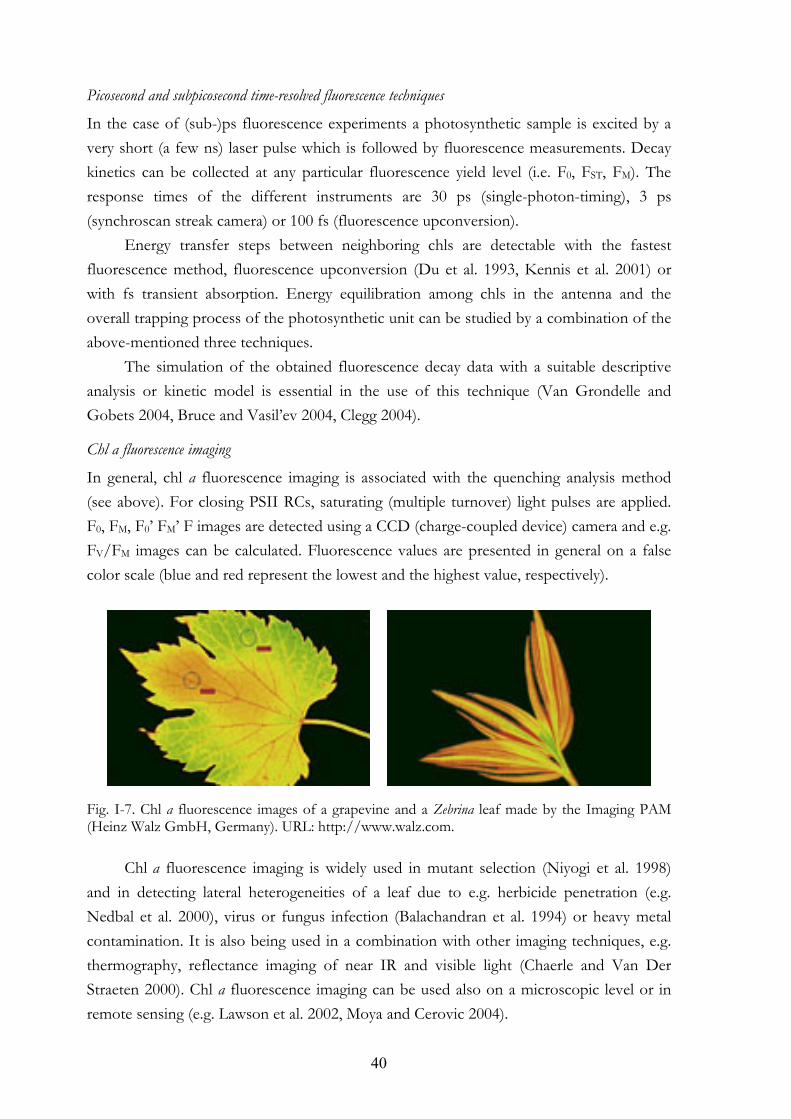
Chl a fluorescence imaging
In general, chl a fluorescence imaging is associated with the quenching analysis method (see above). For closing PSII RCs, saturating (multiple turnover) light pulses are applied. F0, FM, F0’ FM’ F images are detected using a CCD (charge-coupled device) camera and e.g. FV/FM images can be calculated. Fluorescence values are presented in general on a false color scale (blue and red represent the lowest and the highest value, respectively).
Fig. I-7. Chl a fluorescence images of a grapevine and a Zebrina leaf made by the Imaging PAM (Heinz Walz GmbH, Germany). URL: http://www.walz.com.
Chl a fluorescence imaging is widely used in mutant selection (Niyogi et al. 1998) and in detecting lateral heterogeneities of a leaf due to e.g. herbicide penetration (e.g. Nedbal et al. 2000), virus or fungus infection (Balachandran et al. 1994) or heavy metal contamination. It is also being used in a combination with other imaging techniques, e.g. thermography, reflectance imaging of near IR and visible light (Chaerle and Van Der Straeten 2000). Chl a fluorescence imaging can be used also on a microscopic level or in remote sensing (e.g. Lawson et al. 2002, Moya and Cerovic 2004).
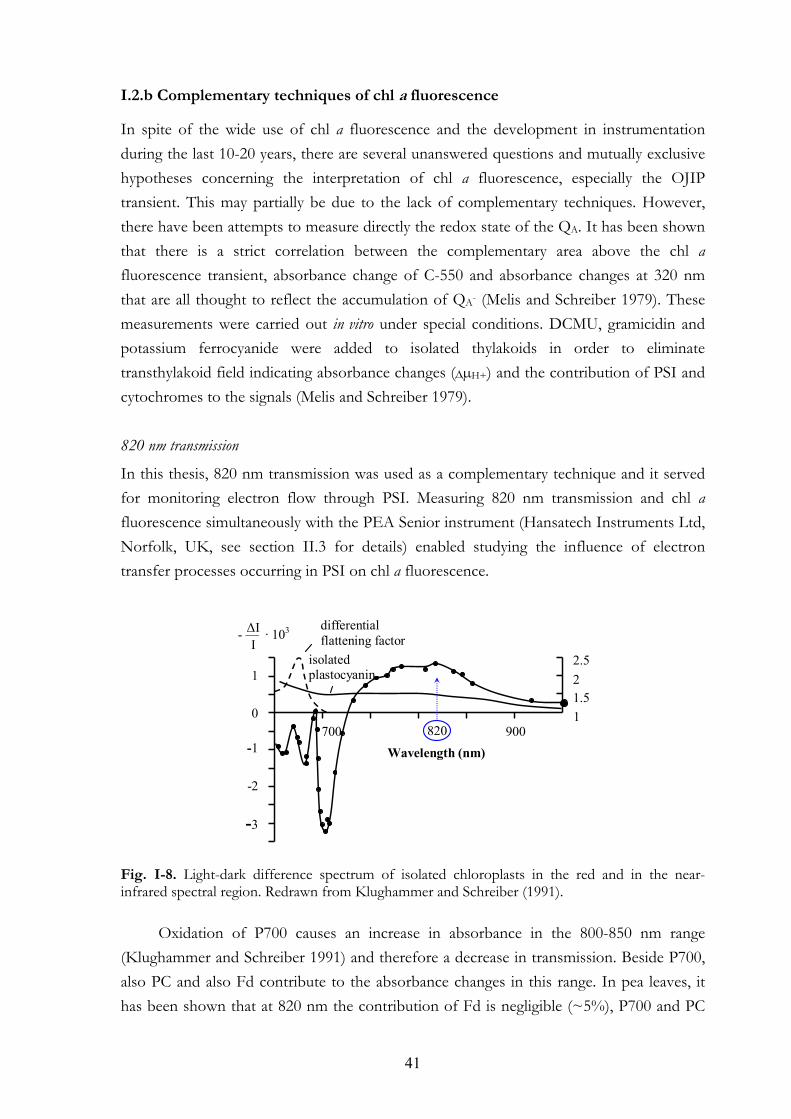
41
I.2.b Complementary techniques of chl a fluorescence
In spite of the wide use of chl a fluorescence and the development in instrumentation during the last 10-20 years, there are several unanswered questions and mutually exclusive hypotheses concerning the interpretation of chl a fluorescence, especially the OJIP transient. This may partially be due to the lack of complementary techniques. However, there have been attempts to measure directly the redox state of the QA. It has been shown that there is a strict correlation between the complementary area above the chl a fluorescence transient, absorbance change of C-550 and absorbance changes at 320 nm that are all thought to reflect the accumulation of QA- (Melis and Schreiber 1979). These measurements were carried out in vitro under special conditions. DCMU, gramicidin and potassium ferrocyanide were added to isolated thylakoids in order to eliminate transthylakoid field indicating absorbance changes (дµH+) and the contribution of PSI and cytochromes to the signals (Melis and Schreiber 1979). 820 nm transmission
In this thesis, 820 nm transmission was used as a complementary technique and it served for monitoring electron flow through PSI. Measuring 820 nm transmission and chl a fluorescence simultaneously with the PEA Senior instrument (Hansatech Instruments Ltd, Norfolk, UK, see section II.3 for details) enabled studying the influence of electron transfer processes occurring in PSI on chl a fluorescence.
Fig. I-8. Light-dark difference spectrum of isolated chloroplasts in the red and in the near-infrared spectral region. Redrawn from Klughammer and Schreiber (1991).
Oxidation of P700 causes an increase in absorbance in the 800-850 nm range (Klughammer and Schreiber 1991) and therefore a decrease in transmission. Beside P700, also PC and also Fd contribute to the absorbance changes in this range. In pea leaves, it has been shown that at 820 nm the contribution of Fd is negligible (~5%), P700 and PC
1
2 1.5
2.5
700 900
-3
1
-2
-1
0
Wavelength (nm)
differential flattening factor
isolated plastocyanin
∆I I
- — · 103
820
42
contribute equally to the signal (Schansker et al. 2003). PC is a fast electron donor to P700+: the t1/2 for a bound PC is 10-20 µs and the t1/2 for free PC is ~200 µs (Haehnel et al. 1980). This means that during a light pulse, most of the P700 will remain reduced until all PC is oxidized. In this thesis, 820 nm transmission measurements were used to monitor the flow of electrons through PSI and for this, the relative contribution of PC and P700 is less important. On the other hand, the fact that P700 and also PC contribute to the 820 nm signal would be a real complication for the determination of the maximum quantum yield of PSI.
820 nm light is not actinic; therefore monitoring absorbance or transmission changes near 820 nm is a convenient way to follow redox changes of P700 and PC also in continuous light (Harbinson and Woodward 1987, Schreiber et al. 1998, Harbinson and Hedley 1993). Technical details of the PEA Senior instrument can be found in section II.3. I.3. THE AIMS AND THE ESSENTIAL RESULTS OF THIS THESIS
One aim of this thesis is to contribute to the understanding of the OJIP transient (Part 1). The PEA Senior instrument and several technical advancements of the Hansatech fluorometers helped our work (Chapter II). Most of the experiments were carried out on intact leaves in order to avoid the possible side-effects caused by isolation procedures.
Several issues have been brought into question concerning the chl a fluorescence, even the FV/FM value as an indicator of the maximum quantum yield of primary photochemistry (e.g. Falkowski et al. 2004). This is mainly because of the lower FM value measured with single turnover light pulses and the quenching of fluorescence by the oxidized PQ-pool. Vernotte et al. (1979) showed that the oxidized PQ-pool quenches fluorescence in isolated thylakoid membranes. This would mean that not only the redox state of the QA (open or closed PSII RCs), but the redox state of the PQ-pool directly influences the fluorescence yield. As the extent of PQ-pool quenching is about the same as the amplitude of the IP-phase, it was thought that the removal of the PQ-pool is responsible for this phase (e.g. Neubauer and Schreiber 1987, Lazár et al. 1998). In Chapter III it is shown that PQ-pool quenching does not occur in intact leaves, only in isolated thylakoid membranes or vacuum-infiltrated leaves.
The effect of PSII antenna heterogeneity on chl a fluorescence was investigated in Chapter IV. When fluorescence measurements are carried out on a pre-illuminated sample in the presence of DCMU, the initial slope of the OJ phase becomes considerably steeper than that of a dark-adapted sample. It seems as if QA-reduction became faster by increasing the initial amount of QA-. In Chapter IV it is shown that this phenomenon may be partially explained by the connectivity of PSII units that allows energy transfer from closed to open RCs and that antenna size heterogeneity of PSII units is also an important factor.
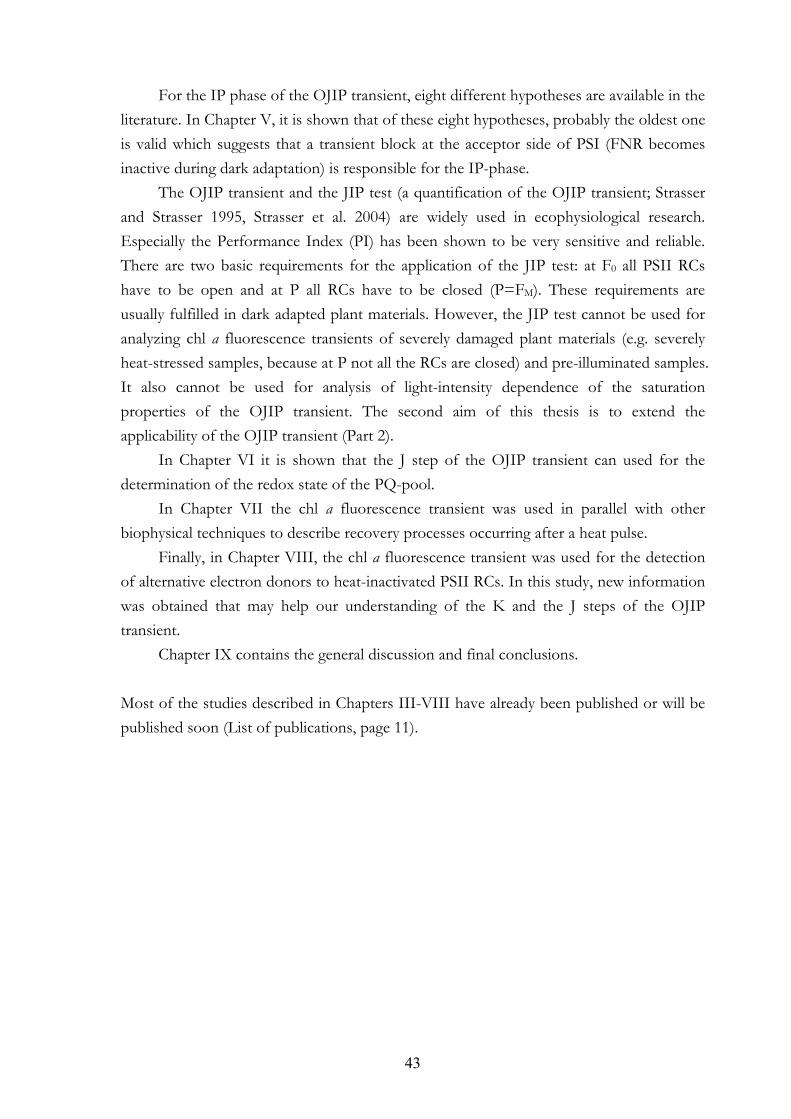
43
For the IP phase of the OJIP transient, eight different hypotheses are available in the literature. In Chapter V, it is shown that of these eight hypotheses, probably the oldest one is valid which suggests that a transient block at the acceptor side of PSI (FNR becomes inactive during dark adaptation) is responsible for the IP-phase.
The OJIP transient and the JIP test (a quantification of the OJIP transient; Strasser and Strasser 1995, Strasser et al. 2004) are widely used in ecophysiological research. Especially the Performance Index (PI) has been shown to be very sensitive and reliable. There are two basic requirements for the application of the JIP test: at F0 all PSII RCs have to be open and at P all RCs have to be closed (P=FM). These requirements are usually fulfilled in dark adapted plant materials. However, the JIP test cannot be used for analyzing chl a fluorescence transients of severely damaged plant materials (e.g. severely heat-stressed samples, because at P not all the RCs are closed) and pre-illuminated samples. It also cannot be used for analysis of light-intensity dependence of the saturation properties of the OJIP transient. The second aim of this thesis is to extend the applicability of the OJIP transient (Part 2).
In Chapter VI it is shown that the J step of the OJIP transient can used for the determination of the redox state of the PQ-pool.
In Chapter VII the chl a fluorescence transient was used in parallel with other biophysical techniques to describe recovery processes occurring after a heat pulse.
Finally, in Chapter VIII, the chl a fluorescence transient was used for the detection of alternative electron donors to heat-inactivated PSII RCs. In this study, new information was obtained that may help our understanding of the K and the J steps of the OJIP transient.
Chapter IX contains the general discussion and final conclusions.
Most of the studies described in Chapters III-VIII have already been published or will be published soon (List of publications, page 11).

44
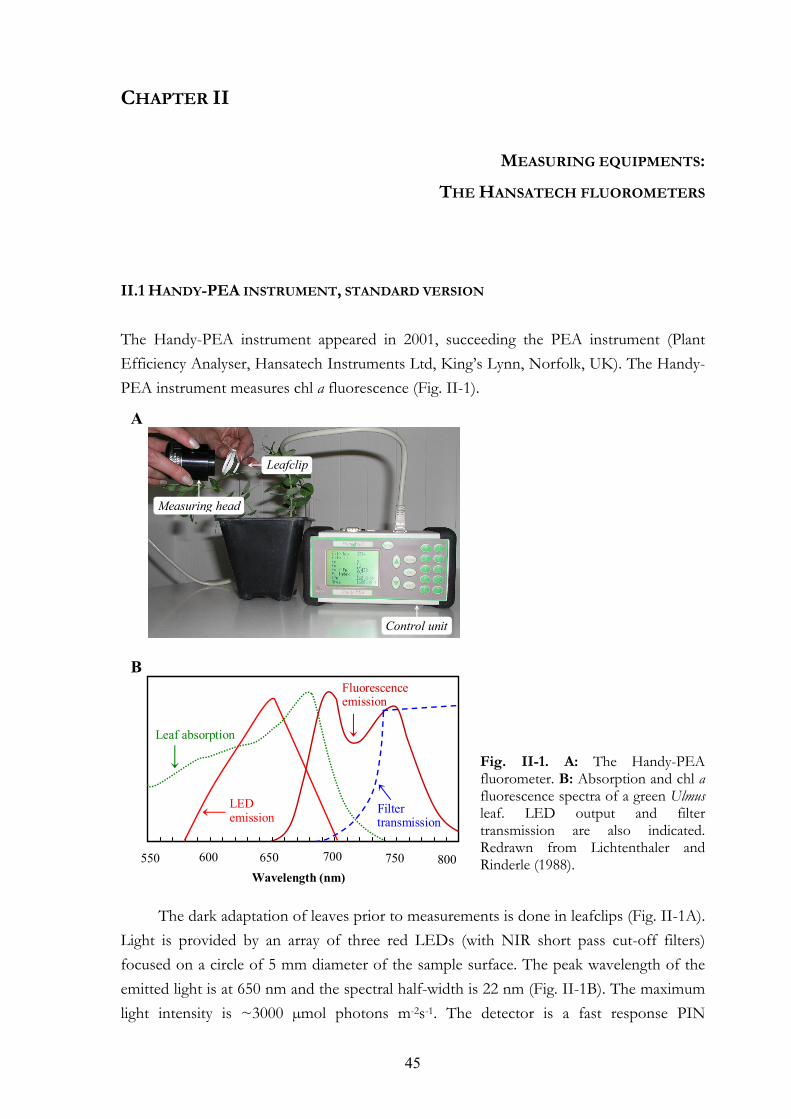
45
CHAPTER II
II.1 HANDY-PEA INSTRUMENT, STANDARD VERSION
The Handy-PEA instrument appeared in 2001, succeeding the PEA instrument (Plant Efficiency Analyser, Hansatech Instruments Ltd, King’s Lynn, Norfolk, UK). The Handy-PEA instrument measures chl a fluorescence (Fig. II-1).
Fig. II-1. A: The Handy-PEA fluorometer. B: Absorption and chl a fluorescence spectra of a green Ulmus leaf. LED output and filter transmission are also indicated. Redrawn from Lichtenthaler and Rinderle (1988).
The dark adaptation of leaves prior to measurements is done in leafclips (Fig. II-1A).
Light is provided by an array of three red LEDs (with NIR short pass cut-off filters) focused on a circle of 5 mm diameter of the sample surface. The peak wavelength of the emitted light is at 650 nm and the spectral half-width is 22 nm (Fig. II-1B). The maximum light intensity is ~3000 µmol photons m-2s-1. The detector is a fast response PIN
MEASURING EQUIPMENTS:
THE HANSATECH FLUOROMETERS
800 550 600 700 650 750
Fluorescence emission
Filter transmission
LED emission
Leaf absorption
Wavelength (nm)
A
B
Leafclip
Control unit
Measuring head
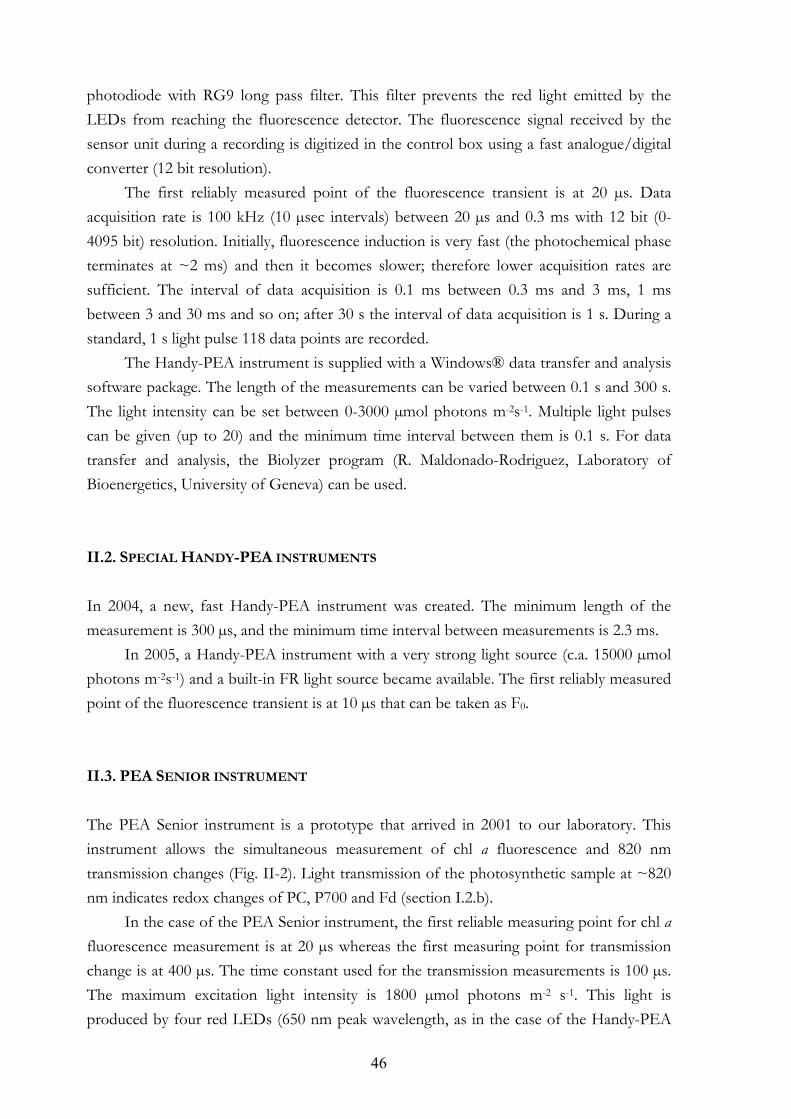
46
photodiode with RG9 long pass filter. This filter prevents the red light emitted by the LEDs from reaching the fluorescence detector. The fluorescence signal received by the sensor unit during a recording is digitized in the control box using a fast analogue/digital converter (12 bit resolution).
The first reliably measured point of the fluorescence transient is at 20 µs. Data acquisition rate is 100 kHz (10 µsec intervals) between 20 µs and 0.3 ms with 12 bit (0-4095 bit) resolution. Initially, fluorescence induction is very fast (the photochemical phase terminates at ~2 ms) and then it becomes slower; therefore lower acquisition rates are sufficient. The interval of data acquisition is 0.1 ms between 0.3 ms and 3 ms, 1 ms between 3 and 30 ms and so on; after 30 s the interval of data acquisition is 1 s. During a standard, 1 s light pulse 118 data points are recorded.
The Handy-PEA instrument is supplied with a Windows® data transfer and analysis software package. The length of the measurements can be varied between 0.1 s and 300 s. The light intensity can be set between 0-3000 µmol photons m-2s-1. Multiple light pulses can be given (up to 20) and the minimum time interval between them is 0.1 s. For data transfer and analysis, the Biolyzer program (R. Maldonado-Rodriguez, Laboratory of Bioenergetics, University of Geneva) can be used. II.2. SPECIAL HANDY-PEA INSTRUMENTS
In 2004, a new, fast Handy-PEA instrument was created. The minimum length of the measurement is 300 µs, and the minimum time interval between measurements is 2.3 ms.
In 2005, a Handy-PEA instrument with a very strong light source (c.a. 15000 µmol photons m-2s-1) and a built-in FR light source became available. The first reliably measured point of the fluorescence transient is at 10 µs that can be taken as F0. II.3. PEA SENIOR INSTRUMENT
The PEA Senior instrument is a prototype that arrived in 2001 to our laboratory. This instrument allows the simultaneous measurement of chl a fluorescence and 820 nm transmission changes (Fig. II-2). Light transmission of the photosynthetic sample at ~820 nm indicates redox changes of PC, P700 and Fd (section I.2.b).
In the case of the PEA Senior instrument, the first reliable measuring point for chl a fluorescence measurement is at 20 µs whereas the first measuring point for transmission change is at 400 µs. The time constant used for the transmission measurements is 100 µs. The maximum excitation light intensity is 1800 µmol photons m-2 s-1. This light is produced by four red LEDs (650 nm peak wavelength, as in the case of the Handy-PEA
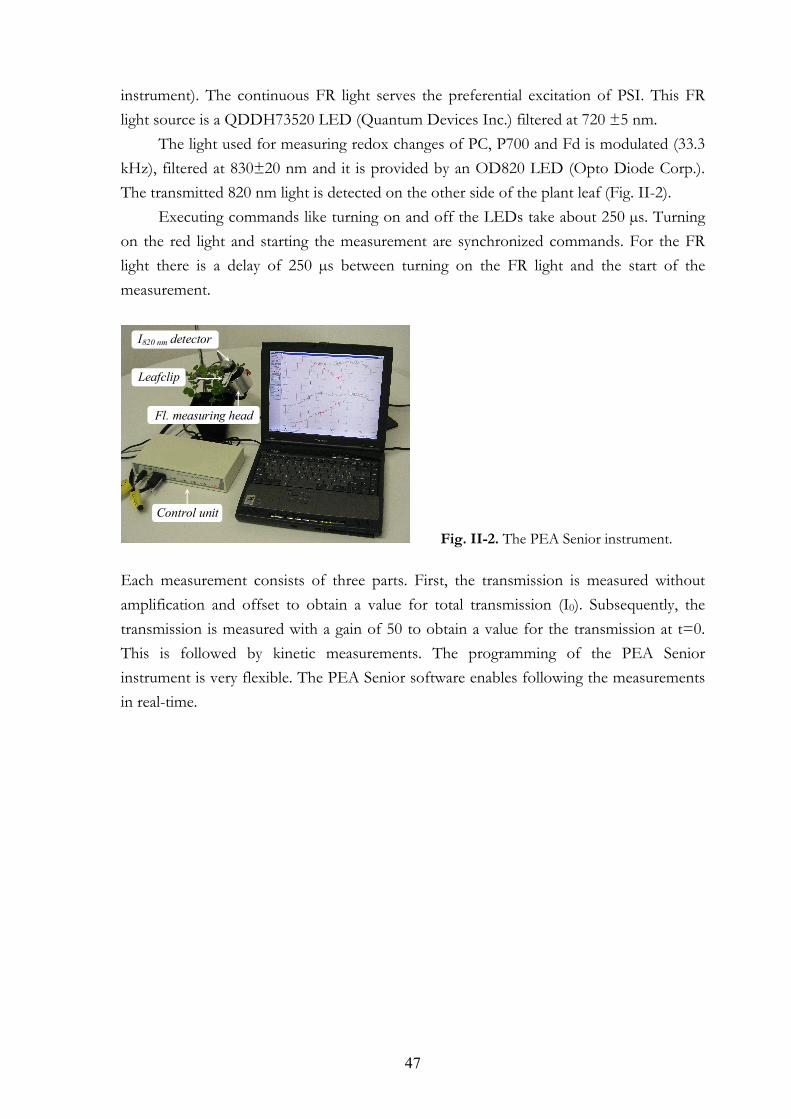
47
instrument). The continuous FR light serves the preferential excitation of PSI. This FR light source is a QDDH73520 LED (Quantum Devices Inc.) filtered at 720 ±5 nm.
The light used for measuring redox changes of PC, P700 and Fd is modulated (33.3 kHz), filtered at 830±20 nm and it is provided by an OD820 LED (Opto Diode Corp.). The transmitted 820 nm light is detected on the other side of the plant leaf (Fig. II-2).
Executing commands like turning on and off the LEDs take about 250 µs. Turning on the red light and starting the measurement are synchronized commands. For the FR light there is a delay of 250 µs between turning on the FR light and the start of the measurement.
Fig. II-2. The PEA Senior instrument.
Each measurement consists of three parts. First, the transmission is measured without amplification and offset to obtain a value for total transmission (I0). Subsequently, the transmission is measured with a gain of 50 to obtain a value for the transmission at t=0. This is followed by kinetic measurements. The programming of the PEA Senior instrument is very flexible. The PEA Senior software enables following the measurements in real-time.
I820 nm detector
Leafclip
Fl. measuring head
Control unit

48
49
PART I.
STUDIES ON THE CHL A FLUORESCENCE (OJIP) TRANSIENT

50
51
CHAPTER III
A slightly different version of this chapter has been published in: Tóth SZ, Schansker G, Strasser RJ (2005) Biochim Biophys Acta 1708: 275-282.
III.1. SUMMARY
The effects of DCMU (3-(3’,4’-dichlorophenyl)-1,1-dimethylurea) on the OJIP transient were re-investigated. Upon DCMU treatment the F0 and FM values did not change when the treatment was done in complete darkness and DCMU was allowed to diffuse slowly into the leaves (by application via stem or submersion). Simultaneous 820 nm transmission measurements showed that in DCMU-treated samples, the PQ-pool remained oxidized during the light pulses whereas in uninhibited leaves the FM level coincided with a fully reduced electron transport chain. The identical FM values with and without DCMU indicate that in intact leaves the FM value is independent of the redox state of the PQ-pool. Moreover, the generally observed F0 increase is probably due to the presence of (even very weak) light during the DCMU treatment; vacuum-infiltration of leaf discs leads to a drastic decrease of the fluorescence yield and in DCMU-treated samples the FM decreases to the FI value of their control (leaves vacuum-infiltrated with 1% ethanol); in thylakoid membranes, the addition of DCMU lowers the FM relative to that of a control sample.
III.2. INTRODUCTION
DCMU 3-(3’,4’-dichlorophenyl)-1,1-dimethylurea) has been applied in many studies on chl a fluorescence. It displaces QB from its binding site at the D1 protein (Velthuys 1981, Wraight 1981). DCMU is not redox active and prevents the re-oxidation of QA- by forward electron transport. This leads to a considerable simplification of the OJIP transient: the J and I steps disappear and the FM is reached after ~2 ms (= J step).
IN INTACT LEAVES, THE MAXIMUM FLUORESCENCE VALUE
(FM) IS INDEPENDENT OF THE REDOX STATE OF
THE PLASTOQUINONE POOL
52
The F0 and FM values of the fluorescence transient are used to determine the maximum quantum yield of primary photochemistry [φPo = FV/FM = kP/(kP+kN), where kP and kN are rate constants of photochemistry and other losses of excitation energy, respectively] (Kitajima and Butler 1975). Modification of the FM and F0 values in the presence of DCMU would imply a change in the de-excitation rate constants (kP and kN).
Indeed, it has been observed that the addition of DCMU to thylakoid membranes increases the F0 and decreases the FM values. The observed increase of F0 in the presence of DCMU was first explained as a transformation of a part of the active PSII-centers into a non-quenching form (Bennoun and Li 1973). Later on, it was shown that in thylakoids QB- can be found in some of the RCs even after a long dark adaptation (Laasch et al. 1983, Rutherford et al. 1984) and that the addition of DCMU leads to a back-transfer of electrons from QB- to QA and therefore F0 increases (Velthuys and Amesz 1974, Rutherford et al. 1982, Van Gorkom 1986). The decrease of FM has been attributed to the quenching of fluorescence due to the presence of an oxidized PQ-pool (Vernotte et al. 1979, Neubauer and Schreiber 1987, Hsu and Lee 1995, Haldimann and Tsimilli-Michael 2005). Since the redox state of the PQ-pool changes from oxidized to reduced during a saturating pulse in non-DCMU-inhibited samples, the occurrence of PQ-pool quenching would undermine the basic assumption that the redox state of QA is the main factor that determines the fluorescence yield during a saturating pulse (this is used for the quenching analysis method (Schreiber et al. 1986, Van Kooten and Snel 1990) and also for the JIP test (Strasser and Strasser 1995, Strasser et al. 2004)). It has therefore been argued that a correct FM-determination is only possible using a single turnover flash that does not affect the PQ-pool redox status (Falkowski et al. 1994, Prášil et al. 1996). A good overview of the present positions on this issue can be found in two recent publications (Schreiber 2004, Falkowski et al. 2004, section I.2.a).
An alternative interpretation was provided by Vredenberg and Bulychev (2002) to explain the lower FM value of DCMU-treated samples. They proposed that the fluorescence yield is increased by the build-up of a photo-electrochemical field and the decrease of the FM to the FI value in the presence of DCMU is due to the absence of the electrochemical field.
In our study, the effects of DCMU on the OJIP transient were re-investigated in different experimental systems (non-detached leaves, leaf discs, vacuum-infiltrated leaf discs and isolated thylakoids) to understand the results published in the literature better. The results show that in DCMU-treated intact leaves the same F0 and FM values can be obtained as in untreated leaves. The decrease of the FM value observed in vacuum-infiltrated leaves and isolated thylakoid membranes is suggested to be caused by treatment-induced damage to the thylakoid membranes and/or PSII.
53
III.3. MATERIALS AND METHODS
III.3.a Plant material
Measurements were carried out on mature leaves of 2-4 weeks old pea plants (Pisum sativum L. cv. Ambassador). Plants were grown in greenhouse where the temperature was 20-25°C during the day and ~14°C at night. Barley (Hordeum vulgare L. cv. Triangel) was grown under the same conditions and for the experiments leaves of seven-day-old seedlings were used. Other plants species (clover -Trifolium repens L. and chickweed -Stellaria media L.) were collected in late summer, around the laboratory. III.3.b Thylakoid isolation
Thylakoids were isolated from mature leaves of 2-week-old pea plants. The leaf tissue was homogenized in 40 mM HEPES buffer (pH 7.5) containing 0.4 M sucrose, 1% (w/v) bovine serum albumin (BSA), 5 mM MgCl2, 15 mM NaCl, 2 mM Na2-EDTA (bisodium-ethylenediaminetetraacetic acid). The homogenate was filtered through two layers of fine nylon mesh and centrifuged at 3000 g for 5 min. The plastid pellet was re-suspended in the same buffer and was centrifuged at 3000 g for 5 min. Then the membrane pellet was re-suspended in 40 mM HEPES buffer (pH 7.5) containing 0.4 M sucrose, 5 mM MgCl2 and 15 mM NaCl. The chl content was adjusted (Porra et al. 1989) to 200 µg ml-1. Thylakoids were kept on ice in darkness and were used within 3 hours after isolation. III.3.c DCMU treatments
Submersion of non-detached leaves
Pea plants were put in darkness for ~1 h before the DCMU treatment, and then pairs of leaves were placed into small trays (without detaching them from the plant) filled with 10 ml DCMU solution (if not stated otherwise, the DCMU concentration was 200 µM, and the solution contained 1% ethanol, which was used to dissolve the DCMU). For controls, leaves were submerged in 1% ethanol or left untreated. The duration of the treatment was ~14 h, and it was carried out in complete darkness. Following the treatment, leaves were removed from the DCMU-solution (still not detached and in darkness), wiped and left in the air for ~1 h to avoid possible effects of anaerobiosis. The experimental setup for this type of DCMU treatment is shown in Fig. III-1A.
DCMU treatment via the stem
Stems or leaves (5-8 cm long, cut under water) of different plant species were placed in a DCMU solution of 50 µM, for ~30 h, in complete darkness. For control measurements, stems were placed in 0.25 % ethanol. The experimental setup is shown in Fig. III-1B.
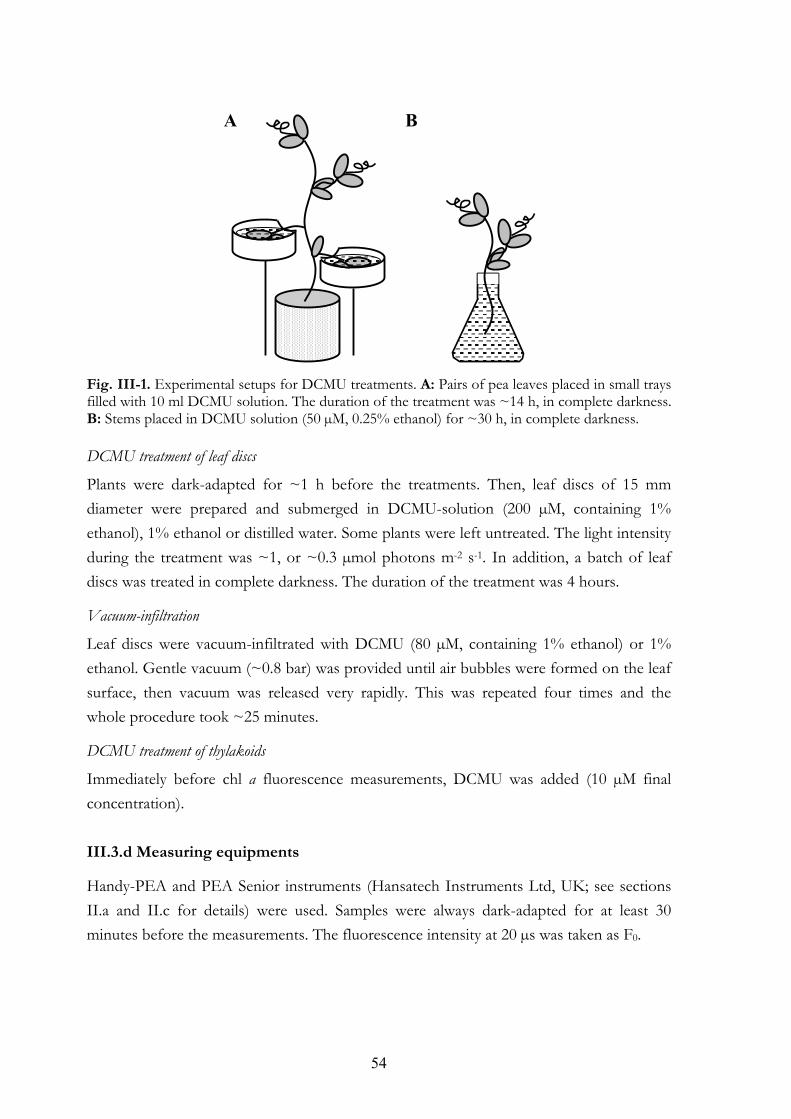
54
Fig. III-1. Experimental setups for DCMU treatments. A: Pairs of pea leaves placed in small trays filled with 10 ml DCMU solution. The duration of the treatment was ~14 h, in complete darkness. B: Stems placed in DCMU solution (50 µM, 0.25% ethanol) for ~30 h, in complete darkness.
DCMU treatment of leaf discs
Plants were dark-adapted for ~1 h before the treatments. Then, leaf discs of 15 mm diameter were prepared and submerged in DCMU-solution (200 µM, containing 1% ethanol), 1% ethanol or distilled water. Some plants were left untreated. The light intensity during the treatment was ~1, or ~0.3 µmol photons m-2 s-1. In addition, a batch of leaf discs was treated in complete darkness. The duration of the treatment was 4 hours.
Vacuum-infiltration
Leaf discs were vacuum-infiltrated with DCMU (80 µM, containing 1% ethanol) or 1% ethanol. Gentle vacuum (~0.8 bar) was provided until air bubbles were formed on the leaf surface, then vacuum was released very rapidly. This was repeated four times and the whole procedure took ~25 minutes.
DCMU treatment of thylakoids
Immediately before chl a fluorescence measurements, DCMU was added (10 µM final concentration). III.3.d Measuring equipments
Handy-PEA and PEA Senior instruments (Hansatech Instruments Ltd, UK; see sections II.a and II.c for details) were used. Samples were always dark-adapted for at least 30 minutes before the measurements. The fluorescence intensity at 20 µs was taken as F0.
A B
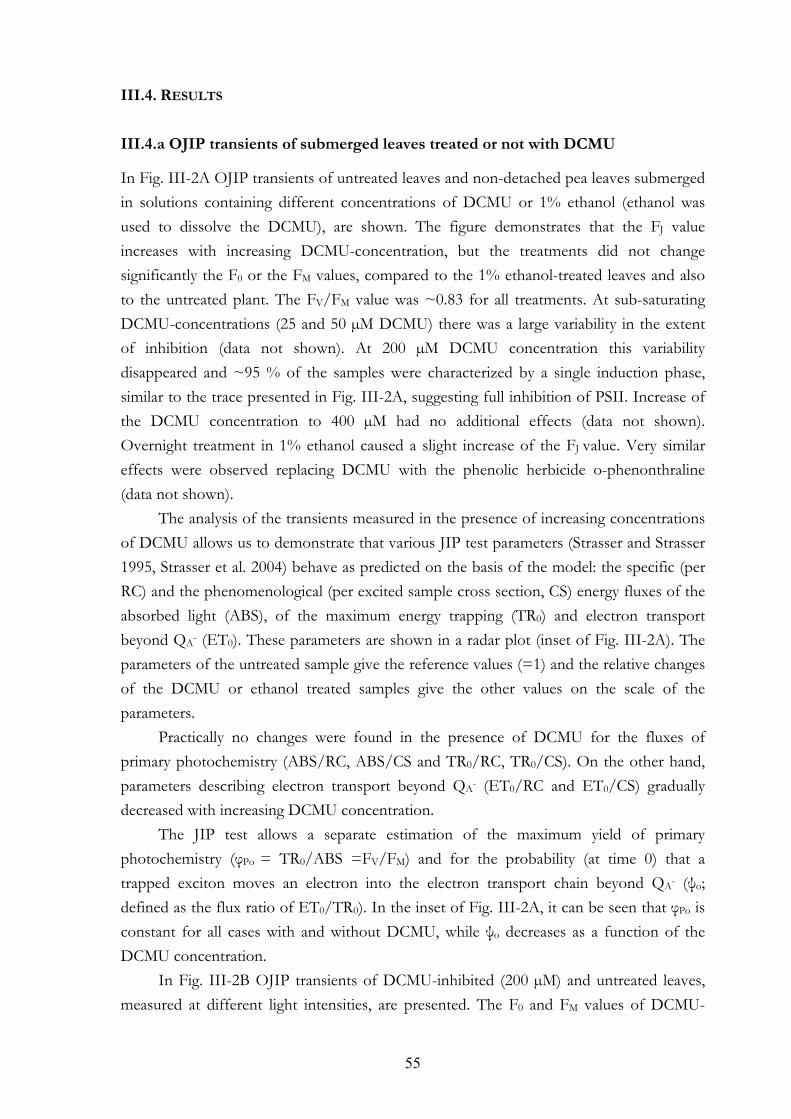
55
III.4. RESULTS
III.4.a OJIP transients of submerged leaves treated or not with DCMU
In Fig. III-2A OJIP transients of untreated leaves and non-detached pea leaves submerged in solutions containing different concentrations of DCMU or 1% ethanol (ethanol was used to dissolve the DCMU), are shown. The figure demonstrates that the FJ value increases with increasing DCMU-concentration, but the treatments did not change significantly the F0 or the FM values, compared to the 1% ethanol-treated leaves and also to the untreated plant. The FV/FM value was ~0.83 for all treatments. At sub-saturating DCMU-concentrations (25 and 50 µM DCMU) there was a large variability in the extent of inhibition (data not shown). At 200 µM DCMU concentration this variability disappeared and ~95 % of the samples were characterized by a single induction phase, similar to the trace presented in Fig. III-2A, suggesting full inhibition of PSII. Increase of the DCMU concentration to 400 µM had no additional effects (data not shown). Overnight treatment in 1% ethanol caused a slight increase of the FJ value. Very similar effects were observed replacing DCMU with the phenolic herbicide o-phenonthraline (data not shown).
The analysis of the transients measured in the presence of increasing concentrations of DCMU allows us to demonstrate that various JIP test parameters (Strasser and Strasser 1995, Strasser et al. 2004) behave as predicted on the basis of the model: the specific (per RC) and the phenomenological (per excited sample cross section, CS) energy fluxes of the absorbed light (ABS), of the maximum energy trapping (TR0) and electron transport beyond QA- (ET0). These parameters are shown in a radar plot (inset of Fig. III-2A). The parameters of the untreated sample give the reference values (=1) and the relative changes of the DCMU or ethanol treated samples give the other values on the scale of the parameters.
Practically no changes were found in the presence of DCMU for the fluxes of primary photochemistry (ABS/RC, ABS/CS and TR0/RC, TR0/CS). On the other hand, parameters describing electron transport beyond QA- (ET0/RC and ET0/CS) gradually decreased with increasing DCMU concentration.
The JIP test allows a separate estimation of the maximum yield of primary photochemistry (φPo = TR0/ABS =FV/FM) and for the probability (at time 0) that a trapped exciton moves an electron into the electron transport chain beyond QA- (ψo; defined as the flux ratio of ET0/TR0). In the inset of Fig. III-2A, it can be seen that φPo is constant for all cases with and without DCMU, while ψo decreases as a function of the DCMU concentration.
In Fig. III-2B OJIP transients of DCMU-inhibited (200 µM) and untreated leaves, measured at different light intensities, are presented. The F0 and FM values of DCMU-
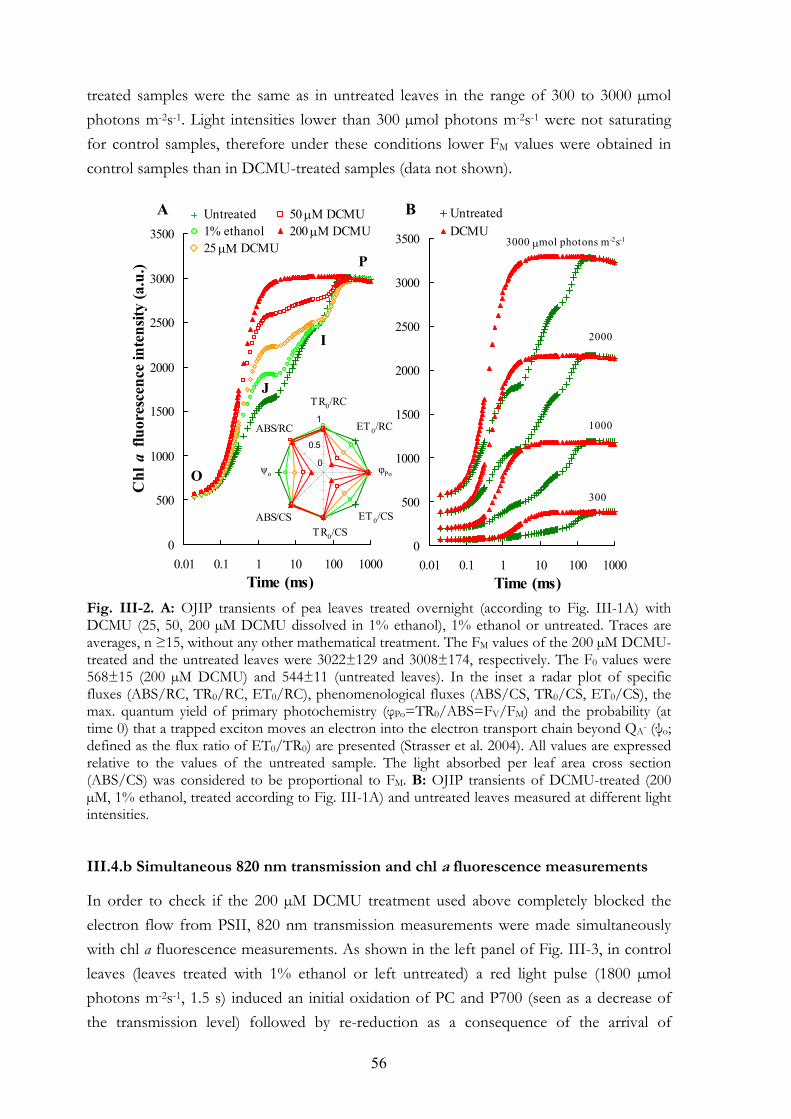
56
treated samples were the same as in untreated leaves in the range of 300 to 3000 µmol photons m-2s-1. Light intensities lower than 300 µmol photons m-2s-1 were not saturating for control samples, therefore under these conditions lower FM values were obtained in control samples than in DCMU-treated samples (data not shown).
Fig. III-2. A: OJIP transients of pea leaves treated overnight (according to Fig. III-1A) with DCMU (25, 50, 200 µM DCMU dissolved in 1% ethanol), 1% ethanol or untreated. Traces are averages, n ≥15, without any other mathematical treatment. The FM values of the 200 µM DCMU-treated and the untreated leaves were 3022±129 and 3008±174, respectively. The F0 values were 568±15 (200 µM DCMU) and 544±11 (untreated leaves). In the inset a radar plot of specific fluxes (ABS/RC, TR0/RC, ET0/RC), phenomenological fluxes (ABS/CS, TR0/CS, ET0/CS), the max. quantum yield of primary photochemistry (φPo=TR0/ABS=FV/FM) and the probability (at time 0) that a trapped exciton moves an electron into the electron transport chain beyond QA- (ψo; defined as the flux ratio of ET0/TR0) are presented (Strasser et al. 2004). All values are expressed relative to the values of the untreated sample. The light absorbed per leaf area cross section (ABS/CS) was considered to be proportional to FM. B: OJIP transients of DCMU-treated (200 µM, 1% ethanol, treated according to Fig. III-1A) and untreated leaves measured at different light intensities.
III.4.b Simultaneous 820 nm transmission and chl a fluorescence measurements
In order to check if the 200 µM DCMU treatment used above completely blocked the electron flow from PSII, 820 nm transmission measurements were made simultaneously with chl a fluorescence measurements. As shown in the left panel of Fig. III-3, in control leaves (leaves treated with 1% ethanol or left untreated) a red light pulse (1800 µmol photons m-2s-1, 1.5 s) induced an initial oxidation of PC and P700 (seen as a decrease of the transmission level) followed by re-reduction as a consequence of the arrival of
0
500
1000
1500
2000
2500
3000
3500
0.01 0.1 1 10 100 1000
UntreatedDCMU
B
3000 µmol photons m-2s-1
2000
1000
300
0
500
1000
1500
2000
2500
3000
3500
0.01 0.1 1 10 100 1000
50 µM DCMU200 µM DCMU
Untreated 1% ethanol25 µΜ DCMU
O
I
J
P
A
Chl
a fl
uore
scen
ce in
tens
ity (a
.u.)
1
0
0.5
TR0/RC
ET 0/RC
ET 0/CSTR0/CS
ABS/CS
ABS/RC
φPoψo
Time (ms) Time (ms)
57
electrons from PSII and a reduction of the acceptor side of PSI (Schansker et al. 2003). Subsequently, a FR pulse (200 µmol photons m-2s-1, 6 s) was given in order to oxidize the electron transport chain (Fig. III-3, middle panel). During the FR illumination, P700 and PC were kept initially in the reduced state by electrons arriving from the reduced PQ-pool. Oxidation of the PQ-pool was followed by oxidation of PC and P700, observed as a decrease of the 820 nm transmission level. During the final red pulse (Fig. III-3, right panel), a further decrease is observed. The FR pulse was too short for a full oxidation of all the P700 and PC and the much stronger red pulse (the red light is ~36-fold more effective in PSI excitation than the FR light used; G. Schansker, unpublished observation) completed the oxidation process. Following this phase, the 820 nm transmission level increases, that shows that the electron transport chain, including PC and P700, becomes reduced again.
Fig. III-3. 820 nm transmission kinetics of DCMU-treated (200 µM, 1% ethanol, treated according to Fig. III-1A) and 1% ethanol-treated leaves. Kinetics were recorded during red light illumination (1800 µmol photons m-2s-1, 1.5 s for control and 5 s for DCMU-treated leaves) followed by FR illumination (6 s, 200 µmol photons m-2s-1) and red light illumination (2 s, 1800 µmol photons m-2s-1). There was ~250 µs of darkness between the light pulses.
In the case of DCMU-treated samples (200 µM), the 820 nm transmission continuously decreased during the first red-light pulse until a steady-state level was established (at ~3 s). The duration of this process may seem rather long, but the pool of stromal electrons has to be emptied before the minimum transmission level can be reached (see Schansker et al. 2003 for a demonstration of this process). During the subsequent FR and red light pulses no further 820 nm transmission changes were observed, indicating that PC and P700 were oxidized and remained oxidized. A (at least partial) reduction of the PQ-pool would have resulted in a transient increase of the 820 nm level during the FR pulse, like in the presence of methylviologen (Schansker et al. 2005, Chapter V). This means that no electrons were passing the DCMU block and therefore the
DCMU1% ethanol
Time (ms)
red light red light far-red light
10-1 100 101 102 103 104
I 820
nm
(a.u
.)
10-1 100 101 102 103 10410-1 100 101 102 103 104
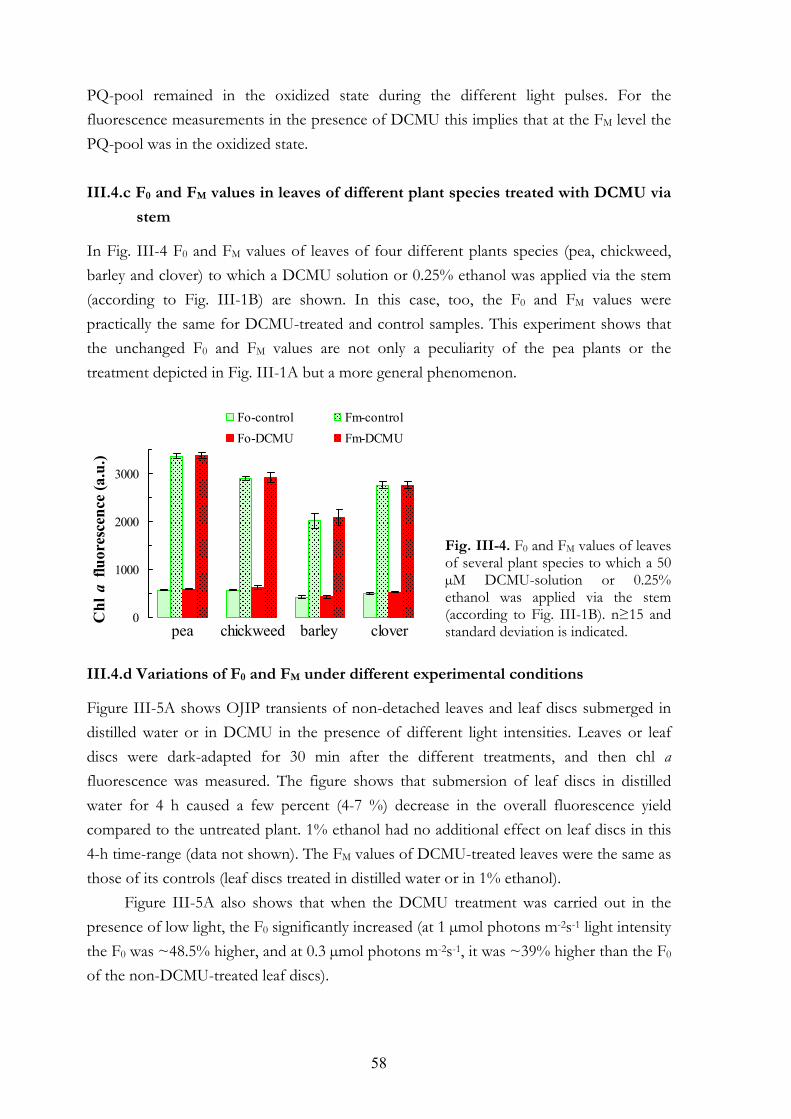
58
PQ-pool remained in the oxidized state during the different light pulses. For the fluorescence measurements in the presence of DCMU this implies that at the FM level the PQ-pool was in the oxidized state.
III.4.c F0 and FM values in leaves of different plant species treated with DCMU via
stem
In Fig. III-4 F0 and FM values of leaves of four different plants species (pea, chickweed, barley and clover) to which a DCMU solution or 0.25% ethanol was applied via the stem (according to Fig. III-1B) are shown. In this case, too, the F0 and FM values were practically the same for DCMU-treated and control samples. This experiment shows that the unchanged F0 and FM values are not only a peculiarity of the pea plants or the treatment depicted in Fig. III-1A but a more general phenomenon.
Fig. III-4. F0 and FM values of leaves of several plant species to which a 50 µM DCMU-solution or 0.25% ethanol was applied via the stem (according to Fig. III-1B). n≥15 and standard deviation is indicated.
III.4.d Variations of F0 and FM under different experimental conditions
Figure III-5A shows OJIP transients of non-detached leaves and leaf discs submerged in distilled water or in DCMU in the presence of different light intensities. Leaves or leaf discs were dark-adapted for 30 min after the different treatments, and then chl a fluorescence was measured. The figure shows that submersion of leaf discs in distilled water for 4 h caused a few percent (4-7 %) decrease in the overall fluorescence yield compared to the untreated plant. 1% ethanol had no additional effect on leaf discs in this 4-h time-range (data not shown). The FM values of DCMU-treated leaves were the same as those of its controls (leaf discs treated in distilled water or in 1% ethanol).
Figure III-5A also shows that when the DCMU treatment was carried out in the presence of low light, the F0 significantly increased (at 1 µmol photons m-2s-1 light intensity the F0 was ~48.5% higher, and at 0.3 µmol photons m-2s-1, it was ~39% higher than the F0 of the non-DCMU-treated leaf discs).
0
1000
2000
3000
Fo-control Fm-controlFo-DCMU Fm-DCMU
chickweedpea cloverbarley
Chl
a fl
uore
scen
ce (a
.u.)
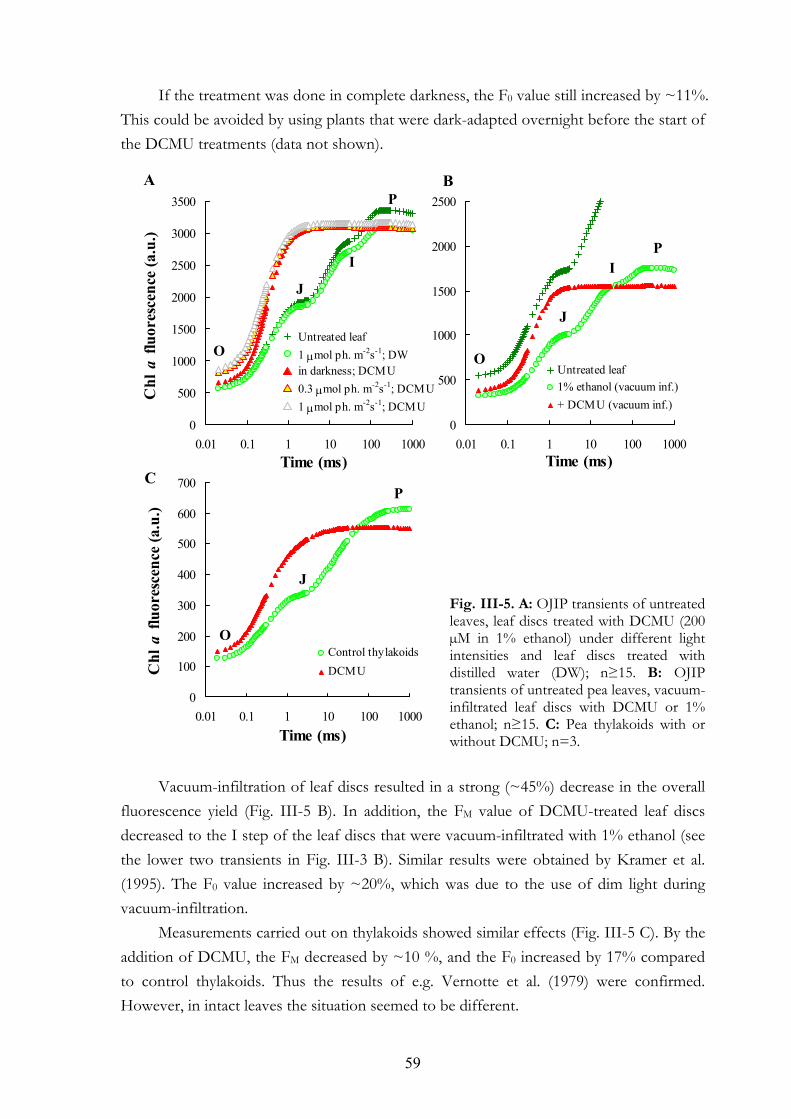
59
If the treatment was done in complete darkness, the F0 value still increased by ~11%. This could be avoided by using plants that were dark-adapted overnight before the start of the DCMU treatments (data not shown).
Fig. III-5. A: OJIP transients of untreated leaves, leaf discs treated with DCMU (200 µM in 1% ethanol) under different light intensities and leaf discs treated with distilled water (DW); n≥15. B: OJIP transients of untreated pea leaves, vacuum-infiltrated leaf discs with DCMU or 1% ethanol; n≥15. C: Pea thylakoids with or without DCMU; n=3.
Vacuum-infiltration of leaf discs resulted in a strong (~45%) decrease in the overall
fluorescence yield (Fig. III-5 B). In addition, the FM value of DCMU-treated leaf discs decreased to the I step of the leaf discs that were vacuum-infiltrated with 1% ethanol (see the lower two transients in Fig. III-3 B). Similar results were obtained by Kramer et al. (1995). The F0 value increased by ~20%, which was due to the use of dim light during vacuum-infiltration.
Measurements carried out on thylakoids showed similar effects (Fig. III-5 C). By the addition of DCMU, the FM decreased by ~10 %, and the F0 increased by 17% compared to control thylakoids. Thus the results of e.g. Vernotte et al. (1979) were confirmed. However, in intact leaves the situation seemed to be different.
0
500
1000
1500
2000
2500
3000
3500
0.01 0.1 1 10 100 1000
Chl
a fl
uore
scen
ce (a
.u.)
O
J
I
0
500
1000
1500
2000
2500
0.01 0.1 1 10 100 1000
Untreated leaf1% ethanol (vacuum inf.)+ DCMU (vacuum inf.)
O
J
IP
0
100
200
300
400
500
600
700
0.01 0.1 1 10 100 1000
Control thylakoidsDCMUC
hl a
fluo
resc
ence
(a.u
.)
O
J
P
A B
C
Untreated leaf1 µmol ph. m-2s-1; DWin darkness; DCMU0.3 µmol ph. m-2s-1; DCMU1 µmol ph. m-2s-1; DCMU
Time (ms) Time (ms)
Time (ms)
P
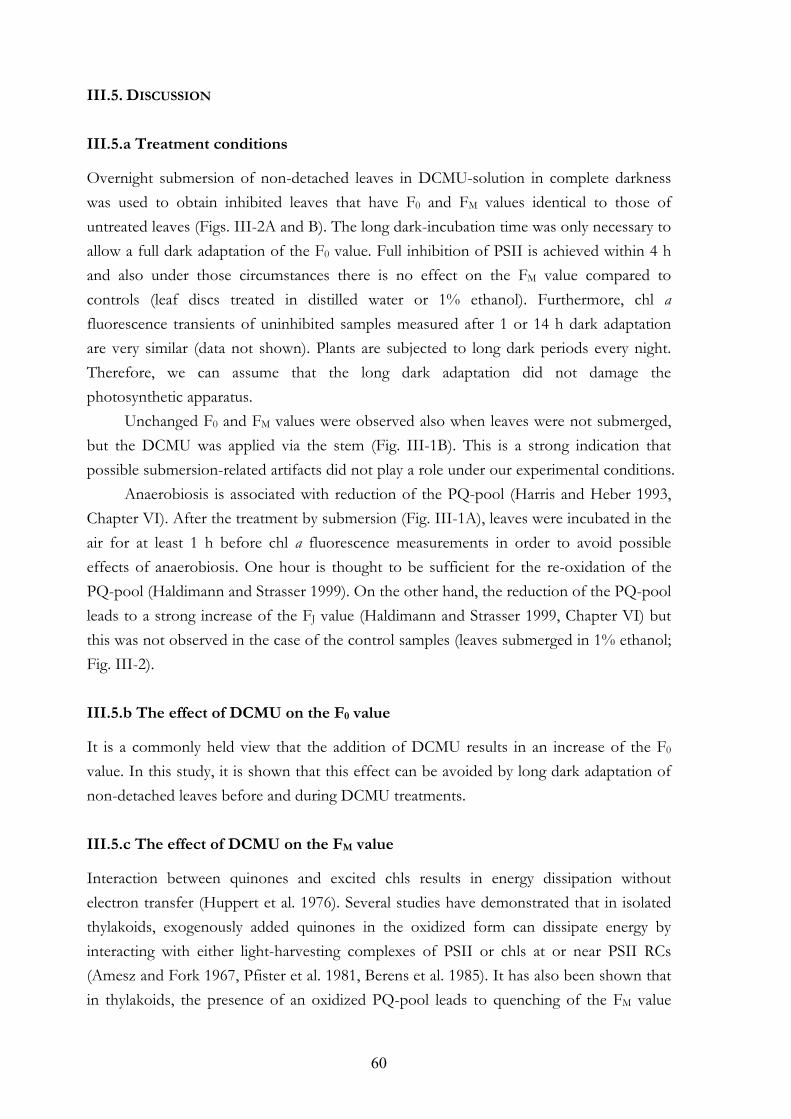
60
III.5. DISCUSSION
III.5.a Treatment conditions
Overnight submersion of non-detached leaves in DCMU-solution in complete darkness was used to obtain inhibited leaves that have F0 and FM values identical to those of untreated leaves (Figs. III-2A and B). The long dark-incubation time was only necessary to allow a full dark adaptation of the F0 value. Full inhibition of PSII is achieved within 4 h and also under those circumstances there is no effect on the FM value compared to controls (leaf discs treated in distilled water or 1% ethanol). Furthermore, chl a fluorescence transients of uninhibited samples measured after 1 or 14 h dark adaptation are very similar (data not shown). Plants are subjected to long dark periods every night. Therefore, we can assume that the long dark adaptation did not damage the photosynthetic apparatus.
Unchanged F0 and FM values were observed also when leaves were not submerged, but the DCMU was applied via the stem (Fig. III-1B). This is a strong indication that possible submersion-related artifacts did not play a role under our experimental conditions.
Anaerobiosis is associated with reduction of the PQ-pool (Harris and Heber 1993, Chapter VI). After the treatment by submersion (Fig. III-1A), leaves were incubated in the air for at least 1 h before chl a fluorescence measurements in order to avoid possible effects of anaerobiosis. One hour is thought to be sufficient for the re-oxidation of the PQ-pool (Haldimann and Strasser 1999). On the other hand, the reduction of the PQ-pool leads to a strong increase of the FJ value (Haldimann and Strasser 1999, Chapter VI) but this was not observed in the case of the control samples (leaves submerged in 1% ethanol; Fig. III-2). III.5.b The effect of DCMU on the F0 value
It is a commonly held view that the addition of DCMU results in an increase of the F0 value. In this study, it is shown that this effect can be avoided by long dark adaptation of non-detached leaves before and during DCMU treatments. III.5.c The effect of DCMU on the FM value
Interaction between quinones and excited chls results in energy dissipation without electron transfer (Huppert et al. 1976). Several studies have demonstrated that in isolated thylakoids, exogenously added quinones in the oxidized form can dissipate energy by interacting with either light-harvesting complexes of PSII or chls at or near PSII RCs (Amesz and Fork 1967, Pfister et al. 1981, Berens et al. 1985). It has also been shown that in thylakoids, the presence of an oxidized PQ-pool leads to quenching of the FM value
61
(Vernotte et al. 1979, Neubauer and Schreiber 1987, Hsu and Lee 1995, Haldimann and Tsimilli-Michael. 2005). This result is also confirmed by our data (Fig. III-5C). In PSII membrane fragments subjected to a detergent treatment (e.g. Triton X-100), the effect of the oxidation state of the PQ-pool on the FM value is even more pronounced than in thylakoids (Lam et al. 1983, Kurreck et al. 2000, Pospíšil and Dau 2000). These data can be explained by assuming that damage caused to PSII-complexes by each additional treatment progressively increases the accessibility of oxidized PQ molecules to excited chl molecules. Vacuum-infiltration is thought to cause an osmotic shock and it may also cause mechanical modification of thylakoid membranes, just as thylakoid isolation procedures and detergent treatments. This may explain why a significant decrease of the FM value occurs in vacuum-infiltrated, DCMU-treated leaves (Fig. III-5B).
In intact leaves, the FM values are the same in the presence or absence of DCMU (Fig. III-2). In the case of control leaves, the PQ-pool is in its reduced state at the FM level, whereas in the case of DCMU-treated leaves the PQ-pool is oxidized (Fig. III-3). This means that in the case of intact leaves, the FM value is not influenced directly by the redox state of the PQ-pool. This may indicate that in intact thylakoid membranes, the excited antenna molecules are not accessible to oxidized PQ molecules. This is supported by the observations of Kurreck et al. (2000). These authors suggested, on the basis of 90K fluorescence spectra and binding studies with radioactively labeled PQ-9 (Satoh et al. 1986), that in PSII membrane fragments PQ molecules interact with the chls bound to CP47 (a unit of the inner antenna) and not with the more accessible outer antenna.
Literature data show that it is possible to prepare intact chloroplasts that have identical FM (and also F0) values in the presence and absence of DCMU (Schreiber and Krieger 1996). On the basis of this and the results of this chapter it is suggested that the extent of PQ-pool quenching could provide a tool to assess the intactness of the PSII-protein complex and the quality of the isolation procedure.
The unchanged FM values in leaves in the presence of DCMU indicate that the hypothesis that the IP phase of the chl a fluorescence transient corresponds to a removal of PQ-pool quenching (see e.g. Neubauer and Schreiber 1987, Lazár et al. 1998) cannot be correct. Vredenberg and Bulychev (2002) suggested that the difference in the FM value with and without DCMU is caused by a limited built-up of the photo-electrochemical field. The nearly identical FM values observed in this study in leaves contradict this suggestion.
In this study, it is shown that submersion of leaf discs in water or in a DCMU solution decreases the overall fluorescence yield by a few percent (Fig. III-5A). This observation emphasizes the importance of the preparation of appropriate controls (leaf discs submerged in water or 1% ethanol). Finally, these results suggest that the best DCMU treatment is obtained through a passive (slow) diffusion of DCMU into non-detached leaves that are kept in complete darkness (as shown in Fig. III-1). In this way, increases of the F0 and decreases of the FM values are avoided.

62
63
CHAPTER IV
A slightly different version of this chapter has been published in: Tóth SZ, Strasser RJ (2005) Proceedings of the 13th International Congress on Photosynthesis, Montreal, Canada, pp. 198-200.
IV.1. SUMMARY
In the presence of DCMU, the re-oxidation of QA- by forward electron transport is inhibited and FM is reached shortly after the OJ phase, which is the photochemical phase of the chl a fluorescence transient. When fluorescence measurements are carried out on a sample that are not completely dark adapted (e.g. after a pre-pulse and a few seconds of darkness) the initial slope of the OJ phase becomes considerably steeper than that of the dark adapted sample. It looks as if QA-reduction became faster by increasing the initial amount of QA-. This phenomenon may be partially explained by the connectivity of PSII units that allows energy transfer from closed to open RCs. By analyzing the kinetics between the fluorescence transient and the FM-level, it is shown that antenna size heterogeneity of PSII units is also an important factor. IV.2. INTRODUCTION
There are several factors that influence the chl a fluorescence transient even if forward electron transport processes are blocked by DCMU. In this chapter, the effect of PSII antenna heterogeneity was studied.
It has been shown that the relative variable fluorescence [V=(Ft-F0)/(FM-F0)] is not directly proportional to the number of closed RCs, but it is linearly related to the rate at which centers close (Bennoun and Li 1973). This may be explained by the connectivity of PSII units. According to the concept of connectivity (also called grouping), closed PSII RCs may transfer their excitation energy to open neighboring PSII units that result in
THE SPECIFIC RATE OF QA REDUCTION AND
PHOTOSYSTEM II ANTENNA HETEROGENEITY
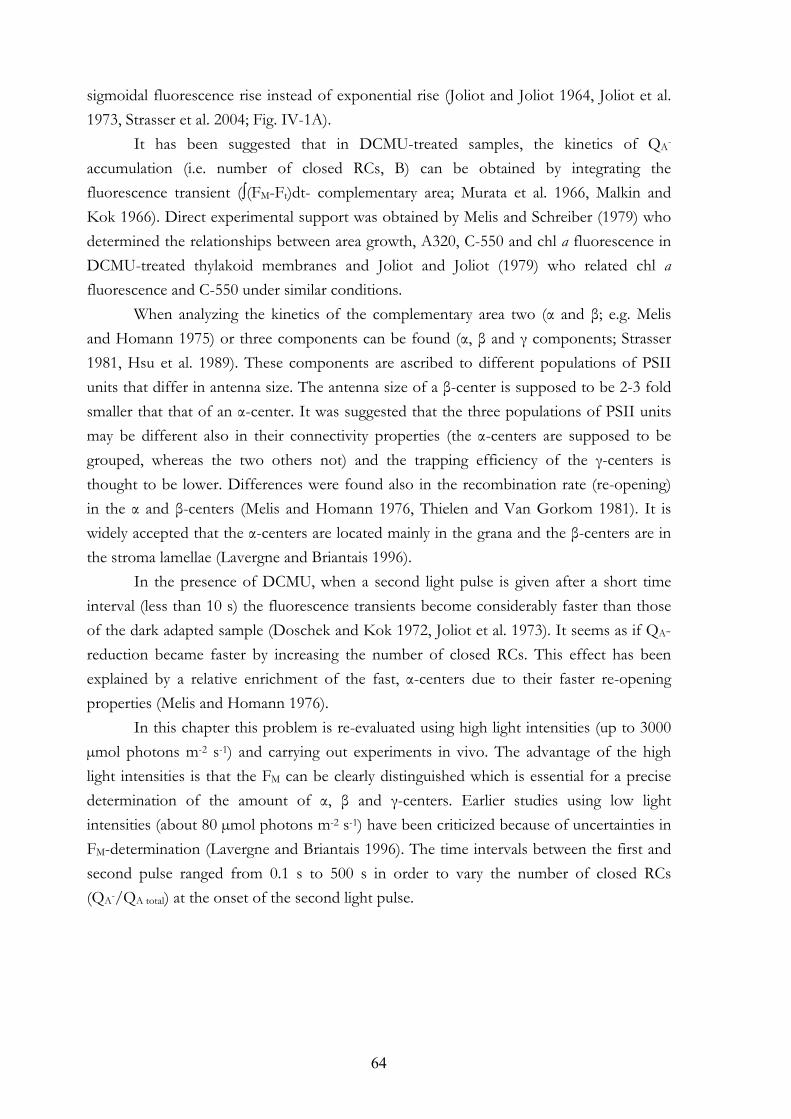
64
sigmoidal fluorescence rise instead of exponential rise (Joliot and Joliot 1964, Joliot et al. 1973, Strasser et al. 2004; Fig. IV-1A).
It has been suggested that in DCMU-treated samples, the kinetics of QA- accumulation (i.e. number of closed RCs, B) can be obtained by integrating the fluorescence transient (∫(FM-Ft)dt- complementary area; Murata et al. 1966, Malkin and Kok 1966). Direct experimental support was obtained by Melis and Schreiber (1979) who determined the relationships between area growth, A320, C-550 and chl a fluorescence in DCMU-treated thylakoid membranes and Joliot and Joliot (1979) who related chl a fluorescence and C-550 under similar conditions.
When analyzing the kinetics of the complementary area two (α and β; e.g. Melis and Homann 1975) or three components can be found (α, β and γ components; Strasser 1981, Hsu et al. 1989). These components are ascribed to different populations of PSII units that differ in antenna size. The antenna size of a β-center is supposed to be 2-3 fold smaller that that of an α-center. It was suggested that the three populations of PSII units may be different also in their connectivity properties (the α-centers are supposed to be grouped, whereas the two others not) and the trapping efficiency of the γ-centers is thought to be lower. Differences were found also in the recombination rate (re-opening) in the α and β-centers (Melis and Homann 1976, Thielen and Van Gorkom 1981). It is widely accepted that the α-centers are located mainly in the grana and the β-centers are in the stroma lamellae (Lavergne and Briantais 1996).
In the presence of DCMU, when a second light pulse is given after a short time interval (less than 10 s) the fluorescence transients become considerably faster than those of the dark adapted sample (Doschek and Kok 1972, Joliot et al. 1973). It seems as if QA-reduction became faster by increasing the number of closed RCs. This effect has been explained by a relative enrichment of the fast, α-centers due to their faster re-opening properties (Melis and Homann 1976).
In this chapter this problem is re-evaluated using high light intensities (up to 3000 µmol photons m-2 s-1) and carrying out experiments in vivo. The advantage of the high light intensities is that the FM can be clearly distinguished which is essential for a precise determination of the amount of α, β and γ-centers. Earlier studies using low light intensities (about 80 µmol photons m-2 s-1) have been criticized because of uncertainties in FM-determination (Lavergne and Briantais 1996). The time intervals between the first and second pulse ranged from 0.1 s to 500 s in order to vary the number of closed RCs (QA-/QA total) at the onset of the second light pulse.
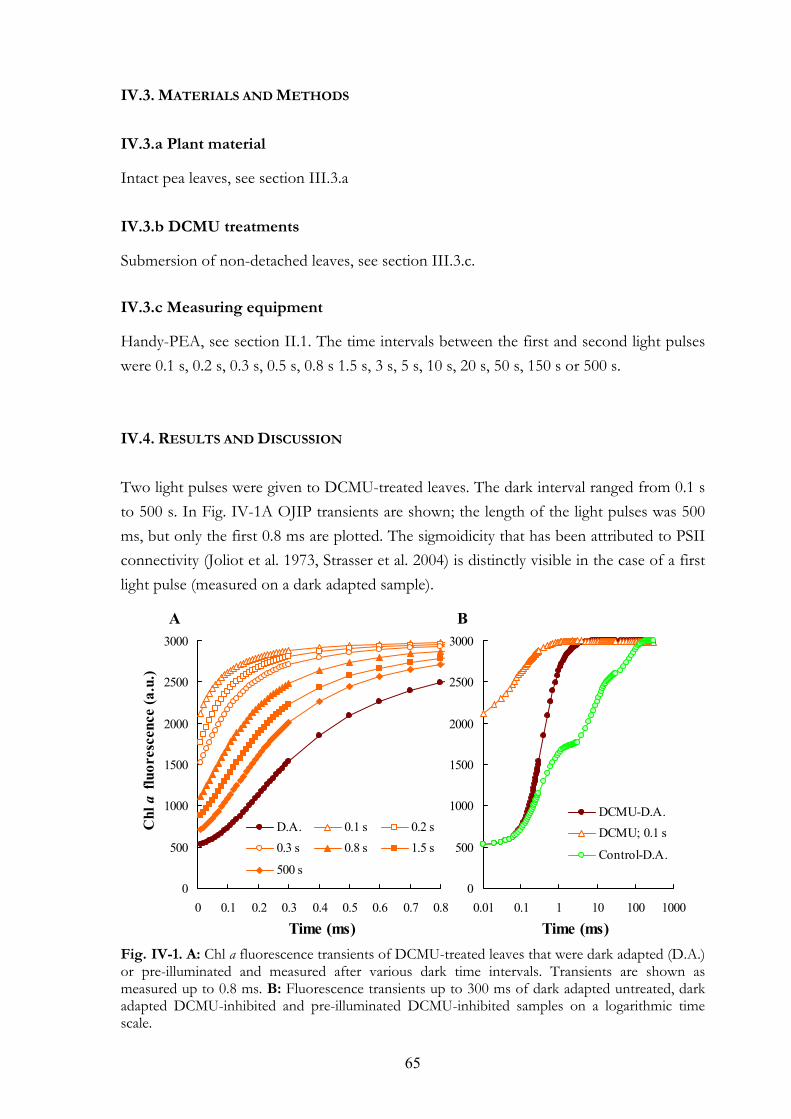
65
IV.3. MATERIALS AND METHODS
IV.3.a Plant material
Intact pea leaves, see section III.3.a IV.3.b DCMU treatments
Submersion of non-detached leaves, see section III.3.c. IV.3.c Measuring equipment
Handy-PEA, see section II.1. The time intervals between the first and second light pulses were 0.1 s, 0.2 s, 0.3 s, 0.5 s, 0.8 s 1.5 s, 3 s, 5 s, 10 s, 20 s, 50 s, 150 s or 500 s. IV.4. RESULTS AND DISCUSSION
Two light pulses were given to DCMU-treated leaves. The dark interval ranged from 0.1 s to 500 s. In Fig. IV-1A OJIP transients are shown; the length of the light pulses was 500 ms, but only the first 0.8 ms are plotted. The sigmoidicity that has been attributed to PSII connectivity (Joliot et al. 1973, Strasser et al. 2004) is distinctly visible in the case of a first light pulse (measured on a dark adapted sample). Fig. IV-1. A: Chl a fluorescence transients of DCMU-treated leaves that were dark adapted (D.A.) or pre-illuminated and measured after various dark time intervals. Transients are shown as measured up to 0.8 ms. B: Fluorescence transients up to 300 ms of dark adapted untreated, dark adapted DCMU-inhibited and pre-illuminated DCMU-inhibited samples on a logarithmic time scale.
0
500
1000
1500
2000
2500
3000
0 0.1 0.2 0.3 0.4 0.5 0.6 0.7 0.8
D.A. 0.1 s 0.2 s0.3 s 0.8 s 1.5 s
500 s
Chl
a fl
uore
scen
ce (a
.u.)
0
500
1000
1500
2000
2500
3000
0.01 0.1 1 10 100 1000
DCMU-D.A.DCMU; 0.1 s
Control-D.A.
Time (ms)Time (ms)
A B
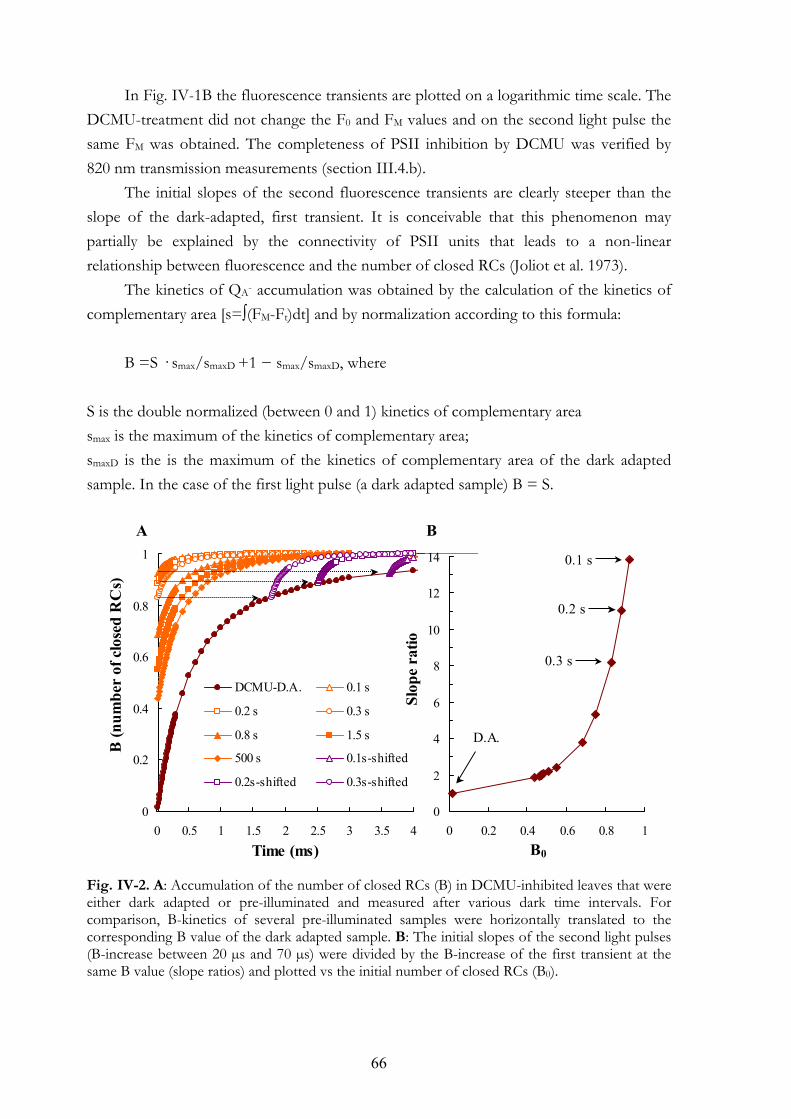
66
In Fig. IV-1B the fluorescence transients are plotted on a logarithmic time scale. The DCMU-treatment did not change the F0 and FM values and on the second light pulse the same FM was obtained. The completeness of PSII inhibition by DCMU was verified by 820 nm transmission measurements (section III.4.b).
The initial slopes of the second fluorescence transients are clearly steeper than the slope of the dark-adapted, first transient. It is conceivable that this phenomenon may partially be explained by the connectivity of PSII units that leads to a non-linear relationship between fluorescence and the number of closed RCs (Joliot et al. 1973).
The kinetics of QA- accumulation was obtained by the calculation of the kinetics of complementary area [s=∫(FM-Ft)dt] and by normalization according to this formula:
B =S · smax/smaxD +1 − smax/smaxD, where
S is the double normalized (between 0 and 1) kinetics of complementary area smax is the maximum of the kinetics of complementary area; smaxD is the is the maximum of the kinetics of complementary area of the dark adapted sample. In the case of the first light pulse (a dark adapted sample) B = S.
Fig. IV-2. A: Accumulation of the number of closed RCs (B) in DCMU-inhibited leaves that were either dark adapted or pre-illuminated and measured after various dark time intervals. For comparison, B-kinetics of several pre-illuminated samples were horizontally translated to the corresponding B value of the dark adapted sample. B: The initial slopes of the second light pulses (B-increase between 20 µs and 70 µs) were divided by the B-increase of the first transient at the same B value (slope ratios) and plotted vs the initial number of closed RCs (B0).
0
0.2
0.4
0.6
0.8
1
0 0.5 1 1.5 2 2.5 3 3.5 4
DCMU-D.A. 0.1 s
0.2 s 0.3 s
0.8 s 1.5 s
500 s 0.1s-shifted
0.2s-shifted 0.3s-shifted
B (n
umbe
r of
clo
sed
RC
s)
0
2
4
6
8
10
12
14
0 0.2 0.4 0.6 0.8 1
0.1 s
0.2 s
0.3 s
D.A.
Slop
e ra
tio
B0Time (ms)
A B
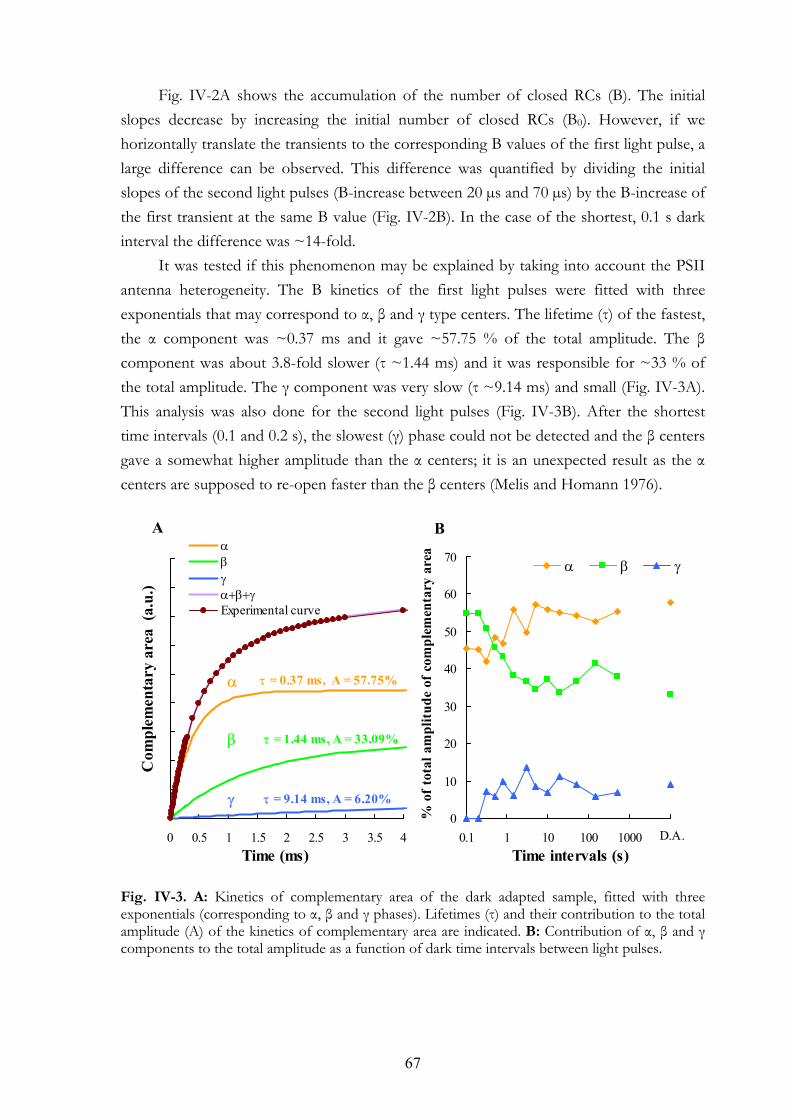
67
Fig. IV-2A shows the accumulation of the number of closed RCs (B). The initial slopes decrease by increasing the initial number of closed RCs (B0). However, if we horizontally translate the transients to the corresponding B values of the first light pulse, a large difference can be observed. This difference was quantified by dividing the initial slopes of the second light pulses (B-increase between 20 µs and 70 µs) by the B-increase of the first transient at the same B value (Fig. IV-2B). In the case of the shortest, 0.1 s dark interval the difference was ~14-fold.
It was tested if this phenomenon may be explained by taking into account the PSII antenna heterogeneity. The B kinetics of the first light pulses were fitted with three exponentials that may correspond to α, β and γ type centers. The lifetime (τ) of the fastest, the α component was ~0.37 ms and it gave ~57.75 % of the total amplitude. The β component was about 3.8-fold slower (τ ~1.44 ms) and it was responsible for ~33 % of the total amplitude. The γ component was very slow (τ ~9.14 ms) and small (Fig. IV-3A). This analysis was also done for the second light pulses (Fig. IV-3B). After the shortest time intervals (0.1 and 0.2 s), the slowest (γ) phase could not be detected and the β centers gave a somewhat higher amplitude than the α centers; it is an unexpected result as the α centers are supposed to re-open faster than the β centers (Melis and Homann 1976).
Fig. IV-3. A: Kinetics of complementary area of the dark adapted sample, fitted with three exponentials (corresponding to α, β and γ phases). Lifetimes (τ) and their contribution to the total amplitude (A) of the kinetics of complementary area are indicated. B: Contribution of α, β and γ components to the total amplitude as a function of dark time intervals between light pulses.
0 0.5 1 1.5 2 2.5 3 3.5 4
αβγα+β+γExperimental curve
τ = 0.37 ms, A = 57.75%
τ = 1.44 ms, A = 33.09%
τ = 9.14 ms, A = 6.20%
α
β
γ
Com
plem
enta
ry a
rea
(a.u
.)
0
10
20
30
40
50
60
70
0.1 1 10 100 1000 10000
α β γ
% o
f tot
al a
mpl
itude
of c
ompl
emen
tary
are
a
D.A.Time intervals (s)Time (ms)
A B
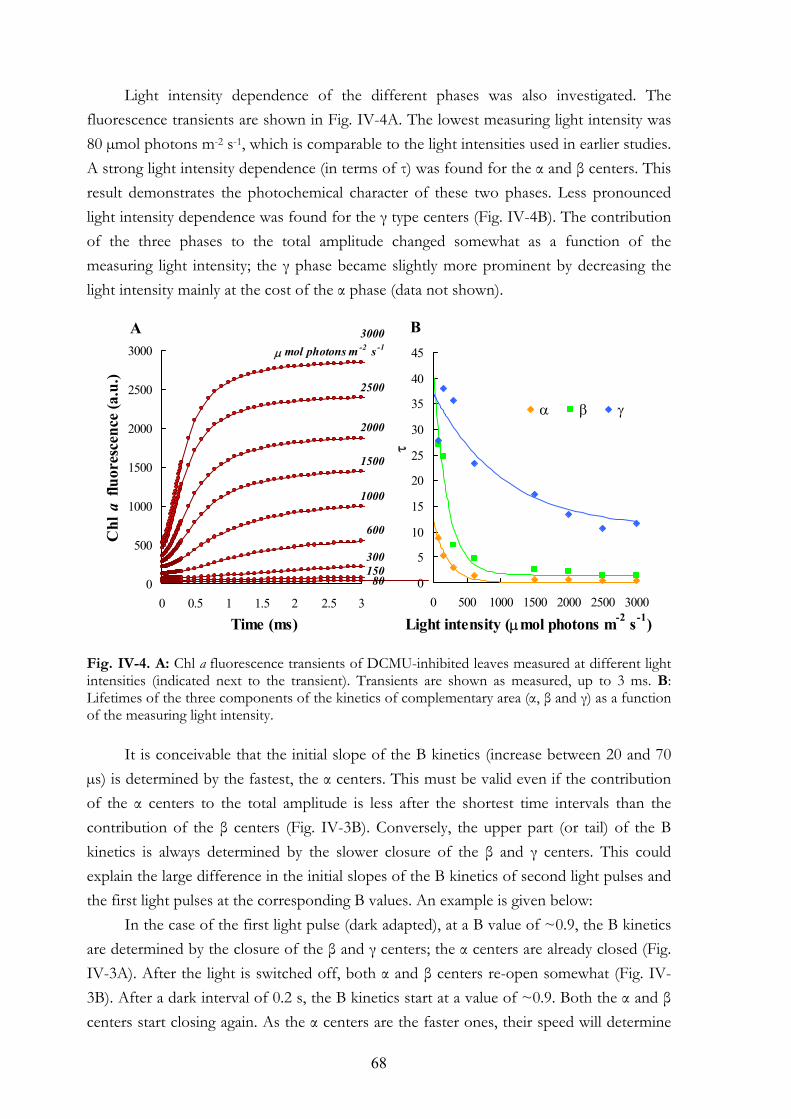
68
Light intensity dependence of the different phases was also investigated. The fluorescence transients are shown in Fig. IV-4A. The lowest measuring light intensity was 80 µmol photons m-2 s-1, which is comparable to the light intensities used in earlier studies. A strong light intensity dependence (in terms of τ) was found for the α and β centers. This result demonstrates the photochemical character of these two phases. Less pronounced light intensity dependence was found for the γ type centers (Fig. IV-4B). The contribution of the three phases to the total amplitude changed somewhat as a function of the measuring light intensity; the γ phase became slightly more prominent by decreasing the light intensity mainly at the cost of the α phase (data not shown).
Fig. IV-4. A: Chl a fluorescence transients of DCMU-inhibited leaves measured at different light intensities (indicated next to the transient). Transients are shown as measured, up to 3 ms. B: Lifetimes of the three components of the kinetics of complementary area (α, β and γ) as a function of the measuring light intensity.
It is conceivable that the initial slope of the B kinetics (increase between 20 and 70 µs) is determined by the fastest, the α centers. This must be valid even if the contribution of the α centers to the total amplitude is less after the shortest time intervals than the contribution of the β centers (Fig. IV-3B). Conversely, the upper part (or tail) of the B kinetics is always determined by the slower closure of the β and γ centers. This could explain the large difference in the initial slopes of the B kinetics of second light pulses and the first light pulses at the corresponding B values. An example is given below:
In the case of the first light pulse (dark adapted), at a B value of ~0.9, the B kinetics are determined by the closure of the β and γ centers; the α centers are already closed (Fig. IV-3A). After the light is switched off, both α and β centers re-open somewhat (Fig. IV-3B). After a dark interval of 0.2 s, the B kinetics start at a value of ~0.9. Both the α and β centers start closing again. As the α centers are the faster ones, their speed will determine
0
5
10
15
20
25
30
35
40
45
0 500 1000 1500 2000 2500 3000
α β γτ
0
500
1000
1500
2000
2500
3000
0 0.5 1 1.5 2 2.5 3
Chl
a fl
uore
scen
ce (a
.u.) 2500
300
600
1000
1500
2000
80 150
Time (ms) Light intensity (µmol photons m-2 s-1)
A B3000µ mol photons m -2 s -1
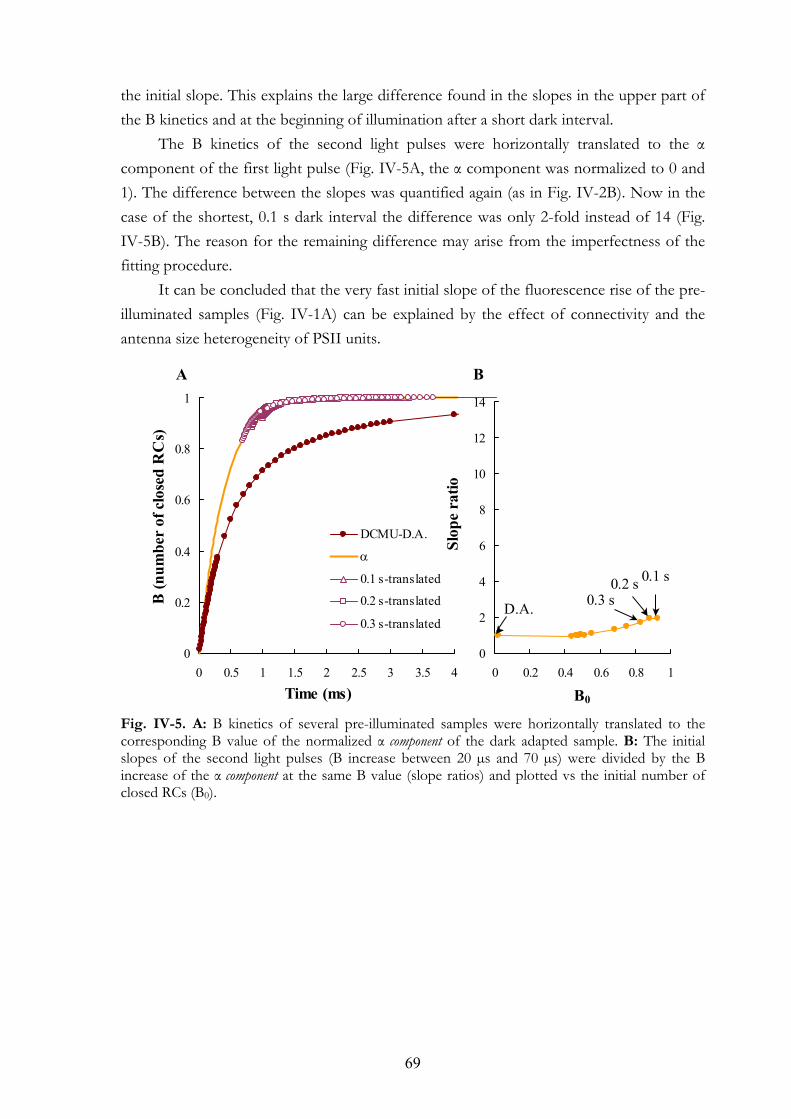
69
the initial slope. This explains the large difference found in the slopes in the upper part of the B kinetics and at the beginning of illumination after a short dark interval.
The B kinetics of the second light pulses were horizontally translated to the α component of the first light pulse (Fig. IV-5A, the α component was normalized to 0 and 1). The difference between the slopes was quantified again (as in Fig. IV-2B). Now in the case of the shortest, 0.1 s dark interval the difference was only 2-fold instead of 14 (Fig. IV-5B). The reason for the remaining difference may arise from the imperfectness of the fitting procedure.
It can be concluded that the very fast initial slope of the fluorescence rise of the pre-illuminated samples (Fig. IV-1A) can be explained by the effect of connectivity and the antenna size heterogeneity of PSII units.
Fig. IV-5. A: B kinetics of several pre-illuminated samples were horizontally translated to the corresponding B value of the normalized α component of the dark adapted sample. B: The initial slopes of the second light pulses (B increase between 20 µs and 70 µs) were divided by the B increase of the α component at the same B value (slope ratios) and plotted vs the initial number of closed RCs (B0).
0
0.2
0.4
0.6
0.8
1
0 0.5 1 1.5 2 2.5 3 3.5 4
DCMU-D.A.
α
0.1 s-translated
0.2 s-translated
0.3 s-translated
B (n
umbe
r of
clo
sed
RC
s)
0
2
4
6
8
10
12
14
0 0.2 0.4 0.6 0.8 1
0.1 s
D.A. 0.3 s0.2 s
Time (ms) B0
A B
Slop
e ra
tio

70
71
CHAPTER V
A slightly different version of this chapter has been published in: Schansker G, Tóth SZ, Strasser RJ (2005) Biochim Biophys Acta 1706: 250-261.
V.1. SUMMARY
The effects of dibromothymoquinone (DBMIB) and methylviologen (MV) on the OJIP transient were studied in vivo. DBMIB inhibits the re-oxidation of plastoquinol by binding to the cyt b6f complex. MV accepts electrons from the FeS-clusters of PSI and it allows electrons to bypass the block that is transiently imposed by FNR (inactive in dark adapted leaves). We show that the IP phase of the OJIP transient disappears in the presence of DBMIB without affecting FM. MV suppresses the IP phase by lowering the P level compared to untreated leaves. These observations indicate that PSI-activity plays an important role in the kinetics of the OJIP transient. Two requirements for the IP phase are electron transfer beyond the cyt b6f complex (blocked by DBMIB) and a transient block at the acceptor side of PSI (bypassed by MV). It is also observed that in leaves, just like in thylakoid membranes, DBMIB can bypass its own block at the cyt b6f complex and donate electrons directly to PC+ and P700+ with a donation time τ of 4.3 s. Furthermore, alternative explanations of the IP phase that are available in the literature are discussed. V.2. INTRODUCTION
In the last few years several mutually exclusive hypotheses have been put forward to explain the JI and IP phases of the chl a fluorescence transient. In this chapter, the IP phase is investigated for which at least eight hypotheses have been presented in the last 45 years.
METHYLVIOLOGEN AND DIBROMOTHYMOQUINONE
TREATMENTS OF PEA LEAVES REVEAL THE ROLE OF
PHOTOSYSTEM I IN THE OJIP TRANSIENT
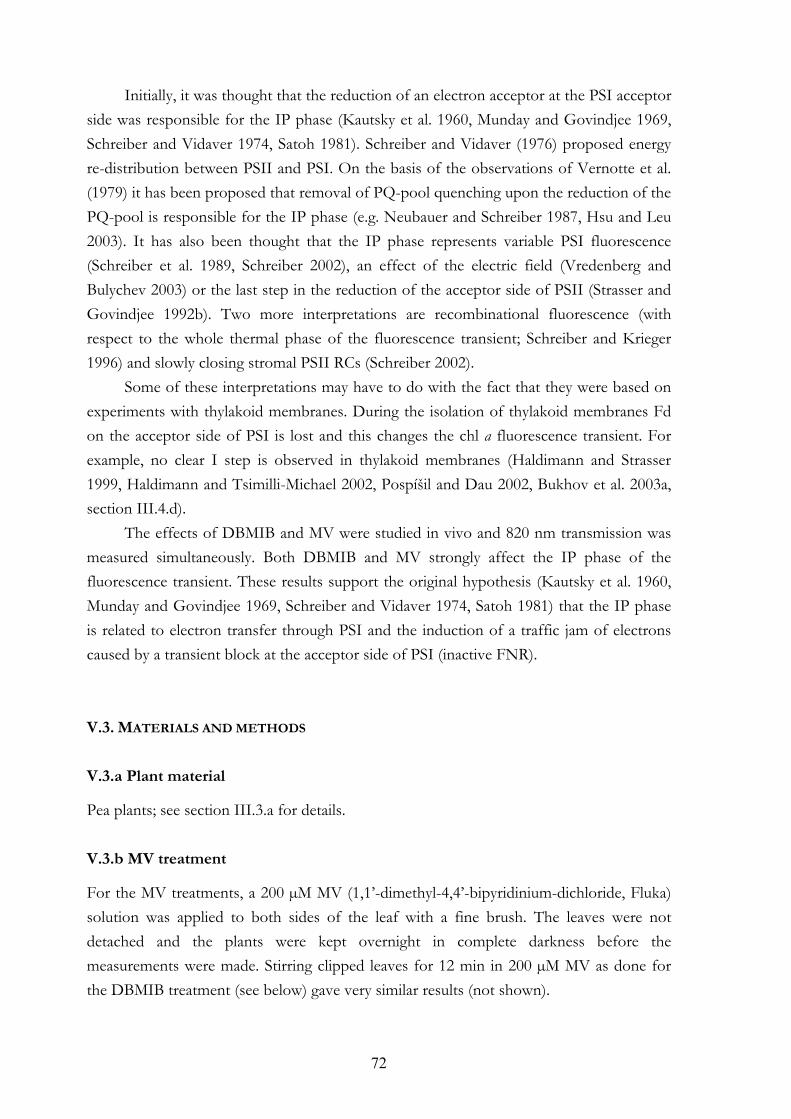
72
Initially, it was thought that the reduction of an electron acceptor at the PSI acceptor side was responsible for the IP phase (Kautsky et al. 1960, Munday and Govindjee 1969, Schreiber and Vidaver 1974, Satoh 1981). Schreiber and Vidaver (1976) proposed energy re-distribution between PSII and PSI. On the basis of the observations of Vernotte et al. (1979) it has been proposed that removal of PQ-pool quenching upon the reduction of the PQ-pool is responsible for the IP phase (e.g. Neubauer and Schreiber 1987, Hsu and Leu 2003). It has also been thought that the IP phase represents variable PSI fluorescence (Schreiber et al. 1989, Schreiber 2002), an effect of the electric field (Vredenberg and Bulychev 2003) or the last step in the reduction of the acceptor side of PSII (Strasser and Govindjee 1992b). Two more interpretations are recombinational fluorescence (with respect to the whole thermal phase of the fluorescence transient; Schreiber and Krieger 1996) and slowly closing stromal PSII RCs (Schreiber 2002).
Some of these interpretations may have to do with the fact that they were based on experiments with thylakoid membranes. During the isolation of thylakoid membranes Fd on the acceptor side of PSI is lost and this changes the chl a fluorescence transient. For example, no clear I step is observed in thylakoid membranes (Haldimann and Strasser 1999, Haldimann and Tsimilli-Michael 2002, Pospíšil and Dau 2002, Bukhov et al. 2003a, section III.4.d).
The effects of DBMIB and MV were studied in vivo and 820 nm transmission was measured simultaneously. Both DBMIB and MV strongly affect the IP phase of the fluorescence transient. These results support the original hypothesis (Kautsky et al. 1960, Munday and Govindjee 1969, Schreiber and Vidaver 1974, Satoh 1981) that the IP phase is related to electron transfer through PSI and the induction of a traffic jam of electrons caused by a transient block at the acceptor side of PSI (inactive FNR). V.3. MATERIALS AND METHODS
V.3.a Plant material
Pea plants; see section III.3.a for details. V.3.b MV treatment
For the MV treatments, a 200 µM MV (1,1’-dimethyl-4,4’-bipyridinium-dichloride, Fluka) solution was applied to both sides of the leaf with a fine brush. The leaves were not detached and the plants were kept overnight in complete darkness before the measurements were made. Stirring clipped leaves for 12 min in 200 µM MV as done for the DBMIB treatment (see below) gave very similar results (not shown).
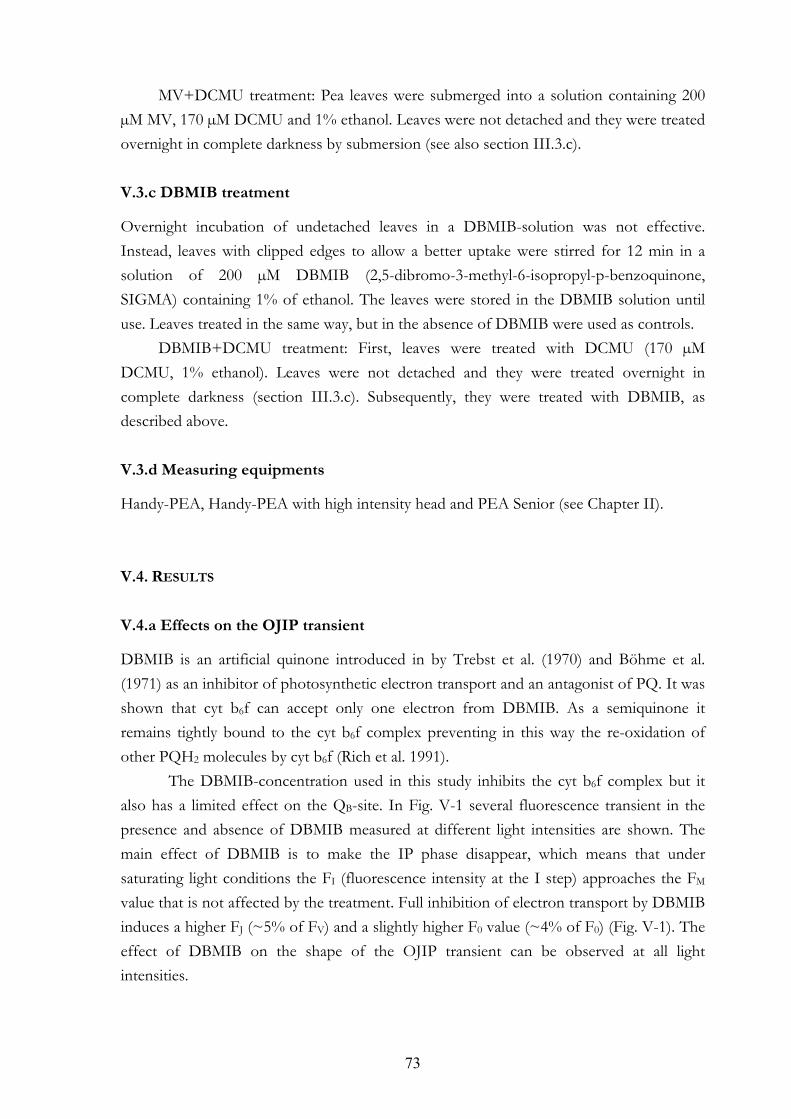
73
MV+DCMU treatment: Pea leaves were submerged into a solution containing 200 µM MV, 170 µM DCMU and 1% ethanol. Leaves were not detached and they were treated overnight in complete darkness by submersion (see also section III.3.c). V.3.c DBMIB treatment
Overnight incubation of undetached leaves in a DBMIB-solution was not effective. Instead, leaves with clipped edges to allow a better uptake were stirred for 12 min in a solution of 200 µM DBMIB (2,5-dibromo-3-methyl-6-isopropyl-p-benzoquinone, SIGMA) containing 1% of ethanol. The leaves were stored in the DBMIB solution until use. Leaves treated in the same way, but in the absence of DBMIB were used as controls.
DBMIB+DCMU treatment: First, leaves were treated with DCMU (170 µM DCMU, 1% ethanol). Leaves were not detached and they were treated overnight in complete darkness (section III.3.c). Subsequently, they were treated with DBMIB, as described above. V.3.d Measuring equipments
Handy-PEA, Handy-PEA with high intensity head and PEA Senior (see Chapter II). V.4. RESULTS
V.4.a Effects on the OJIP transient
DBMIB is an artificial quinone introduced in by Trebst et al. (1970) and Böhme et al. (1971) as an inhibitor of photosynthetic electron transport and an antagonist of PQ. It was shown that cyt b6f can accept only one electron from DBMIB. As a semiquinone it remains tightly bound to the cyt b6f complex preventing in this way the re-oxidation of other PQH2 molecules by cyt b6f (Rich et al. 1991).
The DBMIB-concentration used in this study inhibits the cyt b6f complex but it also has a limited effect on the QB-site. In Fig. V-1 several fluorescence transient in the presence and absence of DBMIB measured at different light intensities are shown. The main effect of DBMIB is to make the IP phase disappear, which means that under saturating light conditions the FI (fluorescence intensity at the I step) approaches the FM value that is not affected by the treatment. Full inhibition of electron transport by DBMIB induces a higher FJ (~5% of FV) and a slightly higher F0 value (~4% of F0) (Fig. V-1). The effect of DBMIB on the shape of the OJIP transient can be observed at all light intensities.
74
Fig. V-1. Effect of DBMIB on the OJIP transient. The fluorescence transients (n≥20) are shown as measured. The light intensity (in µmol photons m-2 s-1) at which the fluorescence transients were recorded is indicated. See Materials and Methods of this chapter for further details.
Several authors have written about the effect of MV on the fluorescence transient.
Munday and Govindjee (1969) observed that infiltration of Chlorella pyrenoidosa cells with MV strongly reduced the amplitude of the IP phase, but had little effect on the OI phase. Neubauer and Schreiber (1987) observed that high light-illumination of MV-treated chloroplasts suppressed the IP phase and lowered the FM value. Harbinson and Hedley (1993) observed a lower FM : F0 ratio in MV-treated leaves.
Figs. V-2A and B show that MV suppresses selectively the IP phase independently of the light intensity. Even at the highest light intensity (~15000 µmol photons m-2s-1, Fig. V-2B) the FV values of the MV-treated leaves was ~8% lower than that of the control (upper inset of Fig. V-2B). This was caused by the suppression of the IP phase (see also Fig. V-6). The FM value measured after a double infiltration of leaves with DCMU and MV is almost identical to the FM value measured in control leaves (Fig. V-2A). This observation and the absence of an effect on the O-J-I phase indicate that the treatment with MV did not cause photo-oxidative damage.
The lower inset of Fig. V-2B shows that in control leaves, the J-I-P phase was nearly overlapping for the two highest light intensities, confirming the ‘thermal’ (= biochemical) character of this part of the transient (Neubauer and Schreiber 1987, Delosme 1967). It can also be noted that by increasing the light intensity to 15000 µmol photons m-2s-1 the peak position of the J step gradually shifted to ~0.5 ms and a considerable dip appeared just beyond the J step. A transient limitation on the donor side associated with P680+-formation is a possible cause for this phenomenon.
0
500
1000
1500
2000
2500
3000
3500
0.01 0.1 1 10 100 1000
DBMIBDW I
J
O
PC
hl a
fluo
resc
ence
(a.u
.)
Time (ms)
300
2000
3000
1000
75
Fig. V-2. A: Effect of MV on the OJIP transient, measured between 300 and 3000 µmol photons m-2 s-1; the effect of double infiltration with MV and DCMU measured at 3000 µmol photons m-2 s-1), n≥20. B: Effect of MV on the OJIP transient, measured between 3000 and 15000 µmol photons m-2 s-1. The upper inset shows the relative contribution of the IP phase to the variable fluorescence calculated as 1-FV/FVcontrol (the difference between the FV values is caused only by changes in the IP phase) as a function of light intensity. In the lower inset, relative variable fluorescence of control leaves, measured between 3000 and 15000 µmol photons m-2 s-1 are shown.
V.4.b Dark adaptation kinetics of the OJIP transient
In Fig. V-3 the dark adaptation kinetics of the OJIP transient after a 0.7 s red pre-pulse of 3000 µmol m-2 s-1 are shown for untreated control leaves (Fig. V-3A), in the presence of DBMIB (Fig. V-3B) or MV (Fig. V-3C). Comparing the dark adaptation kinetics of control leaves with DBMIB-treated leaves several differences are observed. The dip between the J step and P that is so prominent in control leaves at short time intervals between the pulses is missing in DBMIB-treated leaves. Long ago, it was demonstrated for leaves kept under anaerobic conditions that this dip is related to a transient oxidation of the PQ-pool (and QA-) by PSI (e.g. Kautsky et al. 1960, Schreiber and Vidaver 1974). The DBMIB-measurements confirm this interpretation. The most striking effect of MV (Fig. V-3C) is that in its presence the dark adaptation kinetics of the chl a fluorescence are very fast. The dark adaptation kinetics of the IP phase (Fig. V-3C) also indicate that the IP phase is strongly but not completely suppressed by MV.
0
1000
2000
3000
4000
0.01 0.1 1 10 100 1000
MV
DWMV+DCMU
3000
2000
1000
300
P
I
J
O
0
500
1000
1500
2000
0.01 0.1 1 10 100 1000
P
I
J
O
15000
12500
10000
0
0.2
0.4
0.6
0.8
1
0.01 0.1 1 10 100 1000
VJ
VI
30005000
10000
15000
0
0.1
0.2
0.3
0 5000 10000 15000µmol photons m-2s-1
Chl
a f
luor
esce
nce
(a.u
.)
Time (ms) Time (ms)
1-FV/FVcontrolA B
Rel. var. fluorescence
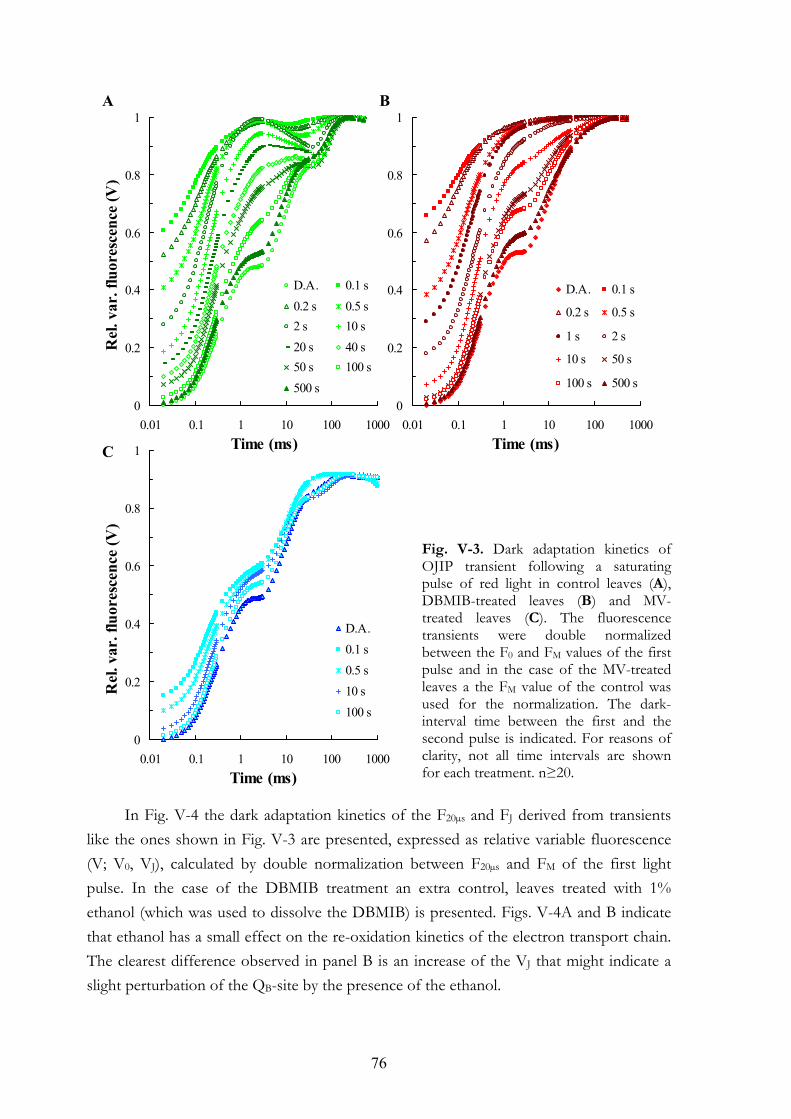
76
Fig. V-3. Dark adaptation kinetics of OJIP transient following a saturating pulse of red light in control leaves (A), DBMIB-treated leaves (B) and MV-treated leaves (C). The fluorescence transients were double normalized between the F0 and FM values of the first pulse and in the case of the MV-treated leaves a the FM value of the control was used for the normalization. The dark-interval time between the first and the second pulse is indicated. For reasons of clarity, not all time intervals are shown for each treatment. n≥20.
In Fig. V-4 the dark adaptation kinetics of the F20µs and FJ derived from transients
like the ones shown in Fig. V-3 are presented, expressed as relative variable fluorescence (V; V0, VJ), calculated by double normalization between F20µs and FM of the first light pulse. In the case of the DBMIB treatment an extra control, leaves treated with 1% ethanol (which was used to dissolve the DBMIB) is presented. Figs. V-4A and B indicate that ethanol has a small effect on the re-oxidation kinetics of the electron transport chain. The clearest difference observed in panel B is an increase of the VJ that might indicate a slight perturbation of the QB-site by the presence of the ethanol.
0
0.2
0.4
0.6
0.8
1
0.01 0.1 1 10 100 1000
D.A. 0.1 s0.2 s 0.5 s2 s 10 s20 s 40 s50 s 100 s500 s
0
0.2
0.4
0.6
0.8
1
0.01 0.1 1 10 100 1000
D.A. 0.1 s
0.2 s 0.5 s
1 s 2 s
10 s 50 s
100 s 500 s
0
0.2
0.4
0.6
0.8
1
0.01 0.1 1 10 100 1000
D.A.0.1 s0.5 s10 s100 s
A
C
BR
el. v
ar. f
luor
esce
nce
(V)
Rel
. var
. flu
ores
cenc
e (V
)
Time (ms)
Time (ms)
Time (ms)
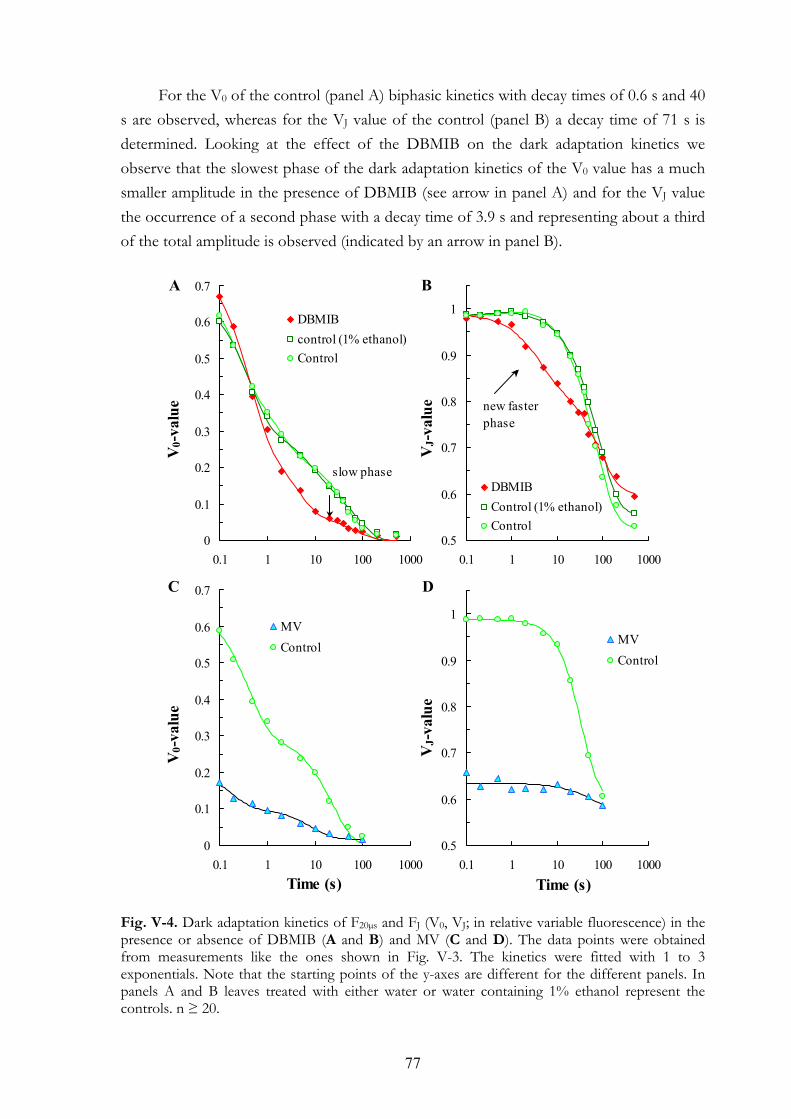
77
For the V0 of the control (panel A) biphasic kinetics with decay times of 0.6 s and 40 s are observed, whereas for the VJ value of the control (panel B) a decay time of 71 s is determined. Looking at the effect of the DBMIB on the dark adaptation kinetics we observe that the slowest phase of the dark adaptation kinetics of the V0 value has a much smaller amplitude in the presence of DBMIB (see arrow in panel A) and for the VJ value the occurrence of a second phase with a decay time of 3.9 s and representing about a third of the total amplitude is observed (indicated by an arrow in panel B). Fig. V-4. Dark adaptation kinetics of F20µs and FJ (V0, VJ; in relative variable fluorescence) in the presence or absence of DBMIB (A and B) and MV (C and D). The data points were obtained from measurements like the ones shown in Fig. V-3. The kinetics were fitted with 1 to 3 exponentials. Note that the starting points of the y-axes are different for the different panels. In panels A and B leaves treated with either water or water containing 1% ethanol represent the controls. n ≥ 20.
0
0.1
0.2
0.3
0.4
0.5
0.6
0.7
0.1 1 10 100 1000
MVControl
0.5
0.6
0.7
0.8
0.9
1
0.1 1 10 100 1000
MVControl
0
0.1
0.2
0.3
0.4
0.5
0.6
0.7
0.1 1 10 100 1000
DBMIBcontrol (1% ethanol)Control
slow phase
0.5
0.6
0.7
0.8
0.9
1
0.1 1 10 100 1000
DBMIBControl (1% ethanol)Control
new faster phase
VJ-
valu
e
Time (s) Time (s)
VJ-
valu
e
V0-
valu
eV
0-va
lue
C
A
D
B
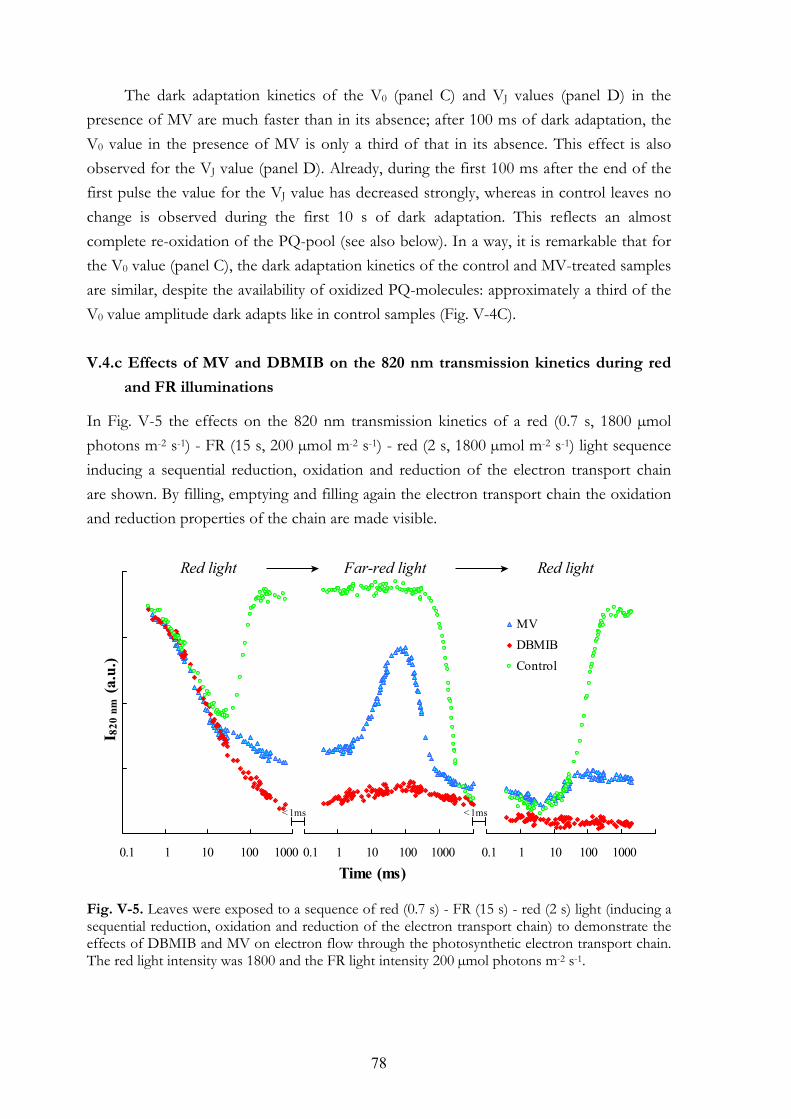
78
The dark adaptation kinetics of the V0 (panel C) and VJ values (panel D) in the presence of MV are much faster than in its absence; after 100 ms of dark adaptation, the V0 value in the presence of MV is only a third of that in its absence. This effect is also observed for the VJ value (panel D). Already, during the first 100 ms after the end of the first pulse the value for the VJ value has decreased strongly, whereas in control leaves no change is observed during the first 10 s of dark adaptation. This reflects an almost complete re-oxidation of the PQ-pool (see also below). In a way, it is remarkable that for the V0 value (panel C), the dark adaptation kinetics of the control and MV-treated samples are similar, despite the availability of oxidized PQ-molecules: approximately a third of the V0 value amplitude dark adapts like in control samples (Fig. V-4C). V.4.c Effects of MV and DBMIB on the 820 nm transmission kinetics during red
and FR illuminations
In Fig. V-5 the effects on the 820 nm transmission kinetics of a red (0.7 s, 1800 µmol photons m-2 s-1) - FR (15 s, 200 µmol m-2 s-1) - red (2 s, 1800 µmol m-2 s-1) light sequence inducing a sequential reduction, oxidation and reduction of the electron transport chain are shown. By filling, emptying and filling again the electron transport chain the oxidation and reduction properties of the chain are made visible.
Fig. V-5. Leaves were exposed to a sequence of red (0.7 s) - FR (15 s) - red (2 s) light (inducing a sequential reduction, oxidation and reduction of the electron transport chain) to demonstrate the effects of DBMIB and MV on electron flow through the photosynthetic electron transport chain. The red light intensity was 1800 and the FR light intensity 200 µmol photons m-2 s-1.
MVDBMIBControl
0.1 1 10 100 1000 0.1 1 10 100 1000 0.1 1 10 100 1000
Time (ms)
I 820
nm
(a.u
.)
Red light Far-red light Red light
< 1 ms < 1 ms
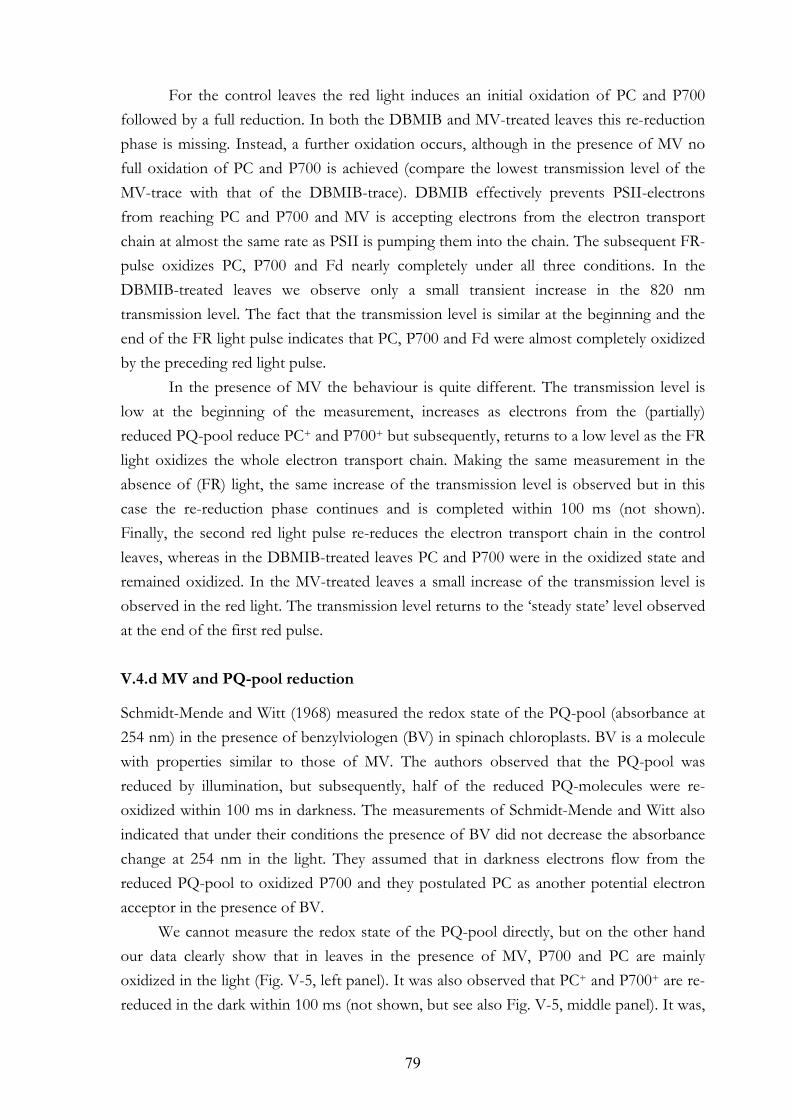
79
For the control leaves the red light induces an initial oxidation of PC and P700 followed by a full reduction. In both the DBMIB and MV-treated leaves this re-reduction phase is missing. Instead, a further oxidation occurs, although in the presence of MV no full oxidation of PC and P700 is achieved (compare the lowest transmission level of the MV-trace with that of the DBMIB-trace). DBMIB effectively prevents PSII-electrons from reaching PC and P700 and MV is accepting electrons from the electron transport chain at almost the same rate as PSII is pumping them into the chain. The subsequent FR-pulse oxidizes PC, P700 and Fd nearly completely under all three conditions. In the DBMIB-treated leaves we observe only a small transient increase in the 820 nm transmission level. The fact that the transmission level is similar at the beginning and the end of the FR light pulse indicates that PC, P700 and Fd were almost completely oxidized by the preceding red light pulse.
In the presence of MV the behaviour is quite different. The transmission level is low at the beginning of the measurement, increases as electrons from the (partially) reduced PQ-pool reduce PC+ and P700+ but subsequently, returns to a low level as the FR light oxidizes the whole electron transport chain. Making the same measurement in the absence of (FR) light, the same increase of the transmission level is observed but in this case the re-reduction phase continues and is completed within 100 ms (not shown). Finally, the second red light pulse re-reduces the electron transport chain in the control leaves, whereas in the DBMIB-treated leaves PC and P700 were in the oxidized state and remained oxidized. In the MV-treated leaves a small increase of the transmission level is observed in the red light. The transmission level returns to the ‘steady state’ level observed at the end of the first red pulse. V.4.d MV and PQ-pool reduction
Schmidt-Mende and Witt (1968) measured the redox state of the PQ-pool (absorbance at 254 nm) in the presence of benzylviologen (BV) in spinach chloroplasts. BV is a molecule with properties similar to those of MV. The authors observed that the PQ-pool was reduced by illumination, but subsequently, half of the reduced PQ-molecules were re-oxidized within 100 ms in darkness. The measurements of Schmidt-Mende and Witt also indicated that under their conditions the presence of BV did not decrease the absorbance change at 254 nm in the light. They assumed that in darkness electrons flow from the reduced PQ-pool to oxidized P700 and they postulated PC as another potential electron acceptor in the presence of BV.
We cannot measure the redox state of the PQ-pool directly, but on the other hand our data clearly show that in leaves in the presence of MV, P700 and PC are mainly oxidized in the light (Fig. V-5, left panel). It was also observed that PC+ and P700+ are re-reduced in the dark within 100 ms (not shown, but see also Fig. V-5, middle panel). It was,
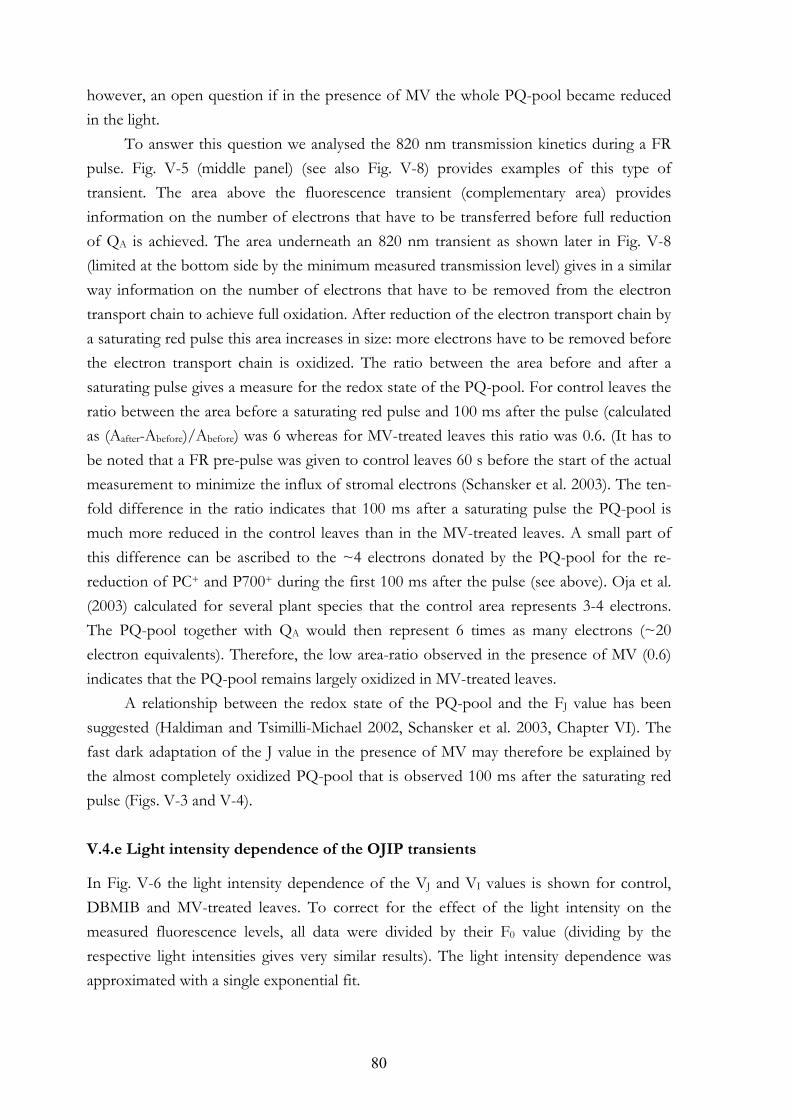
80
however, an open question if in the presence of MV the whole PQ-pool became reduced in the light.
To answer this question we analysed the 820 nm transmission kinetics during a FR pulse. Fig. V-5 (middle panel) (see also Fig. V-8) provides examples of this type of transient. The area above the fluorescence transient (complementary area) provides information on the number of electrons that have to be transferred before full reduction of QA is achieved. The area underneath an 820 nm transient as shown later in Fig. V-8 (limited at the bottom side by the minimum measured transmission level) gives in a similar way information on the number of electrons that have to be removed from the electron transport chain to achieve full oxidation. After reduction of the electron transport chain by a saturating red pulse this area increases in size: more electrons have to be removed before the electron transport chain is oxidized. The ratio between the area before and after a saturating pulse gives a measure for the redox state of the PQ-pool. For control leaves the ratio between the area before a saturating red pulse and 100 ms after the pulse (calculated as (Aafter-Abefore)/Abefore) was 6 whereas for MV-treated leaves this ratio was 0.6. (It has to be noted that a FR pre-pulse was given to control leaves 60 s before the start of the actual measurement to minimize the influx of stromal electrons (Schansker et al. 2003). The ten-fold difference in the ratio indicates that 100 ms after a saturating pulse the PQ-pool is much more reduced in the control leaves than in the MV-treated leaves. A small part of this difference can be ascribed to the ~4 electrons donated by the PQ-pool for the re-reduction of PC+ and P700+ during the first 100 ms after the pulse (see above). Oja et al. (2003) calculated for several plant species that the control area represents 3-4 electrons. The PQ-pool together with QA would then represent 6 times as many electrons (~20 electron equivalents). Therefore, the low area-ratio observed in the presence of MV (0.6) indicates that the PQ-pool remains largely oxidized in MV-treated leaves.
A relationship between the redox state of the PQ-pool and the FJ value has been suggested (Haldiman and Tsimilli-Michael 2002, Schansker et al. 2003, Chapter VI). The fast dark adaptation of the J value in the presence of MV may therefore be explained by the almost completely oxidized PQ-pool that is observed 100 ms after the saturating red pulse (Figs. V-3 and V-4). V.4.e Light intensity dependence of the OJIP transients
In Fig. V-6 the light intensity dependence of the VJ and VI values is shown for control, DBMIB and MV-treated leaves. To correct for the effect of the light intensity on the measured fluorescence levels, all data were divided by their F0 value (dividing by the respective light intensities gives very similar results). The light intensity dependence was approximated with a single exponential fit.
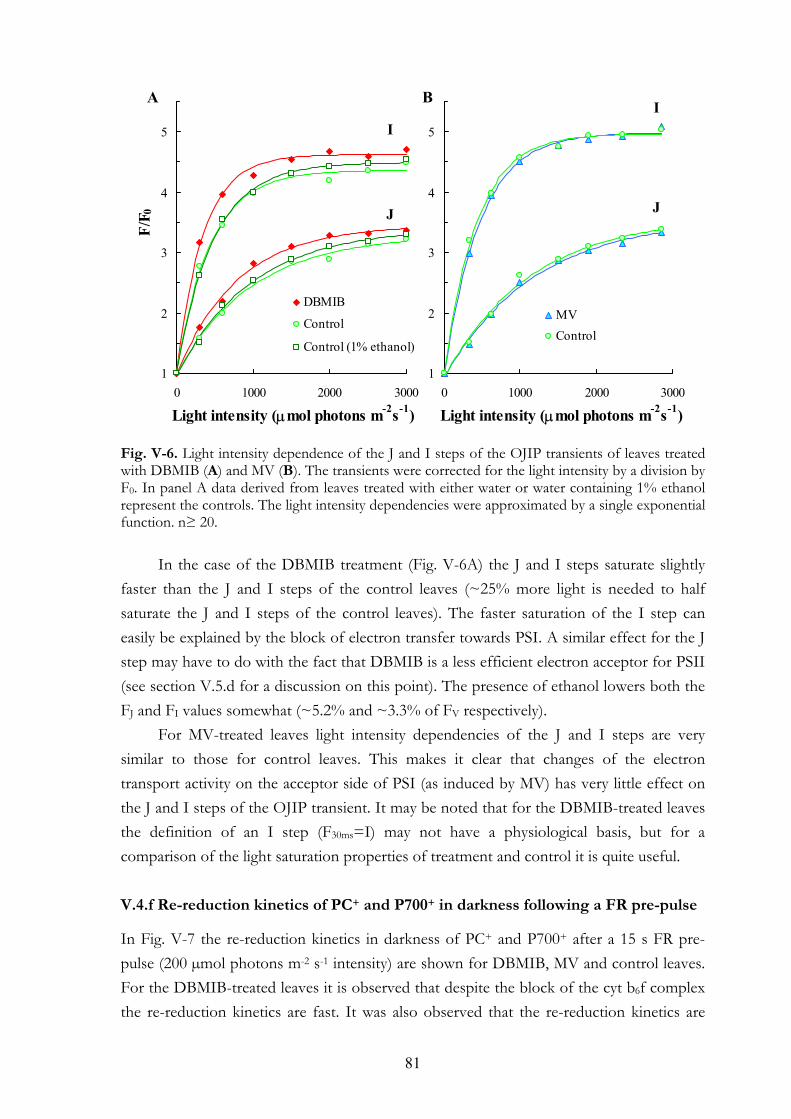
81
Fig. V-6. Light intensity dependence of the J and I steps of the OJIP transients of leaves treated with DBMIB (A) and MV (B). The transients were corrected for the light intensity by a division by F0. In panel A data derived from leaves treated with either water or water containing 1% ethanol represent the controls. The light intensity dependencies were approximated by a single exponential function. n≥ 20.
In the case of the DBMIB treatment (Fig. V-6A) the J and I steps saturate slightly faster than the J and I steps of the control leaves (~25% more light is needed to half saturate the J and I steps of the control leaves). The faster saturation of the I step can easily be explained by the block of electron transfer towards PSI. A similar effect for the J step may have to do with the fact that DBMIB is a less efficient electron acceptor for PSII (see section V.5.d for a discussion on this point). The presence of ethanol lowers both the FJ and FI values somewhat (~5.2% and ~3.3% of FV respectively).
For MV-treated leaves light intensity dependencies of the J and I steps are very similar to those for control leaves. This makes it clear that changes of the electron transport activity on the acceptor side of PSI (as induced by MV) has very little effect on the J and I steps of the OJIP transient. It may be noted that for the DBMIB-treated leaves the definition of an I step (F30ms=I) may not have a physiological basis, but for a comparison of the light saturation properties of treatment and control it is quite useful. V.4.f Re-reduction kinetics of PC+ and P700+ in darkness following a FR pre-pulse
In Fig. V-7 the re-reduction kinetics in darkness of PC+ and P700+ after a 15 s FR pre-pulse (200 µmol photons m-2 s-1 intensity) are shown for DBMIB, MV and control leaves. For the DBMIB-treated leaves it is observed that despite the block of the cyt b6f complex the re-reduction kinetics are fast. It was also observed that the re-reduction kinetics are
1
2
3
4
5
0 1000 2000 3000
DBMIB
Control
Control (1% ethanol)
I
J
1
2
3
4
5
0 1000 2000 3000
MVControl
J
I
Light intensity (µmol photons m-2s-1) Light intensity (µmol photons m-2s-1)
F/F 0
A B
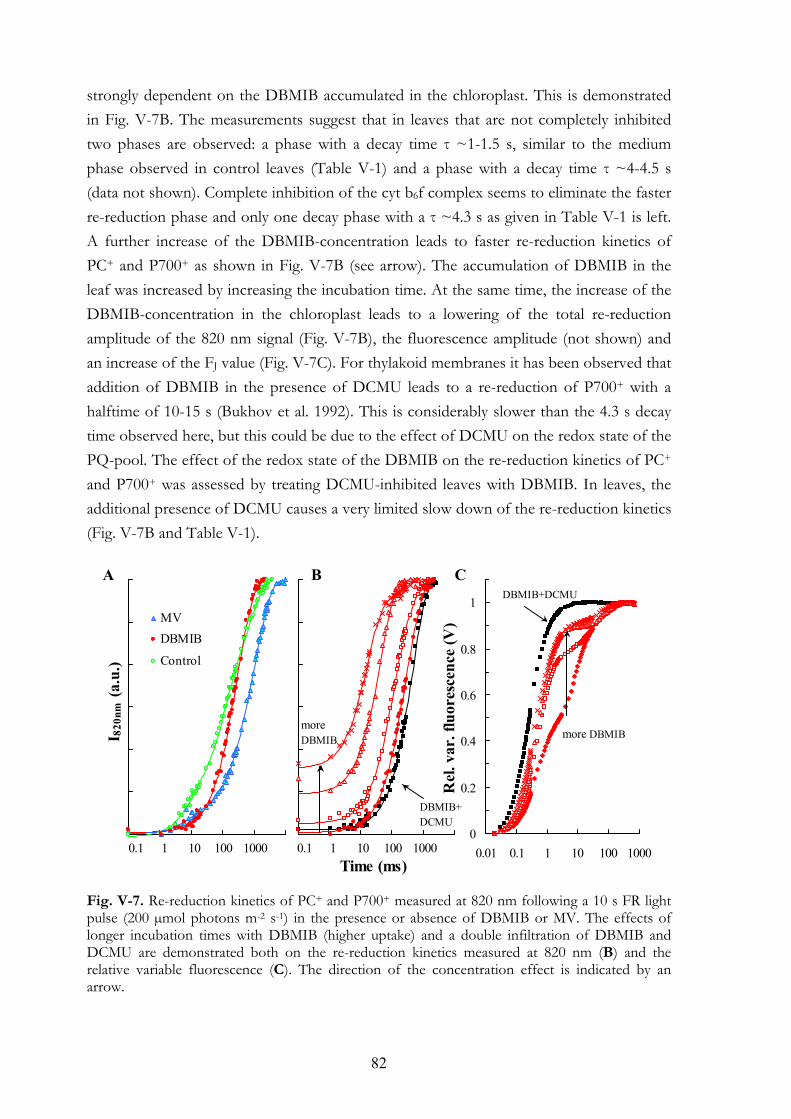
82
strongly dependent on the DBMIB accumulated in the chloroplast. This is demonstrated in Fig. V-7B. The measurements suggest that in leaves that are not completely inhibited two phases are observed: a phase with a decay time τ ~1-1.5 s, similar to the medium phase observed in control leaves (Table V-1) and a phase with a decay time τ ~4-4.5 s (data not shown). Complete inhibition of the cyt b6f complex seems to eliminate the faster re-reduction phase and only one decay phase with a τ ~4.3 s as given in Table V-1 is left. A further increase of the DBMIB-concentration leads to faster re-reduction kinetics of PC+ and P700+ as shown in Fig. V-7B (see arrow). The accumulation of DBMIB in the leaf was increased by increasing the incubation time. At the same time, the increase of the DBMIB-concentration in the chloroplast leads to a lowering of the total re-reduction amplitude of the 820 nm signal (Fig. V-7B), the fluorescence amplitude (not shown) and an increase of the FJ value (Fig. V-7C). For thylakoid membranes it has been observed that addition of DBMIB in the presence of DCMU leads to a re-reduction of P700+ with a halftime of 10-15 s (Bukhov et al. 1992). This is considerably slower than the 4.3 s decay time observed here, but this could be due to the effect of DCMU on the redox state of the PQ-pool. The effect of the redox state of the DBMIB on the re-reduction kinetics of PC+ and P700+ was assessed by treating DCMU-inhibited leaves with DBMIB. In leaves, the additional presence of DCMU causes a very limited slow down of the re-reduction kinetics (Fig. V-7B and Table V-1).
Fig. V-7. Re-reduction kinetics of PC+ and P700+ measured at 820 nm following a 10 s FR light pulse (200 µmol photons m-2 s-1) in the presence or absence of DBMIB or MV. The effects of longer incubation times with DBMIB (higher uptake) and a double infiltration of DBMIB and DCMU are demonstrated both on the re-reduction kinetics measured at 820 nm (B) and the relative variable fluorescence (C). The direction of the concentration effect is indicated by an arrow.
MVDBMIB
Control
moreDBMIB
0
0.2
0.4
0.6
0.8
1
0.01 0.1 1 10 100 1000
more DBMIB
DBMIB+DCMU
0.1 1 10 100 10000.1 1 10 100 1000Time (ms)
Rel
. var
. flu
ores
cenc
e (V
)
I 820
nm (a
.u.)
A B C
DBMIB+DCMU
83
Table V-1. Decay times (s) of the re-reduction phases of PC+ and P700+ in darkness after a FR pre-illumination derived from 820 nm transmission
Fast phase (ms) Medium phase (s) Slow phase (s)
Control 89±19 1.03±0.05 7.49±0.42 DCMU – 2.15±0.06 6.98±0.21 DBMIB – 4.37±0.07a – DBMIB+DCMU – 4.58±0.18 – MV 66±13 2.96±0.32 16.93±1.23 MV+DCMU – – 10.89±0.55 Each individual measurement consists of the average of 3-4 repetitions on the same leaf; the number of independent experiments was 4-8 and each value is given with its standard error.
a This value was very sensitive to final concentration DBMIB accumulated in the leaf, which could be manipulated by varying the incubation time with DBMIB (cf. Fig. V-7B).
In contrast, in the presence of MV the re-reduction kinetics are several-fold slower
than in either the presence of DBMIB or the control. Comparing the re-reduction kinetics of control leaves with those of MV-treated leaves a strong slow down of the medium and slow phases is observed (Table V-1 and Fig. V-7A). The decay time of the fast phase is not affected by the treatment. Comparing the amplitudes of the various phases, we observe that the amplitudes of the fast and medium phases are smaller, whereas the amplitude of the slow phase is not affected (not shown). In the presence of MV and DCMU no further slow down of the re-reduction kinetics is observed but the fast and the medium phases are eliminated (Table V-1). V.4.g FR light-induced transmission changes in dark adapted leaves
The deviation from a nearly monophasic decrease of the 820 nm transmission during a FR pulse provides information on the extent of non-photochemical reduction of the PQ-pool (Schansker et al. 2003). In Fig. V-7 the effect of a FR pulse on the 820 nm transmission kinetics of dark adapted leaves in the presence of various inhibitors/effectors is shown. For control leaves the typical transient increase of the 820 nm transmission peaking at 1.5-2 s is observed (Schansker et al. 2003). In the presence of DCMU the effect is still observed, though the kinetics are modified. In contrast, in the presence of MV, MV+DCMU (double infiltration) and DBMIB, the kinetics are seemingly monophasic and it can also be observed, that the transmission decrease in the 10-200 ms range in these leaves is faster than in control leaves. The figure also shows that DCMU does not affect the kinetics that are observed in the presence of MV.
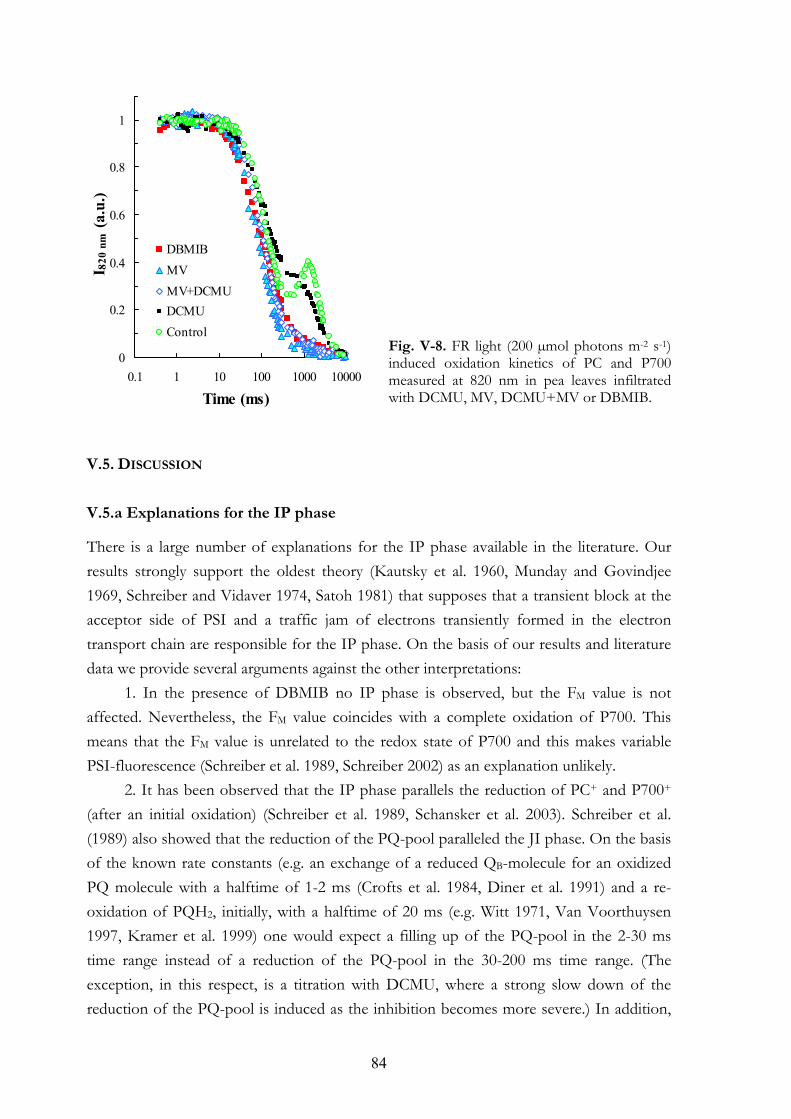
84
Fig. V-8. FR light (200 µmol photons m-2 s-1) induced oxidation kinetics of PC and P700 measured at 820 nm in pea leaves infiltrated with DCMU, MV, DCMU+MV or DBMIB.
V.5. DISCUSSION
V.5.a Explanations for the IP phase
There is a large number of explanations for the IP phase available in the literature. Our results strongly support the oldest theory (Kautsky et al. 1960, Munday and Govindjee 1969, Schreiber and Vidaver 1974, Satoh 1981) that supposes that a transient block at the acceptor side of PSI and a traffic jam of electrons transiently formed in the electron transport chain are responsible for the IP phase. On the basis of our results and literature data we provide several arguments against the other interpretations:
1. In the presence of DBMIB no IP phase is observed, but the FM value is not affected. Nevertheless, the FM value coincides with a complete oxidation of P700. This means that the FM value is unrelated to the redox state of P700 and this makes variable PSI-fluorescence (Schreiber et al. 1989, Schreiber 2002) as an explanation unlikely.
2. It has been observed that the IP phase parallels the reduction of PC+ and P700+ (after an initial oxidation) (Schreiber et al. 1989, Schansker et al. 2003). Schreiber et al. (1989) also showed that the reduction of the PQ-pool paralleled the JI phase. On the basis of the known rate constants (e.g. an exchange of a reduced QB-molecule for an oxidized PQ molecule with a halftime of 1-2 ms (Crofts et al. 1984, Diner et al. 1991) and a re-oxidation of PQH2, initially, with a halftime of 20 ms (e.g. Witt 1971, Van Voorthuysen 1997, Kramer et al. 1999) one would expect a filling up of the PQ-pool in the 2-30 ms time range instead of a reduction of the PQ-pool in the 30-200 ms time range. (The exception, in this respect, is a titration with DCMU, where a strong slow down of the reduction of the PQ-pool is induced as the inhibition becomes more severe.) In addition,
0
0.2
0.4
0.6
0.8
1
0.1 1 10 100 1000 10000
DBMIBMVMV+DCMUDCMUControl
Time (ms)
I 820
nm
(a.u
.)
85
under in vivo conditions (passive infiltration of non-detached leaves with DCMU in complete darkness), a DCMU treatment does not affect the FM value (Tóth et al. 2005a, Chapter III). In other words, PQ-pool quenching as an explanation for the IP phase is not supported by the experimental data.
3. The electric field effect as an explanation for the IP phase (Vredenberg and Bulychev 2003) is also not supported by these data. MV suppresses the IP phase despite the fact that it allows a continuous electron flow as evidenced by the nearly full oxidation of P700 and PC during the illumination with high intensity red light. On the other hand, in the presence of DBMIB, the number of available electron acceptors and thus the number of stable charge separations that can occur is limited, but the FM is not affected. It can also be noted that the membrane potential peaks around the I step and declines beyond that point (Joliot et al. 2004).
4. Given the close correlation between the properties of the IP phase and the electron transport flux beyond the cyt b6f complex, an assignment of the IP phase to a separate population of slow PSII RCs in the stroma lamellae seems also not very likely. The fact that the relative amplitude of the IP phase depends on the light intensity (Fig. V-3; Vredenberg and Bulychev 2003), being relatively larger at lower light intensities, suggests that the IP phase represents the last and slowest rate limiting step of the photosynthetic electron transport chain.
5. The energy-redistribution theory between PSII and PSI presented by Schreiber and Vidaver (1976) had probably to do with the experimental protocol. In dark adapted anaerobic samples, the PQ-pool is reduced and QA and the acceptor side of PSI are oxidized (e.g. Kautsky et al. 1960, Munday and Govindjee 1969). In the presence of a reduced PQ-pool QA becomes quickly reduced by light. Further excitation of the antenna of PSII is then without effect. At the same time, charge separations in PSI start to create an oxidation of the donor side of PSI, which in turn leads to a transfer of electrons from the PQ-pool. However, once the acceptor side of PSI has become reduced, further excitation of the PSI antenna is without effect. The partial oxidation of the PQ-pool allows some re-oxidation of QA and as a consequence excitation of the PSII antennae leads again to some stable charge separations. Thus, the special redox properties of the samples gave the impression that there could be an energy-redistribution from the antennae of the PSII RCs to the antennae of the PSI RCs and back. V.5.b MV selectively affects the IP phase
Neubauer and Schreiber (1987) concluded that in the presence of MV, at low light intensities the I1-P (= JP) phase is suppressed and at saturating light intensity specifically the I2-P (= IP) phase. This would seem to contradict the data presented in Fig. V-3. However, the discrepancy may be explained by the fact that at lower light intensities the J
86
step disappears as the excitation rate drops below the J step limitation. This has two consequences: 1., The accumulation of QA- occurs only when an even slower bottleneck is reached (in this case the re-oxidation of PQH2) and 2., The IP phase in the relative variable fluorescence increases in size (cf. Strasser et al. 1995). As a consequence, as the light intensity (excitation rate) is decreased, accumulation of QA- occurs more and more during the IP phase, representing the slowest process during the first few hundred ms of induction. V.5.c IP phase in thylakoid membranes
In thylakoid membranes, the chl a fluorescence transient shows two clear phases: OJ and JP. The I step is not clearly distinguishable or absent (Haldimann and Strasser 1999, Haldimann and Tsimilli-Michael 2002, Pospíšil and Dau 2002, Bukhov et al. 2003a, see also section III.4.d). This is understandable because during the isolation procedure the Fd on the acceptor side of PSI is washed away. Bukhov et al. (2003) have demonstrated that by creating a new pool of electron acceptors beyond the cyt b6f complex (in their case by adding TMPD; for the working mechanism of TMPD see Witt 1971, Braun et al. 1992) it is possible to observe a kinetic phase analogous to the IP phase in thylakoid membranes. In leaves we were able to do the inverse and create a thylakoid-like situation using DBMIB or MV. V.5.d DBMIB-effects
To show that the effects of DBMIB and MV on the OJIP transient are caused by a block at the cyt b6f complex and the accepting of electrons at the acceptor side of PSI respectively and not by other unknown side effects, we have thoroughly characterized the effects of these substances on the functional properties of the thylakoid membrane under in vivo conditions.
As shown in Fig. V-1A, under our conditions, the DBMIB treatment had no effect on the FM value and very little effect on the F0 (~4% of F0). These observations are similar to those made for chloroplasts where it was observed that low concentrations of DBMIB did not affect FM or F0 (Bowes and Crofts 1981). Since oxidized DBMIB is a strong static quencher of fluorescence (Kitajima and Butler 1975, Bukhov et al. 2003b), this indicates that the DBMIB-concentrations accumulated in the thylakoid membranes (with the exception of Fig. V-7) are relatively low. Fluorescence transients of DBMIB-treated leaves show a slightly higher FJ value (Fig. V-1A). Increasing the effective DBMIB-concentration in the leaf by prolonging the incubation time causes a further increase of the FJ (Fig. V-7C). Though DBMIB can bind to the QB-site and accept electrons from QA it is a much less effective acceptor than the natural occurring quinone (Bowes and Crofts 1981, Satoh et al. 1990). By slowing down the electron transfer reactions at the acceptor side of PSII,
87
DBMIB may seem to mimic the effect of DCMU during the first few ms of a red light pulse. Beyond that point even slower reactions will mask this effect of DBMIB. The double pulse experiments in Fig. V-3 show that during the re-oxidation of the electron transport chain in the presence of DBMIB no dip is observed (cf. Figs. V-3A and B). Since DBMIB blocks electron transfer to PSI this observation supports the theory that the dip depends on PSI-activity (Kautsky et al. 1960, Munday and Govindjee 1969, Schreiber and Vidaver 1974) following a mechanism as described at the end of section V.5.a. V.5.e DBMIB as an electron shuttle
The F20µs value of a fluorescence transient measured after a pre-illumination (Figs. V-3 and V-4) probes the redox-state of QA at the start of the measuring pulse. After a red pre-pulse the whole electron transport chain is reduced and quick re-oxidation of QA- can only occur via recombination with the donor side of PSII. However, this is only possible if the donor side is in the S2 or S3 state. Therefore, the slow phase (τ ~40 s in Fig. V-4A) in the dark adaptation kinetics of the F20µs value (Bukhov et al. 1992, Strasser et al. 2001) after a pre-pulse may represent the re-oxidation of QA- in RCs that are in the S0 or S1 state. These QA- molecules depend for their re-oxidation on an, at least partial, re-oxidation of the PQ-pool. This is supported by the observation of Bukhov et al. (1992) that the slow phase of the recovery of the initial fluorescence level depends on the redox state of the PQ-pool. In the presence of DBMIB, the amplitude of the slow phase is much smaller (Fig. V-4A). Instead, a phase with a τ ~4.3 s is found, indicating that a considerable part of the slowly re-oxidizing QA- molecules have found alternative electron acceptors.
A similar phenomenon is observed for the dark adaptation kinetics of the FJ value (Fig. V-4B). In control leaves, the FJ value does not change for the first 10 s after a saturating red pulse. In the presence of DBMIB a faster phase is observed indicating that a part of the PQ-pool re-oxidizes faster in the presence of DBMIB. The re-reduction kinetics of PC and P700 after a FR pre-pulse are relatively fast (τ ~4.3 s) despite a block at the cyt b6f complex and can be further accelerated by increasing the DBMIB-concentration in the leaf (Fig. V-7B). All these observations seem to indicate that DBMIB, an artificial quinone that is far less hydrophobic than the naturally occurring one, can bypass the cyt b6f complex and donate electrons directly to PC+ and P700+. Subsequently, the re-oxidized DBMIB-molecules can migrate to the QB-site and accept electrons from the QA- molecules that cannot recombine with the donor side of PSII.
Support for this interpretation can be found in the literature (Farineau et al. 1984, Chain and Malkin 1979). Farineau et al. observed that DBMIB restored the fast and medium kinetic phases: 10 and 200 µs of the re-reduction of P700+ with a halftime of 10-15 s. This is considerably slower than the 4.3 s decay time we observe here but this difference could be due to the DCMU present in the experiments of Farineau et al. Non-
88
photochemical reduction of PQ (see control transient in Fig. V-8) may explain why the presence of DCMU had little effect on the re-reduction kinetics of PC+ and P700+ in leaves (Fig. V-7B). On the other hand, we do observe that a build-up of the DBMIB-concentration in the leaf, by increasing the incubation time of the leaves with DBMIB, accelerates the re-reduction kinetics of PC+ and P700+ (Fig. V-7B). V.5.f Re-reduction kinetics of PC+ and P700+
After a FR pulse both PC and P700 are in the oxidized state. It has been suggested (Schansker et al. 2003) that PC+ and P700+ can be re-reduced by either electrons flowing from the stroma via the PQ-pool to PC and P700 (slow and medium phases respectively) or by recombination between the FeS-clusters of PSI and P700+ (fast phase). DBMIB which blocks the cyt b6f complex has the potential to interfere with a re-reduction path via the PQ-pool and MV might affect the recombination reaction by interfering with the acceptor side of PSI.
In leaves that are either fully or nearly completely inhibited by DBMIB the fast re-reduction phase observed in untreated leaves is missing. If the fast phase represents a recombination reaction between the FeS-clusters of PSI and P700+ as suggested by (Schansker et al. 2003) this effect of DBMIB is somewhat unexpected. It is possible to find an explanation of this effect of DBMIB by answering the question why such a recombination reaction can be observed in leaves. During a 10-15 s FR-pulse all electrons are taken out of the system and one would expect that the final result would be a completely oxidized acceptor side of PSI. The fact that the amplitude of the fast re-reduction phase becomes smaller as the FR-pulse length increases (Schansker et al. 2003) supports this. The fast phase does not disappear completely and that may have to do with a small flux of electrons provided by the stroma or even PSII to the PQ-pool. DBMIB does interfere with this electron flow. V.5.g MV and cyclic PSI electron transport
MV is thought to be a very effective electron acceptor that competes strongly with Fd for electrons from the FeS-clusters of PSI and as a consequence strongly suppresses cyclic electron transfer around PSI (Cornic et al. 2000, Heber 2002). Bukhov et al. (1999) observed that MV eliminated the acceleration of the re-reduction of PC+ and P700+ in heat-treated leaves (Fig. VIII-7). The interference of MV with the influx of electrons from the stroma into the PQ-pool can also be observed in Fig. V-8: no transient re-reduction phase is observed. The lack of electrons flowing from the stroma into the PQ-pool also explains why the re-reduction of PC+ and P700+ is a slow process (see Fig. V-7 and Table V-1). Also in the presence of DBMIB the oxidation kinetics miss a transient re-reduction phase. Therefore, re-reduction of PC+ and P700+ by electrons that flow from the stroma
89
through the PQ-pool seems to be critical for the observation of a transient re-reduction phase. Assuming that DCMU has no major side effects, the modification of the oxidation kinetics in the presence of DCMU seems to indicate that PSII may play a role in this process too. Although FR light induced excitation of PSII is very limited it may be just enough to partially compensate electron loss from the cycle and to maintain cyclic electron transfer around PSI for a few seconds (Heber 2002). V.5.h Concluding remarks
The data presented here show that for the observation of an IP phase both an electron flow towards PSI and a transient block at the acceptor side (inactive FNR) are necessary. A block of the electron flow towards PSI by DBMIB and the creation of a bypass at the acceptor side of PSI by MV result in a disappearance of the IP phase. A comparison with data from thylakoid membranes indicates that a third requirement is the presence of an electron acceptor pool with some capacity, be it Fd or TMPD (Bukhov et al. 2003a), beyond the cyt b6f complex.
DBMIB in leaves can bypass its own block at the cyt b6f complex and donate electrons directly to PC and P700 at a relatively slow rate (τ ~4.3 s). When using DBMIB in leaves this side effect should be taken into account and high doses (inducing a strong increase of the J step) should be avoided.
We have shown that the IP phase is related to PSI-activity and as mentioned earlier the JI phase parallels the reduction of the PQ-pool (Schreiber et al. 1989). These two observations support the idea that the different steps of the chl a fluorescence transient (J, I and P) represent the subsequent kinetic bottlenecks of the electron transport chain. These limitations are the exchange of a reduced PQ-molecule at the QB-site with an oxidized one (J step), the re-oxidation of PQH2 (I step) and the transient block imposed by inactive FNR (P level). There is even some evidence that under certain conditions the amplitude of the IP phase may be a rough indicator of PSI-content. For leaves of Mg-deficient sugar beets a (non-linear) relationship was observed between IP phase amplitude and the maximum (reducible/oxidizable) 820 nm transmission amplitude (G. Schansker, C. Hermans and M. Ortega, unpublished data).

90
91
PART II.
APPLICATIONS OF THE CHL A FLUORESCENCE
(OJIP) TRANSIENT

92
93
CHAPTER VI
VI.1. SUMMARY
The plastoquinone (PQ) pool plays an important role in the regulation of the electron transport capacity (PSII-phosphorylation, regulation of several photosynthesis related genes) and it forms a crossing point for several pathways of electron transport. In this study five parameters (F20µs, initial slope (F70µs-F20µs), FJ, area above the OJ phase of the chl a fluorescence transient and a 820 nm transmission parameter (I820nm-10s FR)) were evaluated with respect to their usefulness as indicators of the redox state of the PQ-pool. The redox state of the PQ-pool was manipulated in darkness by anaerobiosis. Four of the five parameters were linearly related to each other. The non-linearity between F20µs and the other four parameters is explained in terms of energetic connectivity of PSII antennae. On transforming F20µs into area growth values (proportional to fraction of QA-) the non-linearity disappeared. A completely reduced PQ-pool was calculated to result in 21% QA- and an apparent equilibrium between QA and the PQ-pool of 4.8 is proposed. Arguments are provided that of the five evaluated parameters the FJ is the most robust and the easiest one to use. Based on the FJ value, a simple method for the quantification of the redox state of the PQ-pool is proposed. VI.2. INTRODUCTION
The PQ-pool has been implied to play a role in the regulation of several processes. A reduced PQ-pool is thought to activate a kinase that is responsible for the phosphorylation of several PSII-subunits (reviewed by Bennett 1991, Allen 1992). The interaction of reduced PQ with the cyt b6f complex may be responsible for the activation of another kinase capable of the phosphorylation of LHCII (Vener et al. 1995, 1997). The redox state of the PQ-pool in conjunction with the redox state of the ferredoxin/thioredoxin pool is also thought to play a role in the regulation of the transcription of several genes related to photosynthetic electron transport (e.g. Allen 1993,
A NON-INVASIVE AND IN VIVO METHOD FOR THE
DETERMINATION OF THE REDOX STATE OF THE
PLASTOQUINONE POOL
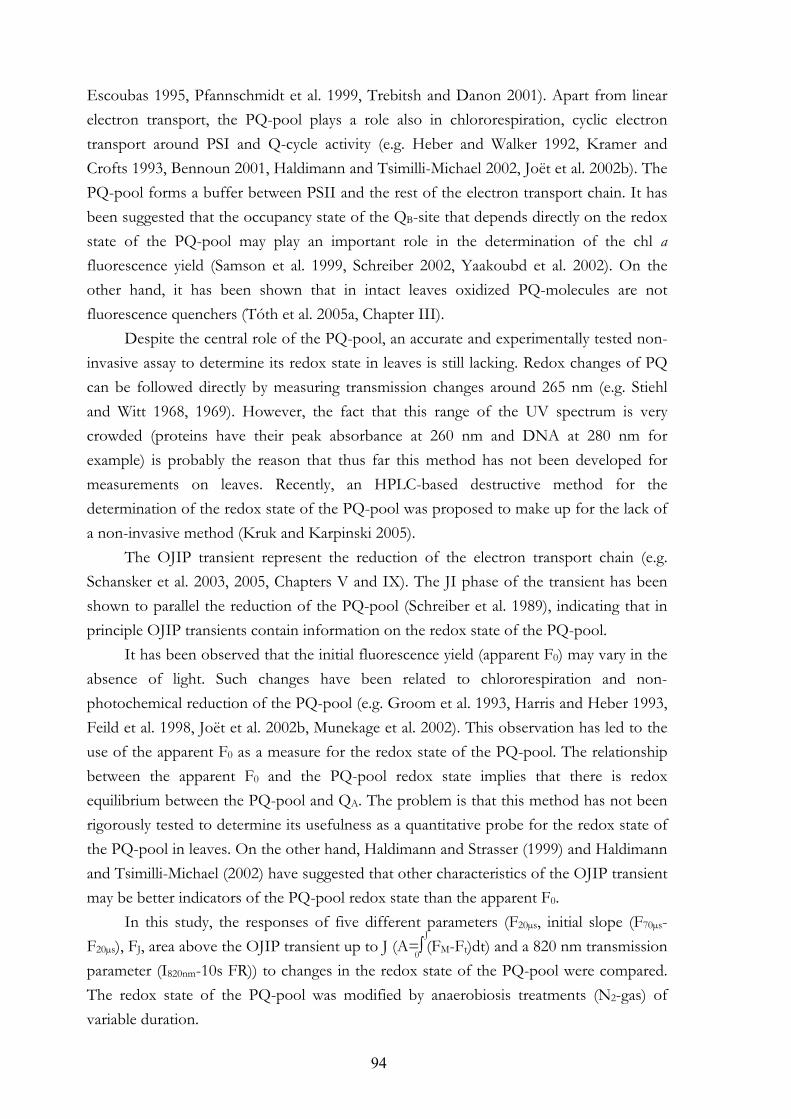
94
Escoubas 1995, Pfannschmidt et al. 1999, Trebitsh and Danon 2001). Apart from linear electron transport, the PQ-pool plays a role also in chlororespiration, cyclic electron transport around PSI and Q-cycle activity (e.g. Heber and Walker 1992, Kramer and Crofts 1993, Bennoun 2001, Haldimann and Tsimilli-Michael 2002, Joët et al. 2002b). The PQ-pool forms a buffer between PSII and the rest of the electron transport chain. It has been suggested that the occupancy state of the QB-site that depends directly on the redox state of the PQ-pool may play an important role in the determination of the chl a fluorescence yield (Samson et al. 1999, Schreiber 2002, Yaakoubd et al. 2002). On the other hand, it has been shown that in intact leaves oxidized PQ-molecules are not fluorescence quenchers (Tóth et al. 2005a, Chapter III).
Despite the central role of the PQ-pool, an accurate and experimentally tested non-invasive assay to determine its redox state in leaves is still lacking. Redox changes of PQ can be followed directly by measuring transmission changes around 265 nm (e.g. Stiehl and Witt 1968, 1969). However, the fact that this range of the UV spectrum is very crowded (proteins have their peak absorbance at 260 nm and DNA at 280 nm for example) is probably the reason that thus far this method has not been developed for measurements on leaves. Recently, an HPLC-based destructive method for the determination of the redox state of the PQ-pool was proposed to make up for the lack of a non-invasive method (Kruk and Karpinski 2005).
The OJIP transient represent the reduction of the electron transport chain (e.g. Schansker et al. 2003, 2005, Chapters V and IX). The JI phase of the transient has been shown to parallel the reduction of the PQ-pool (Schreiber et al. 1989), indicating that in principle OJIP transients contain information on the redox state of the PQ-pool.
It has been observed that the initial fluorescence yield (apparent F0) may vary in the absence of light. Such changes have been related to chlororespiration and non-photochemical reduction of the PQ-pool (e.g. Groom et al. 1993, Harris and Heber 1993, Feild et al. 1998, Joët et al. 2002b, Munekage et al. 2002). This observation has led to the use of the apparent F0 as a measure for the redox state of the PQ-pool. The relationship between the apparent F0 and the PQ-pool redox state implies that there is redox equilibrium between the PQ-pool and QA. The problem is that this method has not been rigorously tested to determine its usefulness as a quantitative probe for the redox state of the PQ-pool in leaves. On the other hand, Haldimann and Strasser (1999) and Haldimann and Tsimilli-Michael (2002) have suggested that other characteristics of the OJIP transient may be better indicators of the PQ-pool redox state than the apparent F0.
In this study, the responses of five different parameters (F20µs, initial slope (F70µs-F20µs), FJ, area above the OJIP transient up to J (A=∫ (FM-Ft)dt) and a 820 nm transmission parameter (I820nm-10s FR)) to changes in the redox state of the PQ-pool were compared. The redox state of the PQ-pool was modified by anaerobiosis treatments (N2-gas) of variable duration.
0
J
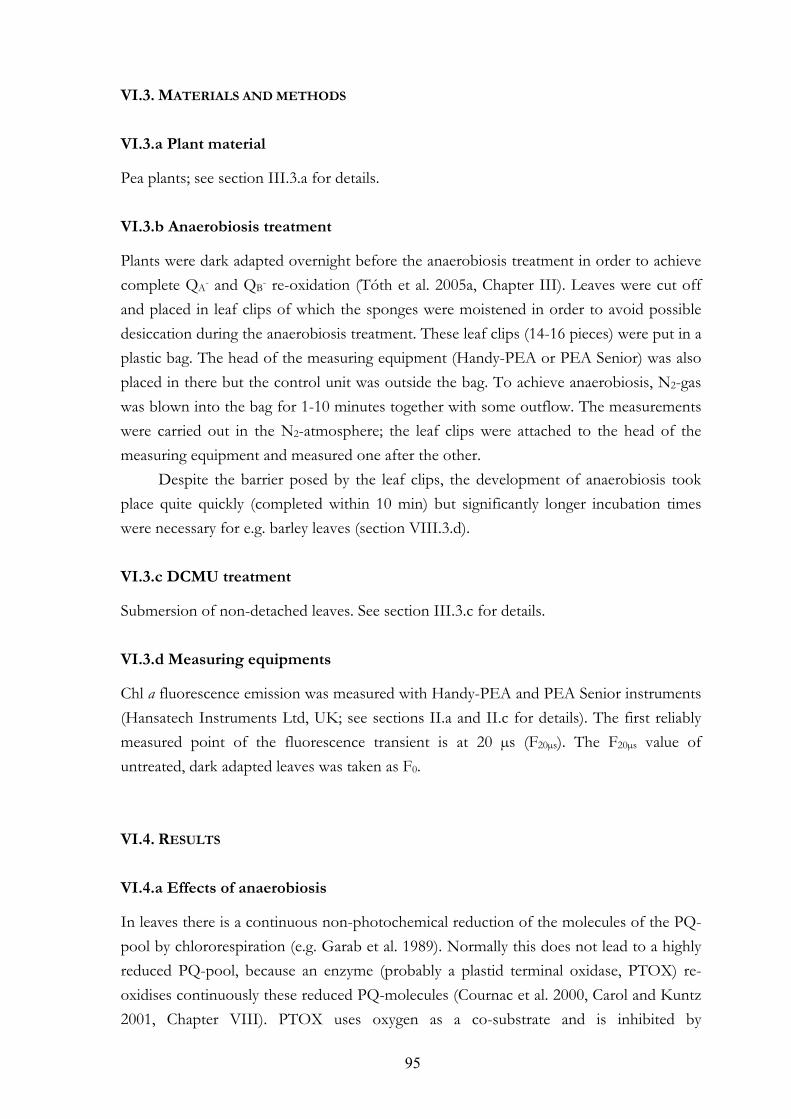
95
VI.3. MATERIALS AND METHODS
VI.3.a Plant material
Pea plants; see section III.3.a for details. VI.3.b Anaerobiosis treatment
Plants were dark adapted overnight before the anaerobiosis treatment in order to achieve complete QA- and QB- re-oxidation (Tóth et al. 2005a, Chapter III). Leaves were cut off and placed in leaf clips of which the sponges were moistened in order to avoid possible desiccation during the anaerobiosis treatment. These leaf clips (14-16 pieces) were put in a plastic bag. The head of the measuring equipment (Handy-PEA or PEA Senior) was also placed in there but the control unit was outside the bag. To achieve anaerobiosis, N2-gas was blown into the bag for 1-10 minutes together with some outflow. The measurements were carried out in the N2-atmosphere; the leaf clips were attached to the head of the measuring equipment and measured one after the other.
Despite the barrier posed by the leaf clips, the development of anaerobiosis took place quite quickly (completed within 10 min) but significantly longer incubation times were necessary for e.g. barley leaves (section VIII.3.d). VI.3.c DCMU treatment
Submersion of non-detached leaves. See section III.3.c for details. VI.3.d Measuring equipments
Chl a fluorescence emission was measured with Handy-PEA and PEA Senior instruments (Hansatech Instruments Ltd, UK; see sections II.a and II.c for details). The first reliably measured point of the fluorescence transient is at 20 µs (F20µs). The F20µs value of untreated, dark adapted leaves was taken as F0. VI.4. RESULTS
VI.4.a Effects of anaerobiosis
In leaves there is a continuous non-photochemical reduction of the molecules of the PQ-pool by chlororespiration (e.g. Garab et al. 1989). Normally this does not lead to a highly reduced PQ-pool, because an enzyme (probably a plastid terminal oxidase, PTOX) re-oxidises continuously these reduced PQ-molecules (Cournac et al. 2000, Carol and Kuntz 2001, Chapter VIII). PTOX uses oxygen as a co-substrate and is inhibited by
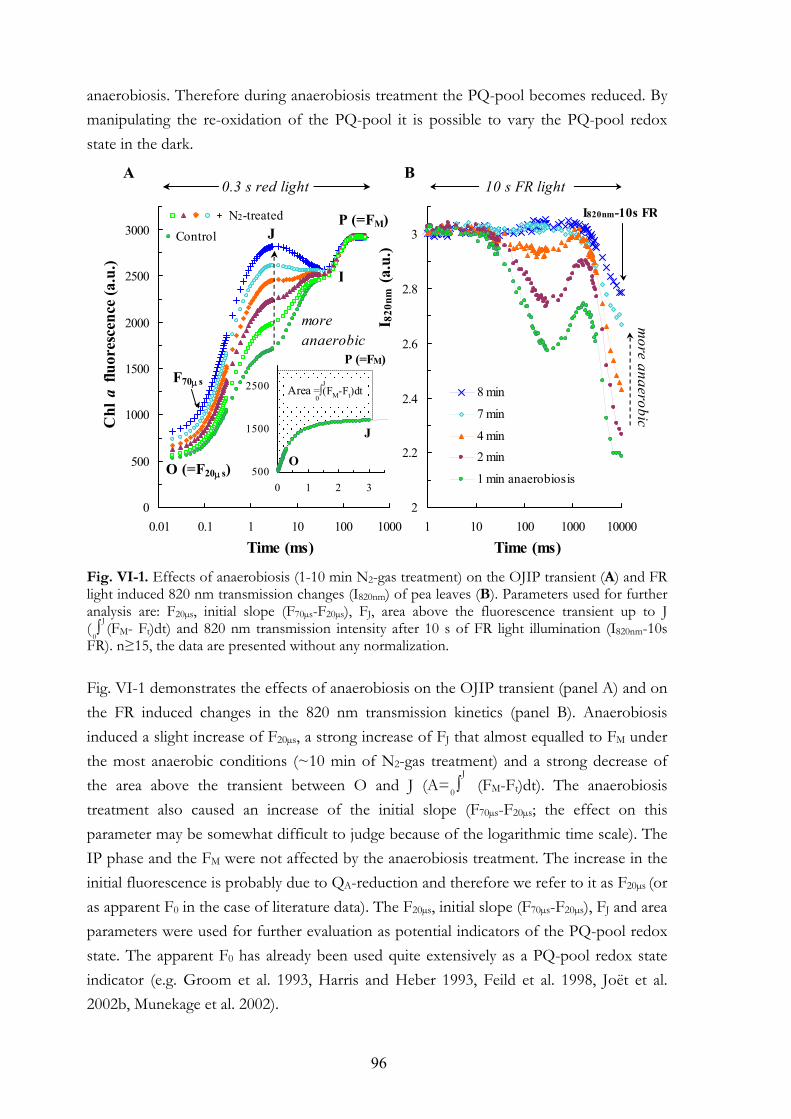
96
anaerobiosis. Therefore during anaerobiosis treatment the PQ-pool becomes reduced. By manipulating the re-oxidation of the PQ-pool it is possible to vary the PQ-pool redox state in the dark.
Fig. VI-1. Effects of anaerobiosis (1-10 min N2-gas treatment) on the OJIP transient (A) and FR light induced 820 nm transmission changes (I820nm) of pea leaves (B). Parameters used for further analysis are: F20µs, initial slope (F70µs-F20µs), FJ, area above the fluorescence transient up to J ( ∫ (FM- Ft)dt) and 820 nm transmission intensity after 10 s of FR light illumination (I820nm-10s FR). n≥15, the data are presented without any normalization. Fig. VI-1 demonstrates the effects of anaerobiosis on the OJIP transient (panel A) and on the FR induced changes in the 820 nm transmission kinetics (panel B). Anaerobiosis induced a slight increase of F20µs, a strong increase of FJ that almost equalled to FM under the most anaerobic conditions (~10 min of N2-gas treatment) and a strong decrease of the area above the transient between O and J (A= ∫ (FM-Ft)dt). The anaerobiosis treatment also caused an increase of the initial slope (F70µs-F20µs; the effect on this parameter may be somewhat difficult to judge because of the logarithmic time scale). The IP phase and the FM were not affected by the anaerobiosis treatment. The increase in the initial fluorescence is probably due to QA-reduction and therefore we refer to it as F20µs (or as apparent F0 in the case of literature data). The F20µs, initial slope (F70µs-F20µs), FJ and area parameters were used for further evaluation as potential indicators of the PQ-pool redox state. The apparent F0 has already been used quite extensively as a PQ-pool redox state indicator (e.g. Groom et al. 1993, Harris and Heber 1993, Feild et al. 1998, Joët et al. 2002b, Munekage et al. 2002).
Time (ms)Time (ms)
0
500
1000
1500
2000
2500
3000
0.01 0.1 1 10 100 1000
Control J
I
2
2.2
2.4
2.6
2.8
3
1 10 100 1000 10000
8 min
7 min
4 min2 min
1 min anaerobiosis
Chl
a fl
uore
scen
ce (a
.u.)
I 820
nm (a
.u.)
more anaerobic
more anaerobic
A B
P (=FM) I820nm-10s FRN2-treated
O (=F20µ s)
10 s FR light
P (=FM)
J
0.3 s red light
500
1500
2500
0 1 2 3
O
Area =∫(FM-Ft)dt0
JF70µ s
0
J
0
J
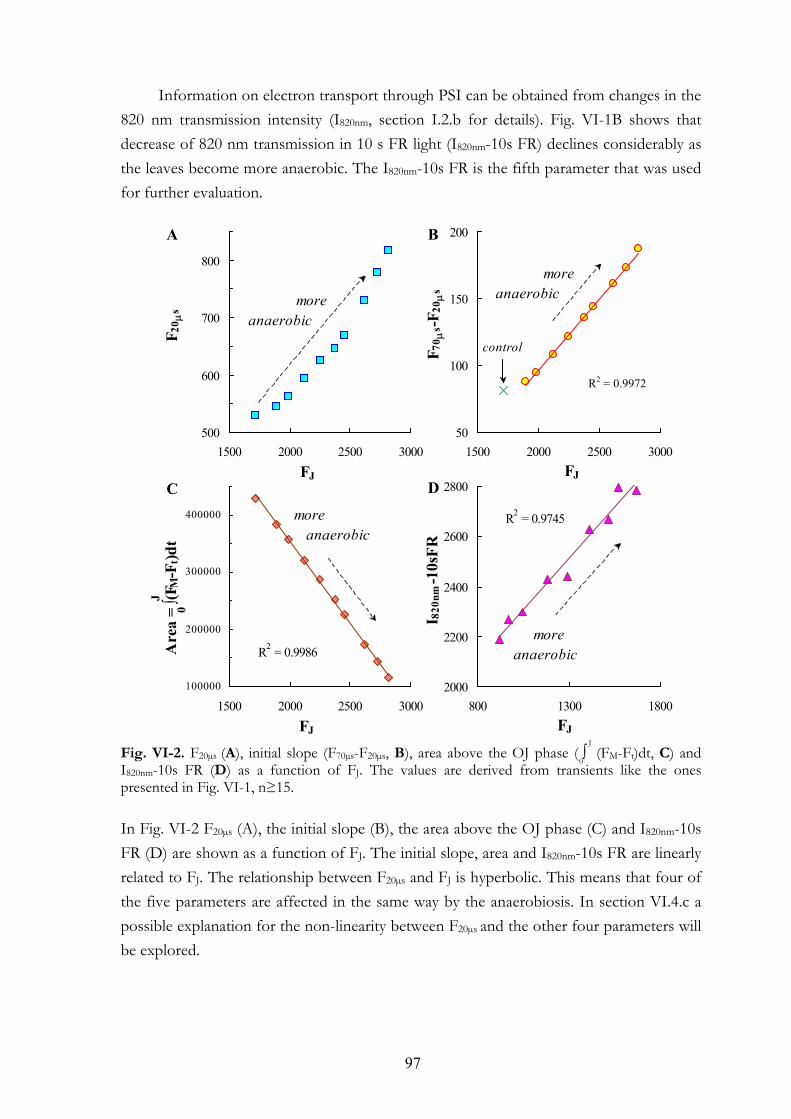
97
Information on electron transport through PSI can be obtained from changes in the 820 nm transmission intensity (I820nm, section I.2.b for details). Fig. VI-1B shows that decrease of 820 nm transmission in 10 s FR light (I820nm-10s FR) declines considerably as the leaves become more anaerobic. The I820nm-10s FR is the fifth parameter that was used for further evaluation. Fig. VI-2. F20µs (A), initial slope (F70µs-F20µs, B), area above the OJ phase ( ∫ (FM-Ft)dt, C) and I820nm-10s FR (D) as a function of FJ. The values are derived from transients like the ones presented in Fig. VI-1, n≥15. In Fig. VI-2 F20µs (A), the initial slope (B), the area above the OJ phase (C) and I820nm-10s FR (D) are shown as a function of FJ. The initial slope, area and I820nm-10s FR are linearly related to FJ. The relationship between F20µs and FJ is hyperbolic. This means that four of the five parameters are affected in the same way by the anaerobiosis. In section VI.4.c a possible explanation for the non-linearity between F20µs and the other four parameters will be explored.
500
600
700
800
1500 2000 2500 3000
R2 = 0.9986
100000
200000
300000
400000
1500 2000 2500 3000
R2 = 0.9745
2000
2200
2400
2600
2800
800 1300 1800
Are
a = ∫(F
M-F
t)dt
0
J
more anaerobic
more anaerobic
more anaerobic
A
C
R2 = 0.9972
50
100
150
200
1500 2000 2500 3000
more anaerobic
B
DFJ FJ
FJ FJ
control
F 20 µ
s
F 70 µ
s-F20µ
sI 8
20nm
-10s
FR
0
J
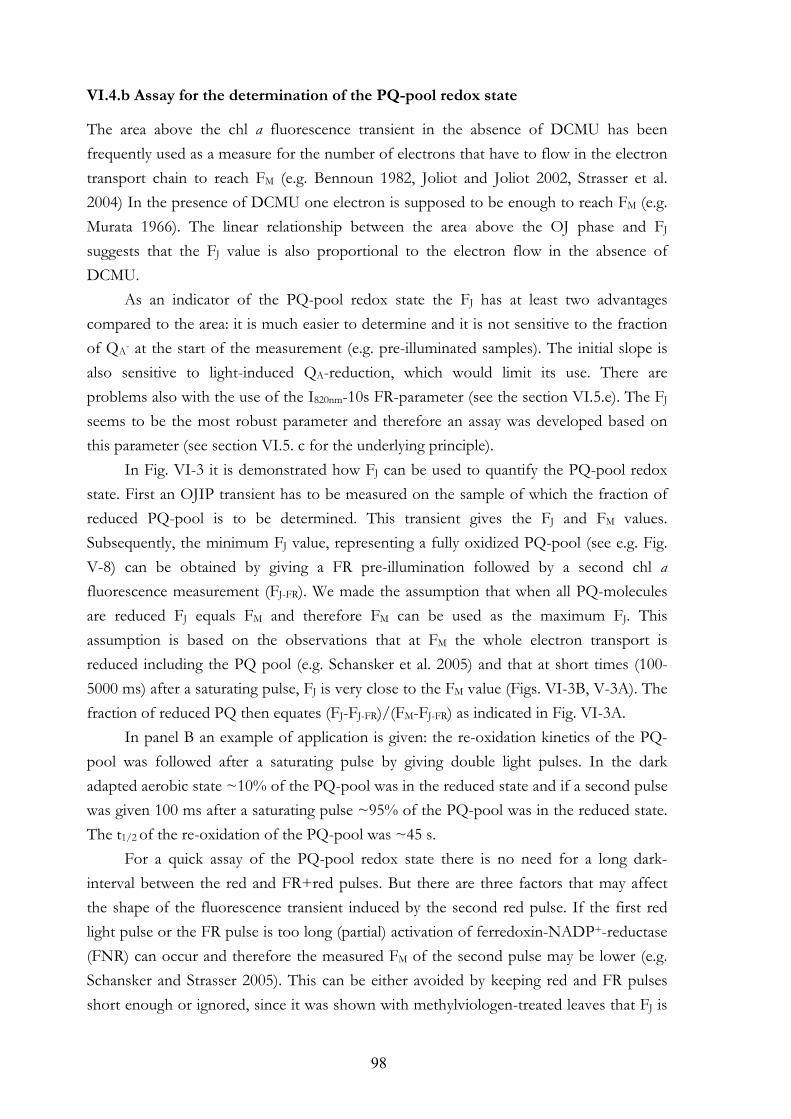
98
VI.4.b Assay for the determination of the PQ-pool redox state
The area above the chl a fluorescence transient in the absence of DCMU has been frequently used as a measure for the number of electrons that have to flow in the electron transport chain to reach FM (e.g. Bennoun 1982, Joliot and Joliot 2002, Strasser et al. 2004) In the presence of DCMU one electron is supposed to be enough to reach FM (e.g. Murata 1966). The linear relationship between the area above the OJ phase and FJ suggests that the FJ value is also proportional to the electron flow in the absence of DCMU.
As an indicator of the PQ-pool redox state the FJ has at least two advantages compared to the area: it is much easier to determine and it is not sensitive to the fraction of QA- at the start of the measurement (e.g. pre-illuminated samples). The initial slope is also sensitive to light-induced QA-reduction, which would limit its use. There are problems also with the use of the I820nm-10s FR-parameter (see the section VI.5.e). The FJ seems to be the most robust parameter and therefore an assay was developed based on this parameter (see section VI.5. c for the underlying principle).
In Fig. VI-3 it is demonstrated how FJ can be used to quantify the PQ-pool redox state. First an OJIP transient has to be measured on the sample of which the fraction of reduced PQ-pool is to be determined. This transient gives the FJ and FM values. Subsequently, the minimum FJ value, representing a fully oxidized PQ-pool (see e.g. Fig. V-8) can be obtained by giving a FR pre-illumination followed by a second chl a fluorescence measurement (FJ-FR). We made the assumption that when all PQ-molecules are reduced FJ equals FM and therefore FM can be used as the maximum FJ. This assumption is based on the observations that at FM the whole electron transport is reduced including the PQ pool (e.g. Schansker et al. 2005) and that at short times (100-5000 ms) after a saturating pulse, FJ is very close to the FM value (Figs. VI-3B, V-3A). The fraction of reduced PQ then equates (FJ-FJ-FR)/(FM-FJ-FR) as indicated in Fig. VI-3A.
In panel B an example of application is given: the re-oxidation kinetics of the PQ-pool was followed after a saturating pulse by giving double light pulses. In the dark adapted aerobic state ~10% of the PQ-pool was in the reduced state and if a second pulse was given 100 ms after a saturating pulse ~95% of the PQ-pool was in the reduced state. The t1/2 of the re-oxidation of the PQ-pool was ~45 s.
For a quick assay of the PQ-pool redox state there is no need for a long dark-interval between the red and FR+red pulses. But there are three factors that may affect the shape of the fluorescence transient induced by the second red pulse. If the first red light pulse or the FR pulse is too long (partial) activation of ferredoxin-NADP+-reductase (FNR) can occur and therefore the measured FM of the second pulse may be lower (e.g. Schansker and Strasser 2005). This can be either avoided by keeping red and FR pulses short enough or ignored, since it was shown with methylviologen-treated leaves that FJ is
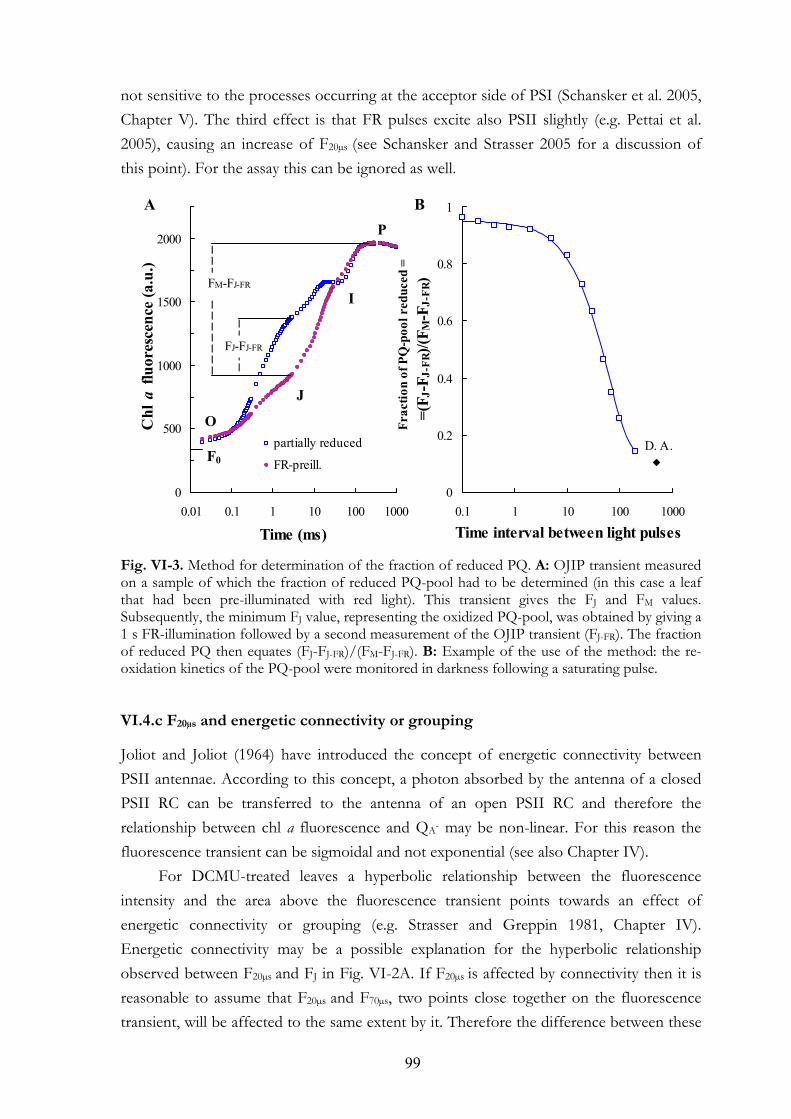
99
not sensitive to the processes occurring at the acceptor side of PSI (Schansker et al. 2005, Chapter V). The third effect is that FR pulses excite also PSII slightly (e.g. Pettai et al. 2005), causing an increase of F20µs (see Schansker and Strasser 2005 for a discussion of this point). For the assay this can be ignored as well. Fig. VI-3. Method for determination of the fraction of reduced PQ. A: OJIP transient measured on a sample of which the fraction of reduced PQ-pool had to be determined (in this case a leaf that had been pre-illuminated with red light). This transient gives the FJ and FM values. Subsequently, the minimum FJ value, representing the oxidized PQ-pool, was obtained by giving a 1 s FR-illumination followed by a second measurement of the OJIP transient (FJ-FR). The fraction of reduced PQ then equates (FJ-FJ-FR)/(FM-FJ-FR). B: Example of the use of the method: the re-oxidation kinetics of the PQ-pool were monitored in darkness following a saturating pulse.
VI.4.c F20µs and energetic connectivity or grouping
Joliot and Joliot (1964) have introduced the concept of energetic connectivity between PSII antennae. According to this concept, a photon absorbed by the antenna of a closed PSII RC can be transferred to the antenna of an open PSII RC and therefore the relationship between chl a fluorescence and QA- may be non-linear. For this reason the fluorescence transient can be sigmoidal and not exponential (see also Chapter IV).
For DCMU-treated leaves a hyperbolic relationship between the fluorescence intensity and the area above the fluorescence transient points towards an effect of energetic connectivity or grouping (e.g. Strasser and Greppin 1981, Chapter IV). Energetic connectivity may be a possible explanation for the hyperbolic relationship observed between F20µs and FJ in Fig. VI-2A. If F20µs is affected by connectivity then it is reasonable to assume that F20µs and F70µs, two points close together on the fluorescence transient, will be affected to the same extent by it. Therefore the difference between these
0
500
1000
1500
2000
0.01 0.1 1 10 100 1000
partially reduced
FR-preill.
0
0.2
0.4
0.6
0.8
1
0.1 1 10 100 1000
Chl
a fl
uore
scen
ce (a
.u.)
Time (ms) Time interval between light pulses
Frac
tion
of P
Q-p
ool r
educ
ed =
=(F J
-FJ-
FR)/(
F M-F
J-FR
)FM-FJ-FR
FJ-FJ-FR
F0
O
J
I
P
D. A.
A B
100
two points should be unaffected by connectivity. The linear relationship between F70µs-F20µs and FJ in Fig. VI-2B supports this reasoning. It important to note that the F0 value itself (=all QA in the oxidized state) is not affected by connectivity because the phenomenon can only be observed when excitation energy is transferred from closed to open RCs. In a dark adapted untreated sample, all PSII RCs are supposed to be open at 20 µs whereas at 70 µs some of the RCs are closed. For this reason, the F70µs-F20µs parameter of the dark adapted, untreated sample was off the line in Fig. VI-2B.
Fig. VI-4. Determination of the fraction of QA- at F20µs by taking connectivity into account. A: OJIP transients of control, anaerobic and DCMU-treated samples. B: Normalized area growth (assumed to represent the fraction of QA-) of a DCMU-treated sample. C: the chl a fluorescence transient vs. area growth of a DCMU-treated sample was used as a reference curve to read the fraction of QA- at F20µs of the anaerobic sample. D: Fraction of QA- vs. the fraction of reduced PQ, determined for the anaerobic sample of panel A and also for less anaerobic samples that are not shown in this figure.
500
1000
1500
2000
2500
3000
0 0.2 0.4 0.6 0.8 1500
1000
1500
2000
2500
3000
0.01 0.1 1 10 100 1000
J
I
0
0.1
0.2
0 0.2 0.4 0.6 0.8 1
P (=FM)A C
DTime (ms) Norm. area growth (fraction QA-)
Chl
a fl
uore
scen
ce (a
.u.)
Chl
a fl
uore
scen
ce (a
.u.)
O
more anaerobic
0
0.2
0.4
0.6
0.8
1
0 0.5 1 1.5 2
DCMU
B
FM -F
Jcontr.
Nor
m. a
rea
grow
th (f
ract
ion
Q A- )
Time (ms) (FJ-FJcontr.)/(FM-FJcontr.) ~ PQred
PQtotal
DCMUcontrolanaerobic
DCMU
Nor
m. a
rea
grow
th (f
ract
ion
Q A- )
101
If the non-linearity between the F20µs values and FJ is due to connectivity, the relationship between the fraction QA- and FJ should be linear. In DCMU-treated samples the QA-reduction kinetics can be obtained by determining the area growth kinetics above the chl a fluorescence transient (Murata et al. 1966, Malkin et al. 1966, Melis and Schreiber 1979, Chapter IV, Fig. VI-4B). In Fig. VI-4 a fluorescence transient in the presence of DCMU (panel A), the normalized area growth curve of a DCMU-treated sample (panel B) and chl a fluorescence as a function of normalized area growth (panel C) are shown. The latter can be used as a calibration curve for transformation of fluorescence values into area growth (i.e. fraction of QA-) values. We assumed that this calibration curve could be used for the OJ phase of fluorescence transients measured in the absence of DCMU (see the arrows from Fig. VI-4A to the x-axis of panel C).
This assumption is supported by experiments showing that the normalized area growth between O and J is nearly identical in the presence and absence of DCMU (Fig. IX-1). It is also important to note that the F0 and FM values of DCMU-treated sample were the same as in control samples (Tóth et al. 2005a, Chapter III).
In Fig. VI-4D the fraction QA- is given as a function of the relative change in FJ ((FJ-FJcontr)/(FM-FJcontr)), which is proportional to PQred/PQtotal. There is a very good linear relationship between the two parameters that seems to justify the assumptions made. Fig.VI-4D indicates that under the most anaerobic conditions QA is reduced in ~19.3 % of the RCs. As a simplification, the FJ of a dark adapted sample (FJcontrol) was used here to represent a fully oxidized PQ-pool. The use of FR light was avoided because apart from oxidizing the PQ-pool, FR slightly excites PSII (Schansker and Strasser 2005) and it would disturb the determination of F0. However, as only about 10% of the PQ-pool is in the reduced state in a dark adapted leaf, the use of FJcontrol instead of FJ-FR has probably minor effects.
VI.5 DISCUSSION
Light-dependent changes in the chl a fluorescence yield are thought to be determined by changes in the redox state of QA (reviewed by e.g. Govindjee 1995, Samson et al. 1999, Strasser et al. 2004). At the same time the OJIP transient reflects the reduction of the photosynthetic electron transport chain (e.g. Schansker et al. 2005, 2006, Chapter V). In the present study we make use of this duality.
VI.5.a The apparent F0 or F20µs
The apparent F0 has been used in several publications on chlororespiration and cyclic PSI transport as a measure for the redox state of the PQ-pool (e.g. Groom et al. 1993, Harris
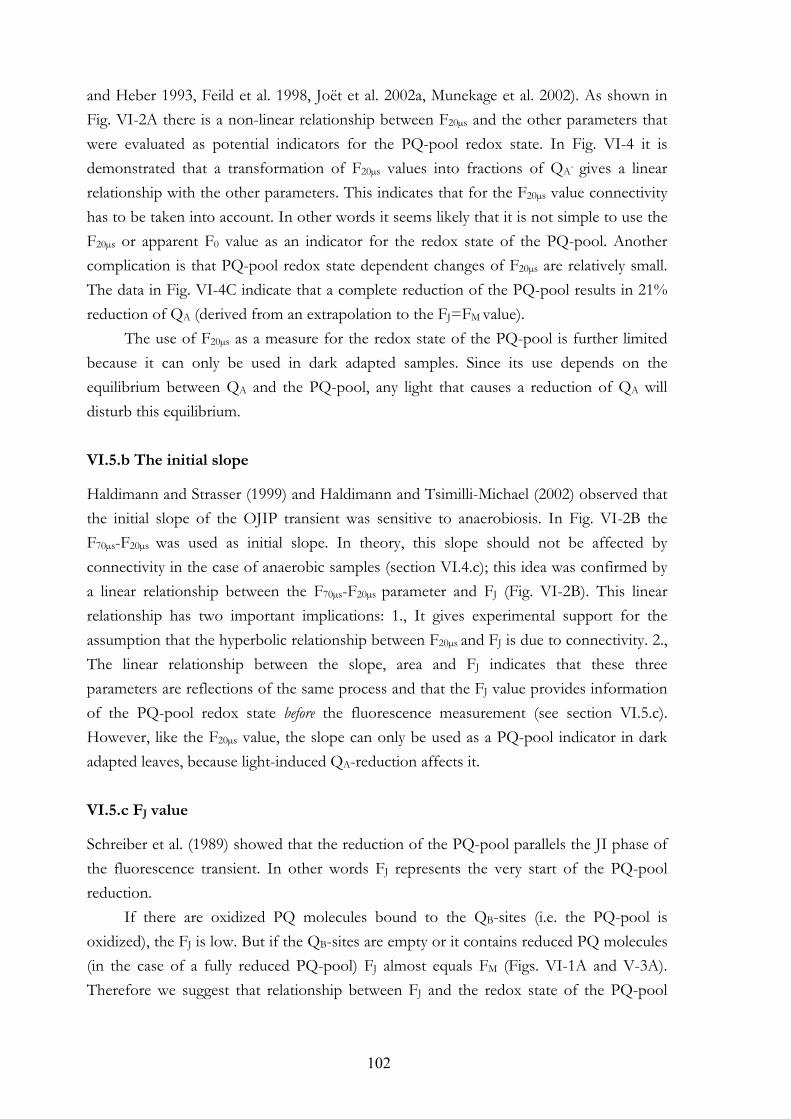
102
and Heber 1993, Feild et al. 1998, Joët et al. 2002a, Munekage et al. 2002). As shown in Fig. VI-2A there is a non-linear relationship between F20µs and the other parameters that were evaluated as potential indicators for the PQ-pool redox state. In Fig. VI-4 it is demonstrated that a transformation of F20µs values into fractions of QA- gives a linear relationship with the other parameters. This indicates that for the F20µs value connectivity has to be taken into account. In other words it seems likely that it is not simple to use the F20µs or apparent F0 value as an indicator for the redox state of the PQ-pool. Another complication is that PQ-pool redox state dependent changes of F20µs are relatively small. The data in Fig. VI-4C indicate that a complete reduction of the PQ-pool results in 21% reduction of QA (derived from an extrapolation to the FJ=FM value).
The use of F20µs as a measure for the redox state of the PQ-pool is further limited because it can only be used in dark adapted samples. Since its use depends on the equilibrium between QA and the PQ-pool, any light that causes a reduction of QA will disturb this equilibrium.
VI.5.b The initial slope
Haldimann and Strasser (1999) and Haldimann and Tsimilli-Michael (2002) observed that the initial slope of the OJIP transient was sensitive to anaerobiosis. In Fig. VI-2B the F70µs-F20µs was used as initial slope. In theory, this slope should not be affected by connectivity in the case of anaerobic samples (section VI.4.c); this idea was confirmed by a linear relationship between the F70µs-F20µs parameter and FJ (Fig. VI-2B). This linear relationship has two important implications: 1., It gives experimental support for the assumption that the hyperbolic relationship between F20µs and FJ is due to connectivity. 2., The linear relationship between the slope, area and FJ indicates that these three parameters are reflections of the same process and that the FJ value provides information of the PQ-pool redox state before the fluorescence measurement (see section VI.5.c). However, like the F20µs value, the slope can only be used as a PQ-pool indicator in dark adapted leaves, because light-induced QA-reduction affects it.
VI.5.c FJ value
Schreiber et al. (1989) showed that the reduction of the PQ-pool parallels the JI phase of the fluorescence transient. In other words FJ represents the very start of the PQ-pool reduction.
If there are oxidized PQ molecules bound to the QB-sites (i.e. the PQ-pool is oxidized), the FJ is low. But if the QB-sites are empty or it contains reduced PQ molecules (in the case of a fully reduced PQ-pool) FJ almost equals FM (Figs. VI-1A and V-3A). Therefore we suggest that relationship between FJ and the redox state of the PQ-pool
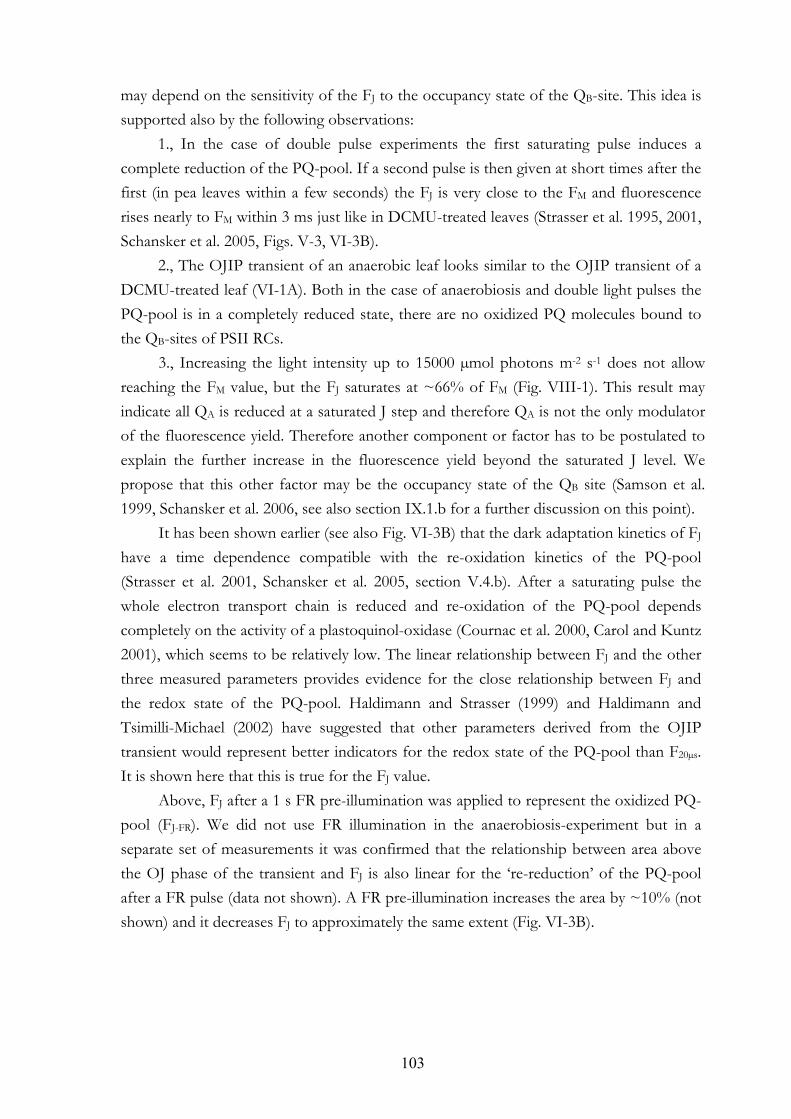
103
may depend on the sensitivity of the FJ to the occupancy state of the QB-site. This idea is supported also by the following observations:
1., In the case of double pulse experiments the first saturating pulse induces a complete reduction of the PQ-pool. If a second pulse is then given at short times after the first (in pea leaves within a few seconds) the FJ is very close to the FM and fluorescence rises nearly to FM within 3 ms just like in DCMU-treated leaves (Strasser et al. 1995, 2001, Schansker et al. 2005, Figs. V-3, VI-3B).
2., The OJIP transient of an anaerobic leaf looks similar to the OJIP transient of a DCMU-treated leaf (VI-1A). Both in the case of anaerobiosis and double light pulses the PQ-pool is in a completely reduced state, there are no oxidized PQ molecules bound to the QB-sites of PSII RCs.
3., Increasing the light intensity up to 15000 µmol photons m-2 s-1 does not allow reaching the FM value, but the FJ saturates at ~66% of FM (Fig. VIII-1). This result may indicate all QA is reduced at a saturated J step and therefore QA is not the only modulator of the fluorescence yield. Therefore another component or factor has to be postulated to explain the further increase in the fluorescence yield beyond the saturated J level. We propose that this other factor may be the occupancy state of the QB site (Samson et al. 1999, Schansker et al. 2006, see also section IX.1.b for a further discussion on this point).
It has been shown earlier (see also Fig. VI-3B) that the dark adaptation kinetics of FJ have a time dependence compatible with the re-oxidation kinetics of the PQ-pool (Strasser et al. 2001, Schansker et al. 2005, section V.4.b). After a saturating pulse the whole electron transport chain is reduced and re-oxidation of the PQ-pool depends completely on the activity of a plastoquinol-oxidase (Cournac et al. 2000, Carol and Kuntz 2001), which seems to be relatively low. The linear relationship between FJ and the other three measured parameters provides evidence for the close relationship between FJ and the redox state of the PQ-pool. Haldimann and Strasser (1999) and Haldimann and Tsimilli-Michael (2002) have suggested that other parameters derived from the OJIP transient would represent better indicators for the redox state of the PQ-pool than F20µs. It is shown here that this is true for the FJ value.
Above, FJ after a 1 s FR pre-illumination was applied to represent the oxidized PQ-pool (FJ-FR). We did not use FR illumination in the anaerobiosis-experiment but in a separate set of measurements it was confirmed that the relationship between area above the OJ phase of the transient and FJ is also linear for the ‘re-reduction’ of the PQ-pool after a FR pulse (data not shown). A FR pre-illumination increases the area by ~10% (not shown) and it decreases FJ to approximately the same extent (Fig. VI-3B).
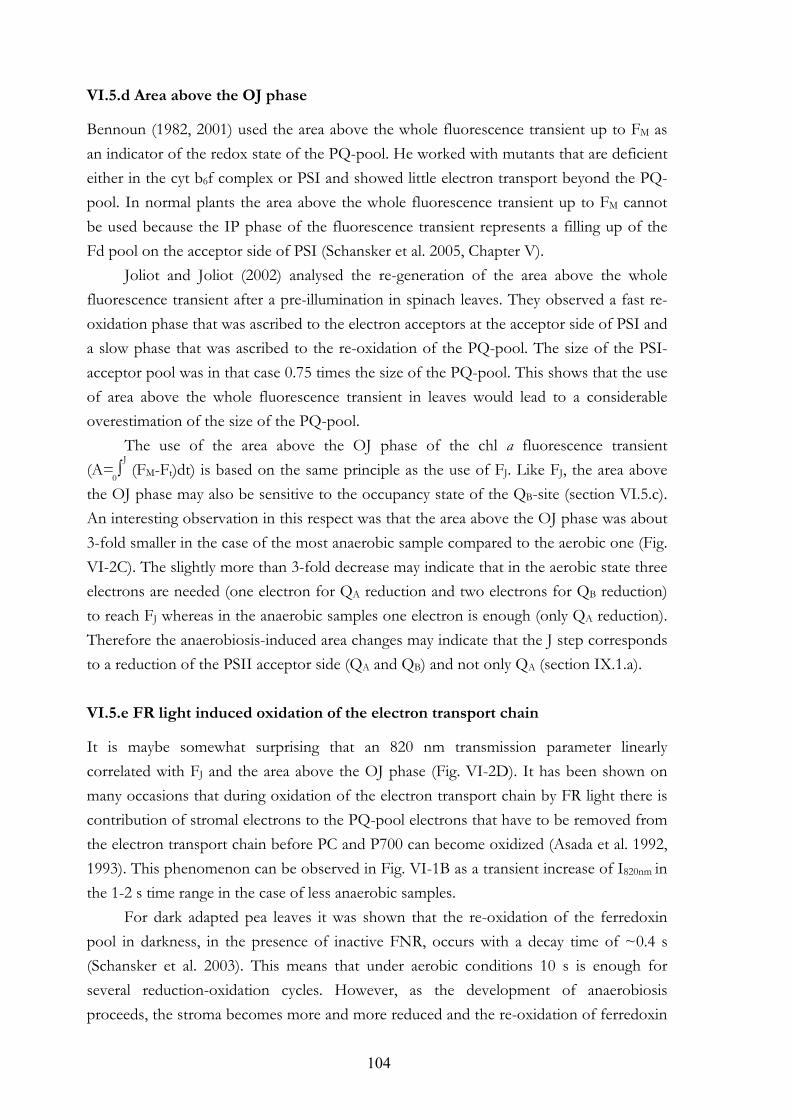
104
VI.5.d Area above the OJ phase
Bennoun (1982, 2001) used the area above the whole fluorescence transient up to FM as an indicator of the redox state of the PQ-pool. He worked with mutants that are deficient either in the cyt b6f complex or PSI and showed little electron transport beyond the PQ-pool. In normal plants the area above the whole fluorescence transient up to FM cannot be used because the IP phase of the fluorescence transient represents a filling up of the Fd pool on the acceptor side of PSI (Schansker et al. 2005, Chapter V).
Joliot and Joliot (2002) analysed the re-generation of the area above the whole fluorescence transient after a pre-illumination in spinach leaves. They observed a fast re-oxidation phase that was ascribed to the electron acceptors at the acceptor side of PSI and a slow phase that was ascribed to the re-oxidation of the PQ-pool. The size of the PSI-acceptor pool was in that case 0.75 times the size of the PQ-pool. This shows that the use of area above the whole fluorescence transient in leaves would lead to a considerable overestimation of the size of the PQ-pool.
The use of the area above the OJ phase of the chl a fluorescence transient (A= ∫ (FM-Ft)dt) is based on the same principle as the use of FJ. Like FJ, the area above the OJ phase may also be sensitive to the occupancy state of the QB-site (section VI.5.c). An interesting observation in this respect was that the area above the OJ phase was about 3-fold smaller in the case of the most anaerobic sample compared to the aerobic one (Fig. VI-2C). The slightly more than 3-fold decrease may indicate that in the aerobic state three electrons are needed (one electron for QA reduction and two electrons for QB reduction) to reach FJ whereas in the anaerobic samples one electron is enough (only QA reduction). Therefore the anaerobiosis-induced area changes may indicate that the J step corresponds to a reduction of the PSII acceptor side (QA and QB) and not only QA (section IX.1.a).
VI.5.e FR light induced oxidation of the electron transport chain
It is maybe somewhat surprising that an 820 nm transmission parameter linearly correlated with FJ and the area above the OJ phase (Fig. VI-2D). It has been shown on many occasions that during oxidation of the electron transport chain by FR light there is contribution of stromal electrons to the PQ-pool electrons that have to be removed from the electron transport chain before PC and P700 can become oxidized (Asada et al. 1992, 1993). This phenomenon can be observed in Fig. VI-1B as a transient increase of I820nm in the 1-2 s time range in the case of less anaerobic samples.
For dark adapted pea leaves it was shown that the re-oxidation of the ferredoxin pool in darkness, in the presence of inactive FNR, occurs with a decay time of ~0.4 s (Schansker et al. 2003). This means that under aerobic conditions 10 s is enough for several reduction-oxidation cycles. However, as the development of anaerobiosis proceeds, the stroma becomes more and more reduced and the re-oxidation of ferredoxin
0
J
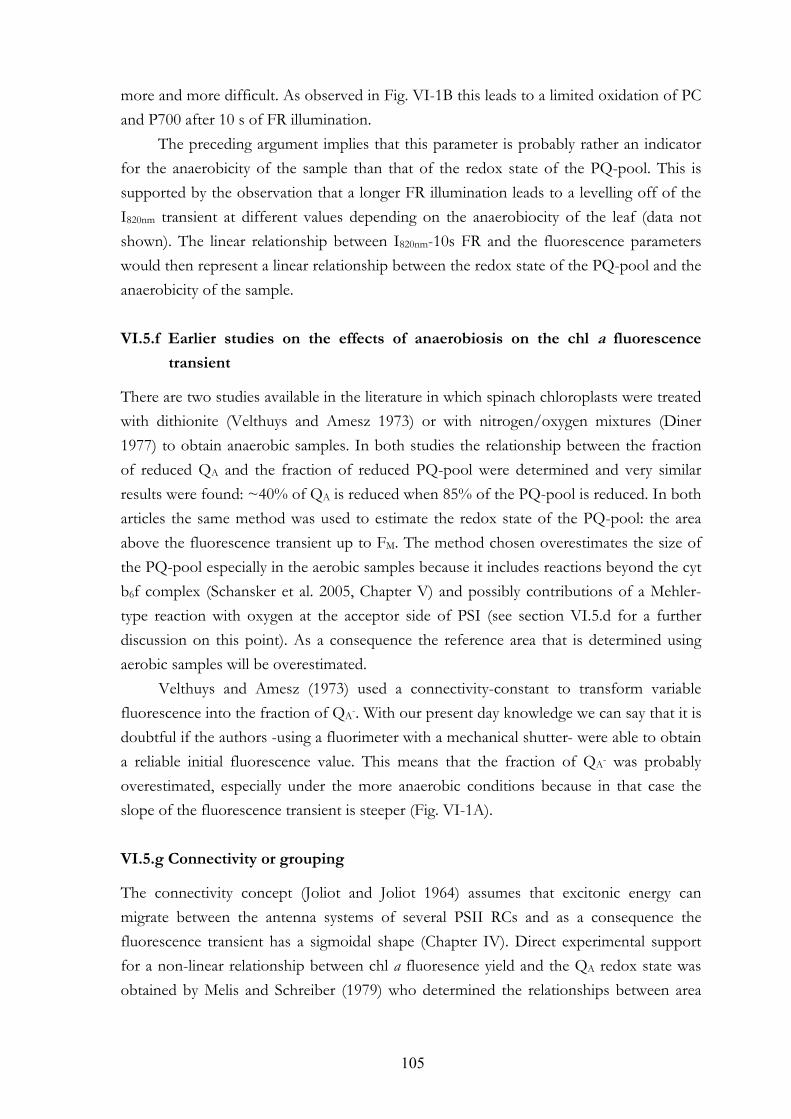
105
more and more difficult. As observed in Fig. VI-1B this leads to a limited oxidation of PC and P700 after 10 s of FR illumination.
The preceding argument implies that this parameter is probably rather an indicator for the anaerobicity of the sample than that of the redox state of the PQ-pool. This is supported by the observation that a longer FR illumination leads to a levelling off of the I820nm transient at different values depending on the anaerobiocity of the leaf (data not shown). The linear relationship between I820nm-10s FR and the fluorescence parameters would then represent a linear relationship between the redox state of the PQ-pool and the anaerobicity of the sample.
VI.5.f Earlier studies on the effects of anaerobiosis on the chl a fluorescence
transient
There are two studies available in the literature in which spinach chloroplasts were treated with dithionite (Velthuys and Amesz 1973) or with nitrogen/oxygen mixtures (Diner 1977) to obtain anaerobic samples. In both studies the relationship between the fraction of reduced QA and the fraction of reduced PQ-pool were determined and very similar results were found: ~40% of QA is reduced when 85% of the PQ-pool is reduced. In both articles the same method was used to estimate the redox state of the PQ-pool: the area above the fluorescence transient up to FM. The method chosen overestimates the size of the PQ-pool especially in the aerobic samples because it includes reactions beyond the cyt b6f complex (Schansker et al. 2005, Chapter V) and possibly contributions of a Mehler-type reaction with oxygen at the acceptor side of PSI (see section VI.5.d for a further discussion on this point). As a consequence the reference area that is determined using aerobic samples will be overestimated.
Velthuys and Amesz (1973) used a connectivity-constant to transform variable fluorescence into the fraction of QA-. With our present day knowledge we can say that it is doubtful if the authors -using a fluorimeter with a mechanical shutter- were able to obtain a reliable initial fluorescence value. This means that the fraction of QA- was probably overestimated, especially under the more anaerobic conditions because in that case the slope of the fluorescence transient is steeper (Fig. VI-1A).
VI.5.g Connectivity or grouping
The connectivity concept (Joliot and Joliot 1964) assumes that excitonic energy can migrate between the antenna systems of several PSII RCs and as a consequence the fluorescence transient has a sigmoidal shape (Chapter IV). Direct experimental support for a non-linear relationship between chl a fluoresence yield and the QA redox state was obtained by Melis and Schreiber (1979) who determined the relationships between area
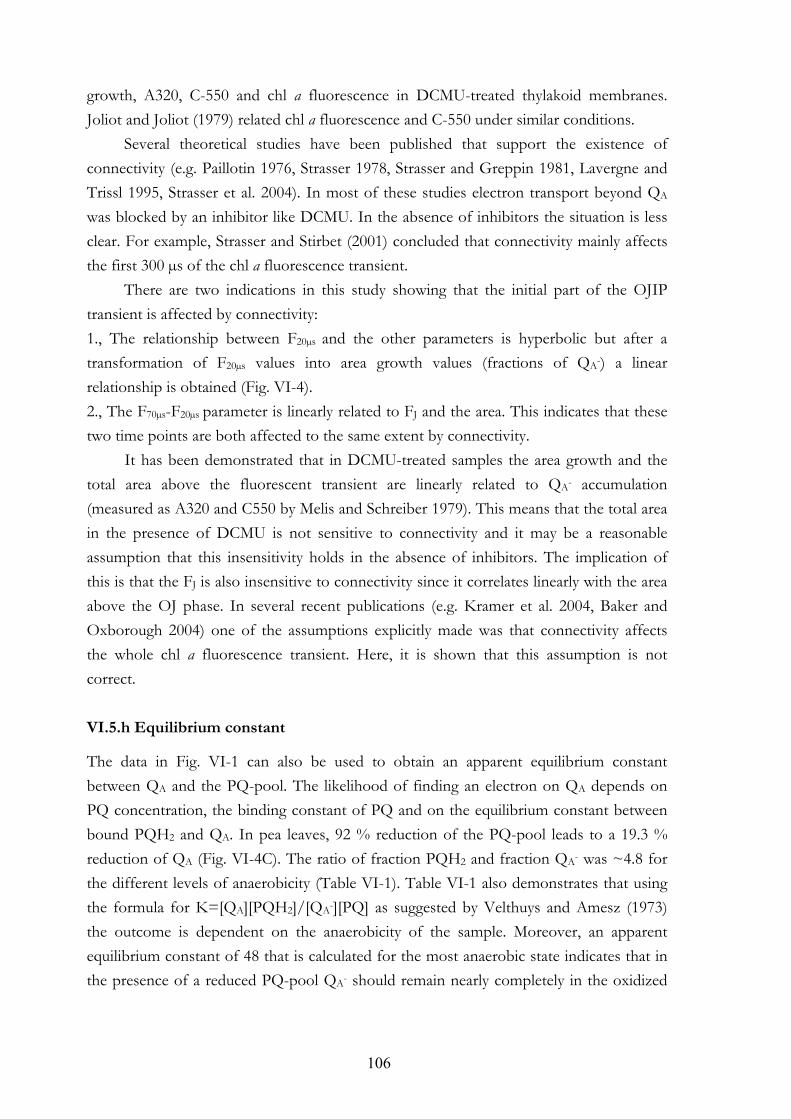
106
growth, A320, C-550 and chl a fluorescence in DCMU-treated thylakoid membranes. Joliot and Joliot (1979) related chl a fluorescence and C-550 under similar conditions.
Several theoretical studies have been published that support the existence of connectivity (e.g. Paillotin 1976, Strasser 1978, Strasser and Greppin 1981, Lavergne and Trissl 1995, Strasser et al. 2004). In most of these studies electron transport beyond QA was blocked by an inhibitor like DCMU. In the absence of inhibitors the situation is less clear. For example, Strasser and Stirbet (2001) concluded that connectivity mainly affects the first 300 µs of the chl a fluorescence transient.
There are two indications in this study showing that the initial part of the OJIP transient is affected by connectivity: 1., The relationship between F20µs and the other parameters is hyperbolic but after a transformation of F20µs values into area growth values (fractions of QA-) a linear relationship is obtained (Fig. VI-4). 2., The F70µs-F20µs parameter is linearly related to FJ and the area. This indicates that these two time points are both affected to the same extent by connectivity.
It has been demonstrated that in DCMU-treated samples the area growth and the total area above the fluorescent transient are linearly related to QA- accumulation (measured as A320 and C550 by Melis and Schreiber 1979). This means that the total area in the presence of DCMU is not sensitive to connectivity and it may be a reasonable assumption that this insensitivity holds in the absence of inhibitors. The implication of this is that the FJ is also insensitive to connectivity since it correlates linearly with the area above the OJ phase. In several recent publications (e.g. Kramer et al. 2004, Baker and Oxborough 2004) one of the assumptions explicitly made was that connectivity affects the whole chl a fluorescence transient. Here, it is shown that this assumption is not correct.
VI.5.h Equilibrium constant
The data in Fig. VI-1 can also be used to obtain an apparent equilibrium constant between QA and the PQ-pool. The likelihood of finding an electron on QA depends on PQ concentration, the binding constant of PQ and on the equilibrium constant between bound PQH2 and QA. In pea leaves, 92 % reduction of the PQ-pool leads to a 19.3 % reduction of QA (Fig. VI-4C). The ratio of fraction PQH2 and fraction QA- was ~4.8 for the different levels of anaerobicity (Table VI-1). Table VI-1 also demonstrates that using the formula for K=[QA][PQH2]/[QA-][PQ] as suggested by Velthuys and Amesz (1973) the outcome is dependent on the anaerobicity of the sample. Moreover, an apparent equilibrium constant of 48 that is calculated for the most anaerobic state indicates that in the presence of a reduced PQ-pool QA- should remain nearly completely in the oxidized
107
state and this also does not agree with what is experimentally observed. In that respect, an apparent K of 4.8 based on the ratio between PQH2 and QA- agrees well with our dataset.
A potential complication that could affect the relationship between QA- and PQH2 would be if the binding constants of PQ and PQH2 for the QB-site were different, but literature data show that they are similar (Crofts and Wraight 1983). It means that the fraction of PSII RCs with bound PQH2 will decrease or increase linearly as a function of the redox state of the PQ-pool.
The values found in the literature for the equilibrium constant of the reaction QA- ↔ PQH2 can be split in two groups: 1 according to Bouges-Bocquet (1975) or ≥50 according to Joliot et al. (1992), Shinkarev and Wraight (1993) and Lazár (2003) where the high values were based on the formula for K mentioned above. Our value for the equilibrium constant is on the other hand close to the value of at least 5 that was reported by Van Best and Duysens (1975). Table VI-1. Comparison between the ratio of the fractions of plastoquinol and QA- and [QA][PQH2]/[QA-][PQ], the formula used to calculate the equilibrium constant K, using the experimental data presented in Fig. VI-3C.
Fraction QA- Fraction PQH2
0.193 0.92 4.76 48.0 0.174 0.84 4.83 24.9 0.156 0.75 4.81 16.2 0.12 0.61 5.08 11.15 0.1 0.54 5.4 10.6 0.09 0.44 4.89 7.9 0.06 0.33 5.5 7.7
VI.5.i The assay for the determination of the PQ-pool redox state
In this study, the FJ value is suggested as an indicator for the PQ-pool because it is sensitive to the occupancy state of the QB-site by oxidized PQ molecule, which in turn is determined by the redox state of the PQ-pool. Unstressed pea leaves were used in this study and one could imagine that there are circumstances where the assay would not work.
For the assay a correct FM value (all RC closed) has to be determined. In severely heat-treated samples this condition is not met (section VIII.4.d) and there the assay cannot be quantitatively used. The capacity of PSII RCs to reduce the electron transport chain may decrease for several other reasons: photoinhibition, UV-damage, partial
K= [QA][PQH2]
[QA-][PQ] Fraction [PQH2]
Fraction [QA-]
108
inhibition by herbicides, etc. Under these three conditions the effects are discreet, which means that the unaffected RCs will function normally. As long as the remaining PSII centers are able to reduce the electron transport chain and all RCs become closed at P (=FM), the only effect will be that the number of PQ-molecules per PSII increases. This may change the scaling of the assay but it is not expected to affect the outcome. Indeed, measurements on partially DCMU-inhibited samples show that the value of (FJ-FJ-
FR)/(FM-FJ-FR) is independent of the extent of inhibition (data not shown). Other factor that can be considered is the excitation rate. By lowering the light
intensity or increasing the chl content of the sample, the amplitude of the OJ phase decreases. Below a few hundred µmol photons m-2 s-1 light intensity the J step completely disappears in pea leaves. However, the light we used was not saturating for the J step (section VIII.4.a) indicating that a saturated J level is not necessary for the application of the method. This was experimentally tested by using three different measuring light intensities (1800, 1200 and 600 µmol photons m-2s-1) for fluorescence measurements. Nearly identical results were obtained (data not shown).
The FR illumination has to be long (or strong) enough oxidize the PQ-pool. In our experiments, 1 s FR pre-illumination of ~200 µmol photons m-2s-1 light intensity was enough to oxidize largely the electron transport chain (Fig. V-8) but this may not be enough in certain plant species, under certain stress conditions or in pre-illuminated samples. Therefore, if the oxidation of the PQ-pool cannot be experimentally tested, we suggest making the FR pre-illumination longer, ~5-10 s.
In summary, of all the parameters evaluated as PQ-pool redox state indicators, the FJ seems to be the most robust one and the (FJ-FJcontr)/(FM-FJcontr) is suggested to be used as a parameter to determine the redox state of the PQ-pool.
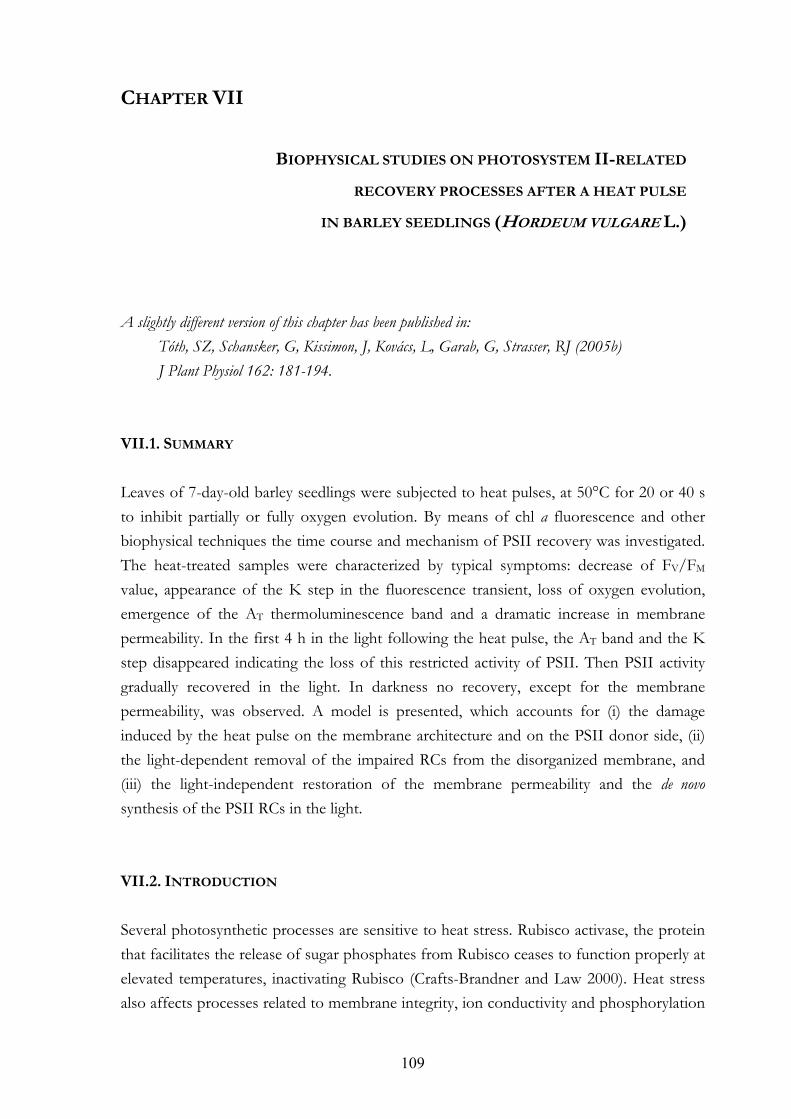
109
CHAPTER VII
A slightly different version of this chapter has been published in: Tóth, SZ, Schansker, G, Kissimon, J, Kovács, L, Garab, G, Strasser, RJ (2005b) J Plant Physiol 162: 181-194.
VII.1. SUMMARY
Leaves of 7-day-old barley seedlings were subjected to heat pulses, at 50°C for 20 or 40 s to inhibit partially or fully oxygen evolution. By means of chl a fluorescence and other biophysical techniques the time course and mechanism of PSII recovery was investigated. The heat-treated samples were characterized by typical symptoms: decrease of FV/FM value, appearance of the K step in the fluorescence transient, loss of oxygen evolution, emergence of the AT thermoluminescence band and a dramatic increase in membrane permeability. In the first 4 h in the light following the heat pulse, the AT band and the K step disappeared indicating the loss of this restricted activity of PSII. Then PSII activity gradually recovered in the light. In darkness no recovery, except for the membrane permeability, was observed. A model is presented, which accounts for (i) the damage induced by the heat pulse on the membrane architecture and on the PSII donor side, (ii) the light-dependent removal of the impaired RCs from the disorganized membrane, and (iii) the light-independent restoration of the membrane permeability and the de novo synthesis of the PSII RCs in the light.
VII.2. INTRODUCTION
Several photosynthetic processes are sensitive to heat stress. Rubisco activase, the protein that facilitates the release of sugar phosphates from Rubisco ceases to function properly at elevated temperatures, inactivating Rubisco (Crafts-Brandner and Law 2000). Heat stress also affects processes related to membrane integrity, ion conductivity and phosphorylation
BIOPHYSICAL STUDIES ON PHOTOSYSTEM II-RELATED
RECOVERY PROCESSES AFTER A HEAT PULSE
IN BARLEY SEEDLINGS (HORDEUM VULGARE L.)
110
activity. It has been shown that elevated temperatures accelerate the decay of the flash induced absorbance change at 518 nm (Weis 1982, Havaux et al. 1996), which is thought to be related to the ion transport across thylakoid membranes (Peters et al. 1984). Gounaris et al. (1984) demonstrated that a heat treatment may induce grana destacking and the formation of cylindrical-inverted lipid micelles.
With respect to the photosynthetic electron transport chain, exposure of plants to elevated temperatures has two contrasting effects. It was observed that PSI (measured as the reduction rate of P700+) is stimulated by heat, which is related to a reduction of the PQ-pool by electrons from the stroma (Havaux 1996, Bukhov et al. 1999). In contrast, PSII, and especially the oxygen-evolving complex (OEC) is very heat-sensitive. Heat induces the dissociation of the Mn-stabilizing 33 kDa protein from the OEC followed by release of the Mn atoms (Enami et al. 1994, Yamane et al. 1998). Heat-inactivation of PSII may be followed by dissociation of the LHCII complexes (Schreiber and Armond 1978, Takeuchi and Thornber 1994, Yamane et al. 1997). A further heat-induced effect that has been described is a shift of the redox equilibrium between QA and QB, increasing the residence time of an electron on QA relative to QB (Ducruet and Lemoine 1985, Havaux 1989).
For plants, the rate of recovery from heat-induced damage might be even more important than the extent of the damage itself. Gour et al. (1997) reported that in cyanobacteria the degree of recovery depends very much on the presence of light during the repair processes. It was also shown (Heckathorn et al. 1997) that heat-related effects on PSII and particularly on the oxygen evolution are important limitations to post-stress recovery. In general, however, little is known about the processes involved in post-stress repair.
In this chapter, PSII-related recovery processes after heat stress were studied, in planta. To this end, full inhibition of oxygen evolution was induced using heat pulses: immersion of leaves of young barley seedlings for 40 s in a water bath of 50 °C. Pilot experiments showed that homogeneous starting material of whole plants with fully inhibited OEC could most readily be obtained with pulses, rather than with prolonged heat treatments at somewhat lower (40-45 °C) temperatures. This treatment, while it induces the typical effects of heat stress, virtually causes no visible symptoms. As a comparison, we also subjected some plants to a shorter, 20 s, heat pulse that caused partial inhibition of oxygen evolving activity. Chl a fluorescence and other biophysical techniques were used to investigate the recovery kinetics of heat-inactivated PSII and also the role of light in these processes.
111
VII.3. MATERIALS AND METHODS
VII.3.a Plant material and growth conditions
Barley (Hordeum vulgare L. cv. Triangel) seeds were soaked in tap water for 4 hours then sown on perlite. The seedlings were grown in a growth chamber (Conviron S10) under long day conditions (16 h light and 8 h darkness), at 22°C and 100 µmol photons m-2 s-1
light intensity. Seedlings were watered with Hoagland solution and heat treatments were carried out when the barley seedlings were 7 days old. VII.3.b Heat pulse and plant growth conditions following the treatment
The heat pulse consisted of turning a pot containing 30-40 seedlings upside down into a water bath of 50°C for 20 s or 40 s. The primary leaves were entirely submerged. After the heat pulse the plants were returned to the growth chamber. Some heat-treated and untreated plants were kept in complete darkness after the heat pulse, under similar temperature conditions as in the growth chamber. VII.3.c Chl a fluorescence measurements
Chl a fluorescence was measured by an earlier model of the Hansatech fluorometers, the PEA instrument. Samples were dark adapted for 10-15 minutes before the measurements. The light intensity was 2400 µmol photons m-2s-1 and the length of the measurement was 5s. For the evaluation of fluorescence transients, the Biolyzer v.3.0.6 software was used. VII.3.d Isolation of thylakoid membranes
Thylakoids were isolated (section III.3.b) from leaves of the heat-treated barley seedlings. The chl content was adjusted to 200 µg ml-1 (using the method of Porra et al. 1989) and the thylakoid suspension was diluted to the desired concentration before each measurement. Thylakoids were kept on ice in darkness and used within 3 hours after isolation. VII.3.e Measurement of oxygen evolving activity
Oxygen evolving activity of thylakoids [25 µg chl (a+b) ml-1] was measured with a Clark-type oxygen electrode (Hansatech Instruments Ltd, Norfolk, UK) in a temperature controlled cell at 25°C under saturating light intensities (1800 µmol photons m-2 s-1) for 2 min. Measurements were carried out using 500 µM phenyl-p-benzoquinone (PPBQ) as an electron acceptor of PSII that binds to the QB-site (Renger et al. 1988).
112
VII.3.f Thermoluminescence (TL) measurements
Thermoluminescence was measured using a custom-made TL apparatus described by Wiessner and Demeter (1988). For TL measurements, thylakoid suspension [0.3 ml, 50 µg Chl (a+b) ml-1] was placed on a copper sample holder. The sample holder was connected to a “cold finger” immersed in liquid nitrogen. A heater coil, placed under the sample holder, ensured the desired temperature of the sample during the measurements. Dark adapted samples were illuminated at -20°C by a single turnover flash and cooled down to -40 °C. Thermoluminescence was measured while heating the sample to 96°C in darkness with a constant heating rate of 20°C min-1. The emitted TL light was measured with a Hamamatsu end-window photomultiplier. VII.3.g Measurement of flash-induced electrochromic absorbance transients
(∆A515)
Electrochromic absorbance changes, induced by single turnover flashes, were measured at 515 nm, the maximum of the electrochromic transients, in a set-up described by Büchel and Garab (1995). The time constant was set to 100 µs; 32 kinetic traces were collected with a repetition rate of 1 s-1 and averaged. The transients were recorded at room temperature on leaves that were excised from the barley seedlings just before the measurements.
VII.3.h Determination of antioxidant enzyme activities and TBARS content
Guaiacol peroxidase activity (GPX, E.C. 1.11.1.7) was measured by using a modified method of Chance and Maehly (1955), the ascorbate peroxidase (APX, E.C. 1.11.1.11) measurement was based on the method of Nakano and Asada (1981) and for the measurement of thiobarbituric-acid reactive substances (TBARS) the method of Popham and Novaczky (1991) was used.
VII.4. RESULTS
Leaves of barley seedlings were given a heat pulse of 50°C for 20 s or 40 s. Measurements were carried out 30 min, 4 h, 24 h and 48 h after the heat treatment. These time points were chosen in preliminary experiments, using chl a fluorescence. The main consideration was to chose characteristic points defining the recovery processes occurring after the heat pulse and to carry out the measurements until considerable (for the 40 s heat pulse) or almost full recovery (20 s heat pulse) occurred. After the heat pulse, plants were kept either in darkness or in the light (100 µmol photons m-2 s-1). The heat pulses did not cause
113
visible symptoms on the barley seedlings, except for a slight loss of turgor in the first 10-15 min after the treatment. There were no significant differences in the chl content of the control and heat-treated plants (data not shown). VII.4.a Chl a fluorescence (OJIP) transients
Figures VII-1A and B show the chl a fluorescence transients measured on barley leaves at different intervals after the 40 s heat pulse (the 20 s heat pulse caused similar but less pronounced effects; these data are not shown). The following effects could be observed on the chl a fluorescence transients:
1. F0 slightly increased upon the heat pulses; the value of this parameter further increased both in the light and in darkness (Figs. VII-1A and B, respectively). The increase of F0 may be attributed to a combination of several processes: (i) dissociation of LHCII from the RC (super)complexes (Schreiber and Armond 1978, Yamane et al. 1997), (ii) heat-induced monomerization of LHCII trimers (Takeuchi and Thornber 1994, Garab et al. 2002), (iii) and dark reduction of QA which is related to a heat-induced shift of the redox equilibrium between QA and QB (Ducruet and Lemoine 1985, Havaux 1989) and a heat-induced facilitation of the back flow of electrons from the PQ-pool (Sazanov et al. 1998, Yamane et al. 2000).
2. The K step (Guissé et al. 1995, Srivastava et al. 1997, Chapter VIII) appeared at 400 µs. It disappeared by the 4th h when plants were kept in the light (Fig. VII-1A), but it persisted in the dark (Fig. VII-1B). The K step is suggested to be due to an imbalance between the donation rate of PSII and the re-oxidation rate of QA- (Strasser 1997). TyrZ can donate one electron to P680+ but a second charge separation after forward electron transfer from QA to QB would lead either to an accumulation of P680+ or a fast charge recombination (Strasser 1997). In either case, as observed, the fluorescence intensity would decrease after the first charge separation.
3. The “FM” (P) value decreased (it is shown in Chapter VIII that in the case of severely heat-stressed samples, not all RCs become closed with a strong light pulse and therefore P should not be called FM). The decrease of P is related to the heat-inactivation of the OEC (Yamashita and Butler 1968a, Schreiber and Neubauer 1987). The inactive donor side of PSII has a very limited capacity for donating electrons. Unless forward electron transfer beyond QA is blocked by e.g. DCMU (Strasser 1997), most induced charge separations will lead to a fast recombination with the electron hole formed on the donor side. Under recombining conditions, RCs will behave as heat sinks (Strasser and Tsimilli-Michael 2001).
The P value was determined by a peak that appeared at ~1 s (Figs. VII-1A and B). When plants were kept in the light, the intensity of this peak significantly decreased by the
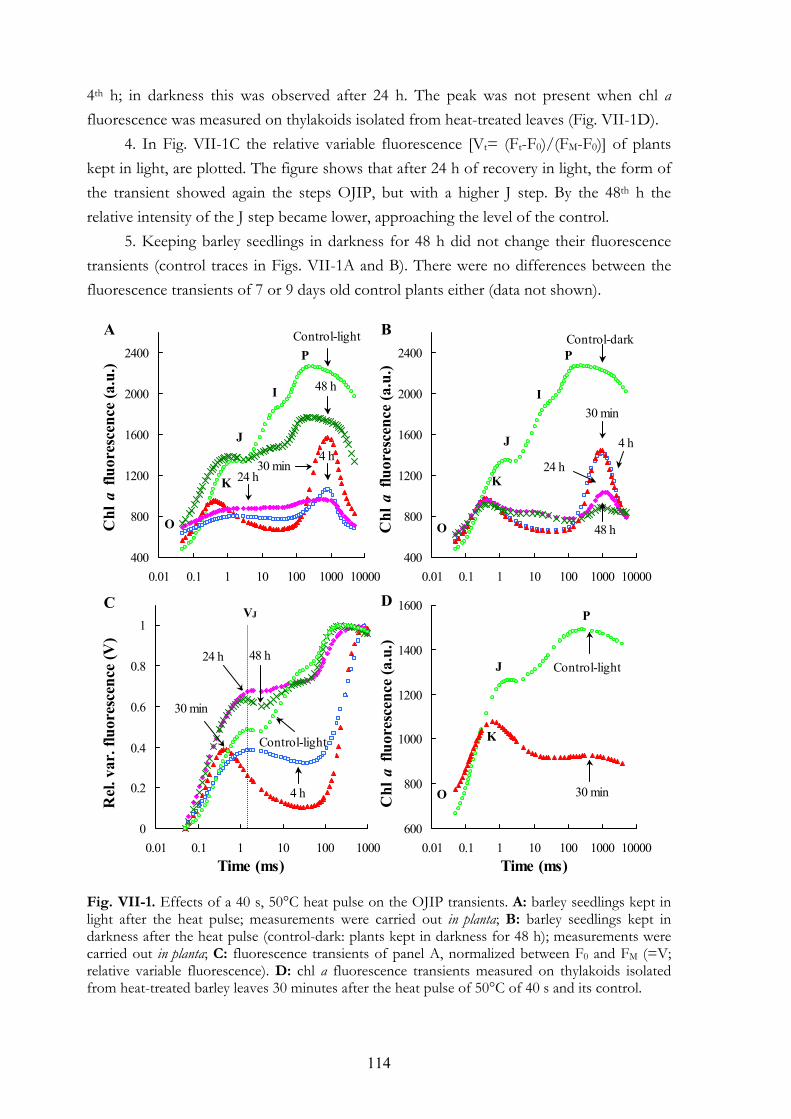
114
4th h; in darkness this was observed after 24 h. The peak was not present when chl a fluorescence was measured on thylakoids isolated from heat-treated leaves (Fig. VII-1D).
4. In Fig. VII-1C the relative variable fluorescence [Vt= (Ft-F0)/(FM-F0)] of plants kept in light, are plotted. The figure shows that after 24 h of recovery in light, the form of the transient showed again the steps OJIP, but with a higher J step. By the 48th h the relative intensity of the J step became lower, approaching the level of the control.
5. Keeping barley seedlings in darkness for 48 h did not change their fluorescence transients (control traces in Figs. VII-1A and B). There were no differences between the fluorescence transients of 7 or 9 days old control plants either (data not shown).
Fig. VII-1. Effects of a 40 s, 50°C heat pulse on the OJIP transients. A: barley seedlings kept in light after the heat pulse; measurements were carried out in planta; B: barley seedlings kept in darkness after the heat pulse (control-dark: plants kept in darkness for 48 h); measurements were carried out in planta; C: fluorescence transients of panel A, normalized between F0 and FM (=V; relative variable fluorescence). D: chl a fluorescence transients measured on thylakoids isolated from heat-treated barley leaves 30 minutes after the heat pulse of 50°C of 40 s and its control.
400
800
1200
1600
2000
2400
0.01 0.1 1 10 100 1000 10000
Control-light
30 min4 h
24 h
48 h
O
J
I
P
K
400
800
1200
1600
2000
2400
0.01 0.1 1 10 100 1000 10000
Control-dark
30 min
4 h
24 h
48 hO
J
I
P
K
0
0.2
0.4
0.6
0.8
1
0.01 0.1 1 10 100 1000
Control-light
30 min
4 h
24 h 48 h
VJ
600
800
1000
1200
1400
1600
0.01 0.1 1 10 100 1000 10000
Control-light
30 minO
K
J
PC D
Time (ms) Time (ms)
Chl
a fl
uore
scen
ce (a
.u.)
Chl
a fl
uore
scen
ce (a
.u.)
B
Chl
a fl
uore
scen
ce (a
.u.)
Rel
. var
. flu
ores
cenc
e (V
)
A
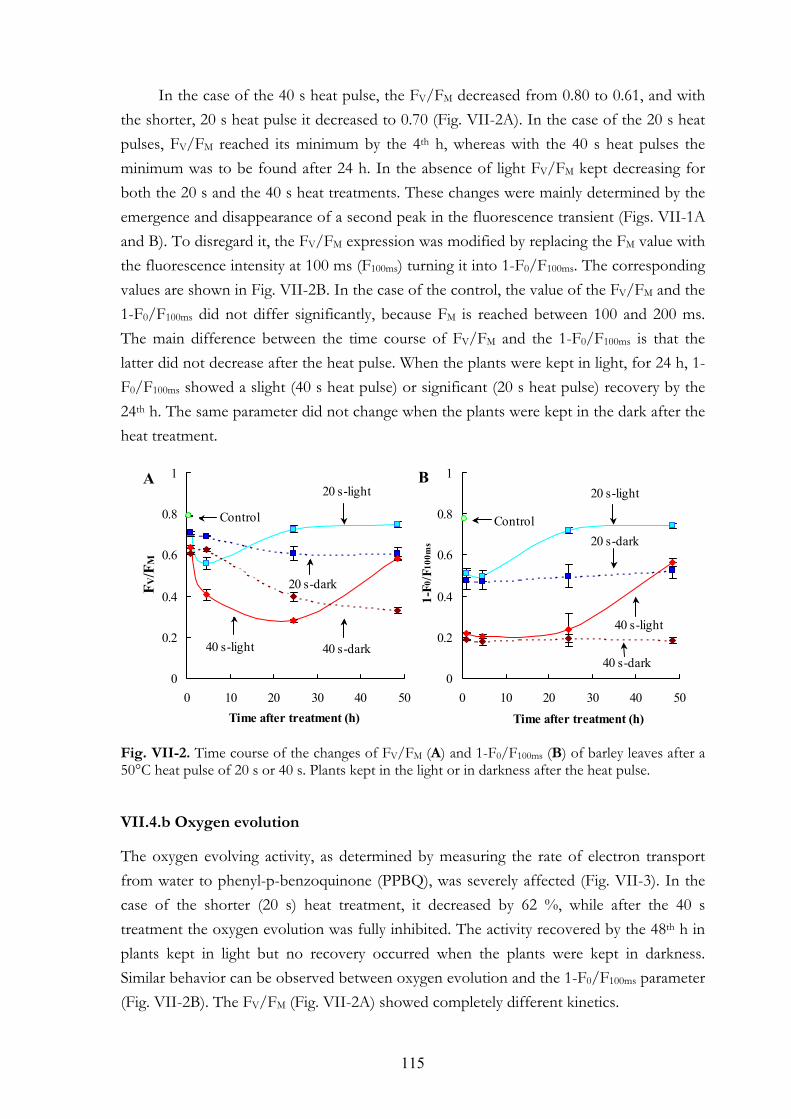
115
In the case of the 40 s heat pulse, the FV/FM decreased from 0.80 to 0.61, and with the shorter, 20 s heat pulse it decreased to 0.70 (Fig. VII-2A). In the case of the 20 s heat pulses, FV/FM reached its minimum by the 4th h, whereas with the 40 s heat pulses the minimum was to be found after 24 h. In the absence of light FV/FM kept decreasing for both the 20 s and the 40 s heat treatments. These changes were mainly determined by the emergence and disappearance of a second peak in the fluorescence transient (Figs. VII-1A and B). To disregard it, the FV/FM expression was modified by replacing the FM value with the fluorescence intensity at 100 ms (F100ms) turning it into 1-F0/F100ms. The corresponding values are shown in Fig. VII-2B. In the case of the control, the value of the FV/FM and the 1-F0/F100ms did not differ significantly, because FM is reached between 100 and 200 ms. The main difference between the time course of FV/FM and the 1-F0/F100ms is that the latter did not decrease after the heat pulse. When the plants were kept in light, for 24 h, 1-F0/F100ms showed a slight (40 s heat pulse) or significant (20 s heat pulse) recovery by the 24th h. The same parameter did not change when the plants were kept in the dark after the heat treatment.
Fig. VII-2. Time course of the changes of FV/FM (A) and 1-F0/F100ms (B) of barley leaves after a 50°C heat pulse of 20 s or 40 s. Plants kept in the light or in darkness after the heat pulse.
VII.4.b Oxygen evolution
The oxygen evolving activity, as determined by measuring the rate of electron transport from water to phenyl-p-benzoquinone (PPBQ), was severely affected (Fig. VII-3). In the case of the shorter (20 s) heat treatment, it decreased by 62 %, while after the 40 s treatment the oxygen evolution was fully inhibited. The activity recovered by the 48th h in plants kept in light but no recovery occurred when the plants were kept in darkness. Similar behavior can be observed between oxygen evolution and the 1-F0/F100ms parameter (Fig. VII-2B). The FV/FM (Fig. VII-2A) showed completely different kinetics.
0
0.2
0.4
0.6
0.8
1
0 10 20 30 40 50
Control
20 s-light
40 s-light
20 s-dark
40 s-dark
F V/F
M
A
0
0.2
0.4
0.6
0.8
1
0 10 20 30 40 50
Control
20 s-light
40 s-light
20 s-dark
40 s-dark
B
Time after treatment (h) Time after treatment (h)
1-F0
/F10
0ms
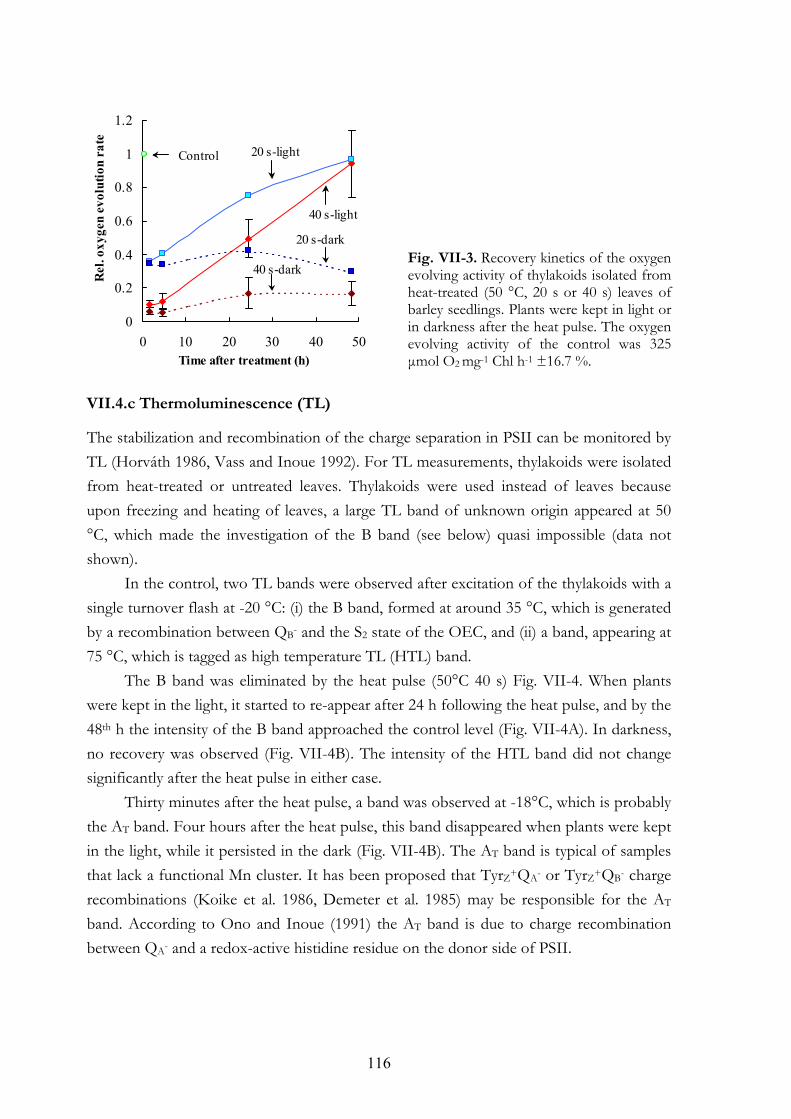
116
Fig. VII-3. Recovery kinetics of the oxygen evolving activity of thylakoids isolated from heat-treated (50 °C, 20 s or 40 s) leaves of barley seedlings. Plants were kept in light or in darkness after the heat pulse. The oxygen evolving activity of the control was 325 µmol O2 mg-1 Chl h-1 ±16.7 %.
VII.4.c Thermoluminescence (TL)
The stabilization and recombination of the charge separation in PSII can be monitored by TL (Horváth 1986, Vass and Inoue 1992). For TL measurements, thylakoids were isolated from heat-treated or untreated leaves. Thylakoids were used instead of leaves because upon freezing and heating of leaves, a large TL band of unknown origin appeared at 50 °C, which made the investigation of the B band (see below) quasi impossible (data not shown).
In the control, two TL bands were observed after excitation of the thylakoids with a single turnover flash at -20 °C: (i) the B band, formed at around 35 °C, which is generated by a recombination between QB- and the S2 state of the OEC, and (ii) a band, appearing at 75 °C, which is tagged as high temperature TL (HTL) band.
The B band was eliminated by the heat pulse (50°C 40 s) Fig. VII-4. When plants were kept in the light, it started to re-appear after 24 h following the heat pulse, and by the 48th h the intensity of the B band approached the control level (Fig. VII-4A). In darkness, no recovery was observed (Fig. VII-4B). The intensity of the HTL band did not change significantly after the heat pulse in either case.
Thirty minutes after the heat pulse, a band was observed at -18°C, which is probably the AT band. Four hours after the heat pulse, this band disappeared when plants were kept in the light, while it persisted in the dark (Fig. VII-4B). The AT band is typical of samples that lack a functional Mn cluster. It has been proposed that TyrZ+QA- or TyrZ+QB- charge recombinations (Koike et al. 1986, Demeter et al. 1985) may be responsible for the AT band. According to Ono and Inoue (1991) the AT band is due to charge recombination between QA- and a redox-active histidine residue on the donor side of PSII.
0
0.2
0.4
0.6
0.8
1
1.2
0 10 20 30 40 50
20 s-light
40 s-light
20 s-dark
40 s-dark
Control
Time after treatment (h)
Rel
. oxy
gen
evol
utio
n ra
te
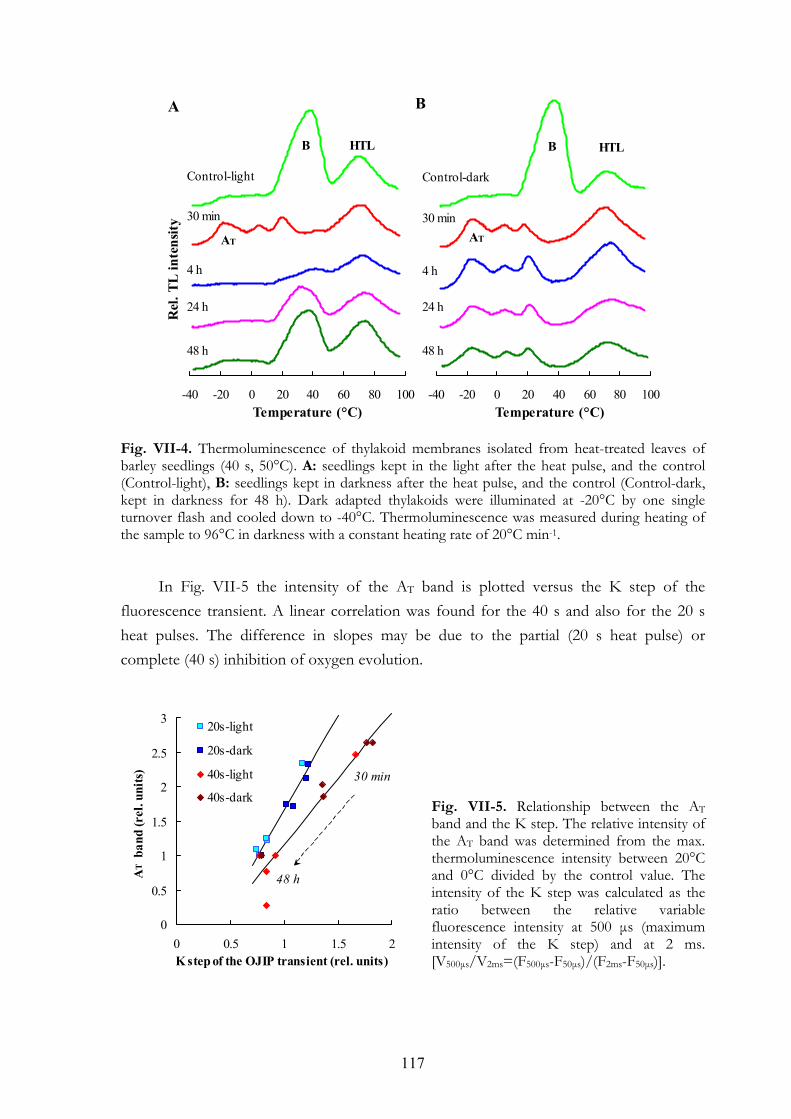
117
Fig. VII-4. Thermoluminescence of thylakoid membranes isolated from heat-treated leaves of barley seedlings (40 s, 50°C). A: seedlings kept in the light after the heat pulse, and the control (Control-light), B: seedlings kept in darkness after the heat pulse, and the control (Control-dark, kept in darkness for 48 h). Dark adapted thylakoids were illuminated at -20°C by one single turnover flash and cooled down to -40°C. Thermoluminescence was measured during heating of the sample to 96°C in darkness with a constant heating rate of 20°C min-1.
In Fig. VII-5 the intensity of the AT band is plotted versus the K step of the
fluorescence transient. A linear correlation was found for the 40 s and also for the 20 s heat pulses. The difference in slopes may be due to the partial (20 s heat pulse) or complete (40 s) inhibition of oxygen evolution.
Fig. VII-5. Relationship between the AT band and the K step. The relative intensity of the AT band was determined from the max. thermoluminescence intensity between 20°C and 0°C divided by the control value. The intensity of the K step was calculated as the ratio between the relative variable fluorescence intensity at 500 µs (maximum intensity of the K step) and at 2 ms. [V500µs/V2ms=(F500µs-F50µs)/(F2ms-F50µs)].
-40 -20 0 20 40 60 80 100
Control-dark
30 min
4 h
24 h
48 h
B HTL
AT
B
Temperature (°C)-40 -20 0 20 40 60 80 100
Control-light
30 min
4 h
24 h
48 h
B HTL
AT
A
Temperature (°C)
Rel
. TL
inte
nsity
0
0.5
1
1.5
2
2.5
3
0 0.5 1 1.5 2
20s-light
20s-dark
40s-light
40s-dark
K step of the OJIP transient (rel. units)
AT b
and
(rel
. uni
ts) 30 min
48 h
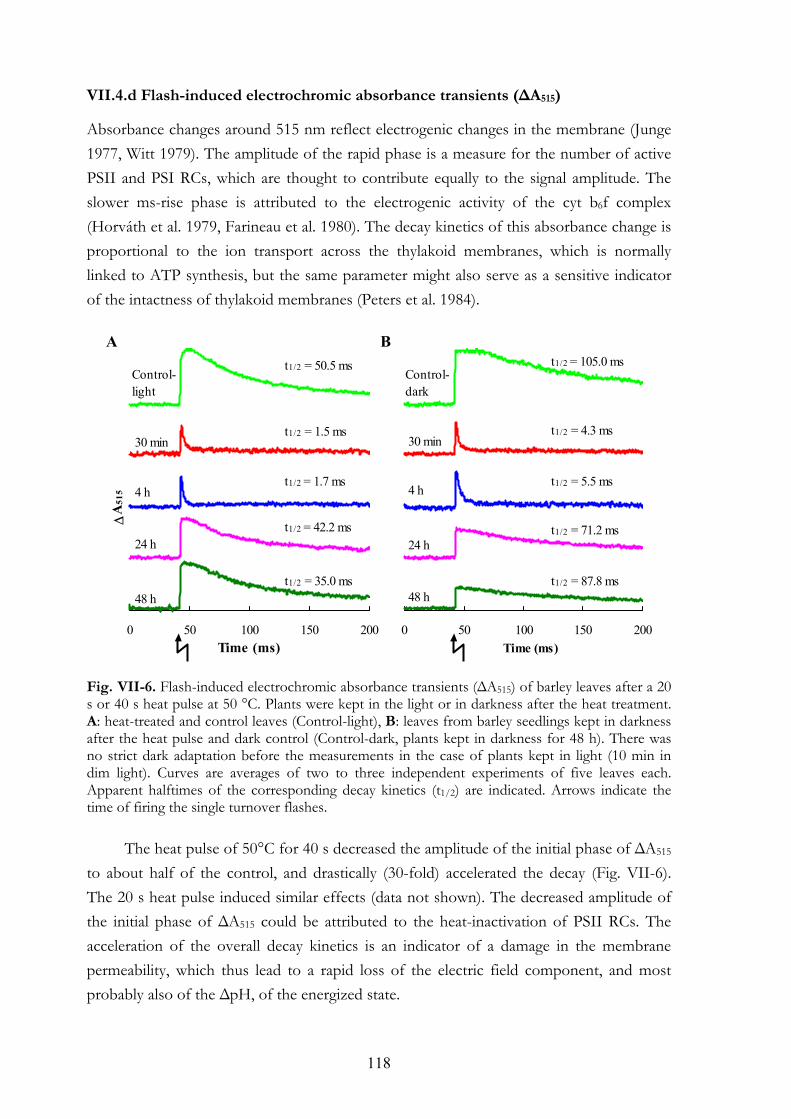
118
VII.4.d Flash-induced electrochromic absorbance transients (∆A515)
Absorbance changes around 515 nm reflect electrogenic changes in the membrane (Junge 1977, Witt 1979). The amplitude of the rapid phase is a measure for the number of active PSII and PSI RCs, which are thought to contribute equally to the signal amplitude. The slower ms-rise phase is attributed to the electrogenic activity of the cyt b6f complex (Horváth et al. 1979, Farineau et al. 1980). The decay kinetics of this absorbance change is proportional to the ion transport across the thylakoid membranes, which is normally linked to ATP synthesis, but the same parameter might also serve as a sensitive indicator of the intactness of thylakoid membranes (Peters et al. 1984).
Fig. VII-6. Flash-induced electrochromic absorbance transients (∆A515) of barley leaves after a 20 s or 40 s heat pulse at 50 °C. Plants were kept in the light or in darkness after the heat treatment. A: heat-treated and control leaves (Control-light), B: leaves from barley seedlings kept in darkness after the heat pulse and dark control (Control-dark, plants kept in darkness for 48 h). There was no strict dark adaptation before the measurements in the case of plants kept in light (10 min in dim light). Curves are averages of two to three independent experiments of five leaves each. Apparent halftimes of the corresponding decay kinetics (t1/2) are indicated. Arrows indicate the time of firing the single turnover flashes.
The heat pulse of 50°C for 40 s decreased the amplitude of the initial phase of ∆A515 to about half of the control, and drastically (30-fold) accelerated the decay (Fig. VII-6). The 20 s heat pulse induced similar effects (data not shown). The decreased amplitude of the initial phase of ∆A515 could be attributed to the heat-inactivation of PSII RCs. The acceleration of the overall decay kinetics is an indicator of a damage in the membrane permeability, which thus lead to a rapid loss of the electric field component, and most probably also of the ∆pH, of the energized state.
A
0 50 100 150 200
Control-light
30 min
4 h
24 h
48 h
t1/2 = 50.5 ms
t1/2 = 1.5 ms
t1/2 = 1.7 ms
t1/2 = 42.2 ms
t1/2 = 35.0 ms
Time (ms)
∆A
515
B
0 50 100 150 200
Control- dark
30 min
4 h
24 h
48 h
t1/2 = 105.0 ms
t1/2 = 4.3 ms
t1/2 = 5.5 ms
t1/2 = 71.2 ms
t1/2 = 87.8 ms
Time (ms)
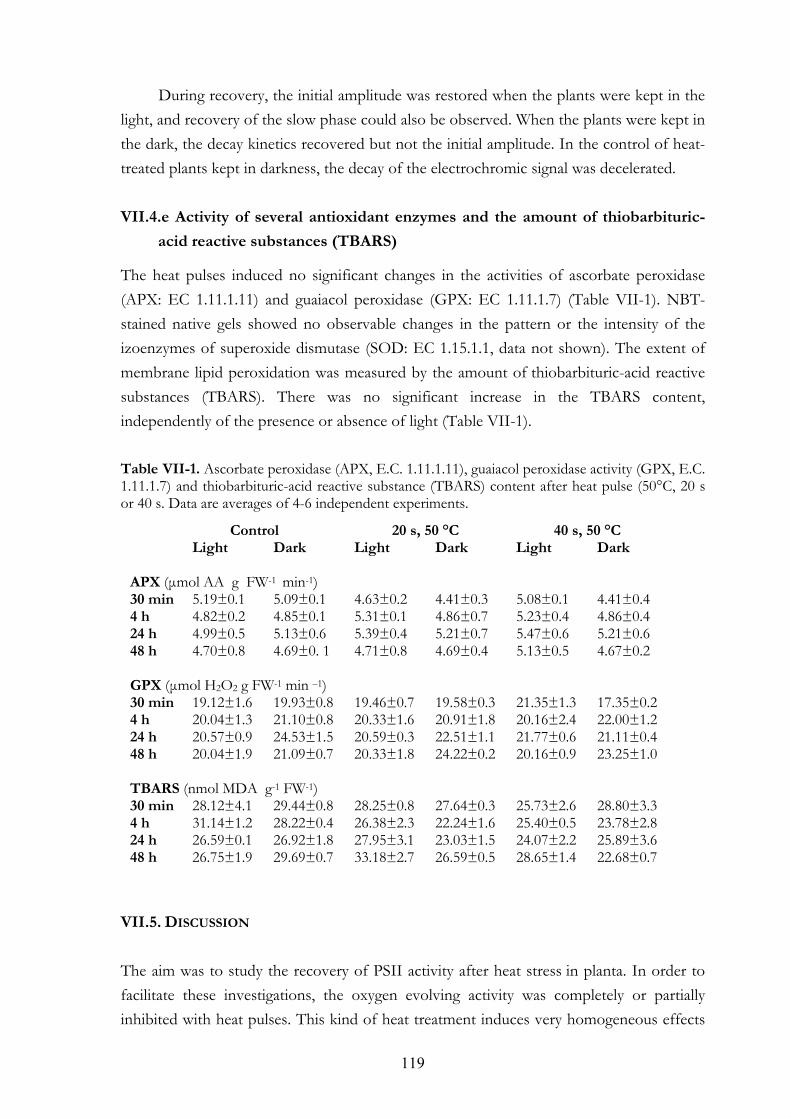
119
During recovery, the initial amplitude was restored when the plants were kept in the light, and recovery of the slow phase could also be observed. When the plants were kept in the dark, the decay kinetics recovered but not the initial amplitude. In the control of heat-treated plants kept in darkness, the decay of the electrochromic signal was decelerated.
VII.4.e Activity of several antioxidant enzymes and the amount of thiobarbituric-
acid reactive substances (TBARS)
The heat pulses induced no significant changes in the activities of ascorbate peroxidase (APX: EC 1.11.1.11) and guaiacol peroxidase (GPX: EC 1.11.1.7) (Table VII-1). NBT-stained native gels showed no observable changes in the pattern or the intensity of the izoenzymes of superoxide dismutase (SOD: EC 1.15.1.1, data not shown). The extent of membrane lipid peroxidation was measured by the amount of thiobarbituric-acid reactive substances (TBARS). There was no significant increase in the TBARS content, independently of the presence or absence of light (Table VII-1).
Table VII-1. Ascorbate peroxidase (APX, E.C. 1.11.1.11), guaiacol peroxidase activity (GPX, E.C. 1.11.1.7) and thiobarbituric-acid reactive substance (TBARS) content after heat pulse (50°C, 20 s or 40 s. Data are averages of 4-6 independent experiments.
Control 20 s, 50 °C 40 s, 50 °C
Light Dark Light Dark Light Dark APX (µmol AA g FW-1 min-1) 30 min 5.19±0.1 5.09±0.1 4.63±0.2 4.41±0.3 5.08±0.1 4.41±0.4 4 h 4.82±0.2 4.85±0.1 5.31±0.1 4.86±0.7 5.23±0.4 4.86±0.4 24 h 4.99±0.5 5.13±0.6 5.39±0.4 5.21±0.7 5.47±0.6 5.21±0.6 48 h 4.70±0.8 4.69±0. 1 4.71±0.8 4.69±0.4 5.13±0.5 4.67±0.2 GPX (µmol H2O2 g FW-1 min –1) 30 min 19.12±1.6 19.93±0.8 19.46±0.7 19.58±0.3 21.35±1.3 17.35±0.2 4 h 20.04±1.3 21.10±0.8 20.33±1.6 20.91±1.8 20.16±2.4 22.00±1.2 24 h 20.57±0.9 24.53±1.5 20.59±0.3 22.51±1.1 21.77±0.6 21.11±0.4 48 h 20.04±1.9 21.09±0.7 20.33±1.8 24.22±0.2 20.16±0.9 23.25±1.0 TBARS (nmol MDA g-1 FW-1) 30 min 28.12±4.1 29.44±0.8 28.25±0.8 27.64±0.3 25.73±2.6 28.80±3.3 4 h 31.14±1.2 28.22±0.4 26.38±2.3 22.24±1.6 25.40±0.5 23.78±2.8 24 h 26.59±0.1 26.92±1.8 27.95±3.1 23.03±1.5 24.07±2.2 25.89±3.6 48 h 26.75±1.9 29.69±0.7 33.18±2.7 26.59±0.5 28.65±1.4 22.68±0.7
VII.5. DISCUSSION
The aim was to study the recovery of PSII activity after heat stress in planta. In order to facilitate these investigations, the oxygen evolving activity was completely or partially inhibited with heat pulses. This kind of heat treatment induces very homogeneous effects
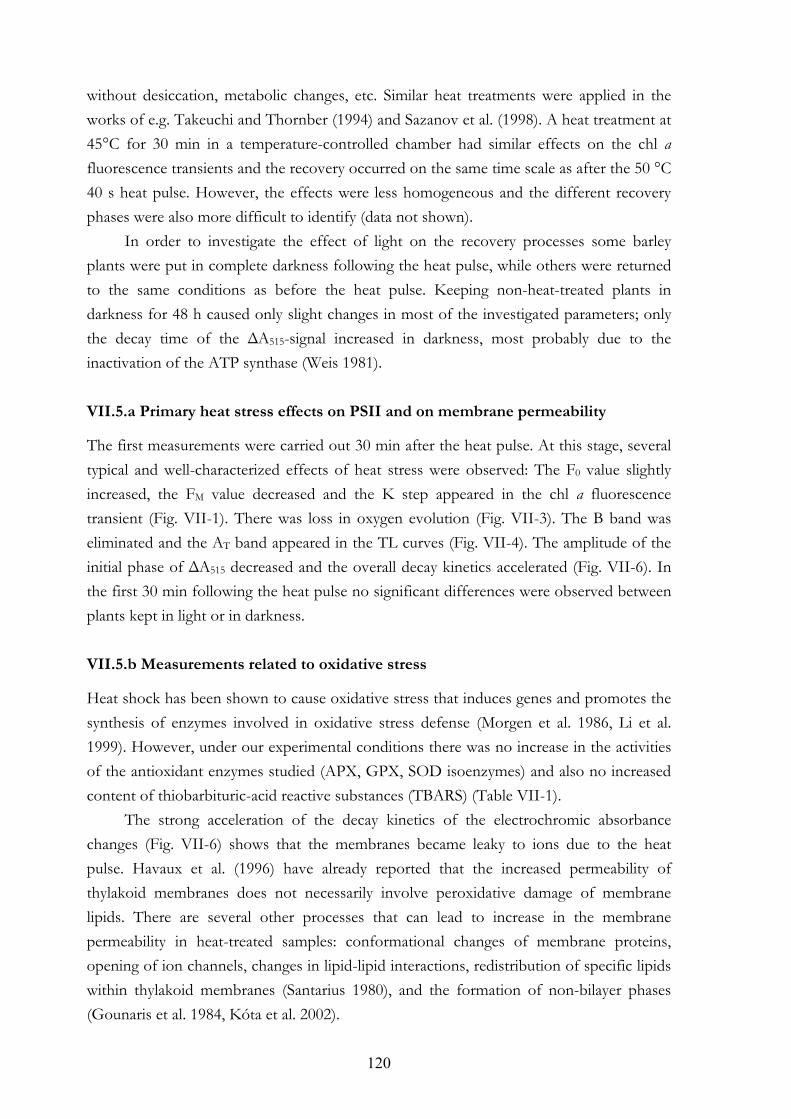
120
without desiccation, metabolic changes, etc. Similar heat treatments were applied in the works of e.g. Takeuchi and Thornber (1994) and Sazanov et al. (1998). A heat treatment at 45°C for 30 min in a temperature-controlled chamber had similar effects on the chl a fluorescence transients and the recovery occurred on the same time scale as after the 50 °C 40 s heat pulse. However, the effects were less homogeneous and the different recovery phases were also more difficult to identify (data not shown).
In order to investigate the effect of light on the recovery processes some barley plants were put in complete darkness following the heat pulse, while others were returned to the same conditions as before the heat pulse. Keeping non-heat-treated plants in darkness for 48 h caused only slight changes in most of the investigated parameters; only the decay time of the ∆A515-signal increased in darkness, most probably due to the inactivation of the ATP synthase (Weis 1981). VII.5.a Primary heat stress effects on PSII and on membrane permeability
The first measurements were carried out 30 min after the heat pulse. At this stage, several typical and well-characterized effects of heat stress were observed: The F0 value slightly increased, the FM value decreased and the K step appeared in the chl a fluorescence transient (Fig. VII-1). There was loss in oxygen evolution (Fig. VII-3). The B band was eliminated and the AT band appeared in the TL curves (Fig. VII-4). The amplitude of the initial phase of ∆A515 decreased and the overall decay kinetics accelerated (Fig. VII-6). In the first 30 min following the heat pulse no significant differences were observed between plants kept in light or in darkness. VII.5.b Measurements related to oxidative stress
Heat shock has been shown to cause oxidative stress that induces genes and promotes the synthesis of enzymes involved in oxidative stress defense (Morgen et al. 1986, Li et al. 1999). However, under our experimental conditions there was no increase in the activities of the antioxidant enzymes studied (APX, GPX, SOD isoenzymes) and also no increased content of thiobarbituric-acid reactive substances (TBARS) (Table VII-1).
The strong acceleration of the decay kinetics of the electrochromic absorbance changes (Fig. VII-6) shows that the membranes became leaky to ions due to the heat pulse. Havaux et al. (1996) have already reported that the increased permeability of thylakoid membranes does not necessarily involve peroxidative damage of membrane lipids. There are several other processes that can lead to increase in the membrane permeability in heat-treated samples: conformational changes of membrane proteins, opening of ion channels, changes in lipid-lipid interactions, redistribution of specific lipids within thylakoid membranes (Santarius 1980), and the formation of non-bilayer phases (Gounaris et al. 1984, Kóta et al. 2002).
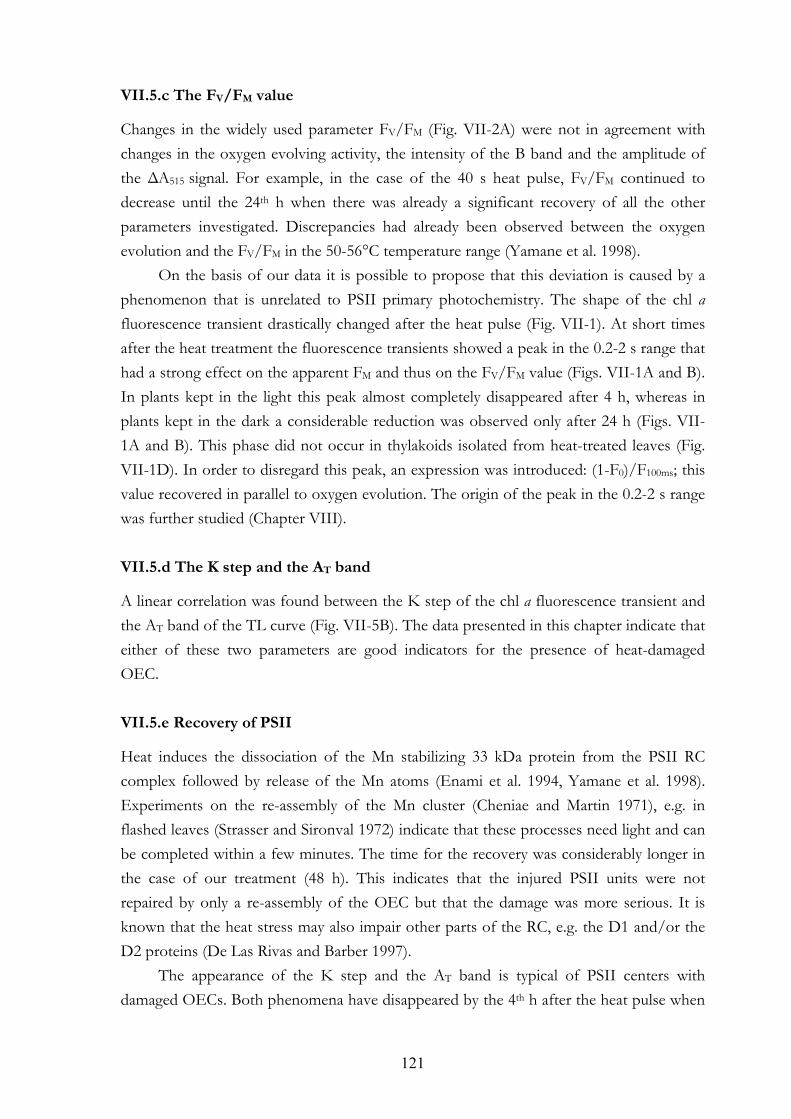
121
VII.5.c The FV/FM value
Changes in the widely used parameter FV/FM (Fig. VII-2A) were not in agreement with changes in the oxygen evolving activity, the intensity of the B band and the amplitude of the ∆A515 signal. For example, in the case of the 40 s heat pulse, FV/FM continued to decrease until the 24th h when there was already a significant recovery of all the other parameters investigated. Discrepancies had already been observed between the oxygen evolution and the FV/FM in the 50-56°C temperature range (Yamane et al. 1998).
On the basis of our data it is possible to propose that this deviation is caused by a phenomenon that is unrelated to PSII primary photochemistry. The shape of the chl a fluorescence transient drastically changed after the heat pulse (Fig. VII-1). At short times after the heat treatment the fluorescence transients showed a peak in the 0.2-2 s range that had a strong effect on the apparent FM and thus on the FV/FM value (Figs. VII-1A and B). In plants kept in the light this peak almost completely disappeared after 4 h, whereas in plants kept in the dark a considerable reduction was observed only after 24 h (Figs. VII-1A and B). This phase did not occur in thylakoids isolated from heat-treated leaves (Fig. VII-1D). In order to disregard this peak, an expression was introduced: (1-F0)/F100ms; this value recovered in parallel to oxygen evolution. The origin of the peak in the 0.2-2 s range was further studied (Chapter VIII). VII.5.d The K step and the AT band
A linear correlation was found between the K step of the chl a fluorescence transient and the AT band of the TL curve (Fig. VII-5B). The data presented in this chapter indicate that either of these two parameters are good indicators for the presence of heat-damaged OEC. VII.5.e Recovery of PSII
Heat induces the dissociation of the Mn stabilizing 33 kDa protein from the PSII RC complex followed by release of the Mn atoms (Enami et al. 1994, Yamane et al. 1998). Experiments on the re-assembly of the Mn cluster (Cheniae and Martin 1971), e.g. in flashed leaves (Strasser and Sironval 1972) indicate that these processes need light and can be completed within a few minutes. The time for the recovery was considerably longer in the case of our treatment (48 h). This indicates that the injured PSII units were not repaired by only a re-assembly of the OEC but that the damage was more serious. It is known that the heat stress may also impair other parts of the RC, e.g. the D1 and/or the D2 proteins (De Las Rivas and Barber 1997).
The appearance of the K step and the AT band is typical of PSII centers with damaged OECs. Both phenomena have disappeared by the 4th h after the heat pulse when
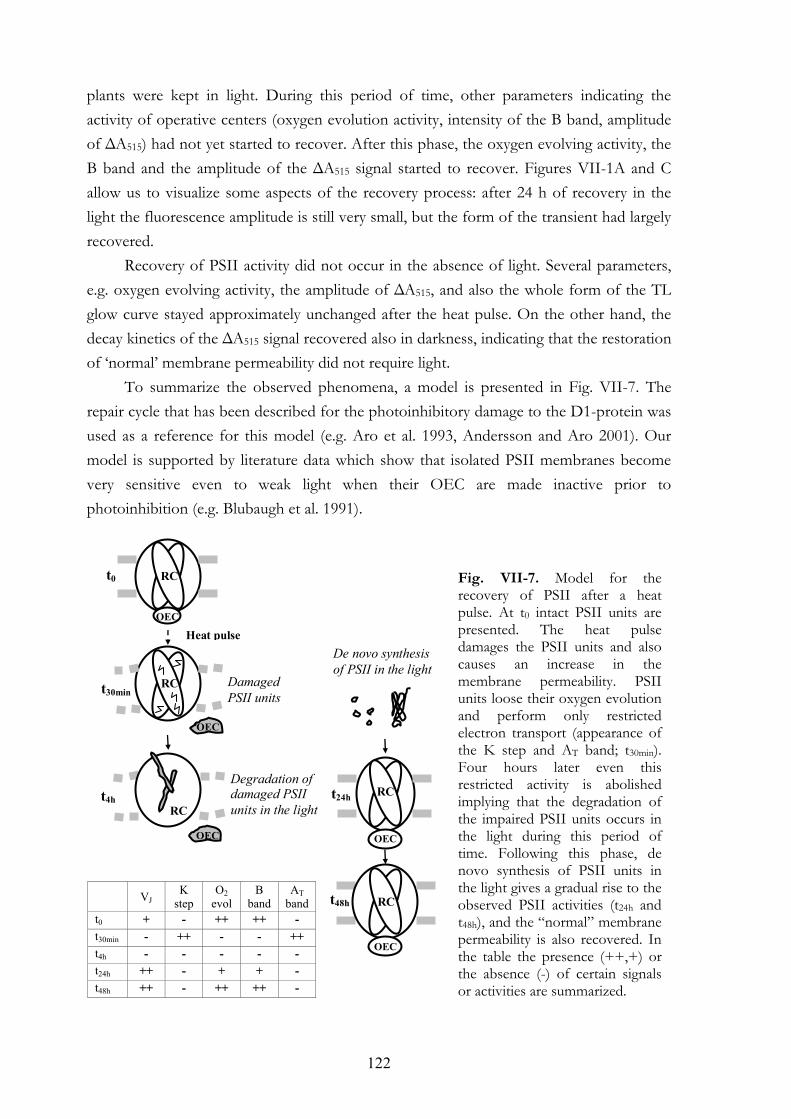
122
plants were kept in light. During this period of time, other parameters indicating the activity of operative centers (oxygen evolution activity, intensity of the B band, amplitude of ∆A515) had not yet started to recover. After this phase, the oxygen evolving activity, the B band and the amplitude of the ∆A515 signal started to recover. Figures VII-1A and C allow us to visualize some aspects of the recovery process: after 24 h of recovery in the light the fluorescence amplitude is still very small, but the form of the transient had largely recovered.
Recovery of PSII activity did not occur in the absence of light. Several parameters, e.g. oxygen evolving activity, the amplitude of ∆A515, and also the whole form of the TL glow curve stayed approximately unchanged after the heat pulse. On the other hand, the decay kinetics of the ∆A515 signal recovered also in darkness, indicating that the restoration of ‘normal’ membrane permeability did not require light.
To summarize the observed phenomena, a model is presented in Fig. VII-7. The repair cycle that has been described for the photoinhibitory damage to the D1-protein was used as a reference for this model (e.g. Aro et al. 1993, Andersson and Aro 2001). Our model is supported by literature data which show that isolated PSII membranes become very sensitive even to weak light when their OEC are made inactive prior to photoinhibition (e.g. Blubaugh et al. 1991).
VJ K
step O2
evol B
band AT
band t0 + - ++ ++ - t30min - ++ - - ++ t4h - - - - - t24h ++ - + + - t48h ++ - ++ ++ -
De novo synthesisof PSII in the light
OEC
t24h
OEC
t48h
RC
RC
t30min
Degradation of damaged PSII units in the light
OEC
RC
RC
OEC
Heat pulse
t0
t4h RC
OEC
Damaged PSII units
Fig. VII-7. Model for the recovery of PSII after a heat pulse. At t0 intact PSII units are presented. The heat pulse damages the PSII units and also causes an increase in the membrane permeability. PSII units loose their oxygen evolution and perform only restricted electron transport (appearance of the K step and AT band; t30min). Four hours later even this restricted activity is abolished implying that the degradation of the impaired PSII units occurs in the light during this period of time. Following this phase, de novo synthesis of PSII units in the light gives a gradual rise to the observed PSII activities (t24h and t48h), and the “normal” membrane permeability is also recovered. In the table the presence (++,+) or the absence (-) of certain signals or activities are summarized.
123
The heat treatment caused a dramatic increase in the membrane permeability, abruptly damaged PSII units, and caused a loss of oxygen evolving activity. Nevertheless, PSII units were still able to perform restricted electron transport (presence of the K step and AT band). During the first four hours, the K step and the AT band have disappeared without recovery of PSII activity, suggesting that in the light degradation of the damaged PSII units occurs. This is a strongly light-dependent process; when plants were kept in darkness it did not occur during the experiment (48 h). Following this, ‘de novo synthesis’ of PSII units caused a gradual rise of the observed PSII activities. The idea of creating new RCs is supported by the long recovery time and also by the phenomenon that after 24 h of recovery the relative intensity of the J step (VJ) is high and later on it approaches to the level of the control; this is a typical behavior of young, newly synthesized RCs (Srivastava et al. 1999). The restoration of the normal membrane permeability may be a prerequisite for the creation of new RCs: Mühlbauer and Eichaker (1998) and Zhang et al. (2000) showed that a proton gradient is needed for the translation and the elongation of the D1 protein. Indeed, in our experiments a complete restoration in the membrane permeability occurred before recovery of PSII activity (4-24 h and 24-48 h, respectively).
In this study, by detecting some of the cofactors in PSII recovery by means of chl a fluorescence and other biophysical techniques we got a glimpse of the protein environment, too. Recent biochemical studies confirmed this model. Ohira et al. (2005) showed that the D1 protein is a common target of heat stress and that D1 protein degradation is strongly enhanced in the presence of low and strong light.

124
125
CHAPTER VIII
A part of this chapter has been published in: Tóth SZ, Schansker G, Garab G, Strasser, RJ (2005c) Proceedings of the 8th Hungarian Congress on Plant Physiology and the 6th Hungarian Conference on Photosynthesis. Acta Biol Szeged 49: 181-183.
VIII.1. SUMMARY
Electron transport processes were investigated in barley leaves of which the oxygen-evolution was fully inhibited by a heat pulse (48°C, 40 s). Under these circumstances, the K step (F~300 µs) appears in the chl a fluorescence transient, which reflects partial QA reduction resulting from one charge separation. However, after the K step, additional QA- accumulation occurs in the 0.2-2 s time range. It is shown by simultaneous chl a fluorescence and 820 nm transmission measurements and applying short light pulses (5-ms light pulses spaced 2.3-500 ms apart) that alternative electron sources donate electrons to photosystem II with a t1/2 ~30 ms and they significantly contribute to reduction of QA and the electron transport chain. Another requirement for the emergence of the fluorescence rise in the 0.2-2 s range is inactive FNR at the acceptor side of PSI.
VIII.2. INTRODUCTION
Exposure of plants to high temperatures has several effects on photosynthesis (section VII.2). The chl a fluorescence transient drastically changes after a heat treatment, especially if oxygen evolution is completely inhibited. The J and I steps disappear and the K step develops at ~300 µs (Srivastava et al. 1997, section VII.4.a). Furthermore, a peak can be observed in the 0.2-2 s time range representing a second phase of QA- accumulation (Figs. VII-1, VIII-1). This is somewhat unexpected since it is generally assumed that if the OEC is completely destroyed TyrZ can provide only one electron and then no more stable
ALTERNATIVE ELECTRON DONORS OF PHOTOSYSTEM II
FUNCTION EFFICIENTLY
IN HEAT-TREATED LEAVES
126
charge separation can occur (Velthuys and Amesz 1974). The one stable charge separation is thought to result in the appearance of the K step (Strasser 1997).
In this chapter the origin of the fluorescence increase in the 0.2-2 s time range was investigated. Complete inhibition of oxygen evolution was achieved by a short heat pulse (48°C, 40 s). Chl a fluorescence emission induced by short repetitive pulses, very strong light pulses (up to 15000 µmol photons m-2s-1), and simultaneous 820 nm transmission and chl a fluorescence measurements were used.
It was found that alternative electron sources donate electrons to PSII RCs with a t1/2 of donation ~30 ms. Alternative electron donors significantly contribute to reduction of the electron transport chain. Another requirement for the fluorescence increase in the 0.2-2 s range is inactive FNR at the acceptor side of PSI. VIII.3. MATERIALS AND METHODS
VIII.3.a Plant material and growth conditions
Measurements were carried out on 7-day-old barley seedlings (Hordeum vulgare cv. Triangel). Plants were grown in a greenhouse where the temperature was 20-25°C during the day and ~14°C at night. VIII.3.b Heat pulse
The heat pulse consisted of turning a pot containing ~20 barley seedlings upside down into a water bath of 48°C for 40 s (if not stated otherwise). The heat pulse of 48°C was sufficient to achieve the same effects as with a heat pulse of 50°C in Chapter VII. This was probably due to differences in the growth conditions. In the case of the combined DCMU or anaerobiosis treatments, ~2 cm long leaf segments were used instead of whole plants. VIII.3.c DCMU+heat treatment
Leaf segments were submerged in DCMU (3-(3’,4’-dichlorophenyl)-1,1-dimethylurea) solution (200 µM, containing 1% ethanol) or 1% ethanol for 5 hours. Half of the leaf segments were given a heat pulse (48°C for 40 s). VIII.3.d Heat+anaerobiosis treatment
Leaf segments were given a heat pulse (48°C for 40 s). To achieve anaerobiosis, N2-gas was blown into the bag for ~30 minutes together with some outflow. See section VI.3.b for details.
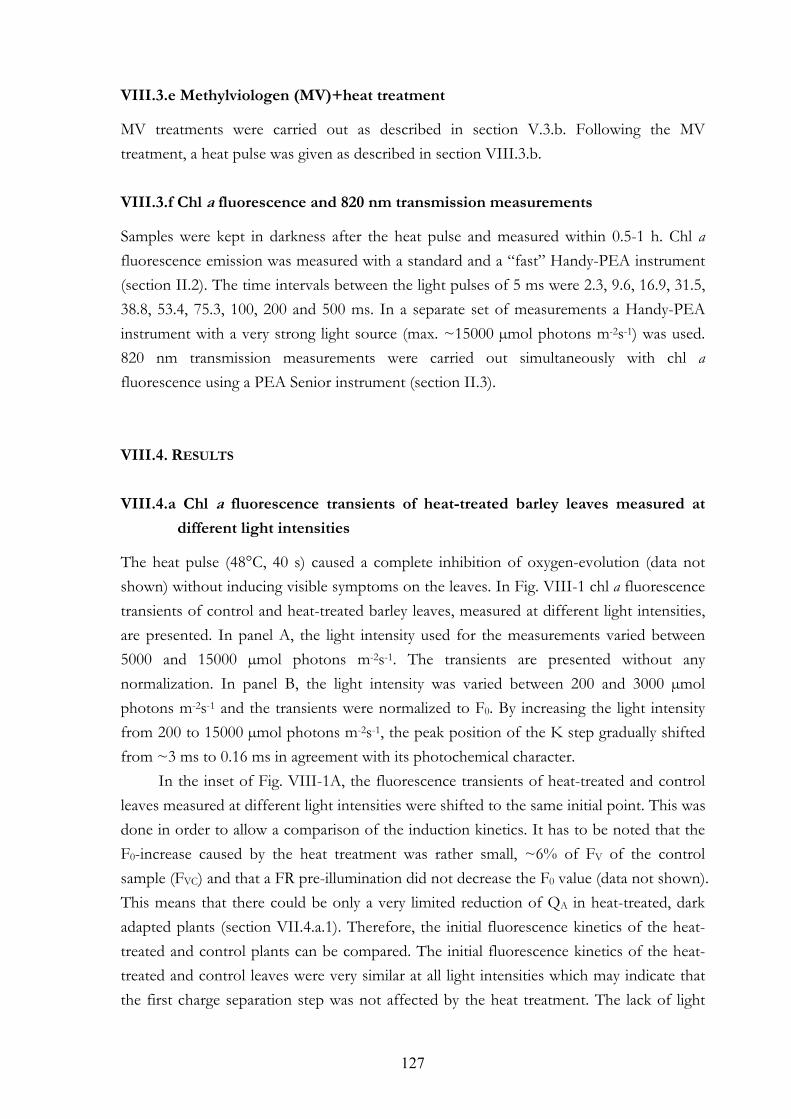
127
VIII.3.e Methylviologen (MV)+heat treatment
MV treatments were carried out as described in section V.3.b. Following the MV treatment, a heat pulse was given as described in section VIII.3.b. VIII.3.f Chl a fluorescence and 820 nm transmission measurements
Samples were kept in darkness after the heat pulse and measured within 0.5-1 h. Chl a fluorescence emission was measured with a standard and a “fast” Handy-PEA instrument (section II.2). The time intervals between the light pulses of 5 ms were 2.3, 9.6, 16.9, 31.5, 38.8, 53.4, 75.3, 100, 200 and 500 ms. In a separate set of measurements a Handy-PEA instrument with a very strong light source (max. ~15000 µmol photons m-2s-1) was used. 820 nm transmission measurements were carried out simultaneously with chl a fluorescence using a PEA Senior instrument (section II.3). VIII.4. RESULTS
VIII.4.a Chl a fluorescence transients of heat-treated barley leaves measured at
different light intensities
The heat pulse (48°C, 40 s) caused a complete inhibition of oxygen-evolution (data not shown) without inducing visible symptoms on the leaves. In Fig. VIII-1 chl a fluorescence transients of control and heat-treated barley leaves, measured at different light intensities, are presented. In panel A, the light intensity used for the measurements varied between 5000 and 15000 µmol photons m-2s-1. The transients are presented without any normalization. In panel B, the light intensity was varied between 200 and 3000 µmol photons m-2s-1 and the transients were normalized to F0. By increasing the light intensity from 200 to 15000 µmol photons m-2s-1, the peak position of the K step gradually shifted from ~3 ms to 0.16 ms in agreement with its photochemical character.
In the inset of Fig. VIII-1A, the fluorescence transients of heat-treated and control leaves measured at different light intensities were shifted to the same initial point. This was done in order to allow a comparison of the induction kinetics. It has to be noted that the F0-increase caused by the heat treatment was rather small, ~6% of FV of the control sample (FVC) and that a FR pre-illumination did not decrease the F0 value (data not shown). This means that there could be only a very limited reduction of QA in heat-treated, dark adapted plants (section VII.4.a.1). Therefore, the initial fluorescence kinetics of the heat-treated and control plants can be compared. The initial fluorescence kinetics of the heat-treated and control leaves were very similar at all light intensities which may indicate that the first charge separation step was not affected by the heat treatment. The lack of light
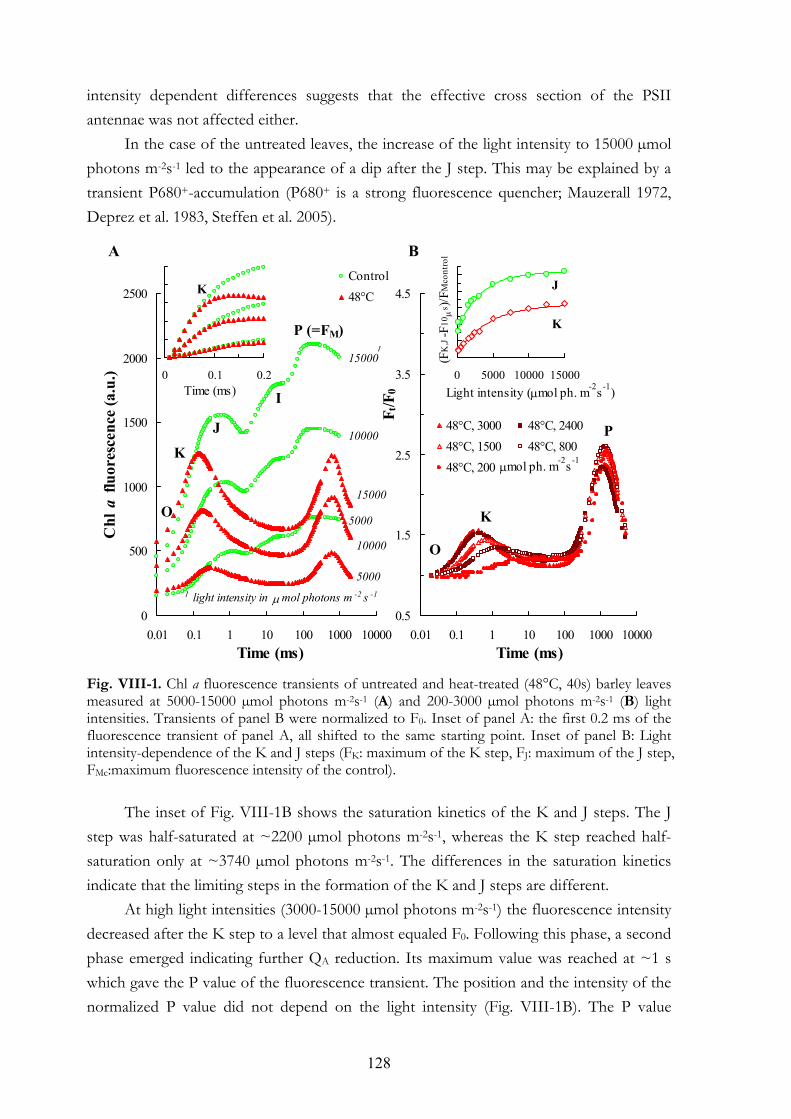
128
intensity dependent differences suggests that the effective cross section of the PSII antennae was not affected either.
In the case of the untreated leaves, the increase of the light intensity to 15000 µmol photons m-2s-1 led to the appearance of a dip after the J step. This may be explained by a transient P680+-accumulation (P680+ is a strong fluorescence quencher; Mauzerall 1972, Deprez et al. 1983, Steffen et al. 2005).
Fig. VIII-1. Chl a fluorescence transients of untreated and heat-treated (48°C, 40s) barley leaves measured at 5000-15000 µmol photons m-2s-1 (A) and 200-3000 µmol photons m-2s-1 (B) light intensities. Transients of panel B were normalized to F0. Inset of panel A: the first 0.2 ms of the fluorescence transient of panel A, all shifted to the same starting point. Inset of panel B: Light intensity-dependence of the K and J steps (FK: maximum of the K step, FJ: maximum of the J step, FMc:maximum fluorescence intensity of the control).
The inset of Fig. VIII-1B shows the saturation kinetics of the K and J steps. The J
step was half-saturated at ~2200 µmol photons m-2s-1, whereas the K step reached half-saturation only at ~3740 µmol photons m-2s-1. The differences in the saturation kinetics indicate that the limiting steps in the formation of the K and J steps are different.
At high light intensities (3000-15000 µmol photons m-2s-1) the fluorescence intensity decreased after the K step to a level that almost equaled F0. Following this phase, a second phase emerged indicating further QA reduction. Its maximum value was reached at ~1 s which gave the P value of the fluorescence transient. The position and the intensity of the normalized P value did not depend on the light intensity (Fig. VIII-1B). The P value
0.5
1.5
2.5
3.5
4.5
0.01 0.1 1 10 100 1000 10000
48°C, 3000 48°C, 240048°C, 1500 48°C, 80048°C, 200
µmol ph. m-2s-1
0 5000 10000 15000
0
500
1000
1500
2000
2500
0.01 0.1 1 10 100 1000 10000
Control48°C
0 0.1 0.2
Chl
a fl
uore
scen
ce (a
.u.)
F t/F
0
K
J
15000
115000
10000
10000
5000
5000
K
J
I
P (=FM)
Time (ms) Time (ms)
Time (ms) Light intensity (µmol ph. m-2s-1)
(FK
,J -F1
0 µs )/
FMco
ntro
l
1 light intensity in µ mol photons m -2 s -1
O
A B
P
K
O
K
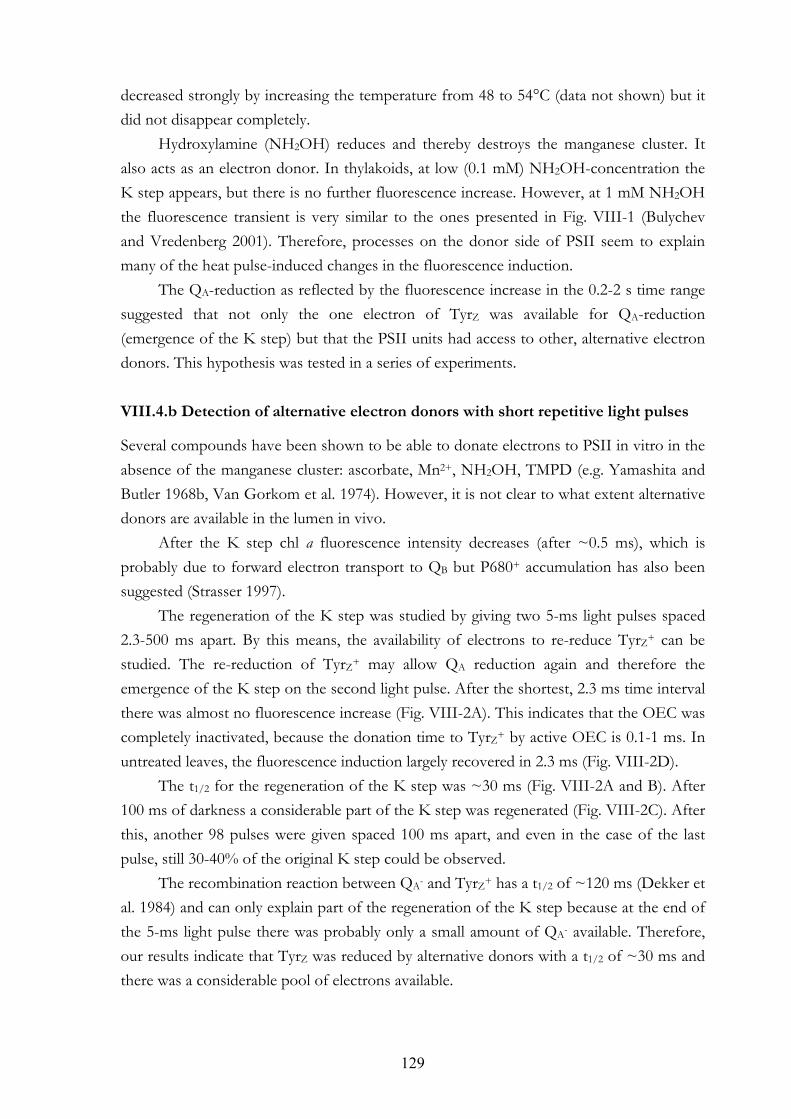
129
decreased strongly by increasing the temperature from 48 to 54°C (data not shown) but it did not disappear completely.
Hydroxylamine (NH2OH) reduces and thereby destroys the manganese cluster. It also acts as an electron donor. In thylakoids, at low (0.1 mM) NH2OH-concentration the K step appears, but there is no further fluorescence increase. However, at 1 mM NH2OH the fluorescence transient is very similar to the ones presented in Fig. VIII-1 (Bulychev and Vredenberg 2001). Therefore, processes on the donor side of PSII seem to explain many of the heat pulse-induced changes in the fluorescence induction.
The QA-reduction as reflected by the fluorescence increase in the 0.2-2 s time range suggested that not only the one electron of TyrZ was available for QA-reduction (emergence of the K step) but that the PSII units had access to other, alternative electron donors. This hypothesis was tested in a series of experiments.
VIII.4.b Detection of alternative electron donors with short repetitive light pulses
Several compounds have been shown to be able to donate electrons to PSII in vitro in the absence of the manganese cluster: ascorbate, Mn2+, NH2OH, TMPD (e.g. Yamashita and Butler 1968b, Van Gorkom et al. 1974). However, it is not clear to what extent alternative donors are available in the lumen in vivo.
After the K step chl a fluorescence intensity decreases (after ~0.5 ms), which is probably due to forward electron transport to QB but P680+ accumulation has also been suggested (Strasser 1997).
The regeneration of the K step was studied by giving two 5-ms light pulses spaced 2.3-500 ms apart. By this means, the availability of electrons to re-reduce TyrZ+ can be studied. The re-reduction of TyrZ+ may allow QA reduction again and therefore the emergence of the K step on the second light pulse. After the shortest, 2.3 ms time interval there was almost no fluorescence increase (Fig. VIII-2A). This indicates that the OEC was completely inactivated, because the donation time to TyrZ+ by active OEC is 0.1-1 ms. In untreated leaves, the fluorescence induction largely recovered in 2.3 ms (Fig. VIII-2D).
The t1/2 for the regeneration of the K step was ~30 ms (Fig. VIII-2A and B). After 100 ms of darkness a considerable part of the K step was regenerated (Fig. VIII-2C). After this, another 98 pulses were given spaced 100 ms apart, and even in the case of the last pulse, still 30-40% of the original K step could be observed.
The recombination reaction between QA- and TyrZ+ has a t1/2 of ~120 ms (Dekker et al. 1984) and can only explain part of the regeneration of the K step because at the end of the 5-ms light pulse there was probably only a small amount of QA- available. Therefore, our results indicate that TyrZ was reduced by alternative donors with a t1/2 of ~30 ms and there was a considerable pool of electrons available.
130
Fig. VIII-2. Chl a fluorescence transients measured during 5-ms light pulses on barley leaves. A: light pulses were spaced 2.3-500 ms apart (heat-treated leaves) B: Regeneration kinetics of the K step derived from measurements like the ones that are presented in panel A. C: Hundred 5-ms light pulses were given spaced 100 ms apart (heat-treated leaves). D: chl a fluorescence measured on untreated leaves during two 5-ms light pulses, spaced 2.3 ms apart.
VIII.4.c Regeneration of the K step after heat pulses of 50-54°C
The regeneration of the K step was also investigated after heat pulses of 50, 52 and 54°C. The transients in Fig. VIII-3 show that even after a 54°C heat pulse, the intensity of the K step and its regeneration after a 31.5 ms time interval were similar to those of a heat pulse at 48°C (Fig. VIII-2).
0
50
100
150
200
250
300
0 100 200 300 400 500600
700
800
900
1000
1100
0.01 0.1 1 10
2.3 ms 16.9 ms 31.5 ms
38.8 ms 75.3 ms 500 ms
D.A.
600
700
800
900
1000
1100
1200
0.01 0.1 1 10
D.A.100 ms (2nd pulse)100 ms (100th pulse)
500
1000
1500
2000
0.01 0.1 1 10
D.A.
2.3 ms
Time (ms)
Time (ms) Time (ms)
Time interval between pulses (ms)
Chl
a fl
uore
scen
ce (a
.u.)
Chl
a fl
uore
scen
ce (a
.u.)
Chl
a fl
uore
scen
ce (a
.u.)
F V (a
.u.)
A B
C D
t1/2= 30.45 ms
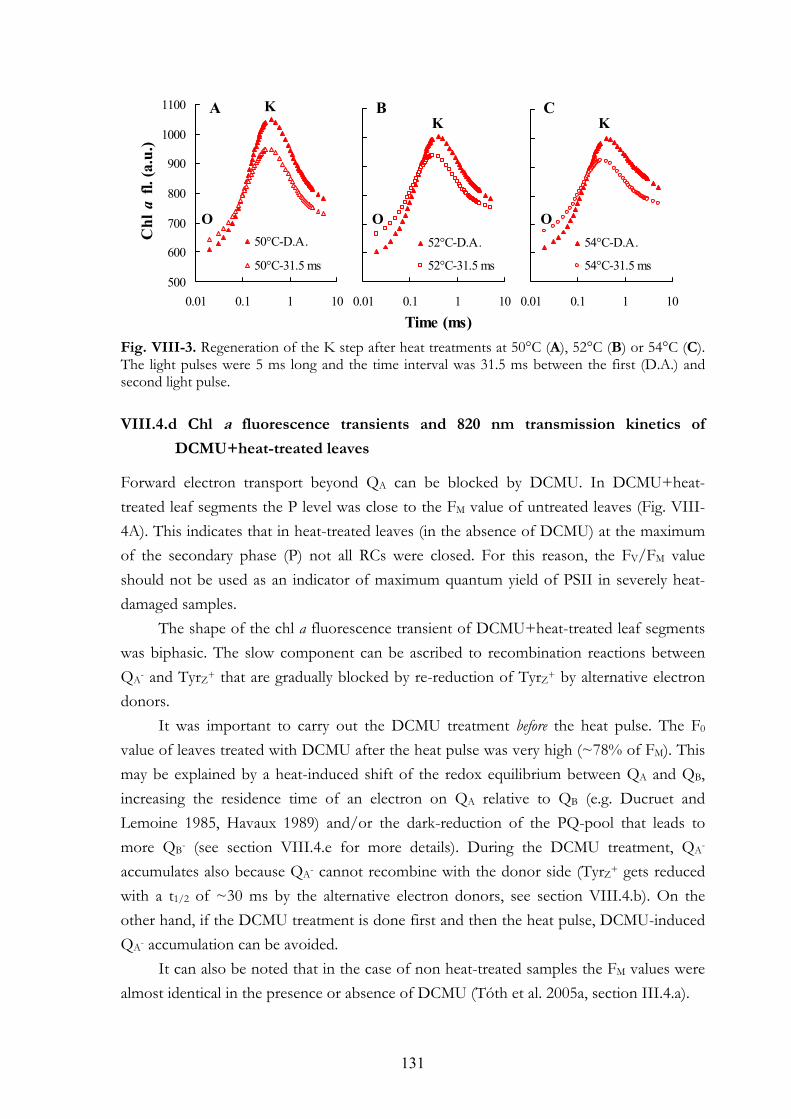
131
Fig. VIII-3. Regeneration of the K step after heat treatments at 50°C (A), 52°C (B) or 54°C (C). The light pulses were 5 ms long and the time interval was 31.5 ms between the first (D.A.) and second light pulse. VIII.4.d Chl a fluorescence transients and 820 nm transmission kinetics of
DCMU+heat-treated leaves
Forward electron transport beyond QA can be blocked by DCMU. In DCMU+heat-treated leaf segments the P level was close to the FM value of untreated leaves (Fig. VIII-4A). This indicates that in heat-treated leaves (in the absence of DCMU) at the maximum of the secondary phase (P) not all RCs were closed. For this reason, the FV/FM value should not be used as an indicator of maximum quantum yield of PSII in severely heat-damaged samples.
The shape of the chl a fluorescence transient of DCMU+heat-treated leaf segments was biphasic. The slow component can be ascribed to recombination reactions between QA- and TyrZ+ that are gradually blocked by re-reduction of TyrZ+ by alternative electron donors.
It was important to carry out the DCMU treatment before the heat pulse. The F0 value of leaves treated with DCMU after the heat pulse was very high (~78% of FM). This may be explained by a heat-induced shift of the redox equilibrium between QA and QB, increasing the residence time of an electron on QA relative to QB (e.g. Ducruet and Lemoine 1985, Havaux 1989) and/or the dark-reduction of the PQ-pool that leads to more QB- (see section VIII.4.e for more details). During the DCMU treatment, QA- accumulates also because QA- cannot recombine with the donor side (TyrZ+ gets reduced with a t1/2 of ~30 ms by the alternative electron donors, see section VIII.4.b). On the other hand, if the DCMU treatment is done first and then the heat pulse, DCMU-induced QA- accumulation can be avoided.
It can also be noted that in the case of non heat-treated samples the FM values were almost identical in the presence or absence of DCMU (Tóth et al. 2005a, section III.4.a).
500
600
700
800
900
1000
1100
0.01 0.1 1 10
50°C-D.A.
50°C-31.5 ms
0.01 0.1 1 10
52°C-D.A.
52°C-31.5 ms
0.01 0.1 1 10
54°C-D.A.
54°C-31.5 ms
A B CK
Chl
a fl
. (a.
u.)
O
Time (ms)
K K
O O
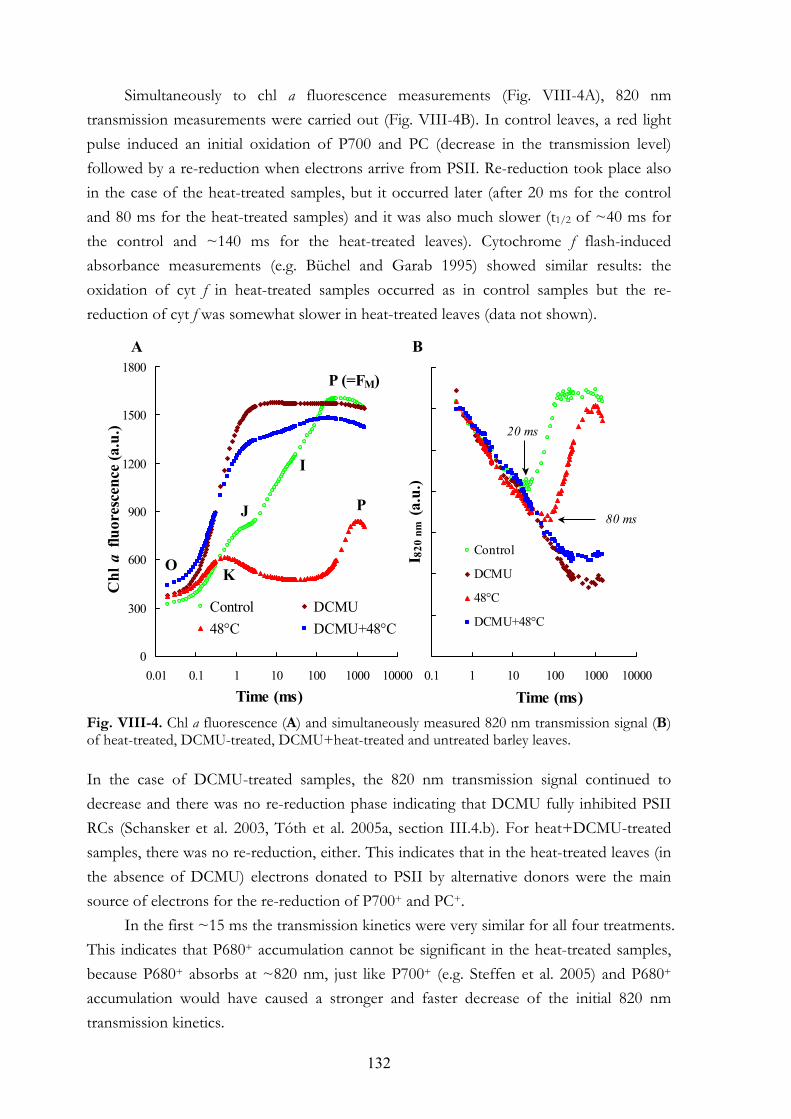
132
Simultaneously to chl a fluorescence measurements (Fig. VIII-4A), 820 nm transmission measurements were carried out (Fig. VIII-4B). In control leaves, a red light pulse induced an initial oxidation of P700 and PC (decrease in the transmission level) followed by a re-reduction when electrons arrive from PSII. Re-reduction took place also in the case of the heat-treated samples, but it occurred later (after 20 ms for the control and 80 ms for the heat-treated samples) and it was also much slower (t1/2 of ~40 ms for the control and ~140 ms for the heat-treated leaves). Cytochrome f flash-induced absorbance measurements (e.g. Büchel and Garab 1995) showed similar results: the oxidation of cyt f in heat-treated samples occurred as in control samples but the re-reduction of cyt f was somewhat slower in heat-treated leaves (data not shown).
Fig. VIII-4. Chl a fluorescence (A) and simultaneously measured 820 nm transmission signal (B) of heat-treated, DCMU-treated, DCMU+heat-treated and untreated barley leaves. In the case of DCMU-treated samples, the 820 nm transmission signal continued to decrease and there was no re-reduction phase indicating that DCMU fully inhibited PSII RCs (Schansker et al. 2003, Tóth et al. 2005a, section III.4.b). For heat+DCMU-treated samples, there was no re-reduction, either. This indicates that in the heat-treated leaves (in the absence of DCMU) electrons donated to PSII by alternative donors were the main source of electrons for the re-reduction of P700+ and PC+.
In the first ~15 ms the transmission kinetics were very similar for all four treatments. This indicates that P680+ accumulation cannot be significant in the heat-treated samples, because P680+ absorbs at ~820 nm, just like P700+ (e.g. Steffen et al. 2005) and P680+ accumulation would have caused a stronger and faster decrease of the initial 820 nm transmission kinetics.
0
300
600
900
1200
1500
1800
0.01 0.1 1 10 100 1000 10000
Control DCMU48°C DCMU+48°C
P (=FM)
O
P
I
J
K
Chl
a fl
uore
scen
ce (a
.u.)
0.1 1 10 100 1000 10000
Control
DCMU
48°C
DCMU+48°C
I 820
nm
(a.u
.)
Time (ms)Time (ms)
80 ms
20 ms
A B
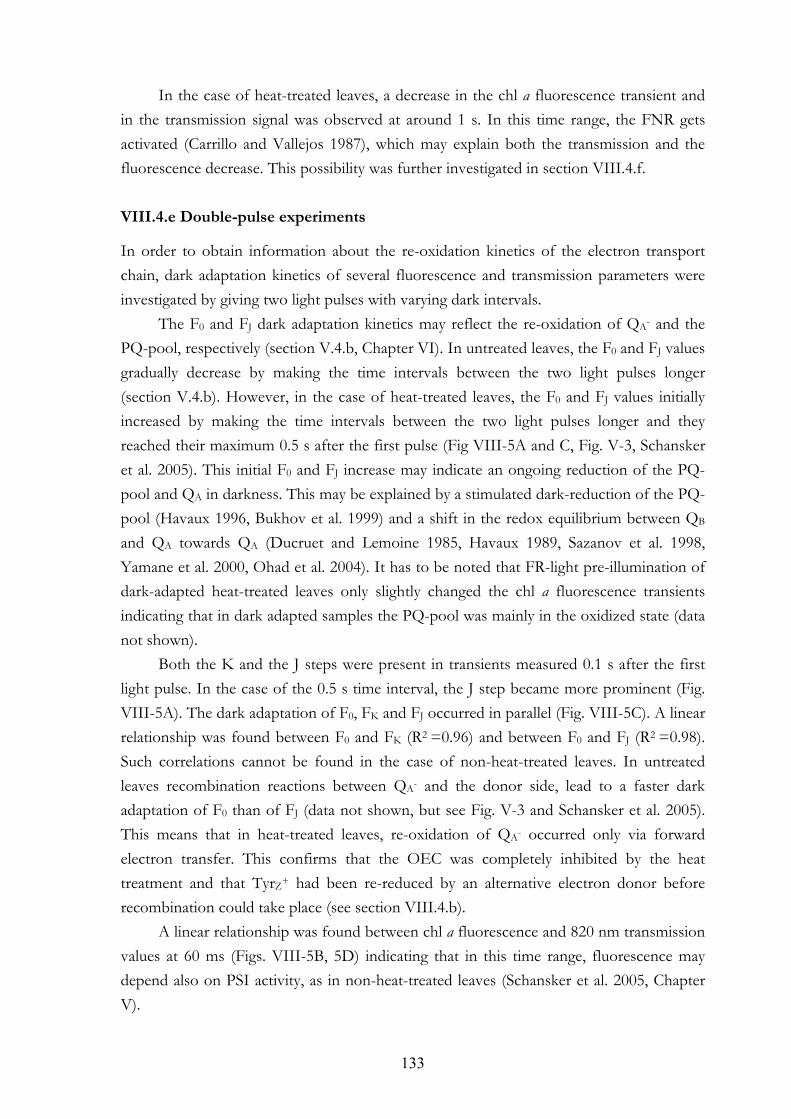
133
In the case of heat-treated leaves, a decrease in the chl a fluorescence transient and in the transmission signal was observed at around 1 s. In this time range, the FNR gets activated (Carrillo and Vallejos 1987), which may explain both the transmission and the fluorescence decrease. This possibility was further investigated in section VIII.4.f. VIII.4.e Double-pulse experiments
In order to obtain information about the re-oxidation kinetics of the electron transport chain, dark adaptation kinetics of several fluorescence and transmission parameters were investigated by giving two light pulses with varying dark intervals.
The F0 and FJ dark adaptation kinetics may reflect the re-oxidation of QA- and the PQ-pool, respectively (section V.4.b, Chapter VI). In untreated leaves, the F0 and FJ values gradually decrease by making the time intervals between the two light pulses longer (section V.4.b). However, in the case of heat-treated leaves, the F0 and FJ values initially increased by making the time intervals between the two light pulses longer and they reached their maximum 0.5 s after the first pulse (Fig VIII-5A and C, Fig. V-3, Schansker et al. 2005). This initial F0 and FJ increase may indicate an ongoing reduction of the PQ-pool and QA in darkness. This may be explained by a stimulated dark-reduction of the PQ-pool (Havaux 1996, Bukhov et al. 1999) and a shift in the redox equilibrium between QB and QA towards QA (Ducruet and Lemoine 1985, Havaux 1989, Sazanov et al. 1998, Yamane et al. 2000, Ohad et al. 2004). It has to be noted that FR-light pre-illumination of dark-adapted heat-treated leaves only slightly changed the chl a fluorescence transients indicating that in dark adapted samples the PQ-pool was mainly in the oxidized state (data not shown).
Both the K and the J steps were present in transients measured 0.1 s after the first light pulse. In the case of the 0.5 s time interval, the J step became more prominent (Fig. VIII-5A). The dark adaptation of F0, FK and FJ occurred in parallel (Fig. VIII-5C). A linear relationship was found between F0 and FK (R2 =0.96) and between F0 and FJ (R2 =0.98). Such correlations cannot be found in the case of non-heat-treated leaves. In untreated leaves recombination reactions between QA- and the donor side, lead to a faster dark adaptation of F0 than of FJ (data not shown, but see Fig. V-3 and Schansker et al. 2005). This means that in heat-treated leaves, re-oxidation of QA- occurred only via forward electron transfer. This confirms that the OEC was completely inhibited by the heat treatment and that TyrZ+ had been re-reduced by an alternative electron donor before recombination could take place (see section VIII.4.b).
A linear relationship was found between chl a fluorescence and 820 nm transmission values at 60 ms (Figs. VIII-5B, 5D) indicating that in this time range, fluorescence may depend also on PSI activity, as in non-heat-treated leaves (Schansker et al. 2005, Chapter V).
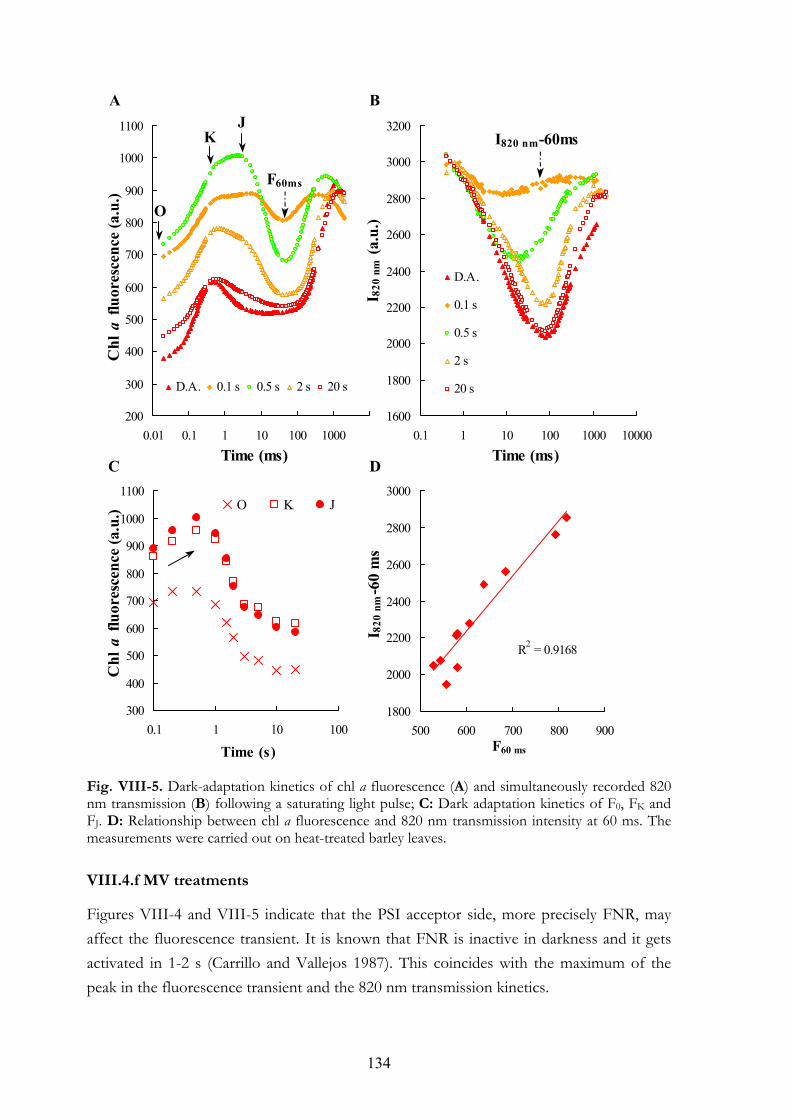
134
Fig. VIII-5. Dark-adaptation kinetics of chl a fluorescence (A) and simultaneously recorded 820 nm transmission (B) following a saturating light pulse; C: Dark adaptation kinetics of F0, FK and FJ. D: Relationship between chl a fluorescence and 820 nm transmission intensity at 60 ms. The measurements were carried out on heat-treated barley leaves.
VIII.4.f MV treatments
Figures VIII-4 and VIII-5 indicate that the PSI acceptor side, more precisely FNR, may affect the fluorescence transient. It is known that FNR is inactive in darkness and it gets activated in 1-2 s (Carrillo and Vallejos 1987). This coincides with the maximum of the peak in the fluorescence transient and the 820 nm transmission kinetics.
200
300
400
500
600
700
800
900
1000
1100
0.01 0.1 1 10 100 1000 10000
D.A. 0.1 s 0.5 s 2 s 20 s
1600
1800
2000
2200
2400
2600
2800
3000
3200
0.1 1 10 100 1000 10000
D.A.
0.1 s
0.5 s
2 s
20 s
300
400
500
600
700
800
900
1000
1100
0.1 1 10 100
O K J
R2 = 0.9168
1800
2000
2200
2400
2600
2800
3000
500 600 700 800 900
Chl
a fl
uore
scen
ce (a
.u.)
I 820
nm
(a.u
.)
Time (ms) Time (ms)
O
KJ
F60ms
I820 nm-60ms
Time (s) F60 ms
I 820
nm
-60
ms
Chl
a fl
uore
scen
ce (a
.u.)
DC
A B
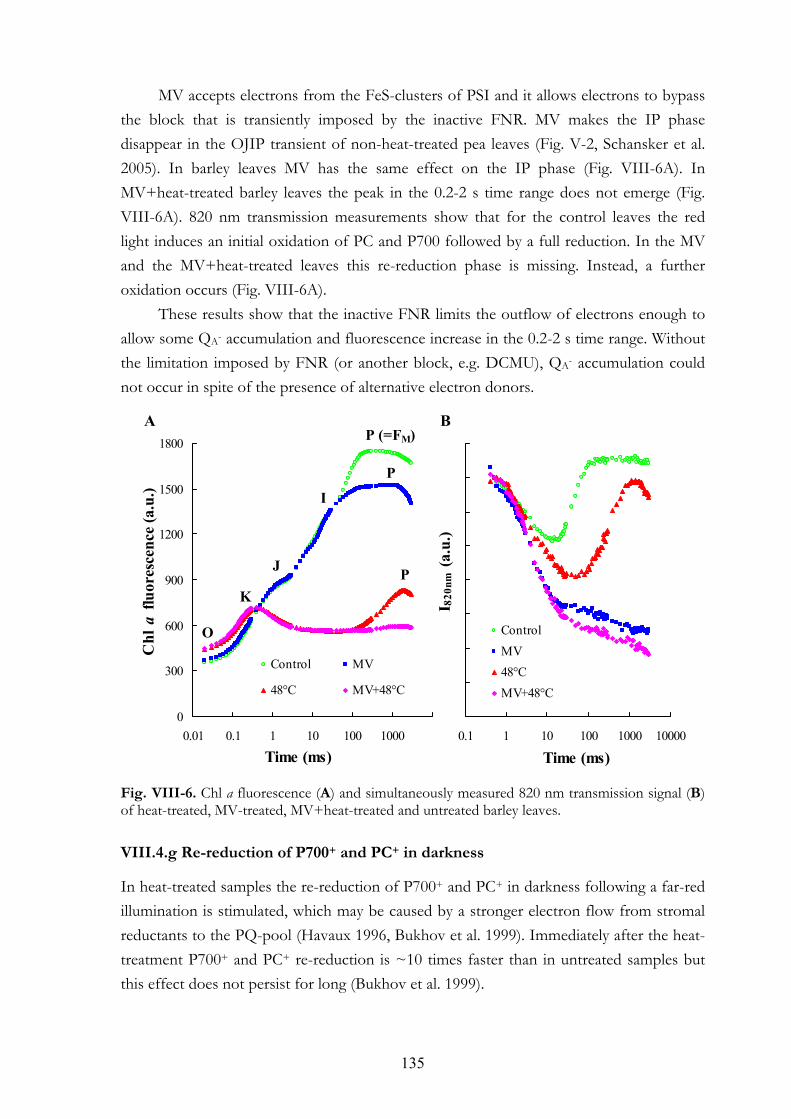
135
MV accepts electrons from the FeS-clusters of PSI and it allows electrons to bypass the block that is transiently imposed by the inactive FNR. MV makes the IP phase disappear in the OJIP transient of non-heat-treated pea leaves (Fig. V-2, Schansker et al. 2005). In barley leaves MV has the same effect on the IP phase (Fig. VIII-6A). In MV+heat-treated barley leaves the peak in the 0.2-2 s time range does not emerge (Fig. VIII-6A). 820 nm transmission measurements show that for the control leaves the red light induces an initial oxidation of PC and P700 followed by a full reduction. In the MV and the MV+heat-treated leaves this re-reduction phase is missing. Instead, a further oxidation occurs (Fig. VIII-6A).
These results show that the inactive FNR limits the outflow of electrons enough to allow some QA- accumulation and fluorescence increase in the 0.2-2 s time range. Without the limitation imposed by FNR (or another block, e.g. DCMU), QA- accumulation could not occur in spite of the presence of alternative electron donors.
Fig. VIII-6. Chl a fluorescence (A) and simultaneously measured 820 nm transmission signal (B) of heat-treated, MV-treated, MV+heat-treated and untreated barley leaves. VIII.4.g Re-reduction of P700+ and PC+ in darkness
In heat-treated samples the re-reduction of P700+ and PC+ in darkness following a far-red illumination is stimulated, which may be caused by a stronger electron flow from stromal reductants to the PQ-pool (Havaux 1996, Bukhov et al. 1999). Immediately after the heat-treatment P700+ and PC+ re-reduction is ~10 times faster than in untreated samples but this effect does not persist for long (Bukhov et al. 1999).
0
300
600
900
1200
1500
1800
0.01 0.1 1 10 100 1000 10000
Control MV
48°C MV+48°C
0.1 1 10 100 1000 10000
ControlMV48°CMV+48°C
Chl
a fl
uore
scen
ce (a
.u.)
I 820
nm (a
.u.)
A B
O
J
I
K
P (=FM)
P
P
Time (ms)Time (ms)
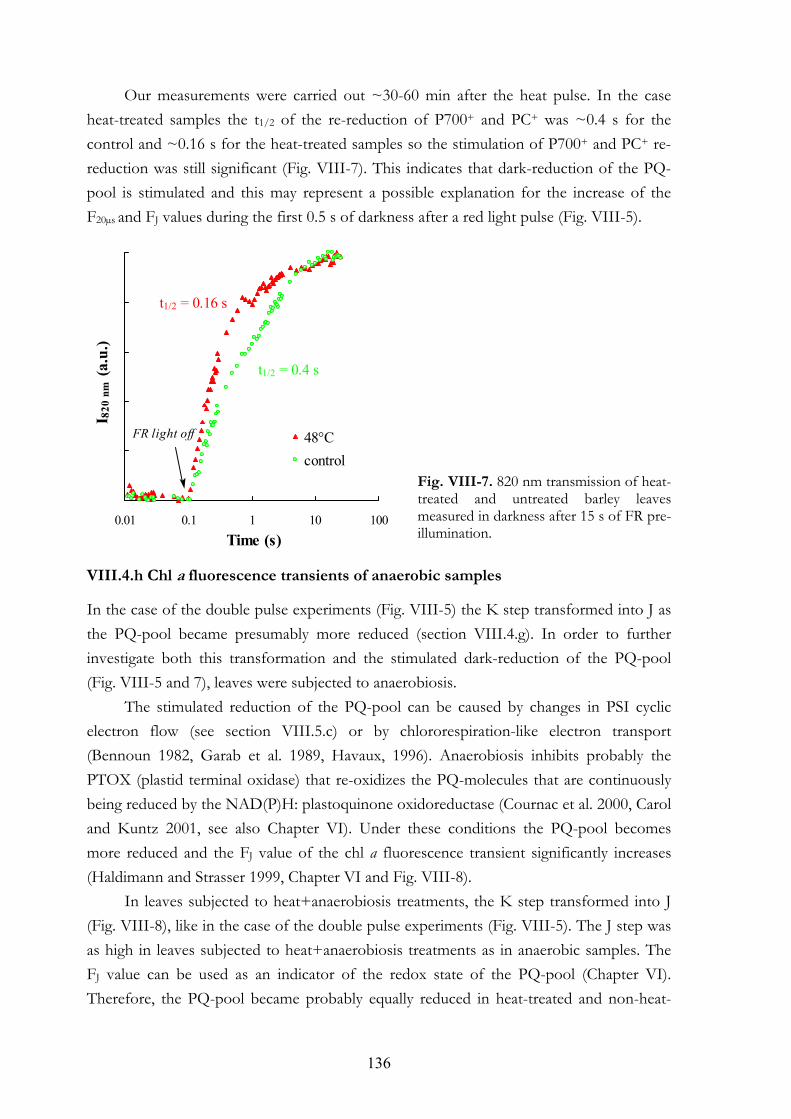
136
Our measurements were carried out ~30-60 min after the heat pulse. In the case heat-treated samples the t1/2 of the re-reduction of P700+ and PC+ was ~0.4 s for the control and ~0.16 s for the heat-treated samples so the stimulation of P700+ and PC+ re-reduction was still significant (Fig. VIII-7). This indicates that dark-reduction of the PQ-pool is stimulated and this may represent a possible explanation for the increase of the F20µs and FJ values during the first 0.5 s of darkness after a red light pulse (Fig. VIII-5).
Fig. VIII-7. 820 nm transmission of heat-treated and untreated barley leaves measured in darkness after 15 s of FR pre-illumination.
VIII.4.h Chl a fluorescence transients of anaerobic samples
In the case of the double pulse experiments (Fig. VIII-5) the K step transformed into J as the PQ-pool became presumably more reduced (section VIII.4.g). In order to further investigate both this transformation and the stimulated dark-reduction of the PQ-pool (Fig. VIII-5 and 7), leaves were subjected to anaerobiosis.
The stimulated reduction of the PQ-pool can be caused by changes in PSI cyclic electron flow (see section VIII.5.c) or by chlororespiration-like electron transport (Bennoun 1982, Garab et al. 1989, Havaux, 1996). Anaerobiosis inhibits probably the PTOX (plastid terminal oxidase) that re-oxidizes the PQ-molecules that are continuously being reduced by the NAD(P)H: plastoquinone oxidoreductase (Cournac et al. 2000, Carol and Kuntz 2001, see also Chapter VI). Under these conditions the PQ-pool becomes more reduced and the FJ value of the chl a fluorescence transient significantly increases (Haldimann and Strasser 1999, Chapter VI and Fig. VIII-8).
In leaves subjected to heat+anaerobiosis treatments, the K step transformed into J (Fig. VIII-8), like in the case of the double pulse experiments (Fig. VIII-5). The J step was as high in leaves subjected to heat+anaerobiosis treatments as in anaerobic samples. The FJ value can be used as an indicator of the redox state of the PQ-pool (Chapter VI). Therefore, the PQ-pool became probably equally reduced in heat-treated and non-heat-
0.01 0.1 1 10 100
48°Ccontrol
Time (s)
I 820
nm
(a.u
.)
t1/2 = 0.4 s
t1/2 = 0.16 s
FR light off
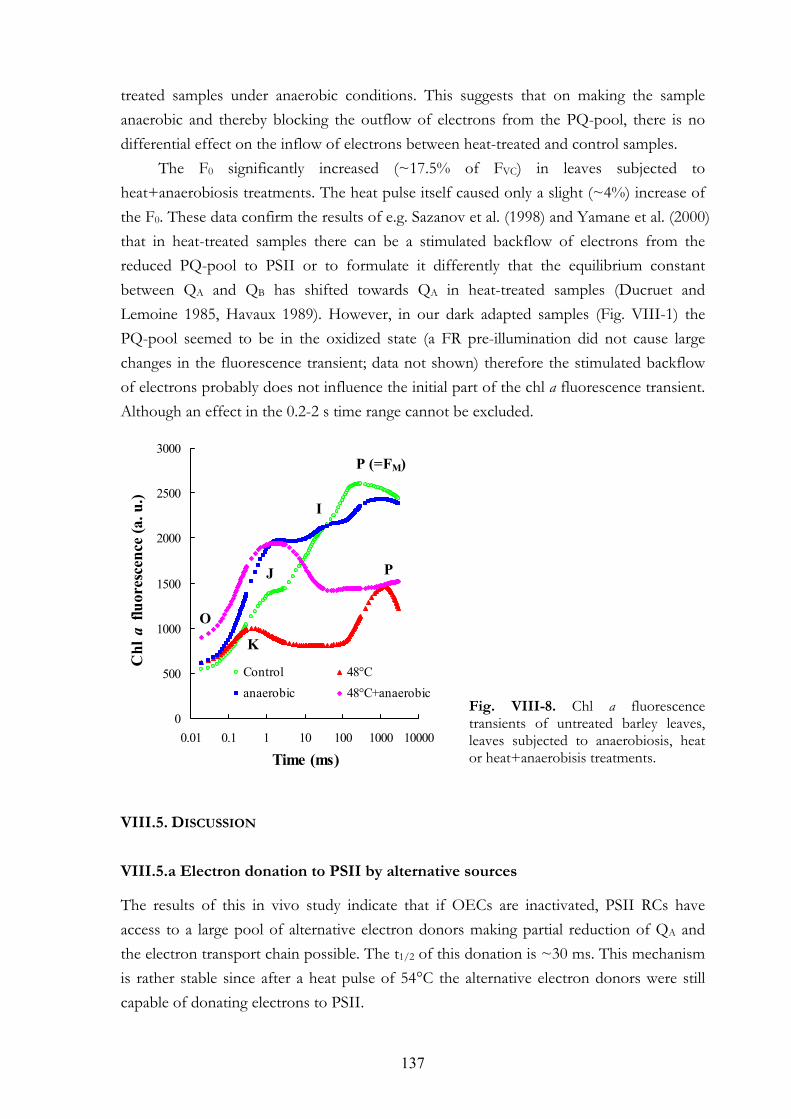
137
treated samples under anaerobic conditions. This suggests that on making the sample anaerobic and thereby blocking the outflow of electrons from the PQ-pool, there is no differential effect on the inflow of electrons between heat-treated and control samples.
The F0 significantly increased (~17.5% of FVC) in leaves subjected to heat+anaerobiosis treatments. The heat pulse itself caused only a slight (~4%) increase of the F0. These data confirm the results of e.g. Sazanov et al. (1998) and Yamane et al. (2000) that in heat-treated samples there can be a stimulated backflow of electrons from the reduced PQ-pool to PSII or to formulate it differently that the equilibrium constant between QA and QB has shifted towards QA in heat-treated samples (Ducruet and Lemoine 1985, Havaux 1989). However, in our dark adapted samples (Fig. VIII-1) the PQ-pool seemed to be in the oxidized state (a FR pre-illumination did not cause large changes in the fluorescence transient; data not shown) therefore the stimulated backflow of electrons probably does not influence the initial part of the chl a fluorescence transient. Although an effect in the 0.2-2 s time range cannot be excluded.
Fig. VIII-8. Chl a fluorescence transients of untreated barley leaves, leaves subjected to anaerobiosis, heat or heat+anaerobisis treatments.
VIII.5. DISCUSSION
VIII.5.a Electron donation to PSII by alternative sources
The results of this in vivo study indicate that if OECs are inactivated, PSII RCs have access to a large pool of alternative electron donors making partial reduction of QA and the electron transport chain possible. The t1/2 of this donation is ~30 ms. This mechanism is rather stable since after a heat pulse of 54°C the alternative electron donors were still capable of donating electrons to PSII.
0
500
1000
1500
2000
2500
3000
0.01 0.1 1 10 100 1000 10000
Control 48°Canaerobic 48°C+anaerobic
J
P (=FM)
I
Time (ms)
Chl
a fl
uore
scen
ce (a
. u.)
O
K
P
138
A likely alternative electron donor in vivo is ascorbate (Asc). The concentration of Asc in chloroplasts is rather high; ~25-50 mM in C3 plants (Eskling and Åkerlund 1998, Smirnoff 2000). Violaxanthin deepoxidase, a key enzyme of the xanthophyll cycle, is located in the lumen and uses Asc as co-substrate (Bratt et al. 1995). Therefore, it is likely that a significant amount of Asc can be found in the thylakoid lumen. The Asc concentration in the lumen of pea leaves was estimated to be 3.8 mM (Foyer and Lelandais 1996).
In isolated thylakoids, Asc has been shown to be able to donate electrons at a relatively high rate to PSII of which the manganese cluster had been destroyed (e.g. Yamashita and Butler 1968b, Mano et al. 2004). Asc is, on the other hand, not a good electron donor to PSII RCs with an active OEC (Mano et al. 2004). It has also been suggested that Asc can donate electrons to PSI, though it is inefficient (Hauska 1977, Mano et al. 2004). We did not find evidence for electron donation by alternative electron donors to P700+.
The physiological significance of alternative electron donors may be to prevent photoinhibition by hindering the accumulation of highly oxidizing positive charges on the donor side of PSII (Blubaugh et al. 1991, Mano et al. 1997). We showed that electrons arriving from the alternative donors via PSII were able to reduce also P700+ and PC+.
According to Mano et al. (1997, 2004) the regeneration of Asc for sustaining the lumenal reactions occurs in the following way: On donating an electron to PSII (maybe PSI) Asc can be oxidized to monodehydroascorbate (MDA) by PSII (maybe by PSI) and MDA radicals in the lumen are disproportionated to Asc and dehydroascorbate (DHA). DHA is able to diffuse to the stroma where DHA reductase catalyses the reduction of DHA by gluthatione. Asc- is then thought to be transferred to the lumen by a postulated transporter or rather by diffusion (Foyer and Lelandais 1996). VIII.5.b PSI acceptor side
We have shown that for the IP phase both an electron flow towards PSI and a transient block at the acceptor side (inactive FNR) are necessary (Schansker et al. 2005, Chapter V). In this chapter, experimental evidence was obtained showing that in heat-treated leaves the limitation imposed by the inactive FNR is needed for QA- accumulation (seen as fluorescence increase in the 0.2-2 s time range) beside the availability of alternative electron donors to PSII. VIII.5.c Dark-reduction of the PQ-pool
In leaves, chlororespiration (Bennoun 1982, Garab 1989) may be responsible for a non-photochemical reduction of the molecules of the PQ-pool (section VI.4.a) and a second source of electrons may be formed by cyclic electron transport around PSI
139
(Bendall and Manasse 1995, Joët et al. 2002a, Munekage et al. 2004, Bukhov and Carpentier 2004). The cyclic pathway in plants can occur via two pathways. It can make use of a NADPH-dehydrogenase (NDH) that uses NADPH as a substrate, or via ferredoxin-PQ-reductase (FQR) using Fd as a substrate; this pathway is sensitive to antimycin A (Tagawa et al. 1963). Havaux et al. (2005) have shown that the relative contribution of the two pathways varies from one plant species to another. In barley protoplasts, it has been shown that the slow component of the far-red light stimulated luminescence (related to PSI cyclic electron transfer) is sensitive to antimycin A (Nakamoto et al. 1988). Therefore it is likely that in non-stressed barley plants the FQR pathway is active.
The data show that the heat pulse caused a stimulated dark-reduction of the PQ-pool (section VIII.4.e and g) and that it was not caused by stimulated chlororespiration (section VIII.4.h) but rather by changes in PSI cyclic electron transfer. The mechanism by which heat stimulates the cyclic electron transport through the PQ-pool is beyond the scope of this study. We speculate that it can be due to an effect on the enzyme that causes the non-photochemical reduction of the PQ-pool (a kind of activation) or to a heat-induced increase of the size of the pool of stromal reductants. These changes may occur on the FQR pathway (in non-stressed barley plants this is probably the active one, see the previous paragraph), but is also possible that the NDH route becomes activated upon heat stress (Sazanov et al. 1998). VIII.5.d Interpretation of the OJIP transient: K and J steps
In heat-treated leaves, TyrZ can provide one electron to P680+ and QA reduction. After this electron is gone, there are alternative electron sources but they are much slower (t1/2 of donation is ~30 ms, see section VIII.4.b). For this reason it is remarkable that when the PQ-pool is relatively reduced (by pre-illumination or anaerobiosis treatment), a J step is observed instead of the K and a higher level of QA-reduction is reached. Besides, in DCMU+heat treated samples, the FJ and FM values are close to the FM of untreated leaves. This could mean that
(1) both the J step and the K step correspond to one charge separation but in heat-treated leaves forward electron transfer is faster and therefore there is a decrease in fluorescence yield and QA- concentration after 400 µs. However, there is no study that shows that in heat-treated samples the electron transfer becomes faster. Instead, it has been shown that the redox equilibrium between QA and QB is shifted towards QA (Ducruet and Lemoine 1985, Havaux 1989).
(2) the J step corresponds to more than one charge separation. Maybe three electrons are needed in untreated samples to reach FJ (QA and QB reduction) whereas in anaerobic or DCMU-treated samples one electron suffices (only QA reduction, see also
140
section VI.5.d). The observation that considerably more light is needed to half-saturate the K step compared to the J step (inset of Fig. VII-1B) supports this. In that case, the fluorescence decrease after 400 µs in heat-treated leaves is caused by the lack of electrons arriving from the donor side of PSII in combination with ongoing forward electron transfer to QB. However, it has been shown that the kinetics of the OJ phases of untreated and DCMU-treated samples are nearly overlapping (Strasser and Strasser 1995), especially the area growth kinetics (Fig. IX-1). Based on this, it has been argued that the OJ phase corresponds to one charge separation in both DCMU-treated and untreated samples (Strasser and Strasser 1995, Strasser et al. 2004).
(3) P680+ accumulation has been suggested earlier by Strasser (1997). However, P680+ accumulation cannot be significant in our samples, because there is no difference in the 820 nm transmission kinetics of heat-treated and untreated samples in the 400 µs-15 ms time range (P680+ absorbs at 820 nm, just like P700+).
A possible complication may be that the fluorescence yield could be sensitive to QB-occupancy state as it is suggested in Chapter VI and Schansker et al. 2006.
141
CHAPTER IX
IX.1. INTERPRETATION OF THE OJIP TRANSIENT
In photosynthesis research, chl a fluorescence is one of the most widely applied methods. However, there are still several fundamental questions concerning its interpretation (section I.2.a) that may be partially due to the fact that the fluorescence yield is modulated by many factors. One of the main goals of this thesis was to contribute to the understanding of the fluorescence signal, more precisely, the OJIP transient.
The results presented in this thesis support the idea that the kinetics of the OJIP transient reflect not only the reduction of QA but also the reduction of the whole electron transport chain. As suggested in section V.5.h, the different steps of the OJIP transient may reflect kinetic bottlenecks in the electron transport chain: the J step at ~2 ms may reflect the exchange of a PQH2 molecule with a PQ at the QB-site, the I step at ~30 ms may reflect the re-oxidation of PQH2 and the P level at ~200 ms reflects the transient block imposed by inactive FNR. Together with this, the OJ phase may correspond to the reduction of the PSII acceptor side, the JI phase may correspond to a partial reduction of the PQ-pool and finally, the IP phase represents the reduction of the acceptor side of PSI. In the following sections, our knowledge of the different phases and steps are summarized and evaluated.
IX.1.a The photochemical (OJ) phase of the OJIP transient
The OJ phase is the photochemical phase of the OJIP transient that means that its kinetics are strongly influenced by the light intensity. In the case of a standard, 3000 µmol photons m-2s-1 light pulse, the OJ phase ends at ~2 ms (J step). As shown in the different chapters and discussed in more detail in the following sections, several processes may have an influence in this time range: PSII antenna heterogeneity, the occupancy state of the QB-site that is related to the redox state of the PQ-pool, limitations on the donor side that may lead to a transient accumulation of the fluorescence quencher P680+ and PSII antenna connectivity.
GENERAL DISCUSSION
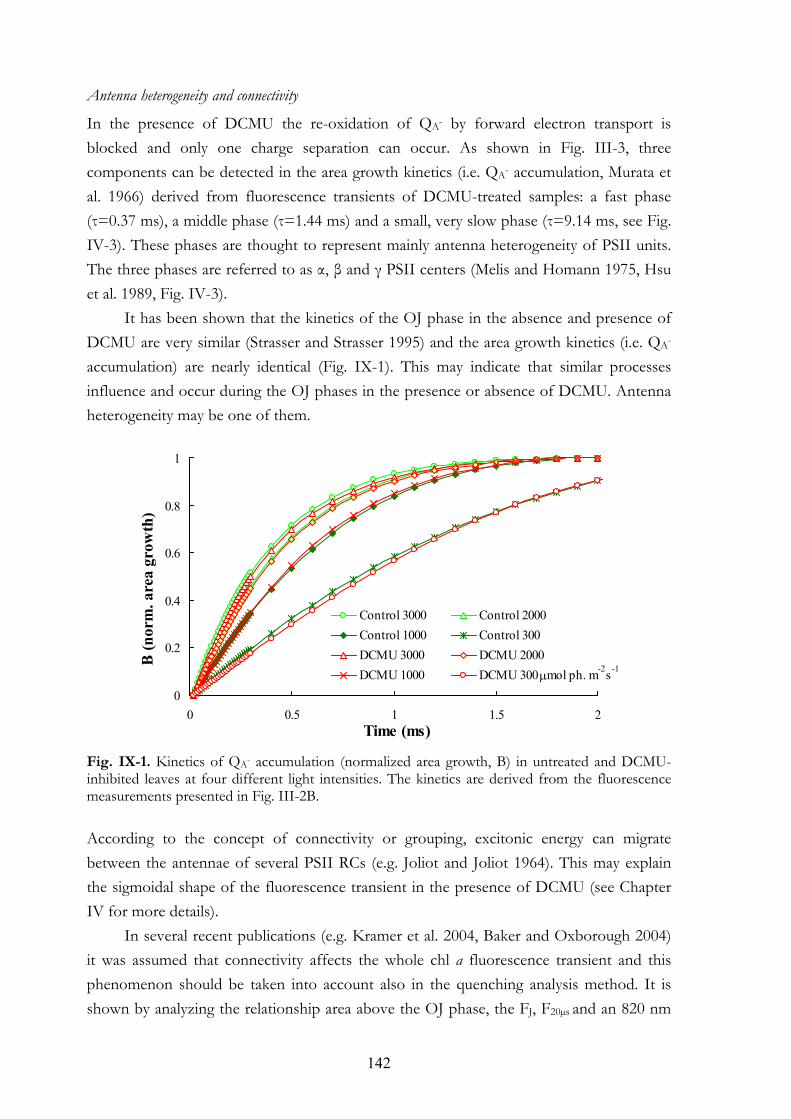
142
Antenna heterogeneity and connectivity
In the presence of DCMU the re-oxidation of QA- by forward electron transport is blocked and only one charge separation can occur. As shown in Fig. III-3, three components can be detected in the area growth kinetics (i.e. QA- accumulation, Murata et al. 1966) derived from fluorescence transients of DCMU-treated samples: a fast phase (τ=0.37 ms), a middle phase (τ=1.44 ms) and a small, very slow phase (τ=9.14 ms, see Fig. IV-3). These phases are thought to represent mainly antenna heterogeneity of PSII units. The three phases are referred to as α, β and γ PSII centers (Melis and Homann 1975, Hsu et al. 1989, Fig. IV-3).
It has been shown that the kinetics of the OJ phase in the absence and presence of DCMU are very similar (Strasser and Strasser 1995) and the area growth kinetics (i.e. QA- accumulation) are nearly identical (Fig. IX-1). This may indicate that similar processes influence and occur during the OJ phases in the presence or absence of DCMU. Antenna heterogeneity may be one of them. Fig. IX-1. Kinetics of QA- accumulation (normalized area growth, B) in untreated and DCMU-inhibited leaves at four different light intensities. The kinetics are derived from the fluorescence measurements presented in Fig. III-2B. According to the concept of connectivity or grouping, excitonic energy can migrate between the antennae of several PSII RCs (e.g. Joliot and Joliot 1964). This may explain the sigmoidal shape of the fluorescence transient in the presence of DCMU (see Chapter IV for more details).
In several recent publications (e.g. Kramer et al. 2004, Baker and Oxborough 2004) it was assumed that connectivity affects the whole chl a fluorescence transient and this phenomenon should be taken into account also in the quenching analysis method. It is shown by analyzing the relationship area above the OJ phase, the FJ, F20µs and an 820 nm
0
0.2
0.4
0.6
0.8
1
0 0.5 1 1.5 2
Control 3000 Control 2000Control 1000 Control 300DCMU 3000 DCMU 2000DCMU 1000 DCMU 300 µmol ph. m-2s-1
Time (ms)
B (n
orm
. are
a gr
owth
)
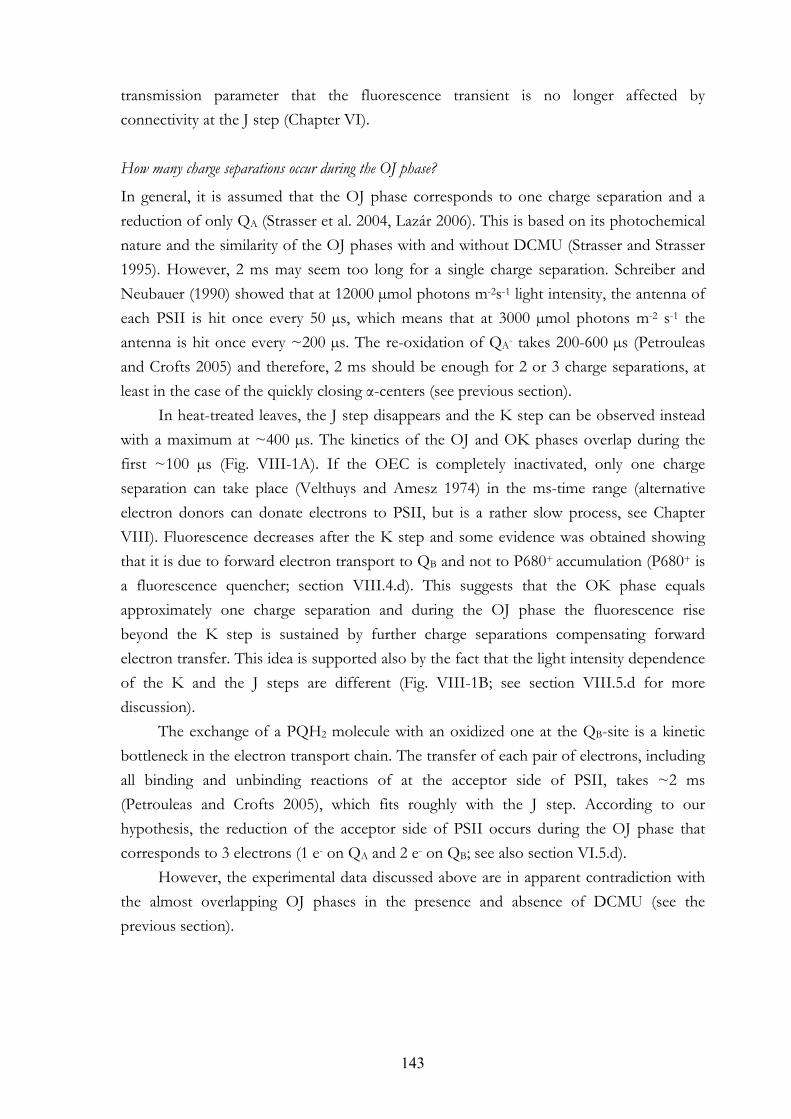
143
transmission parameter that the fluorescence transient is no longer affected by connectivity at the J step (Chapter VI). How many charge separations occur during the OJ phase?
In general, it is assumed that the OJ phase corresponds to one charge separation and a reduction of only QA (Strasser et al. 2004, Lazár 2006). This is based on its photochemical nature and the similarity of the OJ phases with and without DCMU (Strasser and Strasser 1995). However, 2 ms may seem too long for a single charge separation. Schreiber and Neubauer (1990) showed that at 12000 µmol photons m-2s-1 light intensity, the antenna of each PSII is hit once every 50 µs, which means that at 3000 µmol photons m-2 s-1 the antenna is hit once every ~200 µs. The re-oxidation of QA- takes 200-600 µs (Petrouleas and Crofts 2005) and therefore, 2 ms should be enough for 2 or 3 charge separations, at least in the case of the quickly closing α-centers (see previous section).
In heat-treated leaves, the J step disappears and the K step can be observed instead with a maximum at ~400 µs. The kinetics of the OJ and OK phases overlap during the first ~100 µs (Fig. VIII-1A). If the OEC is completely inactivated, only one charge separation can take place (Velthuys and Amesz 1974) in the ms-time range (alternative electron donors can donate electrons to PSII, but is a rather slow process, see Chapter VIII). Fluorescence decreases after the K step and some evidence was obtained showing that it is due to forward electron transport to QB and not to P680+ accumulation (P680+ is a fluorescence quencher; section VIII.4.d). This suggests that the OK phase equals approximately one charge separation and during the OJ phase the fluorescence rise beyond the K step is sustained by further charge separations compensating forward electron transfer. This idea is supported also by the fact that the light intensity dependence of the K and the J steps are different (Fig. VIII-1B; see section VIII.5.d for more discussion).
The exchange of a PQH2 molecule with an oxidized one at the QB-site is a kinetic bottleneck in the electron transport chain. The transfer of each pair of electrons, including all binding and unbinding reactions of at the acceptor side of PSII, takes ~2 ms (Petrouleas and Crofts 2005), which fits roughly with the J step. According to our hypothesis, the reduction of the acceptor side of PSII occurs during the OJ phase that corresponds to 3 electrons (1 e- on QA and 2 e- on QB; see also section VI.5.d).
However, the experimental data discussed above are in apparent contradiction with the almost overlapping OJ phases in the presence and absence of DCMU (see the previous section).
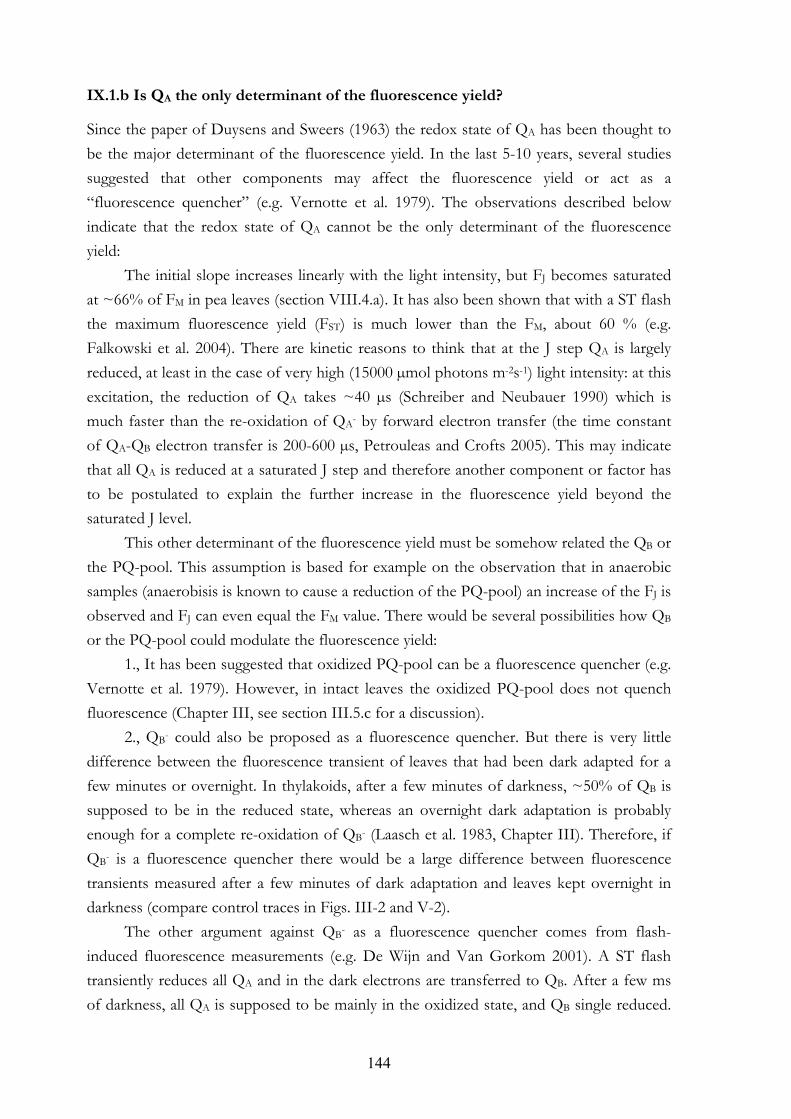
144
IX.1.b Is QA the only determinant of the fluorescence yield?
Since the paper of Duysens and Sweers (1963) the redox state of QA has been thought to be the major determinant of the fluorescence yield. In the last 5-10 years, several studies suggested that other components may affect the fluorescence yield or act as a “fluorescence quencher” (e.g. Vernotte et al. 1979). The observations described below indicate that the redox state of QA cannot be the only determinant of the fluorescence yield:
The initial slope increases linearly with the light intensity, but FJ becomes saturated at ~66% of FM in pea leaves (section VIII.4.a). It has also been shown that with a ST flash the maximum fluorescence yield (FST) is much lower than the FM, about 60 % (e.g. Falkowski et al. 2004). There are kinetic reasons to think that at the J step QA is largely reduced, at least in the case of very high (15000 µmol photons m-2s-1) light intensity: at this excitation, the reduction of QA takes ~40 µs (Schreiber and Neubauer 1990) which is much faster than the re-oxidation of QA- by forward electron transfer (the time constant of QA-QB electron transfer is 200-600 µs, Petrouleas and Crofts 2005). This may indicate that all QA is reduced at a saturated J step and therefore another component or factor has to be postulated to explain the further increase in the fluorescence yield beyond the saturated J level.
This other determinant of the fluorescence yield must be somehow related the QB or the PQ-pool. This assumption is based for example on the observation that in anaerobic samples (anaerobisis is known to cause a reduction of the PQ-pool) an increase of the FJ is observed and FJ can even equal the FM value. There would be several possibilities how QB or the PQ-pool could modulate the fluorescence yield:
1., It has been suggested that oxidized PQ-pool can be a fluorescence quencher (e.g. Vernotte et al. 1979). However, in intact leaves the oxidized PQ-pool does not quench fluorescence (Chapter III, see section III.5.c for a discussion).
2., QB- could also be proposed as a fluorescence quencher. But there is very little difference between the fluorescence transient of leaves that had been dark adapted for a few minutes or overnight. In thylakoids, after a few minutes of darkness, ~50% of QB is supposed to be in the reduced state, whereas an overnight dark adaptation is probably enough for a complete re-oxidation of QB- (Laasch et al. 1983, Chapter III). Therefore, if QB- is a fluorescence quencher there would be a large difference between fluorescence transients measured after a few minutes of dark adaptation and leaves kept overnight in darkness (compare control traces in Figs. III-2 and V-2).
The other argument against QB- as a fluorescence quencher comes from flash-induced fluorescence measurements (e.g. De Wijn and Van Gorkom 2001). A ST flash transiently reduces all QA and in the dark electrons are transferred to QB. After a few ms of darkness, all QA is supposed to be mainly in the oxidized state, and QB single reduced.
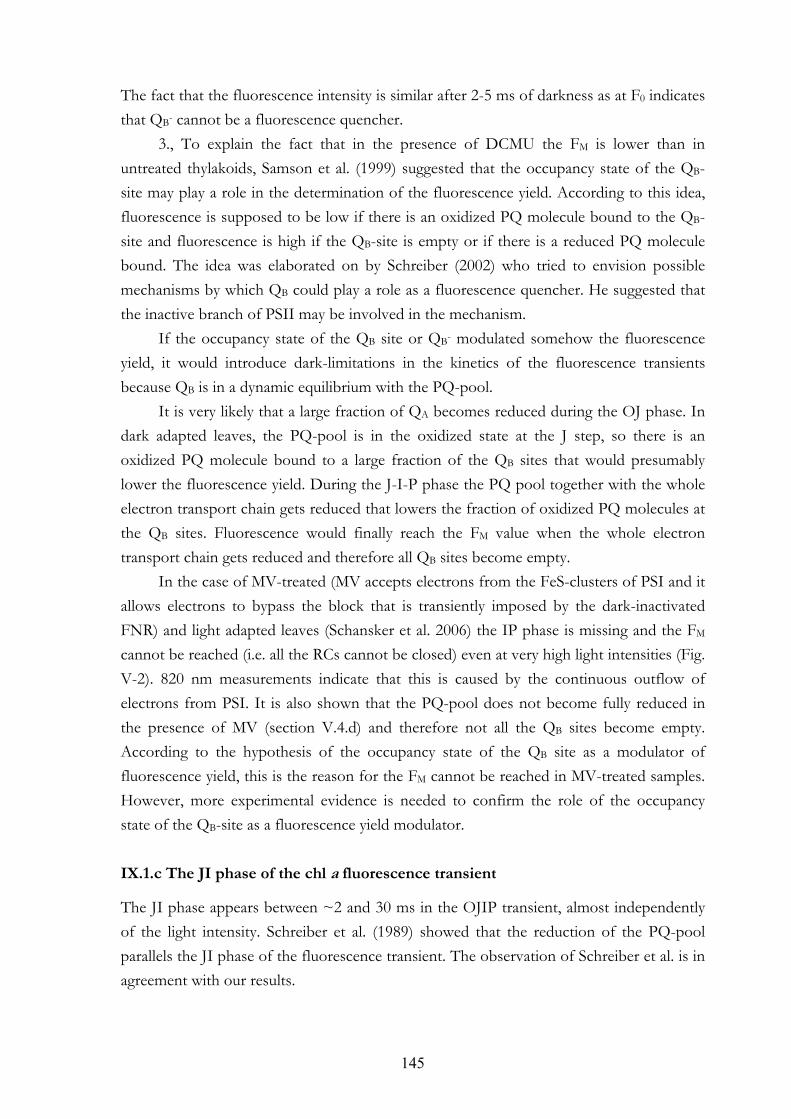
145
The fact that the fluorescence intensity is similar after 2-5 ms of darkness as at F0 indicates that QB- cannot be a fluorescence quencher.
3., To explain the fact that in the presence of DCMU the FM is lower than in untreated thylakoids, Samson et al. (1999) suggested that the occupancy state of the QB-site may play a role in the determination of the fluorescence yield. According to this idea, fluorescence is supposed to be low if there is an oxidized PQ molecule bound to the QB-site and fluorescence is high if the QB-site is empty or if there is a reduced PQ molecule bound. The idea was elaborated on by Schreiber (2002) who tried to envision possible mechanisms by which QB could play a role as a fluorescence quencher. He suggested that the inactive branch of PSII may be involved in the mechanism.
If the occupancy state of the QB site or QB- modulated somehow the fluorescence yield, it would introduce dark-limitations in the kinetics of the fluorescence transients because QB is in a dynamic equilibrium with the PQ-pool.
It is very likely that a large fraction of QA becomes reduced during the OJ phase. In dark adapted leaves, the PQ-pool is in the oxidized state at the J step, so there is an oxidized PQ molecule bound to a large fraction of the QB sites that would presumably lower the fluorescence yield. During the J-I-P phase the PQ pool together with the whole electron transport chain gets reduced that lowers the fraction of oxidized PQ molecules at the QB sites. Fluorescence would finally reach the FM value when the whole electron transport chain gets reduced and therefore all QB sites become empty.
In the case of MV-treated (MV accepts electrons from the FeS-clusters of PSI and it allows electrons to bypass the block that is transiently imposed by the dark-inactivated FNR) and light adapted leaves (Schansker et al. 2006) the IP phase is missing and the FM cannot be reached (i.e. all the RCs cannot be closed) even at very high light intensities (Fig. V-2). 820 nm measurements indicate that this is caused by the continuous outflow of electrons from PSI. It is also shown that the PQ-pool does not become fully reduced in the presence of MV (section V.4.d) and therefore not all the QB sites become empty. According to the hypothesis of the occupancy state of the QB site as a modulator of fluorescence yield, this is the reason for the FM cannot be reached in MV-treated samples. However, more experimental evidence is needed to confirm the role of the occupancy state of the QB-site as a fluorescence yield modulator. IX.1.c The JI phase of the chl a fluorescence transient
The JI phase appears between ~2 and 30 ms in the OJIP transient, almost independently of the light intensity. Schreiber et al. (1989) showed that the reduction of the PQ-pool parallels the JI phase of the fluorescence transient. The observation of Schreiber et al. is in agreement with our results.
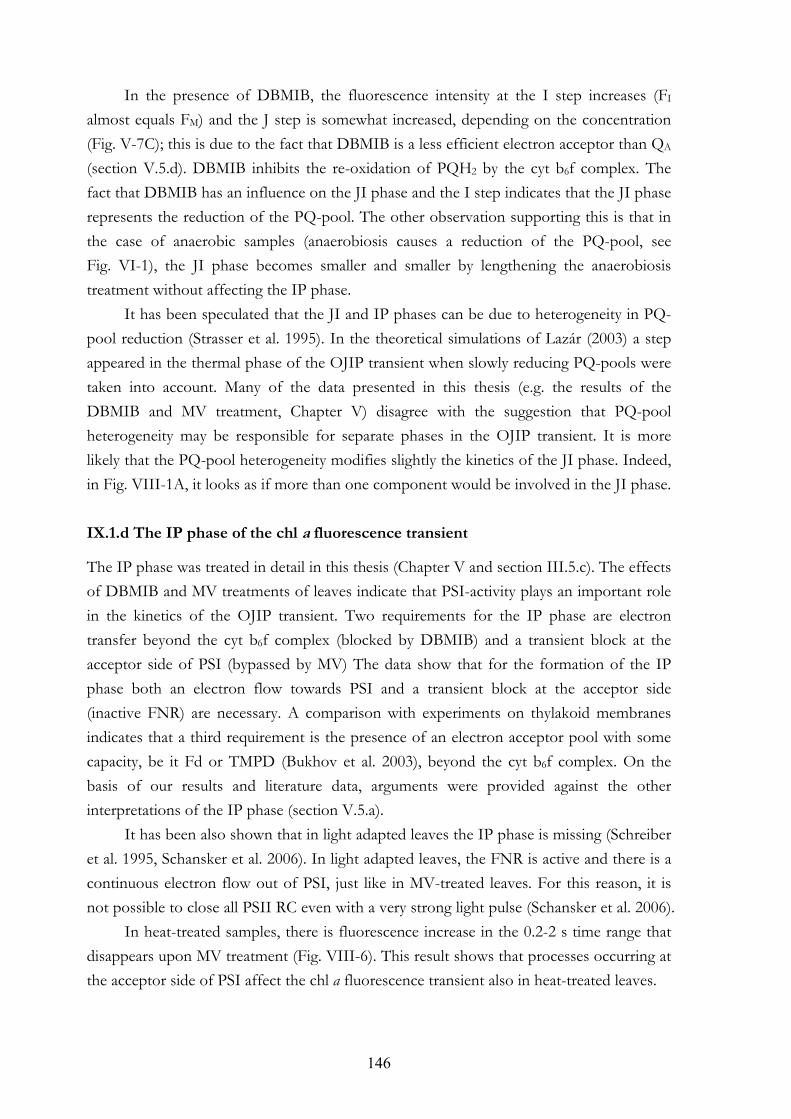
146
In the presence of DBMIB, the fluorescence intensity at the I step increases (FI almost equals FM) and the J step is somewhat increased, depending on the concentration (Fig. V-7C); this is due to the fact that DBMIB is a less efficient electron acceptor than QA (section V.5.d). DBMIB inhibits the re-oxidation of PQH2 by the cyt b6f complex. The fact that DBMIB has an influence on the JI phase and the I step indicates that the JI phase represents the reduction of the PQ-pool. The other observation supporting this is that in the case of anaerobic samples (anaerobiosis causes a reduction of the PQ-pool, see Fig. VI-1), the JI phase becomes smaller and smaller by lengthening the anaerobiosis treatment without affecting the IP phase.
It has been speculated that the JI and IP phases can be due to heterogeneity in PQ-pool reduction (Strasser et al. 1995). In the theoretical simulations of Lazár (2003) a step appeared in the thermal phase of the OJIP transient when slowly reducing PQ-pools were taken into account. Many of the data presented in this thesis (e.g. the results of the DBMIB and MV treatment, Chapter V) disagree with the suggestion that PQ-pool heterogeneity may be responsible for separate phases in the OJIP transient. It is more likely that the PQ-pool heterogeneity modifies slightly the kinetics of the JI phase. Indeed, in Fig. VIII-1A, it looks as if more than one component would be involved in the JI phase.
IX.1.d The IP phase of the chl a fluorescence transient
The IP phase was treated in detail in this thesis (Chapter V and section III.5.c). The effects of DBMIB and MV treatments of leaves indicate that PSI-activity plays an important role in the kinetics of the OJIP transient. Two requirements for the IP phase are electron transfer beyond the cyt b6f complex (blocked by DBMIB) and a transient block at the acceptor side of PSI (bypassed by MV) The data show that for the formation of the IP phase both an electron flow towards PSI and a transient block at the acceptor side (inactive FNR) are necessary. A comparison with experiments on thylakoid membranes indicates that a third requirement is the presence of an electron acceptor pool with some capacity, be it Fd or TMPD (Bukhov et al. 2003), beyond the cyt b6f complex. On the basis of our results and literature data, arguments were provided against the other interpretations of the IP phase (section V.5.a).
It has been also shown that in light adapted leaves the IP phase is missing (Schreiber et al. 1995, Schansker et al. 2006). In light adapted leaves, the FNR is active and there is a continuous electron flow out of PSI, just like in MV-treated leaves. For this reason, it is not possible to close all PSII RC even with a very strong light pulse (Schansker et al. 2006).
In heat-treated samples, there is fluorescence increase in the 0.2-2 s time range that disappears upon MV treatment (Fig. VIII-6). This result shows that processes occurring at the acceptor side of PSI affect the chl a fluorescence transient also in heat-treated leaves.
147
IX.1.e The effect of light gradient and leaf anatomy on the OJIP transient
The measured fluorescence intensity may be affected by irradiance gradient formed in the photosynthetic samples due to optical effects, such as photon absorption, dispersion, reflectance, transmission and focusing (Vogelmann 1993). It has been shown that the fluorescence from the spongy mesophyll contribute much less to the total fluorescence signal than the palisade mesophyll if the leaf is illuminated from the adaxial (top) side (Vogelmann and Evans 2002).
Chl a fluorescence may be influenced by the following factors related to leaf anatomy: 1., the geometry of the palisade and the spongy mesophyll is different that may result in e.g. different light scattering 2., the chlorophyll content may vary in the leaf sections that may lead to different saturation properties of the OJIP transient (e.g. Sušila et al. 2004) 3., physiological differences resulting from the fact that the two types of mesophylls are adapted to different light intensities.
Hsu and Leu (2003) considered that light gradient within a leaf and leaf anatomy may have fundamental effects on the OJIP transient. They suggested that the JI phase may reflect the initial (OJ) phase of the fluorescence transient coming from the abaxial layer of the leaf. However, by decreasing the measuring light intensity from 3000 to 300 µmol m-2s-
1, the maximum of the J step shifts from 2 ms to ~3 ms (e.g. Fig. III-1B) but not to 30 ms, where the I step is situated. It can also be noted that the positions of the J and I steps are constant; it varies very little upon change in the chlorophyll content, thylakoid isolation or from one plant species to the other (Strasser et al. 2004). Besides, the dark adaptation kinetics of the J and the I steps are very different, which clearly indicates that two separate biochemical processes are responsible for them (Fig. V-3). Moreover, in DCMU-treated samples, a single induction phase is observed (e.g. Fig. III-2). If any of the steps in the OJIP transient would arise from an effect of the light gradient or heterogeneity in leaf anatomy, this would not be the case. The area growth kinetics above the fluorescence transient in DCMU-treated samples can be fitted with two or three exponentials. Also in this case it is unlikely that the light gradient or leaf anatomy would be responsible for it, because similar results are obtained when using isolated thylakoids (Melis and Homann 1975) isolated chloroplasts (Hsu et al. 1989) or leaves (Tóth and Strasser 2005, Chapter IV).
These few examples indicate that the effects of the light gradient or the leaf anatomy on the OJIP transient are not likely to affect the basic interpretation of the OJIP transient. However, minor effects cannot be excluded and they would merit further investigations.
148
IX.2. APPLICATIONS OF THE OJIP TRANSIENT
IX.2.a The FV/FM value
The basic assumption for the use of the FV/FM as the maximum quantum yield of primary photochemistry is that at F0 all RCs are open and at FM all RCs are closed (Kitayima and Butler 1975). It is shown in Fig. VIII-4 that in severely heat-treated leaves not all RC are closed at FM and there is a large discrepancy between the oxygen evolving activity and the FV/FM during recovery from a heat pulse (Figs. VII-2 and VII-3).
In dark adapted leaves FNR is inactive at the acceptor side of PSI. It is shown that if this block is removed there is a continuous electron flow at the acceptor side of PSI (e.g. in MV-treated or light adapted leaves; Chapter V and Schansker et al. 2006) and even a very strong light pulse cannot close all PSII RCs (Fig. V-2). Moreover, it can happen that at F20µs not all RCs are open e.g. in DCMU-treated samples if the dark adaptation is not thorough (Fig. III-5).
Therefore, the FV/FM has to be used with caution as the maximum quantum yield of primary photochemistry. In certain cases it may be necessary to ascertain if all PSII RC are closed at the end of a strong light pulse. This can be done in dark adapted leaves with the type of DCMU treatment that is described at the beginning of section III.3.c. IX.2.b The FJ value as an indicator of the PQ-pool redox state
It has been observed that under anaerobic conditions (that lead to a reduction of the PQ-pool) the FJ value significantly increases and it can be as high as the FM. It was shown earlier (see also Fig. VI-3B) that the dark adaptation kinetics of FJ have a time dependence compatible with the re-oxidation kinetics of the PQ-pool (Strasser et al. 2001, Schansker et al. 2005, section V.4.b). FJ represents the very start of the PQ-pool reduction (Schreiber et al. 1989). The relationship between FJ and the redox state of the PQ-pool depends on the sensitivity of the FJ to the occupancy state of the QB-site (the fraction of QB-sites containing an oxidized PQ-molecule), which is influenced by the PQ-pool redox state (see section VI.5.c for a discussion on this point). In Chapter VI it is shown that the FJ value can be used as an indicator of the redox state of the PQ pool.
With this method, the re-oxidation kinetics of the PQ-pool could be followed after a light pulse in untreated, MV or DBMIB-treated (Figs. V-3 and V-4) samples. In the case of MV-treated samples, it is shown that the PQ-pool does not become fully reduced (section V.4.d) and it re-oxidizes very quickly (Fig. V-4). DBMIB inhibits the re-oxidation of plastoquinol by binding to the cyt b6f complex. It is shown that the re-oxidation of the PQ-pool occurs much faster in the presence of DBMIB as in its absence, probably because it can bypass its own block at the cyt b6f complex and donate electrons directly to
149
PC+. In section VIII.4.h it is suggested on the basis of the FJ value that heat stress does not influence the chlororespiratory pathway in barley leaves. IX.2.c F20µs as an indicator of the redox state of QA at the onset of illumination
The F20µs value of a fluorescence transient measured after a pre-illumination was used in section V.4.b and VIII.4.h as an indicator of the redox state of QA. After a red pre-pulse the whole electron transport chain is reduced and quick re-oxidation of QA- can only occur via recombination with the donor side of PSII. This is in agreement with the observation that F20µs initially recovers much faster than the FJ value (an indicator of the PQ-pool re-oxidation, see section IX.2.b, Figs. V-3 and V-4). However, the re-oxidation of the QA- can only proceed by recombination if the donor side is in the S2 or S3 state. Therefore, the slow phase (τ ~40 s in Fig. V-4A) in the dark adaptation kinetics of the F20µs value may represent the re-oxidation of QA- in RCs that are in the S0 or S1 state. The re-oxidation of these QA- molecules depends on the re-oxidation of the PQ-pool. This is supported by the observation of Bukhov et al. (1992) that the slow phase of the recovery of the initial fluorescence level depends on the redox state of the PQ-pool.
In section VIII.4.e it is shown that in heat-treated leaves the dark adaptation kinetics of F20µs and F2ms (also FK) may occur in parallel and a very good linear correlation (R2
=0.98) was found between them. This observation was a confirmation of a complete inactivation of the OEC in these heat-treated leaves (the recombination reaction between QA- and TyrZ+ is blocked by a reduction of TyrZ+ by alternative electron donors of PSII; section VIII.4.d).
However, it is shown in Chapter VI that the F20µs value may be affected by PSII antenna connectivity (see sections IV.2 and VI.4.c). This means that at low F20µs values the QA- concentration may be somewhat underestimated. This effect was not quantified in this thesis. However, it is shown that the FJ value is not affected by connectivity (section VI.5.g) and the linear relationship between F20µs and FJ in the case of a completely inactivated OEC indicates that the effect of connectivity on the dark-adaptation kinetics of F20µs is probably minor. IX.2.d Technical novelties in measuring fluorescence: short light pulses and very
high light intensities
In Chapter VIII 5-ms light pulses spaced 2.3-500 ms apart were used to detect and characterize alternative electron donors of PSII. In this case, the standard (3000 µmol photons m-2s-1) light intensity was used.
For studying the effect of the donor side on the chl a fluorescence transient in untreated leaves, it may be useful to apply short (at the moment the shortest available light pulse of a Handy-PEA instrument is 300 µs) and very strong (15000 µmol photons m-2s-1)
150
light pulses. Preliminary experiments showed that no period-four oscillations could be observed in the case of 2-ms light pulses. If only QA was reduced at the J step then giving 2-ms light pulses spaced 100 ms apart should result in some period-four oscillations. Its absence further confirms that it is unlikely that only one charge separation occurs during the OJ phase (see section IX.1.a). IX.2.e 820 nm transmission measurements
Chl a fluorescence originates essentially from the antenna of PSII and 820 nm transmission changes indicate redox changes of PC, P700 and Fd. Numerous results presented in this thesis show that the two signals are correlated from 20 ms of illumination onwards. It was possible to show that processes occurring at the acceptor side of PSI have an important influence on the OJIP transient (Chapter V). However, there is very little effect of PSII activity on the 820 nm transmission kinetics in the 0-20 ms time range: the 820 nm transmission kinetics in the first 20 ms are nearly identical in the case of heat-treated, DCMU-treated and untreated samples (Fig.VIII-4). Therefore, it seems that up to 20 ms PSI and PSII work independently and 820 nm transmission cannot provide information about the OJIP transient in this time range.
Another limitation in the use of 820 nm transmission as a complementary technique is that several components can be found between PSII and PSI and all the electron transfer steps have different time constants. Therefore, minor redox changes of PC and P700 can be buffered and they are not likely to show up in the OJIP transient (Schansker et al. 2006).
Chl a fluorescence may be influenced by electron transport processes but also by yield changes, due to several fluorescence quenching processes occurring essentially in the light adapted state. A very important advantage of measuring simultaneously chl a fluorescence and 820 nm transmission is that the effects of electron transport processes and fluorescence yield changes can be separated. For example, in one of our papers (Schansker et al. 2006) it is shown that the qT phase of the relaxation of “nonphotochemical quenching” is not caused by a change in the fluorescence yield, but the dark-inactivation of FNR is responsible for this phenomenon.
151
ACKNOWLEDGEMENTS
I am grateful to Prof Dr Reto J Strasser, Director of the Laboratory of Bioenergetics and Microbiology for allowing me to prepare my thesis in his laboratory and for all his support.
I thank Dr Gert Schansker who helped me greatly during the preparation of my thesis.
I thank Dr Győző Garab for giving me the opportunity to carry out several measurements in the Biological Research Center, in Szeged, Hungary.
I also thank Prof Dr Govindjee, Prof Dr Wim Vredenberg, Dr Merope Tsimilli-Michael and Dr Tibor Janda for the fruitful discussions and encouragement.
I thank the Hansatech Instruments Ltd for their technical help and especially for the construction of the fast Handy-PEA instrument and the high intensity measuring head.
Je remercie tous les membres du Laboratoire de Bioénergétique et Microbiologie,
particulièrement Madeleine Fontana, Malou Chappuis, Marie-France Blanc et Ariane Fehr pour l’aide qu’ils m’ont apporté tout au long de ma thèse. Je remercie également Dr Catherine Calantzis et Abdallah Oukarroum. This thesis was partially subsidized by OFES C990075 and Cost Action 8.38. The following funds supported me in participating in scientific congresses: the Mark Birkigt Foundation (Switzerland), the Gatsby Charitable Foundation (UK) and the Ernst and Lucie Schmidheiny Foundation (Switzerland).

152
153
REFERENCES Abrahams JP, Leslie AG, Lutter R, Walker JE (1994) Structure at 2.8 Å resolution of F1-
ATPase from bovine heart mitochondria. Nature 370: 621-628 Allen JF (1992) Protein phosphorylation in regulation of photosynthesis. Biochim Biophys
Acta 1098: 275-335 Allen JF (1993) Redox control of gene expression and the function of chloroplast
genomes - a hypothesis. Photosynth Res 36: 95-102 Allen JF (2004) Cytochrome b6f: structure for signaling and vectorial metabolism. Trends
Plant Sci 9: 130-137 Amesz J, Fork DC (1967) Quenching of chlorophyll fluorescence by quinones in algae and
chloroplasts. Biochim Biophys Acta 143: 97-107 Andersson B, Anderson JM (1980) Lateral heterogeneity in the distribution of chlorophyll-
protein complexes of the thylakoid membranes of spinach chloroplasts. Biochim Biophys Acta 593: 427-440
Andersson B, Aro E-M (2001) Photodamage and D1 protein turnover in photosystem II. In: Aro E-M, Andersson B (eds) Regulation of Photosynthesis, pp 377-393. Kluwer Academic Publishers, Dordrecht
Aro E-M, Virgin I, Andersson B (1993) Photoinhibition of photosystem II. Inactivation, protein damage and turnover. Biochim Biophys Acta 1143: 113-134
Asada K, Heber U, Schreiber U (1992) Pool size of electrons that can be donated to P700+, as determined in intact leaves: donation to P700+ from stromal components via the intersystem chain. Plant Cell Physiol 33: 927-932
Asada K, Heber U, Schreiber U (1993) Electron flow to the intersystem chain from stromal components and cyclic electron flow in maize chloroplasts, as detected in intact leaves by monitoring redox change of P700 and chlorophyll fluorescence. Plant Cell Physiol 34: 39-50
Avenson TJ, Cruz JA, Kanazawa A, Kramer DM (2005) Regulating the proton budget of higher plant photosynthesis. Proc Natl Acad Sci USA 102: 9709–9713
Baker NR, Oxborough K (2004) Photosynthetic productivity. In: Papageorgiou GC, Govindjee (eds) Chlorophyll a Fluorescence: A Signature of Photosynthesis, Advances in Photosynthesis and Respiration, Vol 19, pp 65-82. Springer, Dordrecht
Balachandran S, Osmond CB, Daley PF (1994) Diagnosis of the earliest strain-specific interactions between tobacco mosaic virus and chloroplasts of tobacco leaves in vivo by means of chlorophyll fluorescence imaging. Plant Physiol 104: 1059-1065
Bendall DS, Manasse RS (1995) Cyclic photophosphorylation and electron transport. Biochim Biophys Acta 1229: 23-38
Bennett J (1991) Protein Phosphorylation in green plant chloroplasts. Annu Rev Plant Physiol Plant Mol Biol 42: 281-311
Bennoun P, Li YS (1973) New results on the mode of action of 3-(3’,4’-dichlorophenyl)-1,1-dimethylurea in spinach chloroplasts. Biochim Biophys Acta 292: 162-168Bennoun P (1982) Evidence for a respiratory chain in the chloroplast. Proc Natl Acad Sci USA 79: 4352-4356
Bennoun P (2001) Chlororespiration and the process of carotenoid biosynthesis. Biochim Biophys Acta 1506: 133-142
Ben-Shem A, Frolow F, Nelson N (2003) Crystal structure of plant photosystem I. Nature 626:630-635
154
Berens SJ, Butler WL, Magde D, Scheele J (1985) Time-resolved fluorescence studies of spinach chloroplasts - evidence for the heterogeneous bipartite model. Photochem Photobiol 42: 51-57
Biesiadka J, Loll B, Kern J, Irrgang K-D, Zouni A (2004) Crystal structure of cyanobacterial photosystem II at 3.2 Å resolution: a closer look at the Mn-cluster. Phys Chem Chem Phys 6: 4733-4736
Blubaugh DJ, Atamian M, Babcock GT, Golbeck JH, Cheniae GM (1991) Photoinhibition of hydroxylamine-extracted photosystem II membranes: Identification of the sites of photodamage. Biochemistry 30: 7586-7597
Böhme H, Reimer S, Trebst A (1971) The effect of dibromothymoquinone, an antagonist of plastoquinone, on non cyclic and cyclic electron flow systems in isolated chloroplasts. Z Naturforsch 26b: 341-352
Bouges-Bocquet B (1975) Electron acceptors of photosystem II. In: Avron M (ed) Proceedings of the Third International Congress on Photosynthesis, Vol I, pp 579-588. Elsevier Scientific Publishing Company, Amsterdam
Bowes JM, Crofts AR (1981) Effect of 2,5-dibromo-3-methyl-6-isopropyl-p-benzoquinone on the secondary electron acceptor B of photosystem II. Arch Biochem Biophys 209: 682-686
Bradbury M, Baker NR (1981) Analysis of the slow phases of the in vivo chlorophyll fluorescence induction curve; Changes in the redox state of photosystem II emission from photosystem I and II. Biochim Biophys Acta 635: 542-551
Bratt CE, Arvidsson P-E, Carlsson A, Åkerlund H-E (1995) Regulation of violaxanthin de-epoxidase activity by pH and ascorbate concentration. Photosynth Res 45: 169-175
Braun G, Driesenaar ARJ, Shalgi E, Malkin S (1992) Manipulation of the imbalance for linear electron flow activities between photosystems I and II of photosynthesis by cyclic electron flow cofactors. Biochim Biophys Acta 1099: 57-66
Britt RD, Campbell KA, Peloquin JM, Gilchrist ML, Aznar CP, Dicus MM, Robblee J, Messinger J (2004) Recent pulsed EPR studies of the Photosystem II oxygen-evolving complex: implications as to water oxidation mechanisms. Biochim Biophys Acta 1655: 158-171
Bruce D, Vasil’ev S (2004) Excess light stress: Multiple dissipative processes of excess excitation. In: Papageorgiou GC, Govindjee (eds) Chlorophyll a Fluorescence: A Signature of Photosynthesis, Advances in Photosynthesis and Respiration, Vol 19, pp 279-319. Springer, Dordrecht
Büchel C, Garab G (1995) Electrochromic absorbance changes in the chlorophyll-c-containing alga Pleurochloris meiringensis (Xanthophyceae). Photosynth Res 43: 49-56
Bukhov NG, Mohanty P, Rakhimberdieva MG, Karapetyan NV (1992) Analysis of dark-relaxation kinetics of variable fluorescence in intact leaves. Planta 187: 122-127
Bukhov NG, Wiese C, Neimanis S, Heber U (1999) Heat sensitivity of chloroplasts and leaves: Leakage of protons from thylakoids and reversible activation of cyclic electron transport. Photosynth Res 59: 81-93
Bukhov NG, Govindachary S, Egorova EA, Joly D, Carpentier R (2003a) N,N,N’,N’-tetramethyl-p-phenylenediamine initiates the appearance of a well-resolved I peak in the kinetics of chlorophyll fluorescence rise in isolated thylakoids. Biochim Biophys Acta 1607: 91-96
Bukhov NG, Govindachary S, Egorova EA, Carpentier R (2003b) Interaction of exogenous quinones with membranes of higher plant chloroplasts: modulation of quinone capacities as photochemical and non-photochemical quenchers of energy in Photosystem II during light-dark transitions. Biochim Biophys Acta 1604: 115-123
155
Bukhov NG, Carpentier R (2004) Alternative Photosystem-I-driven electron transport routes: mechanisms and functions. Photosynth Res 82: 17-33
Bulychev AA, Vredenberg WJ (2001) Modulation of photosystem II chlorophyll fluorescence by electrogenic events generated by photosystem I. Biolelectrochemistry 54: 157-168
Carol P, Kuntz M (2001) A plastid terminal oxidase comes to light: implications for carotenoid biosynthesis and chlororespiration. Trends Plant Sci 6: 31-36
Carrell TG, Tyryskin AM, Dismukes GC (2002) An evaluation of structural models for the photosynthetic water-oxidizing complex derived from spectroscopic and X-ray diffraction signatures. J Biol Inorg Chem 7: 2-22
Carrillo N, Vallejos RH (1987) Ferredoxin-NADP+ oxidoreductase. In: Barber J (ed) The Light Reactions, pp 527-560. Elsevier, Amsterdam
Chaerle L, Van Der Straeten D (2000) Imaging techniques and the early detection of plant stress. Trends Plant Sci 5: 495-501
Chain RK, Malkin R (1979) On the interaction of 2,5-dibromo-3-methyl-6-isopropylbenzoquinone (DBMIB) with bound electron carriers in spinach chloroplasts. Arch Biochem Biophys 197: 52-56
Chance B, Maehly AC (1955) Assay of catalases and peroxidases. Methods Enzymol 2: 764-817
Cheniae GM, Martin IF (1971) Photoactivation of the manganese catalyst of O2 evolution I. Biochemical and kinetic aspects. Biochim Biophys Acta 253: 167-181
Cinque G, Croce R, Holzwarth A, Bassi R (2000) Energy transfer among CP29 chlorophylls: calculated Förster rates and experimental transient absorption at room temperature. Biophys J 79: 1706–1717
Clegg RM (2004) Nuts and bolts of excitation energy migration and energy transfer. In: Papageorgiou GC, Govindjee (eds) Chlorophyll a Fluorescence: A Signature of Photosynthesis, Advances in Photosynthesis and Respiration, Vol 19, pp 83-105. Springer, Dordrecht
Cohen RO, Shen GZ, Golbeck JH, Xu W, Chitnis PR, Valieva AI, Van der Est AJ, Pushkar Y, Stehlik D (2004) Evidence for asymmetric electron transfer in cyanobacterial photosystem I: Analysis of a methionine-to-leucine mutation of the ligand to the primary electron acceptor A(0). Biochemistry 43: 4741-4754
Cornic G, Bukhov NG, Wiese C, Bligny R, Heber U (2000) Flexible coupling between light-dependent electron and vectorial proton transport in illuminated leaves of C3 plants; Role of photosystem I-dependent proton pumping. Planta 210: 468-477
Cournac L, Redding K, Ravenel J, Rumeau D, Josse E-M, Kuntz M, Peltier G (2000) Electron flow between photosystem II and oxygen in chloroplasts of photosystem I-deficient algae is mediated by a quinol oxidase involved in chlororespiration. J Biol Chem 275: 17256-17262
Crafts-Brandner SJ, Law RD (2000) Effect of heat stress on the inhibition and recovery of the ribulose-1,5-biphosphate carboxylase-oxygenase activation state. Planta 212: 67-74
Crofts AR, Wraight CA (1983) The electrochemical domain of photosynthesis. Biochim Biophys Acta 726: 149-185
Crofts AR, Robinson HH, Snozzi M (1984) Reactions of quinones at catalytic sites; a diffusional role in H-transfer. In: Sybesma C (ed), Advances in Photosynthesis Research, Vol I, pp. 461-468. Martinus Nijhoff/Dr W Junk Publishers, The Hague
Crofts AR, Baroli I, Kramer DM, Taoka S (1992) Kinetics of electron transfer between QA and QB in wild-type and herbicide-resistant mutants of Chlamydomonas reinhardtii. Z Naturforsch 48c: 259-266
156
Crofts AR (2004) The cytochrome bc1 complex: function in the context of structure. Annu Rev Physiol 66: 689–733
De Las Rivas J, Barber J (1997) Structure and thermal stability of photosystem II reaction centers studied by infrared spectroscopy. Biochemistry 36: 8897-8903
Dekker JP, Van Gorkom HJ, Brok M, Ouwehand L (1984) Optical characterization of photosystem II electron donors. Biochim Biophys Acta 764: 301-309
Dekker JP, Germano M, Van Roon H, Boekema EJ (2002) Photosystem II solubilizes as a monomer by mild detergent treatment of unstacked thylakoid membranes. Photosynth Res 72: 203-210
Dekker JP, Boekema EJ (2005) Supramolecular organization of thylakoid membrane proteins in green plants. Biochim Biophys Acta 1706: 12-39
Delosme R (1967) Etude de l’induction de fluorescence des algues vertes et des chloroplastes au début d’une illumination intense. Biochim Biophys Acta 143: 108-128
Demeter S, Rózsa Z, Vass I, Hideg É (1985) Thermoluminescence study of charge recombination in Photosystem II at low temperatures. II. Oscillatory properties of the Zv and A thermoluminescence bands in chloroplasts dark adapted for various time periods. Biochim Biophys Acta 809: 379-387
Demmig B, Winter K (1988) Characterisation of three components of nonphotochemical fluorescence quenching and their response to photoinhibition, Aust J Plant Physiol 15: 163-177
Deprez JA, Dobek NE, Geacintov G, Paillotin G, Breton J (1983) Probing fluorescence induction in chloroplasts on a nanosecond time scale utilizing picosecond laser pulse pairs. Biochim Biophys Acta 725: 444-454
De Wijn R, Van Gorkom HJ (2001) Kinetics of electron transfer from QA to QB in Photosystem II. Biochemistry 40: 11912-11922
Diner B (1977) Dependence of the deactivation reactions of photosystem II on the redox state of plastoquinone pool A varied under anaerobic conditions; Equilibria on the acceptor side of photosystem II. Biochim Biophys Acta 460: 247-258
Diner BA, Petrouleas V, Wendoloski JJ (1991) The iron-quinone electron acceptor complex of photosystem II. Physiol Plant 81: 423-436
Doschek WW, Kok B (1972) Photon trapping in photosystem II of photosynthesis. The fluorescence rise curve in the presence of 3-(3,4-dichlorophenyl)-1,1-dimethylurea. Biophys J 12: 832-838
Du M, Xie X, Jia Y, Mets L, Fleming GR (1993) Direct observation of ultrafast energy transfer in PSI core antenna. Chem Phys Lett 201: 535-542Ducruet J-M, Lemoine Y (1985) Increased heat sensitivity of the photosynthetic apparatus in triazine-resistant biotypes from different plant species. Plant Cell Physiology 26: 419-429
Duysens LNM, Sweers HE (1963) Mechanisms of two photochemical reactions in algae as studied by means of fluorescence. in: Studies on microalgae and photosynthetic bacteria, Special issue of Plant and Cell Physiology, Japanese Society of Plant Physiologists, University of Tokyo Press, Tokyo, Japan, pp 353-372
Enami I, Kitamura M, Tomo T, Isokawa Y, Ohta H, Katoh S (1994) Is the primary cause of thermal inactivation of oxygen evolution in spinach PSII membranes release of the extrinsic 33 kDa protein or of Mn? Biochim Biophys Acta 1186: 52-58
Escoubas J-M, Lomas M, LaRoche J, Falkowski PG (1995) Light intensity regulation of cab gene transcription is signaled by the redox state of the plastoquinone pool. Proc Natl Acad Sci USA 92: 10237-10241
157
Eskling M, Åkerlund H-E (1998) Changes in the quantities of violaxanthin de-epoxidase, xanthophylls and ascorbate in spinach upon shift from low to high light. Photosynth Res 57: 41-50
Fairclough WV, Forsyth A, Evans MCW, Rigby SEJ, Purton S, Heathcote P (2003) Bidirectional electron transfer in photosystem I: Electron transfer on the PsaA side is not essential for phototrophic growth in Chlamydomonas. Biochim Biophys Acta 1606: 43-55
Falkowski PG, Kolber Z, Mauzerall D (1994) A comment on the call to throw away your fluorescence induction apparatus. Biophys J 66: 923-928
Falkowski PG, Koblížek M, Gorbunov M, Kolber Z (2004) Development and application of variable chlorophyll fluorescence techniques in marine ecosystems. In: Papageorgiou GC, Govindjee (eds) Chlorophyll a Fluorescence: A Signature of Photosynthesis, Advances in Photosynthesis and Respiration, Vol 19, pp 757-778. Springer, Dordrecht
Farineau J, Garab G, Horváth G, Faludi-Dániel Á (1980) Proton translocation in the slow rise in the flash-induced 515 nm absorbance change of intact chloroplasts. FEBS Lett 118: 119-122
Farineau J, Bottin H, Garab G (1984) Effect of dibromothymoquinone (DBMIB) on reduction rates of photosystem I donors in intact chloroplasts. Biochem Biophys Res Comm 120: 721-725
Ferreira KN, Iverson TM, Maghlaoui K, Barber J, Iwata S (2004) Architecture of the photosynthetic oxygen-evolving center. Science 303: 1831– 1838
Field TS, Nedbal L, Ort DR (1998) Nonphotochemical reduction of the plastoquinone pool in sunflower leaves originates from chlororespiration. Plant Physiol 116: 1209-1218
Foyer CH, Lelandais M (1996) A comparison of the relative rates of transport of ascorbate and glucose across the thylakoid, chloroplast and plasmalemma membranes of pea leaf mesophyll cells. J Plant Physiol 148: 391-398
Fromme P, Yu H, DeRuyter YS, Jolley C, Chauhan DK, Melkozernov A, Grotjohann I (2006) Structure of photosystems I and II. C R Chimie 9: 188-200
Garab G, Lajkó F, Mustárdy L, Márton L (1989) Respiratory control over photosynthetic electron transport in chloroplasts of higher-plant cells: Evidence for chlororespiration. Planta 179: 349-358
Garab G, Cseh Z, Kovács L, Rajagopal S, Várkonyi Z, Wentworth M, Mustárdy L, Dér A, Ruban AV, Papp E, Holzenburg A, Horton P (2002) Light-induced trimer to monomer transition in the main light-harvesting antenna complex of plants: Thermo-optic mechanism. Biochemistry 41: 15121-15129
Gobets B, Van Grondelle R (2001) Energy transfer and trapping in photosystem I. Biochim Biophys Acta 1507: 80-99
Gounaris K, Brain APR, Quinn PJ, Williams WP (1984) Structural reorganisation of chloroplast thylakoid membranes in response to heat-stress. Biochim Biophys Acta 766: 198-208
Gour RK, Pandey PK, Bisen PS (1997) Differential response in damage and repair of wild-type Anacystis nidulans and its UV-B plus heat shock tolerant (UV-HSt) strain under UV-B and heat shock stress. J Photochem Photobiol B: 40: 61-67
Goussias C, Boussac A, Rutherford AW (2002) Photosystem II and photosynthetic oxidation of water: An overview. Phil Trans R Soc London B 357: 1369-1381
Govindjee (1995) Sixty-three years since Kautsky: Chlorophyll a fluorescence. Aust J Plant Physiol 22: 131-160
158
Groom QJ, Kramer DM, Crofts AR, Ort DR (1993) The non-photochemical reduction of plastoquinone in leaves. Photosynth Res 36: 205-215
Grotjohann I, Jolley C, Fromme P (2004) Evolution of photosynthesis and oxygen evolution: Implications from the structural comparison of Photosystems I and II. Phys Chem Chem Phys 6: 4743-4753
Guissé B, Srivastava A, Strasser RJ (1995) Effect of high temperature and water stress on the polyphasic chlorophyll-a fluorescence transient of potato leaves. In: Mathis P (ed) Photosynthesis: From Light to Biosphere, Vol IV, pp 913-916. Kluwer Academic Publishers, Dordrecht /Boston/London
Haehnel W, Pröpper A, Krause H (1980) Evidence for complexes plastocyanin as the intermediate electron donor of P-700. Biochim Biophys Acta 593: 384-399
Haldimann P, Strasser RJ (1999) Effects of anaerobiosis as probed by the polyphasic chlorophyll a fluorescence rise kinetic in pea (Pisum sativum L.). Photosynth Res 62: 67–83
Haldimann P, Tsimilli-Michael M (2002) Mercury inhibits the non-photochemical reduction of plastoquinone by exogenous NADPH and NADH: evidence from measurements of the polyphasic chlorophyll a fluorescence rise in spinach chloroplasts. Photosynth Res 74: 37-50
Haldimann P, Tsimilli-Michael M (2005) Non-photochemical quenching of chlorophyll a fluorescence by oxidized plastoquinone: new evidences based on modulation of the redox state of the endogenous plastoquinone pool in broken spinach chloroplasts. Biochim Biophys Acta 1706: 239-249
Harbinson J, Woodward FI (1987) The use of light-induced absorbance changes at 820 nm to monitor the oxidation state of P-700 in leaves. Plant Cell Environ 10: 131-140
Harbinson J, Hedley CL (1993) Changes in P-700 oxidation during the early stages of the induction of photosynthesis. Plant Physiol. 103: 649-660
Harris GC, Heber U (1993) Effects of anaerobiosis on chlorophyll fluorescence yield in spinach (Spinacia oleracea) leaf discs. Plant Physiol 101: 1169-1173
Hauska G (1977) Artificial acceptors and donors. In: Encyclopedia of plant physiology new series, vol 5, Springer-Verlag, Berlin, pp 253-265
Havaux M (1989) Comparison of atrazine-resistant and -susceptible biotypes of Senecio vulgaris L.: Effects of high temperatures on the in vivo photosynthetic electron transfer in intact leaves. J Exp Bot 40: 849-854
Havaux M, Strasser RJ, Greppin H (1991) A theoretical and experimental analysis of the qP and qN coefficients of chlorophyll fluorescence quenching and their relation to photochemical and nonphotochemical events. Photosynth Res 27: 41-55
Havaux M (1996) Short-term responses of photosystem I to heat stress. Photosynth Res 47: 85-97
Havaux M, Tardy F, Ravenel J, Chanu D, Parot P (1996) Thylakoid membrane stability to heat stress studied by flash spectroscopic measurements of the electrochromic shift in intact potato leaves: influence of the xanthophyll content. Plant Cell Environ 19: 1359-1368
Havaux M, Rumeau D, Ducruet J-M (2005) Probing the FQR and NDH activities involved in cyclic electron transport around Photosystem I by the ‘afterglow’ luminescence. Biochim Biophys Acta 1709: 203-213
Heber U, Walker D (1992) Concerning a dual function of coupled cyclic electron transport in leaves. Plant Physiol 100: 1621-1626
Heber U (2002) Irrungen, Wirrungen? The Mehler reaction in relation to cyclic electron transport in C3 plants. Photosynth Res 73: 223-231
159
Heckathorn SA, Coleman JS, Hallberg RL (1997) Recovery of net CO2 assimilation after heat stress is correlated with recovery of oxygen-evolving complex proteins in Zea mays L. Photosynthetica 34: 13-20
Holzwarth AR, Müller MG, Niklas J, Lubitz W (2006) Ultrafast transient absorption studies on photosystem I reaction centers from Chlamydomonas reinhardtii. 2. Mutations near the P700 reaction center chlorophylls provide new insight into the nature of the primary electron donor. Biophys J 90: 552-565
Hope AB (2000) Electron transfers amongst cytochrome f, plastocyanin and photosystem I: kinetics and mechanisms. Biochim Biophys Acta 1456: 5-26
Horton P, Hague A (1988) Studies on the induction of chlorophyll fluorescence in isolated barley protoplasts; IV. Resolution of non-photochemical quenching. Biochim Biophys Acta 932: 107-115
Horváth G, Niemi HA, Droppa M, Faludi-Dániel Á (1979) Characteristics of the flash-induced 515 nm change of intact isolated chloroplasts. Plant Physiol 63: 778-782
Horváth G (1986) Usefulness in thermoluminescence in herbicide research. CRC Critical Rev Plant Sci 4: 293-310
Hsu B-D, Lee YS, Jang YR (1989) A method for analysis of fluorescence induction curve from DCMU-poisoned chloroplasts. Biochim Biophys Acta 975: 44-49
Hsu B-D, Lee J-Y (1995) Fluorescence quenching by plastoquinone in an oxygen-evolving photosystem-II-enriched preparation. J Photochem Photobiol 30: 57-61
Hsu B-D, Leu K-L (2003) A possible origin of the middle phase of polyphasic chlorophyll fluorescent transient. Funct Plant Biol 30: 571-576
Huppert D, Rentzepis PM, Tollin G (1976) Picosecond kinetics of chlorophyll and chlorophyll/quinone solutions in ethanol. Biochim Biophys Acta 440: 356-364
Ioannidis N, Schansker G, Barynin VV, Petrouleas V (2000) Interaction of nitric oxide with the oxygen evolving complex of photosystem II and manganese catalase: a comparative study. J Biol Inorg Chem 5: 354-363
Jansson S (1994) The light-harvesting chlorophyll a/b-binding proteins. Biochim Biophys Acta 1184: 1-19
Joët T, Cournac L, Peltier G, Havaux M (2002a) Cyclic electron flow around photosystem I in C3 plants. In vivo control by the redox state of chloroplasts and involvement of the NADH-dehydrogenase complex. Plant Physiol 128: 760-769
Joët T, Genty B, Josse E-M, Kuntz M, Cournac L, Peltier G (2002b) Involvement of a plastid terminal oxidase in plastoquinone oxidation as evidenced by expression of the Arabidopsis thaliana enzyme in tobacco. J Biol Chem 277: 31623-31630
Joliot A, Joliot P (1964) Etude cinétique de la réaction photochimique libérant l’oxygène au cours de la photosynthèse. C R Acad Sc Paris 258: 4622-4625
Joliot P, Bennoun P, Joliot A (1973) New evidence supporting energy transfer between photosynthetic units. Biochim Biophys Acta 305: 317-328
Joliot P, Joliot A (1979) Comparative study of the fluorescence yield and of the C550 absorption change at room temperature. Biochim Biophys Acta 546: 93-105
Joliot P, Lavergne J, Béal D (1992) Plastoquinone compartmentation in chloroplasts; I. Evidence for domains with different rates of photo-reduction. Biochim Biophys Acta 1101: 1-12
Joliot P, Joliot A (2002) Cyclic electron transport in plant leaf. Proc Natl Acad Sci USA 99: 10209-10214
Joliot P, Béal D, Joliot A (2004) Cyclic electron flow under saturating excitation of dark-adapted Arabidopsis leaves. Biochim Biophys Acta 1656: 166-176
Jordan P, Fromme P, Witt HT, Klukas O, Saenger W, Krauss N (2001) Three-dimensional structure of cyanobacterial Photosystem I at 2.5 Å resolution. Nature 411: 909-917
160
Junge W (1977) Membrane potentials in photosynthesis. Annu Rev Plant Physiol 28: 503-536
Kamiya N, Shen RJ (2003) Crystal structure of oxygen-evolving photosystem II from Thermosynecococcus vulcanus at 3.7 Å resolution. Proc Natl Acad Sci USA 100: 98-103
Kautsky H, Appel W, Amann H (1960) Chlorophyll fluorescenzkurve und Kohlensäureassimilation; XIII. Die fluorescenzkurve und die Photochemie der Pflanze. Biochem Z 332: 277-292
Kennis JTM, Gobets B, Van Stokkum IHM, Dekker JP, Van Grondelle R, Fleming GR (2001) Light harvesting by chlorophylls and carotenoids in the Photosystem I complex of Synechococcus elongatus: A fluorescence upconversion study. J Phys Chem B: 105: 4485-4494
Kirchoff H, Horstmann S, Weis E (2000) Control of the photosynthetic electron transport by PQ diffusion microdomains in thylakoids of higher plants. Biochim Biophys Acta 1459: 148-168
Kitajima M, Butler WL (1975) Quenching of chlorophyll fluorescence and primary photochemistry in chloroplasts by dibromothymoquinone. Biochim Biophys Acta 376: 105-115
Klughammer C, Schreiber U (1991) Analysis of light-induced absorbance changes in the near-infrared spectral region. I. Characterization of various components in isolated chloroplasts. Z Naturforsch 46c: 233-244
Koike H, Siderer Y, Ono T, Inoue Y (1986) Assignment of thermoluminescence A band to S3QA- charge recombination: Sequential stabilization of S3 and QA- by a two-step illumination at different temperatures. Biochim Biophys Acta 850: 80-89
Koblížek, M, Kaftan D, Nedbal L (2001) On the relationship between the non-photochemical quenching of the chlorophyll fluorescence and the photosystem II light harvesting efficiency. A repetitive flash fluorescence induction study. Photosynth Res 68: 141–152
Kolber ZS, Prášil O, Falkowski PG (1998) Measurements of variable chlorophyll fluorescence using fast repetition rate techniques: Defining methodology and experimental protocols. Biochim Biophys Acta 1367: 88-106
Kóta Z, Horváth L, Droppa M, Horváth G, Farkas T, Páli T (2002) Protein assembly and heat stability in developing thylakoid membranes during greening. Proc Natl Acad Sci USA 99: 12149-12154
Kramer DM, Robinson HR, Crofts AR (1990) A portable multi-flash kinetic fluorimeter for measurement of donor and acceptor reactions of Photosystem 2 in leaves of intact plants under field conditions. Photosynth Res 26: 181-193
Kramer DM, DiMarco G, Loreto F (1995) Contribution of plastoquinone quenching to saturation pulse-induced rise of chlorophyll fluorescence in leaves. In: Mathis P (ed) Photosynthesis: from Light to Biosphere, Vol I, pp 147-150. Kluwer Academic Publishers, Dordrecht/ Boston/London
Kramer DM, Sacksteder CA, Cruz JA (1999) How acid is the lumen? Photosynth Res 60: 151-163
Kramer DM, Johnson G, Kiirats O, Edwards GE (2004) New fluorescence parameters for the determination of QA redox state and excitation energy fluxes. Photosynth Res 79: 209-218
Krause GH, Vernotte C, Briantais J-M (1982) Photoinduced quenching of chlorophyll fluorescence in intact chloroplasts and algae. Biochim Biophys Acta 679: 116-124
Krause GH, Jahns P (2004) Non-photochemical energy dissipation determined by chlorophyll fluorescence quenching: characterization and function. In: Papageorgiou GC, Govindjee (eds) Chlorophyll a Fluorescence: A Signature of Photosynthesis,
161
Advances in Photosynthesis and Respiration, Vol 19, pp 463-495. Springer, Dordrecht
Kruk J, Karpinski S (2005) Redox state analysis of the plastoquinone-pool in Arabidopsis thaliana reveals unexpected changes under different light conditions. In: Van Est A, Bruce D (eds) Photosynthesis: Fundamental Aspects to Global Perspectives, pp. 568-570. Allen Press Inc, Lawrence
Kurisu G, Zhang H, Smith JL, Cramer WA (2003) Structure of the cytochrome b6f complex of oxygenic photosynthesis: tuning the cavity. Science 302: 1009-1014
Kurreck J, Schödel R, Renger G (2000) Investigation of the plastoquinone pool size and fluorescence quenching in thylakoid membranes and Photosystem II (PSII) membrane fragments. Photosynth Res 63: 171-182
Laasch H, Urbach W, Schreiber U (1983) Binary flash-induced oscillations of [14C]DCMU binding to the photosystem II acceptor complex. FEBS Lett 159: 275-279
Lam E, Baltimore B, Oritz W, Chollar S, Melis A, Malkin R (1983) Characterization of a resolved oxygen-evolving Photosystem II preparation from spinach thylakoids. Biochim Biophys Acta 724: 201-211
Lavergne J, Trissl H-W (1995) Theory of fluorescence induction in photosystem II: Derivation of analytical expressions in a model including exciton-radical-pair equilibrium and restricted energy transfer between photosynthetic units. Biophys J 68: 2474-2492
Lavergne J, Briantais J-M (1996) Photosystem II heterogeneity. In: Ort DR, Yocum CF (eds) The Oxygenic Photosynthesis: The Light Reactions, Advances in Photosynthesis and Respiration, Vol 4, pp 265-287. Kluwer Academic Publishers, Dordrecht
Lawson T, Oxborough K, Morison JIL, Baker NR (2002) Responses of photosynthetic electron transport in stomatal guard cells and mesophyll cells in intact leaves to light, CO2, and humidity. Plant Physiol 128: 52–62
Lazár D, Brokeš M, Nauš J, Dvořák L (1998) Mathematical modelling of 3-(3’,4’-dichlorophenyl)-1,1’-dimethylurea action in plant leaves. J Theor Biol 191: 79-86
Lazár D (2003) Chlorophyll a fluorescence rise induced by high light illumination of dark adapted plant tissue studied by means of a model of photosystem II and considering photosystem II heterogeneity. J Theor Biol 220: 469-503
Lazár D (2006) The polyphasic chlorophyll a fluorescence rise measured under high intensity of exciting light. Funct Plant Biol 33: 9-30
Ley AC, Mauzerall D (1982) Absolute absorbance cross sections for Photosystem II and the minimum quantum requirement for photosynthesis in Chlorella vulgaris. Biochim Biophys Acta 680: 95-106
Li S, Liu B, Wang J (1999) Effect of oxidative stress on cold tolerance in rice seedlings. J Trop Subtrop Bot 7: 323-328
Lichtenthaler HL, Rinderle U (1988) The role of chlorophyll fluorescence in the detection of stress conditions in plants. CRC Critical Reviews in Analytical Chemistry 19, Suppl 1: 29-85
Loll B, Kern J, Saenger W, Zouni A, Biesiadka (2005) Toward comple cofactor arrangement in the 3.0 Å resolution structure of photosystem II. Nature 438: 1040-1044
Malkin S, Kok B (1966) Fluorescence induction studies in isolated chloroplasts I. Number of components involved in the reaction and quantum yields. Biochim Biophys Acta 126: 413-432
Mano J, Ushimaru T, Asada K (1997) Ascorbate in thylakoid lumen as an endogenous electron donor to photosystem II: Protection of thylakoids from photoinhibition
162
and regeneration of ascorbate in stroma by dehydroascorbate reductase. Photosynth Res 53: 197-204
Mano J, Hideg É, Asada K (2004) Ascorbate in thylakoid lumen functions as an alternative electron donor to photosystem II and to photosystem I. Arch Biochem Biophys 429: 71-80
Mauzerall D (1972) Light-induced fluorescence changes in Chlorella, and the primary photoreactions for the production of oxygen. Proc Natl Acad Sci USA 69: 1358-1362
Melis A, Homann PH (1975) Kinetic analysis of the fluorescence induction in 3-(3,4-dichlorophenyl)-1,1-dimethylurea poisoned chloroplasts. Photochem Photobiol 21: 431-437
Melis A, Homann PH (1976) Heterogeneity of the photochemical centers in system II of chloroplasts. Photochem Photobiol 23: 343-350Melis A, Schreiber U (1979) The kinetic relationship between the C-550 absorbance change, the reduction of Q (∆A320) and the variable fluorescence yield change in chloroplasts at room temperature. Biochim Biophys Acta 547: 47-57
Morgen RW, Christman MF, Jacobson FS, Storz G, Ames BN (1986) Hydrogen peroxide-inducible proteins in Salmonella typhimurium overlap with heat shock and other stress proteins. Proc Natl Acad Sci USA 83: 8059-8063
Morin P (1964) Etudes des cinétiques de fluorescence de la chlorophylle in vivo, dans les premiers instants qui suivent le début de l’illumination. J Chim Phys 61: 674-680
Moya I, Cerovic ZG (2004) Remote sensing of chlorophyll fluorescence: instrumentation and analysis. In: Papageorgiou GC, Govindjee (eds) Chlorophyll a Fluorescence: A Signature of Photosynthesis, Advances in Photosynthesis and Respiration, Vol 19, pp 429-445. Springer, Dordrecht
Mühlbauer SK, Eichaker LA (1998) Light dependent formation of the photosynthetic proton gradient regulates translation elongation in chloroplasts. J Biol Chem 146: 34-56
Munday JC, Govindjee (1969) Light-induced changes in the fluorescence yield of chlorophyll a in vivo; III. The dip and the peak in the fluorescence transient of Chlorella pyrenoidosa. Biophys J 9: 1-21
Munekage Y, Hojo M, Meurer J, Endo T, Tasaka M, Shikanai T (2002) PGR5 is involved in cyclic electron flow around photosystem I and is essential for photoprotection in Arabidopsis. Cell 110: 361-371
Munekage Y, Hashimoto M, Miyake C, Tomizawa K, Endo T, Tasaka M, Shikanai T (2004) Cyclic electron flow around photosystem I is essential for photosynthesis. Nature: 429: 579-582
Murata N, Nishimura M, Takamiya A (1966) Fluorescence of chlorophyll in photosynthetic systems II. Induction of fluorescence in isolated spinach chloroplasts. Biochim Biophys Acta 120: 23-33
Mustárdy L, Garab G (2003) Granum revisited. A three-dimensional model-where things fall into place. Trends Plant Sci 8: 117-122
Nakamoto H, Sundblad L-G, Gardeström P, Sundbom E (1988) Far-red stimulated long-lived luminescence from barley protoplasts. Plant Sci 55: 1-7
Nakano Y, Asada K (1981) Hydrogen peroxide is scavenged by ascorbate-specific peroxidase in spinach chloroplasts. Plant Cell Physiol 22: 867-880
Nedbal L, Trtílek M, Kaftan D (1999) Flash fluorescence induction: A novel method to study regulation of Photosystem II. J Photochem Photobiol B 48: 154-157
Nedbal L, Soukupová J, Kaftan D, Whitmarsh J, Trtílek M (2000) Kinetic imaging of chlorophyll fluorescence using modulated light. Photosynth Res 66: 3-12
163
Neubauer C, Schreiber U (1987) The polyphasic rise of chlorophyll fluorescence upon onset of strong illumination; I. Saturation characteristics and partial control by the photosystem II acceptor side. Z Naturforsch 42c: 1246-1254
Niyogi KK, Grossman AR, Björkman O (1998) Arabidopsis mutants define a central role for the xanthophylls cycle in the regulation of photosynthetic energy conversion. Plant Cell 10: 1121–1134
Nobel PS (1991) Physicochemical and environmental plant physiology. Academic Press Inc Harcourt Brace Jovanovich, Publishers. San Diego, New York, Boston, London, Sydney, Tokyo, Toronto
Ohad I, Dal Bosco C, Herrmann RG, Meurer J (2004) Photosystem II proteins PsbL and PsbJ regulate electron flow to the plastoquinone pool. Biochemistry 43: 2297-2308
Ohira S, Morita N, Suh H-J, Jung J, Yamamoto Y (2005) Quality control of Photosystem II under light stress - turnover of aggregates of the D1 protein in vivo. Photosynth Res 84: 29-33
Oja V, Eichelmann H, Peterson RB, Rasulov B, Laisk A (2003) Deciphering the 820 nm signal: redox state of donor side and quantum yield of Photosystem I in leaves. Photosynth Res 78: 1-15
Ono T, Inoue Y (1991) Biochemical evidence for histidine oxidation in photosystem II depleted of the Mn-cluster for O2-evolution. FEBS Lett 278: 183-186
Osyczka A, Moser CC, Dutton PL (2005) Fixing the Q cycle. Trends Biochem Sci 30: 177-182
Paillotin G (1976) Movement of excitations in the photosynthetic domains of photosystem II. J Theor Biol 58: 237-252
Papageorgiou GC, Govindjee (2004) Chlorophyll a fluorescence: a signature of photosynthesis, advances in photosynthesis and respiration. Springer, Dordrecht
Peters RLA, Van Kooten O, Vredenberg WJ (1984) The kinetics of P515 in relation to the lipid composition of the thylakoid membrane. J Bioenerg Biomem 16: 283-294
Petrouleas V, Crofts A (2005) The iron-quinone acceptor complex. In: Wydrzynski TJ, Satoh K (eds) Photosystem II: The light-driven water:plastoquinone oxidoreductase. Advances in Photosynthesis and Respiration, Vol 22, pp 177-206. Springer, Dordrecht
Petrouleas V, Koulougliotis D, Ioannidis N (2005) Trapping of netalloradical intermediates of the S-states at liquid helium temperatures. Overview of the phenomenology and mechanistic implications. Biochemistry 44: 6723-6728
Pettai H, Oja V, Freiberg A, Laisk A (2005) Photosynthetic activity of far-red light in green plants. Biochim Biophys Acta 1708: 311-321
Pfannschmidt T, Nilsson A, Allen JF (1999) Photosynthetic control of gene expression. Nature 397: 625-628
Pfister K, Burger G, Lichtenthaler HK, Musso H, Zahn M (1981) The inhibition of photosynthetic light reaction by halogenated napthoquinones. Z Naturforsch 36c: 645-655
Popham PL, Novaczky A (1991) Use of dimethyl sulfoxide to detect hydroxyl radical during bacteria-induced hypersensitive reaction. Plant Physiol 96: 1157-1160
Porra RJ, Thompson WA, Kriedeman PE (1989) Determination of accurate extinction coefficients and simultaneous equations for essaying chlorophylls-a and -b with four different solvents: verification of the concentration of chlorophyll standards by atomic absorption spectroscopy. Biochim Biophys Acta 975: 384-394
Pospíšil P, Dau H (2000) Chlorophyll fluorescence transients of Photosystem II membrane particles as a tool for studying photosynthetic oxygen evolution. Photosynth Res 65: 41-52
164
Pospíšil P, Dau H (2002) Valinomycin sensitivity proves that light-induced thylakoid voltages result in millisecond phase of chlorophyll fluorescence transients. Biochim Biophys Acta 1554: 94-100
Prášil O, Kolber Z, Berry JA, Falkowski PG (1996) Cyclic electron flow around Photosystem II in vivo. Photosynth Res 48: 395-410
Prokhorenko VI, Holzwarth AR (2000) Primary processes and structure of the photosystem II reaction center: a photon echo study. J Phys Chem B 104: 11563-11578
Renger G, Hanssum B, Gleiter H, Koike H, Inoue Y (1988) Interaction of 1,4-benzoquinones with Photosystem II in thylakoids and Photosystem II membrane fragments from spinach. Biochim Biophys Acta 936: 435-446
Renger T, May V, Kühn O (2001) Ultrafast excitation energy transfer dynamics in photosynthetic pigment-protein complexes. Phys Rep 343: 137-254
Rutherford AW, Crofts AR, Inoue Y (1982) Thermoluminescence as a probe of photosystem II photochemistry. The origin of the flash-induced glow curves. Biochim Biophys Acta 682: 457-465
Rutherford AW, Govindjee, Inoue Y (1984) Charge accumulation and photochemistry in leaves studied by thermoluminescence and delayed light emission. Proc Natl Acad Sci USA 81: 1107-1111
Rutherford WA, Boussac A, Faller P (2004) The stable tyrosyl radical in Photosystem II: why D? Biochim Biophys Acta 1655: 222-230
Samson G, Prášil O, Yaakoubd B (1999) Photochemical and thermal phases of chlorophyll a fluorescence. Photosynthetica 37: 163-182
Santarius KA (1980) Membrane lipids in heat injury of spinach chloroplasts. Physiol Plant 49: 1-6
Satoh K (1981) Fluorescence induction and activity of ferredoxin-NADP+ reductase in Bryopsis chloroplasts. Biochim Biophys Acta 638: 327-333
Satoh K, Katoh S, Dostatni R, Oettmeier W (1986) Herbicides and plastoquinone-binding proteins of Photosystem II reaction center complexes from the thermophilic cyanobacterium, Synechococcus sp. Biochim Biophys Acta 851: 202-208
Satoh K, Kitatani Y, Ichimura T, Katoh S (1990) Interactions between various bezoquinones and the QB site of oxygen-evolving photosystem II preparations from the thermophilic cyanobacterium Synechococcus elongatus. In: Baltscheffsky M (ed) Current Research in Photosynthesis, Vol I, pp 583-586. Kluwer Academic Publishers, Dordrecht
Sazanov LA, Burrows PA, Nixon PJ (1998) The chloroplast Ndh complex mediates the dark reduction of the plastoquinone pool in response to heat stress in tobacco leaves. FEBS Lett 429: 115-118
Schansker G, Srivastava A, Govindjee, Strasser RJ (2003) Characterization of the 820-nm transmission signal paralleling the chlorophyll a fluorescence rise (OJIP) in pea leaves. Funct Plant Biol 30: 785-796
Schansker G, Strasser RJ (2005) Quantification of non-QB-reducing centers in leaves using a far-red pre-illumination. Photosynth Res 84: 145-151
Schansker G, Tóth SZ, Strasser RJ (2005) Methylviologen and dibromothymoquinone treatments of pea leaves reveal the role of photosystem I in the Chl a fluorescence rise OJIP. Biochim Biophys Acta 1706: 250-261
Schansker G, Tóth SZ, Strasser RJ (2006) Dark-recovery of the Chl a fluorescence transient (OJIP) after light adaptation: The qT-component of non-photochemical quenching is related to an activated photosystem I acceptor side. Biochim Biophys Acta 1757: 787-797
165
Schatz GH, Brock H, Holzwarth AR (1987) Picosecond kinetics of fluorescence and absorbance changes in photosystem II particles excited at low photon density. Proc Natl Acad Sci USA 84: 8414-8418
Schmidt-Mende P, Witt HT (1968) Zur plastochinonoxydation bei der Photosynthese. Z Naturforsch 23b: 228-235
Schöttler MA, Kirchhoff H, Weis E (2004) The role of plastocyanin in the adjustment of the photosynthetic electron transport to the carbon metabolism in tobacco. Plant Physiol 136: 4265-4274
Schreiber U, Vidaver W (1974) Chlorophyll fluorescence induction in anaerobic Scenedesmus obliquus. Biochim Biophys Acta 368: 97-112
Schreiber U, Vidaver W (1976) The I-D fluorescence transient; An indicator of rapid energy distribution changes in photosynthesis. Biochim Biophys Acta 440: 205-214
Schreiber U, Armond PA (1978) Heat-induced changes of chlorophyll fluorescence in isolated chloroplasts and related heat-damage at the pigment level. Biochim Biophys Acta 502: 138-151
Schreiber U, Schliwa U, Bilger W (1986) Continuous recording of photochemical and non-photochemical chlorophyll fluorescence quenching with a new type of modulation fluorometer. Photosynth Res 10: 51-62
Schreiber U, Neubauer C (1987) The polyphasic rise of chlorophyll fluorescence upon onset of strong illumination: II. Partial control by the Photosystem II donor side and possible ways of interpretation. Z Naturforsch 42c: 1255-1264
Schreiber U, Neubauer C, Klughammer C (1989) Devices and methods for room-temperature fluorescence analysis. Phil Trans R Soc Lond B 323: 241–251
Schreiber U, Neubauer C (1990) O2-dependent electron flow, membrane energization and the mechanism of non-.photochemical quenching of fluorescence. Photosynth Res 25: 279-293
Schreiber U, Hormann H, Neubauer C, Klughammer C (1995) Assessment of photosystem II photochemical quantum yield by chlorophyll fluorescence quenching analysis. Aust J Plant Physiol 22: 209-220
Schreiber U, Krieger A (1996) Two fundamentally different types of variable chlorophyll fluorescence in vivo. FEBS Lett 397: 131-135
Schreiber U, Klughammer C, Neubauer C (1998) Measuring P700 absorbance changes around 830 nm with a new type of pulse modulation system. Z. Naturforsch 43c: 686-698
Schreiber U (2002) Assessment of maximal fluorescence yield: donor-side dependent quenching and QB-quenching. In: Van Kooten O, Snel JFH (eds) Plant Spectrofluorometry: Applications and Basic Research, pp 23-47. Rozenberg Publishers, Amsterdam
Schreiber U (2004) Pulse-amplitude-modulation (PAM) fluorometry and saturation pulse method: an overview. In: Papageorgiou GC, Govindjee (eds) Chlorophyll a Fluorescence: A Signature of Photosynthesis, Advances in Photosynthesis and Respiration, Vol 19, pp 279-319. Springer, Dordrecht
Shinkarev VP, Wraight CA (1993) Kinetic factors in the bicycle model of oxygen evolution by photosystem II. Photosynth Res 38: 315-321
Smirnoff N (2000) Ascorbate biosynthesis and function in photoprotection. Phil Trans R Soc Lond B 355: 1455-1464
Srivastava A, Strasser RJ, Govindjee (1995) Polyphasic rise of chlorophyll a fluorescence intensity and quantum yield of photosystem II of herbicide-resistant D1 mutants of Chlamydomonas reinhardtii. Photosynth Res 43: 131-141
166
Srivastava A, Guissé B, Greppin H, Strasser RJ (1997) Regulation of antenna structure and electron transport in Photosystem II of Pisum sativum under elevated temperature probed by the fast polyphasic chlorophyll-a fluorescence transient: OKJIP. Biochim Biophys Acta 1320: 95-106
Srivastava A, Strasser RJ, Govindjee (1999) Greening of peas: parallel measurements of 77 K emission spectra, OJIP chlorophyll-a fluorescence transient, period four oscillation of the initial fluorescence level, delayed light emission, and P700. Photosynthetica 37: 365-392
Staehelin LA (1975) Chloroplast membrane structure. Biochim Biophys Acta 408: 1-11 Staehelin LA, Van der Stay GWM (1996) Structure, composition functional organization
and dynamic properties of thylakoid membranes. In: Ort DR, Yocuum CF (eds) Oxygenic Photosynthesis: The Light Reactions, Advances in Photosynthesis, Vol 4, pp. 11-30. Kluwer Academic Publishers, Dordrecht
Steffen R, Eckert H-J, Kelly AA, Dörmann P, Renger G (2005) Investigations on the reaction pattern of photosystem II in leaves from Arabidopsis thaliana by time-resolved fluorometric analysis. Biochemistry 44: 3123-3133
Stiehl HH, Witt HT (1968) Die kurzzeitigen ultravioletten Differenzspektren bei der Photosynthese. Z Naturforsch 23b: 220-224
Stiehl HH, Witt HT (1969) Quantitative treatment of the function of plastoquinone in photosynthesis. Z Naturforsch 24b: 1588-1598
Stock D, Gibbons C, Arechaga I, Leslie AGW, Walker JE (2000) The rotary mechanism of ATP synthase. Curr Opin Struc Biol 10: 672-679
Strasser RJ, Sironval C (1972) Induction of photosystem II activity in flashed leaves. FEBS Lett 28: 56-59
Strasser RJ (1978) The grouping model of plant photosynthesis. In: Akoyunoglou G, Argyroudi-Akoyunoglu JH (eds) Chloroplast Development, Developments in Plant Biology, Vol. 2, pp 513-524. Elsevier/North-Holland Biomedical Press, Amsterdam
Strasser RJ (1981) The grouping model of plant photosynthesis: heterogeneity of photosynthetic units in thylakoids. In: Akoyunoglou G (ed) Photosynthesis III, Structure and Molecular Organization of the Photosynthetic Apparatus, pp 727-737. Balaban International Science Services, Philadelphia
Strasser RJ, Greppin H (1981) Primary reactions of photochemistry in higher plants. In: Akoyunoglou G (ed) Photosynthesis III, Structure and Molecular Organization of the Photosynthetic Apparatus, pp 717-726. Balaban International Science Services, Philadelphia
Strasser RJ, Govindjee (1992a) On the O-J-I-P fluorescence transient in leaves and D1 mutants of Chlamydomonas reinhardtii. In: Murata N (ed) Research in Photosynthesis, Vol II, pp 29-32. Kluwer Academic Publishers, Dordrecht
Strasser RJ, Govindjee (1992b) The Fo and the OJIP fluorescence rise in higher plants and algae. In: Argyroudi-Akoyunoglou JH (ed) Regulation of Chloroplast Biosynthesis. Plenum Press, New York
Strasser BJ, Strasser RJ (1995) Measuring fast fluorescence transients to address environmental questions: The JIP test. In: Mathis P (ed) Photosynthesis: from Light to Biosphere, Vol V, pp. 977-980. Kluwer Academic Publishers, Dordrecht/Boston/London
Strasser RJ, Srivastava A, Govindjee (1995) Polyphasic chlorophyll a fluorescence transient in plants and cyanobacteria. Photochem Photobiol 61: 32-42
Strasser BJ (1997) Donor side capacity of photosystem II probed by chlorophyll-a fluorescence transients. Photosynth Res 52: 147-155
167
Strasser RJ, Schansker G, Srivastava A, Govindjee (2001) Simultaneous measurement of photosystem I and photosystem II probed by modulated transmission at 820 nm and by chlorophyll a fluorescence in the sub ms to second time range. In: Proceedings of the 12th International Congress on Photosynthesis, S14-003. CSIRO Publishing, Melbourne
Strasser RJ, Stirbet AD (2001) Estimation of the energetic connectivity of PS II centres in plants using the fluorescence rise O-J-I-P; Fitting of experimental data to three different PS II models. Math Comp Simul 56: 451-461
Strasser RJ, Tsimilli-Michael M (2001) Structure-function relationship in the photosynthetic apparatus: a biophysical approach. In: Pardha Saradhi P (ed) Biophysical Processes in Living Systems, pp 271-303. Science Publishers Inc, Enfield
Strasser RJ, Srivastava A, Tsimilli-Michael M (2004) Analysis of the chlorophyll a fluorescence transient. In: Papageorgiou GC, Govindjee (eds) Chlorophyll a Fluorescence: A Signature of Photosynthesis, Advances in Photosynthesis and Respiration, Vol 19, pp 321-362. Springer, Dordrecht
Stroebel D, Choquet Y, Popot J-L, Picot D (2003) An atypical haem in the cytochrome b6f complex. Nature 426: 413-418
Sušila P, Lazár D, Ilík P, Tomek P, Nauš J (2004) The gradient of exciting radiation within a sample affects the relative height of steps in the fast chlorophyll a fluorescence rise. Photosynthetica 42: 161-172.
Tagawa K, Tsujimto HY, Arnon DI (1963) Role of chloroplast ferredoxin in the energy conversion process of photosynthesis. Proc Natl Acad Sci USA 49: 567-572
Takeuchi ST, Thornber JP (1994) Heat-induced alterations in thylakoid membrane protein composition in barley. Aust J Plant Physiol 21: 759-770
Thielen APGM, Van Gorkom HJ (1981) Quantum efficiency and antenna size of photosystems IIα, IIβ and I in tobacco chloroplasts. Biochim Biophys Acta 637: 439-446
Tóth SZ, Strasser RJ (2005) The specific rate of QA reduction and photosystem II antenna heterogeneity. Proceedings of the 13th International Congress on Photosynthesis, Montreal, Canada. pp. 198-200
Tóth SZ, Schansker G, Strasser RJ (2005a) In intact leaves, the maximum fluorescence level (FM) is independent of the redox state of the plastoquinone pool: a DCMU inhibition study. Biochim Biophys Acta 1708: 275-282
Tóth SZ, Schansker G, Kissimon J, Kovács L, Garab G, Strasser RJ (2005b) Biophysical studies of photosystem II-related recovery processes after a heat pulse in barley seedlings (Hordeum vulgare L.) J Plant Physiol 162: 181-194
Tóth SZ, Schansker G, Garab G, Strasser RJ (2005c) Alternative electron donors to photosystem II play an important role in the reduction of the electron transport chain in heat-treated barley leaves. Proceedings of the 8th Hungarian Congress on Plant Physiology and the 6th Hungarian Conference on Photosynthesis. Acta Biol Szeged 49: 181-183
Trebitsh T, Danon A (2001) Translation of chloroplast psbA mRNA is regulated by signals initiated by both photosystem II and I. Proc Natl Acad Sci USA 98: 12289-12294
Trebst A, Harth E, Draber W (1970) On a new inhibitor of photosynthetic electron-transport in isolated chloroplasts, Z Naturforsch 25b: 1157-1159
Trissl H-W, Gao Y, Wulf K (1993) Theoretical fluorescence induction curves derived from coupled differential equations describing the primary photochemistry of photosystem II by an exciton-radical pair equilibrium. Biophys J 64: 974-988
168
Van Best JA, Duysens LNM (1975) Reactions between primary and secondary acceptors of photosystem II in Chlorella pyrenoidosa under anaerobic conditions as studied by chlorophyll a fluorescence. Biochim Biophys Acta 408: 154-163
Van Gorkom HJ, Tamminga JJ, Haveman J (1974) Primary reactions, plastoquinone and fluorescence yield in subchloroplast fragments prepared with deoxycholate. Biochim Biophys Acta 347: 417-438
Van Gorkom HJ (1986) Fluorescence measurements in the study of Photosystem II electron transport. In: Govindjee, Amesz J, Fork DC (eds) Light Emission by Plants and Bacteria, pp 267-289. Academic Press, New York
Van Grondelle R, Gobets B (2004) Transfer and trapping of excitations in plant photosystems. In: Papageorgiou GC, Govindjee (eds) Chlorophyll a Fluorescence: A Signature of Photosynthesis, Advances in Photosynthesis and Respiration, Vol 19, pp 279-319. Springer, Dordrecht
Van Kooten O, Snel JFH (1990) The use of chlorophyll fluorescence in plant stress physiology. Photosynth Res 25: 147-150
Van Voorthuysen T (1997) The electrical potential as a gauge of photosynthetic performance in plant chloroplasts; a patch clamp study. Wageningen Agricultural University, Wageningen
Vass I, Inoue Y (1992) Thermoluminescence in the study of photosystem II. In: Barber J (ed) The Photosystems: Structure, Function and Molecular Biology, pp 259-294. Elsevier, Amsterdam
Velthuys BR, Amesz J (1973) The effect of dithionite on fluorescence and luminescence of chloroplasts. Biochim Biophys Acta 325: 126-137
Velthuys BR, Amesz J (1974) Charge accumulation at the reducing side of system 2 of photosynthesis. Biochim Biophys Acta 333: 85-94
Velthuys BR (1981) Electron-dependent competition between plastoquinone and inhibitors for binding to Photosystem II. FEBS Lett 126: 277-281
Vener AV, Van Kan PJM, Gal A, Andersson B, Ohad I (1995) Activation/deactivation cycle of redox-controlled thylakoid protein phosphorylation; Role of plastoquinol bound to the cyt bf complex. J Biol Chem 270: 25225-25232
Vener AV, Van Kan PJM, Rich PR, Ohad I, Andersson B (1997) Plastoquinol at the quinol oxidation site of reduced cytochrome bf mediates signal transduction between light and protein phosphorylation: thylakoid protein kinase deactivation by a single-turnover flash. Proc Natl Acad Sci USA 94: 1585-1590
Vernotte C, Etienne AL, J-M Briantais (1979) Quenching of the system II chlorophyll fluorescence by the plastoquinone pool. Biochim Biophys Acta 545: 519-527
Vogelmann TC, Martin G (1993) The functional significance of palisade tissue: penetration of directional versus diffuse light. Plant Cell Environ 16: 65-72
Vogelmann TC, Evans JR (2002) Profiles of light absorption and chlorophyll within spinach leaves from chlorophyll fluorescence. Plant Cell Environ 25: 1313-1323
Vredenberg WJ, Bulychev A (2002) Photo-electrochemical control of photosystem II chlorophyll fluorescence in vivo. Bioelectrochemistry 57: 123-128
Vredenberg WJ, Bulychev A (2003) Photoelectric effects on chlorophyll fluorescence of photosystem II in vivo. Kinetics in the absence and presence of valinomycin. Bioelectrochemistry 60: 87-95
Weis E (1981) Reversible effects of high, sublethal temperatures on light-induced light-scattering changes and electrochromic pigment absorption shift in spinach leaves. Z Pflanzenphysiol 101: 169-178
Weis E (1982) Influence of light on the heat sensitivity of the photosynthetic apparatus in isolated spinach chloroplasts. Plant Physiol 70: 1530-1534
169
Whitmarsh J, Govindjee (2001) Photosystem II. Encyclopedia of Life Sciences. McMillan Reference Ltd, London, UK
Wiessner W, Demeter S (1988) Comparative thermoluminescence study of autotrophically and photoheterotrophically cultivated Chlamydobotrys stellata. Photosynth Res 18: 345-356
Witt HT (1971) Coupling of quanta, electrons, fields, ions and phosphorylation in the functional membrane of photosynthesis; results by pulse spectroscopic methods. Q Rev Biophys 4: 365-477
Witt HT (1979) Energy conversion in the functional membrane of photosynthesis. Analysis by light pulse and electric pulse methods. Biochim Biophys Acta 505: 355-427
Wraight CA (1981) Oxidation-reduction physical chemistry of the acceptor quinone complex in bacterial photosynthetic reaction centers: evidence for a new model of herbicide activity. Isr J Chem 21: 348-354
Yaakoubd B, Andersen R, Desjardins Y, Samson G (2002) Contributions of the free oxidized and QB-bound plastoquinone molecules to the thermal phase of chlorophyll-a fluorescence. Photosynth Res 74: 251-257
Yamane Y, Kashino Y, Koike H, Satoh K (1997) Increases in the fluorescence F0 level and reversible inhibition of Photosystem II reaction center by high-temperature treatments in higher plants. Photosynth Res 52: 57-64
Yamane Y, Kashino Y, Koike H, Satoh, K (1998) Effects of high temperatures on the photosynthetic systems in spinach: Oxygen-evolving activities, fluorescence characteristics and the denaturation process. Photosynth Res 57: 51-59
Yamane Y, Shikanai T, Kashino Y, Koike H, Satoh K (2000) Reduction of QA in the dark: Another cause of fluorescence F0 increases by high temperatures in higher plants. Photosynth Res 63: 23-34
Yamashita T, Butler WL (1968a) Inhibition of chloroplasts by UV-irradiation and heat-treatment. Plant Physiol 43: 2037-2040
Yamashita T, Butler WL (1968b) Photoreduction and photophosphorylation with TRIS-washed chloroplasts. Plant Physiol 43: 1978-1986
Zhang LX, Paakkarinen V, Van Wijk KJ, Aro EM (2000) Biogenesis of the chloroplast-encoded D1 protein: regulation of translational elongation, insertion, and assembly into Photosystem II. Plant Cell 12: 1769-1781
Zouni A, Witt HT, Kern J, Fromme P, Krauss N, Saenger W, Orth P (2001) Crystal structure of Photosystem II from Synechococcus elongatus at 3.8 Å resolution. Nature 409: 739-743

170