Embed Size (px)
DESCRIPTION
Â
Citation preview

Advances in Physics Theories and Applications www.iiste.org ISSN 2224-719X (Paper) ISSN 2225-0638 (Online) Vol.16, 2013
25
Analysis and Assessment of Essential Toxic Heavy Metals, PH and
EC in Ishaqi River and Adjacent Soil
Dr. NooriKh. Fayad* Dr. Taghreed H. Al-Noor** and Dr. Nadia H. Al-Noor***
*Physical Chemistry and Environmental Pollution, Iraqia University, IRAQ. **Chemistry Department, Ibn-AI-Haithem College of Education, University of Baghdad, IRAQ.***Mathematic Department, College of Science, Al-Mustansiriyah University, IRAQ
Abstract
This research was conducted to determine content levels of heavy metal pollution. Samples taken from Ishaqi River bank and adjacent agricultural soils area, in ten sites, distributed along 48 km of the Ishaqi River, north Baghdad. The evaluated metals were Zinc, Copper, Manganese, Iron, Cobalt, Nickel, Chromium, Cadmium, Vanadium and Lead. PH and Electric Conductivity (EC) were measured to evaluate the acidity and (EC). Results showed that most site were contaminated with metals evaluated. Among these metals, Zn, Mn, Fe and Ni were consistently higher in all the samples (both river bank and adjacent soil) followed by PB, CU, V, Cd, Co and Cr. The level concentrations of river bank were almost higher than that of adjacent soil. As will be reported later, the concentrations of Nickel, Zinc, Manganese and Iron in river bank and agricultural adjacent soil were over the permissible levels. The average mean levels were (Ni 66.36 mg/kg, Zn 42.59 mg/kg, Mn 26.78 mg/kg, Fe 25.15 mg/kg) in river bank and (Ni 46.31 mg/kg, Zn 33.06 mg/kg, Mn 20.78 mg/kg Fe 16.28 mg/kg) in agricultural adjacent soil. Overall, Nickel had the highest concentrations in the ecosystem. Keywords: heavy metals, environmental pollution, river bank, adjacent soil, AAS.
Introduction
The increasing consumption and exploitation of the earth’s raw materials (fossil fuel and minerals) coupled with the exponential population growth over the past years have resulted in environmental degradation and build up of waste products of which metals is of great concern (1,2). Rapid industrialization and urbanization in developing countries like Iraq has resulted in large-scale pollution of the environment, resulting in the enrichment of metals in the soil (3,4). Rivers have been subject to deterioration in water quality over decades due to bad farming practices and other land uses. The Rivers which have been subject to deterioration in water quality over decades due to bad farming practices, and the land used predominantly agriculture and largely residential (formal and informal settlements) and industrial, found the rivers to be polluted with a variety of metals (5). The concern is that industrial and household effluents could be discharging appreciable quantities of metals into the rivers which may be detrimental to wetland plants, microorganisms, human health and ecosystem health in general. The objective of this study was to determine the extent of metal contamination in the river banks and adjacent soil along a section of the Ishaqi River (6). Heavy metals enter soil from several sources, including wastes from mines and smelters,
Advances in Physics Theories and Applications www.iiste.org ISSN 2224-719X (Paper) ISSN 2225-0638 (Online) Vol.16, 2013
26
atmospheric deposition, animal manures and sewage sludge and in some circumstances inorganic fertilizer, often contaminated with significant quantities of heavy metals (7). It is believed that the great majority of heavy metals act as a key components of essential enzyme systems or other proteins, e.g. . The haemoprotein hemoglobin which performs vital biochemical functions (8,9). Zinc cadmium ,lead etc are highly toxic for human bio-system even at very low levels of intake and they are usually present in plants because of the increasing industrialization and associated pollution at the biosphere, taken up from the soil, water, fertilizers, pesticides treatment and anthropogenic operations (10,11). Factories and human social and agricultural activities have an effect on environmental pollution and the ecosystem. The corruption of the ecosystem has a negative effect on human health and on all living Organisms (10, 11,12). Not all heavy metals are toxic to humans. In small quantities, metal such as iron, copper, manganese and zinc are essential for humans, plants and animals, but become toxic at higher concentrations (12,13), the margins of safety between beneficial and harmful is narrow. Deficiencies of trace elements are common plant nutritional problems in crop production. While most trace elements in soil are beneficial to plant growth, a buildup of trace elements may have a negative effect on whoever eats the plant (14,15). As we started to measure the contents of heavy metals in river bank and adjacent soil, we expect the higher level values will be in the adjacent soil due to human activities, fertilizers, atmospheric fallout(14).Heavy metals can be found generally at trace levels in soil and vegetation, and living organisms, the need for microelements of these metals. However these have a toxic effect on organisms at high content levels. Heavy metals toxicity has an inhibitory effect on plant growth, enzymatic activity, stoma function, photosynthesis activity and accumulation of other nutrient elements, and also damages the root system (16,17). Cadmium, chromium, copper, nickel, lead and zinc will continue to accumulate in the soil through irrigation water, fertilizer application and waste disposal. Under normal conditions, the rate of accumulation is slow and the accumulated elements are not likely to interfere with the use of the soils in the foreseeable future, even when wastes such as bio-solids are applied on cropland. Soil electrical conductivity (EC) measures the ability of soil water to carry electrical current. Electrical conductivity is an electrolytic process that takes place principally through water- filled pores (9, 10). Cautions and anions from salts dissolved in soil water carry electrical changes and conduct the electrical current. Consequently, the concentration of ions determines the EC of soil (16).Studies of environmental pollution are very limited in Iraq, despite the fact that this country has passed through harsh wars and destruction of infrastructure, most of the factories. Iraqi cities and villages are mostly located on both sides of the rivers. The waste water of factories and the sewage of residential areas are discharged into the rivers without any treatment. Therefore, we believed that Iraqi rivers are contaminated with heavy elements, chemicals and even animal manures, which make the rivers and irrigated areas polluted. Zinc, Manganese, Iron, Nickel, Copper and Lead will continue to accumulate in the soil through irrigation water, fertilizer application and waste disposal (17). Under normal conditions, the rate of accumulation is slow and the accumulated elements are not likely to interfere with the use of the soils in the foreseeable future, even when wastes such as bio-solids are applied on cropland (18).The sampling sites were selected based on their location near residential and industrial areas, which may emit a cocktail of metal pollutants to some extent in the environment.
Advances in Physics Theories and Applications www.iiste.org ISSN 2224-719X (Paper) ISSN 2225-0638 (Online) Vol.16, 2013
27
Methods and Materials The samples were taken from ten sites as shown in figure 1. The chemical analysis of soil samples were carried out on 20 gm sample, air dried and finely ground with an agate mortar and pestle. A 1 gm subsample was decomposed with concentrated HF - HClO4 - HNO3 mixture. The water samples were digested, using HNO3 and HCl to get rid of organic materials and minerals. Following by flame and furnace atomic absorption spectrophotometer for Zinc, Copper, Manganese, Iron, Cobalt, Nickel, Chromium, Cadmium, Vanadium and Lead, for river bank and adjacent soil samples.The electrical conductivity (EC) pocket meter is used to take measurements in the field. The method is described in the Soil Quality Test Kit Guide. The EC meter always calibrated before use. The pocket meter can be augmented by a probe that is placed directly into the (1:2 water: soil) to measure subsoil EC. To measure the soil PH-values, we used the method recommended by (Elsa Sanchez, University Park, and Pennsylvania State University). Place 5 gms of air-dried soil into the paper cup. Add 5 ml of distilled or de-ionized water to the cup, stir for about 30 seconds and let stand for 30 minutes, place PH strip into the slurry and read within 30 seconds.
Statistical Analysis The statistical analysis was used to comparison between heavy metal (Zn, Cu, Mn, Fe, Co, Ni, Cr, Cd, V and Pb) data in both Ishaqi River and adjacent soil.Table2, shows the average mean, standard deviation, correlation-test and p values between elements in the river and adjacent soil. Correlation analysis were made to investigate the relationship between heavy metal content of Ishaqi River and adjacent soil. t - test was used to access whether heavy metal concentrations varied significantly among the sites of Ishaqi River and adjacent soil, possibilities less than 0.05 (p- value < 0.05) were considered statistically significant. As seen in table2, there are positive correlations between river and soil for all metal content in the investigated region. This relation was not statically significant for vanadium (V) but were significant for Zn, Cu, Mn , Fe, Co, Ni, Cr, Cd and Pb (r=0.937,0.967,0.943, 0.834, 0.724, 0.786, 0.852,0.919 and 0.993 respectively ) positive relationship for metal contents between the Ishaqi River and adjacent soil are expected results, because all the adjacent soil are irrigated from Ishaqi River (19). There were significant differences between values of sampling locations for the elements (Cu, Fe, Co, Ni, Cr and V) (P≤ 0.01, 0.05).
Results and Discussion Levels of heavy metal contents in Ishaqi River and adjacent soil, supplied from different sites table 1and figures 1, 2 and 3. Analysis of Ishaqi River and adjacent soil samples are given in table 2, showing the average mean, standard deviation, correlation coefficient (r) and p values of t-test. The results of heavy metal analysis are given below with the subheadings: Zinc (Zn)
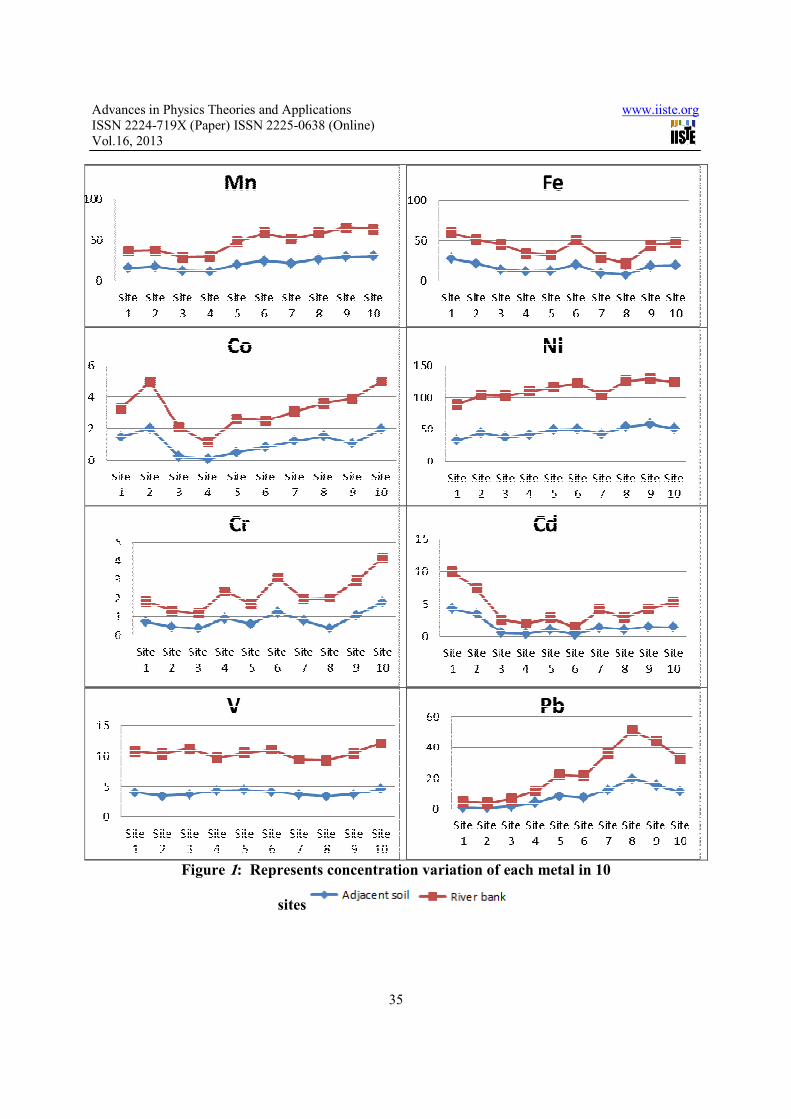
The concentrations of Zn are given in table 1and figure 1,overall, the river bank samples, in all sites had significantly higher concentrations of Zn compared with adjacent soil. In river bank the higher Zn value recorded at site 10 (59.41 mg/kg), and adjacent soil (49.27 mg/kg), at site 9. The Zn values in the ten sites of adjacent soil are ranged from (19.32 – 49.27)mg/kg with average mean equal to 33.06 mg/kg ,for river bank the values ranged from 59.41 mg/kg to 28.19 mg/kg with average mean value equal to 42.59 mg/kg (table 1). Copper (Cu)
The results that are given in table2, showed that there were significant differences (P<0.05) between samples average mean values of river bank and adjacent soil .The sample values of
Advances in Physics Theories and Applications www.iiste.org ISSN 2224-719X (Paper) ISSN 2225-0638 (Online) Vol.16, 2013
28
River bank ranged from 18.49 mg/kg (site7) to 3.87mg/kg (site 5) with average mean value of (9.08 mg/kg ). Whereas the sample values at adjacent soil ranged from 11.62 mg/kg to 2.63 mg/kg with average mean value (5.25 mg/kg) table 1. Manganese (Mn)
The Manganese content in river bank samples was higher than those of adjacent soil samples (table1 and figure 1).Mn in the adjacent soil samples ranged from 30.08 mg/kg (site 10) to 11.49 mg/kg at (site 4), with average mean value (20.78mg/kg) ,whereas for river bank samples ranged from 35.68 mg/kg (site9) to 16.84 mg/kg (site 3) , with average mean value of (26.78 mg/kg) table 1 . Iron (Fe)
The results of t-test of Fe given in table 2, showed that there were signified difference (p<0.01) between samples average mean values of adjacent soil and river bank .The content values of Fe in river bank samples had higher concentrations in all sites compared with Fe concentrations in the adjacent soil samples table 1. The sample values of river bank and adjacent soil ranged (31.84 – 13.92, 27.48 – 7.84) mg/kg at sites 1 and 8 respectively. Cobalt (Co)
For the adjacent soil samples Co concentrations ranged between (0.09-2.02) mg/kg, and for the river bank, it ranged from (1.05-3.04)mg/kg table 1 and figure 1. There was statistically significant difference between river bank and adjacent soil (p<0.01) table2. The highest value for Co in river bank 3.04mg/kg and adjacent soil 2.02 mg/kg at the same site number 10, table2; this implies that site 10 had the highest Co metal load. Nickel (Ni)
Table 1 shows the concentration of Ni. Overall, the content values samples in all sites in river bank and adjacent soil had significantly highest concentration of Ni compared with other metals in this study table 1 and figure 1. The highest values recorded for Ni in both river bank and adjacent soil were (72.64 mg/kg, site 10 and 57.84 mg/kg, site9) respectively. The results of t-test (table2) showed that there was statistically significant difference (p<0.01), between the average mean values of river bank and adjacent soil. Chromium (Cr)
In this study, Cr concentrations were higher in samples collected from river bank compared with those from adjacent soil (table1). The results of t-test (table2) showed that, there was statistically significant difference (p<0.05), between the average values of river bank and adjacent soil. The concentrations of Cr in river bank ranged between (0.79 -2.38) mg/kg. In adjacent soil Cr concentration ranged from (0.38-1.79)mg/kg (table 1). Cadmium (Cd)
Cd concentration, generally, in the river bank samples in all sites had higher concentration of Cd than the content values of adjacent soil samples. Cd concentration in river bank ranged from (1.09-5.72) mg/kg Whereas, Cd concentration in soils sample ranged between (0.37-4.31) mg/kg. The highest value for both river bank and soil recorded in site1 (table 1and figure 1). Vanadium(V)
The concentrations of V are given in table 1.Overall, the river bank samples in most sites had significantly highest concentration of V compared with adjacent sites figures 1 and 2. Highest V values in river bank and adjacent soil samples were (7.59 and 4.63) mg/kg respectively at site 10. This implies that site 10 had the highest V metal load. Statistically significant differences (p<0.01)in the t-test for average mean values of river bank and adjacent soil,(table2).
Advances in Physics Theories and Applications www.iiste.org ISSN 2224-719X (Paper) ISSN 2225-0638 (Online) Vol.16, 2013
29
Lead (Pb) The lead content in river bank samples was higher than those of adjacent soil samples (table1).Pb had the highest concentration of (31.39mg/kg) in the river bank at site 8, followed by (28.49mg/kg) at site 9. Similarly, the highest concentration in adjacent soil was also recorded at site 8 (19.67 mg/kg) followed by (15.68 mg/kg) at site 9. This is might be implies that sites 8 and 9 had the highest Pb metal load. Discussion
Nickel, Zinc, Iron and Manganese had the highest concentration, followed by Copper, Lead, Vanadium, Cadmium, Cobalt and Chromium had the lowest concentrations, table 1and figures 1, 2 and 3.The mean concentrations of Nickel for all sites in the river bank and adjacent soil (66.36 and 46.31) mg/kg respectively. These levels were higher than those recommended and acceptable concentration for Ni (30-40) mg/kg for soil (kabata-pendias 2001) (1). Such high levels are undesirable as they may cause poor root growth and proliferation in the soil (4).Studies on the concentrations of Mn, Fe and Zn showed that these metals exceeded the recommended and acceptable values in soil (1, 16).Concentrations of Mn ranged between (11.49 and 30.08) mg/kg for the adjacent soil and 16.94-35.68 mg/kg for the river bank samples, table 1. Values recorded from all sites were exceeded the recommended standard of 2.0 -5.0 mg/kg (1, 4, 10). The concentrations of Fe in the river bank samples ranged from (13.92 – 31.84) mg/kg and for the adjacent soil samples from (7.84 – 27.48) mg/kg. The mean average values were (25.15 and 16.28) mg/kg for river bank and adjacent soil respectively table 1. These values give a clear indication, that the sites are heavily polluted with this metal and may cause hazardous effects to plants and other organisms. The recommended concentration of Fe in the soil for the cultivation at plants ranged from (0.30 - 10) mg/kg (16; 17). Zinc an essential micronutrient at many enzymes systems, such as respiration enzymes activations and the biosynthesis of plant growth hormones, is required in concentration not exceeding 50 mg/kg for soil (17,19). Concentration of Zinc samples ranged between (28.79 - 59.41) mg/kg for the river bank and for the adjacent soil (19.32 – 49.27) mg/kg (table 1).The results of this study suggest that the contamination would likely be in sites 9 and 10 as their values are higher than the permissible values (19,20 22). Copper levels in the river bank ranged from (3.87 – 18.49) mg/kg and for adjacent soil from (1.17 – 11.62) mg/kg. These results showed that all 10 sites had values which are less than the Canadian soil quality guideline of (50 – 60) mg/kg for agriculture soil (CCME, 1999). Hence, Cu is not threat in this ecosystem. In this study, Co levels ranged from (0.09 – 2.02) mg/kg for adjacent soil, and (1.05 – 3.04) mg/kg for river bank. These levels are below the proposed toxic levels of between 4.1 and 14.0 mg/kg in different ecosystems (18). Therefore, Co levels in the study sites cannot be linked to causing adverse biological effects to different organisms growing in these habitants (25,26). The concentrations of Cr in adjacent soil ranged from (0.38 – 1.79) mg/kg and for river bank from (0.79 – 2.38) mg/kg (table 1).These values are for below the recommended value of 64 mg/kg in Canada (CCME,1999), implying that they were within the accepted limits for the growth and development at different organisms. This justifies that Cr is not threat in this ecosystem. Considering the established guideline, the permissible values for Cd is 1.4 mg/kg (CCME, 1999). Therefore, the toxic levels were observed for Cd at site 1 (4.31 mg/kg) in the adjacent soil and (5.72 mg/kg) in the river bank and site2 (3.49 mg/kg) in the adjacent soil and (3.87 mg/kg) in the

Advances in Physics Theories and Applications www.iiste.org ISSN 2224-719X (Paper) ISSN 2225-0638 (Online) Vol.16, 2013
30
river bank and in site 10 (3.81 mg/kg) in river bank. The concentration values in all other sites are lower than or equal to the (1.4 mg/kg) which is recommended in the Canadian soil quality guidelines (CCME,1999), therefore, considering the established guidelines, it can be suggested that Cd could jeopardize the life and health of certain plants and other forms of life at sites 1,2 and 10 (table1). The highest values of V in the 10 sites for both adjacent soil and river bank were (4.63 mg/kg and 7.5 mg/kg) respectively, generally the values of river bank were higher than those of adjacent soil (table 1 and figures 1 and 2). The t-test of V content of soil and Ishaqi River bank showed significant differences between sampling sites (P<0.01, table2) Bergmann's investigation,(2004), shows that a tolerable V level for soil and plant is 50 mg/kg and our findings are lower than this figure. On the other hand, the same investigation showed V content in plants is between (1.32 – 10.01) mg/kg. The results of standard deviation showed that there were differences for lead between samples of adjacent soil and river bank. The concentration of Pb ranged from (2.74 – 31.39) mg/kg in river bank and from (0.93 – 19.67) mg/kg in the adjacent soil. The proposed soil quality guideline for Pb in Canada is 70 mg/kg for agriculture soil (CCME, 1999). Our results are lower than this figure. The highest values measured at sites (7; 8; 9 and 10) were ranged from (11.53 – 19.67) mg/kg for soil and for river bank from (21.49 – 31.39) mg/kg. These values probable associated with adverse biological effects on organisms living in the ecosystem and possible negative effect on the ecosystem health. Soil with high content of soluble salt and exchangeable sodium; generally exhibit extremely high EC (table 1). In soil where the water table is high and saline, water will rise by capillarity and increase salt concentration and EC in the soil surface layers (10, 22, 23). Normally, the EC decreases sharply when the temperature of soil water is below the freezing point EC decreases about 2.2% per degree centigrade due to increased viscosity of water and decreased mobility of ions (10,24,).In Iraq, the temperature ranged between (25 to 6) during winter and autumn and (55 to 35) in summer, generally the high temperature of soils in Iraq, leads to decrease the water viscosity and increasing mobility of ions, consequently increasing the cation-exchange capacity (CEC) and the Electric conductivity . An EC (0 < 2) ds/m is considered good for irrigation water. Beyond this value (table 3 and figure 3), leaching or a combination of leaching and drainage will be necessary if the water is used (9, 18, 24, 25). Soil PH is acknowledged to be the principal factor influencing concentration of soluble and plant available metals (21,23). Metal solubility and PH are inversely related, with solubility increasing at lower PH values and vice versa (24,25).PH effect the ability of plants roots to absorb nutrients. Plants have difficulty absorbing Copper, Zinc, Manganese, and Iron in basic soil. A PH that’s too high or low can make disease, insect and weed problems worse. Our soil needs to be afforded the same protection as is given to air and water. We need to know the state of our soil, and the pressures placed on them, evaluate the extent of soil degradation and respond to degradation processes in an informed and structured manner. We need to plan for the protection of soils to ensure that they can continue to perform the functions we require of them and to protect against the real risk from climate change. We cannot protect this intrinsically valuable national resource without the appropriate and essential information and understanding. We cannot achieve good water or air quality without knowing our soils and how they behave in
Advances in Physics Theories and Applications www.iiste.org ISSN 2224-719X (Paper) ISSN 2225-0638 (Online) Vol.16, 2013
31
relation to pressures placed on them. Our soils are our life they are intrinsically connected to our water and air, and we must strive to protect them. This work will assist in developing strategies for reducing heavy metal inputs to Ishaqi River and agricultural land and effectively targeting policies to protect soil from long-term heavy metal accumulation.
References
1- Kabata-Pendias A.(2001). Trace elements in soil and plants(3rdedn.) CRC Press, Boca, Florida, P(413).
2- Diagmanolin et al. (2004). Transfers of metals from soil to vegetables in an area near a smelter in Naming, China. Environ. Inter. 30(6), PP(785 – 791).
3- Brown C et al. (2009). Rivers and wetlands of Cape Town, Caring of our rich aquatic heritage, Gainer South Africa, Water Research Commission,PP(65-71).
4- Chen Z.S (2000). Relationship between heavy metal concentrations in Taiwan and uptake by Cro. Depart Agrich. Chem, National Taiwan University, Tai Pei, Taiwan, Roc, P(15).
5- Jackson et al. (2009). Investigation into the metal contamination of the Plankenburg and Diep Rivers, Western Cape, South Africa. Water SA, 35(3), PP(289-299).
6- Shuping L. S. (2008). Metals Concentrations in the Sediments of Richard Lake, Sudbury, Canada and Sediment toxicity in a amphipod Hyalella a Azteca. J. Environ. Scien.Techno., 1(1),PP(34 – 41).
7- Brookes ,P(1995) The use at micro bid parameters in monitoring soil pollution by heavy metals, Bid. Fert.Soils,19(4), PP(269-279).
8- Hunt ,J.A (2003). Bioavailability of Fe ,Zn and other trace minerals for vegetation diets. Am. J. clin.Nutr., 78, PP(633-639).
9- Chen, Z.S. (1992). Metal contamination of flooded soil, Rice plants and surface water in Asia, Ed. Adriano. Biochemistry of trace metals, Lewis Publishers Inc. P(125).
10- Yagdik (2000). Heavy metal contamination in soil and its effects in agriculture,J.Fac.Agric.,15, P(109-115).
11- OnderS.etal (2007).Determination of heavy metal pollution in grass and soil. J .environ .Stud.,16(1), PP(145-154).
12- Zheng,Y.etal (2008).multivariategeostatistical analysis of heavy metals in top oils from Beijing chaina ,J.of soil sediments, 8, PP(51-58).
13- KachnkoA.G.etal (2006).Heavy metals contamination in vegetable grown in urban and metal smelter contaminated sites in Australia. Water Air and soil pollution., 169, PP(101-123).

Advances in Physics Theories and Applications www.iiste.org ISSN 2224-719X (Paper) ISSN 2225-0638 (Online) Vol.16, 2013
32
14- Bradford G.R. etal (1996) Background concentrations of trace and major elements in California soils (special report) UC Kearney Foundation of soil Science P.52 15- Corwin, D.L. etal (2005). Apparent soil electrical conductivity measurements in agriculture computers and Electronics in agriculture, 46,PP(11-43).
16- Lindsay WL, (1985). Micronutrient soil testing for the tropics. In Vlek, P. L.G. (ed.). Macronutrients in Tropical Food Crop Production. International Fertilizer Development Center, Muscle Shaols, PP(169-200).
17- Ayeni, O. O. et al. (2010). Metal contamination of soils collected from four different sites along the lower DiepRiver,Cape Town. International Journal of the Physical Sciences, 5(13), PP(2045-2051).
18- Canadian Council of ministers of the Environment (CCME) (1999). Canadian soil quality guidelines for the protection of environmental and human health.Summary of a protocol for the Derivation of Environmental and Human Health Soil Quality Guidelines. In: Canadian Environmental quality guidelines, Chapter 7, CanadianCouncil of Ministers of the Environment, Winnipeg.
19- Choueri RB, Cesar A, Abessa DMS, Torres RJ, Morais RD, RibaI,Pereira CDS, Cui YJ, Zhu YG, Zhai RH, Chen DY, Huang YZ, Qiu Y, et al. (2004). Transfer of metals from soil to vegetables in an area near a smelter in Nanning, China. Environ. Inter., 30(6), PP(785 -791).
20- Lu, X. et al. (2009) Contamination assessment of copper, lead, zinc, manganese and nickel in street dust of Baoji,NW China, Journal of Hazardous Materials, 161, PP(1058–1062).
21- Morton-Bermea, O. et al. (2009). Assessment of heavy metal pollution in urban topsoil's from the metropolitan area of Mexico City, Journal of Geochemical Exploration 101,PP(218–224).
22- Ordóñez, A. et al. (2003) . Distribution of heavy metals in the street dusts and soils of an industrial city in Northern Spain, Archives of Environmental Contamination and Toxicology, 44, PP(160–170).
23- Sindern, S. et al. (2007) . Anthropogenic heavy metal signatures for the fast growing urban area of Natal (NE-Brazil), Environmental Geology, 52, PP(731–737).
24- GÜNE, A.et al. (2004). Plant growth and fertilizer.Ankara Univ. Agriculture Pub. No: 1539, Ankara, Turkey (in Turkish) .
25- Hough, R. L.et al. (2004). Assessing potential risk of heavy metal exposure from consumption of homeproduced vegetables by urban populations. Environmental Health Perspectives, 112, PP(215-221).
26- Imperato, M. et al. (2003) Spatial distribution of heavy metals in urban soils of Naples city (Italy). Environmental Pollution, 124,PP(247-256).
Advances in Physics Theories and Applications www.iiste.org ISSN 2224-719X (Paper) ISSN 2225-0638 (Online) Vol.16, 2013
33
27- Ayeni OO, et al. (2010). Chemical, biological and physiological indicators of metal pollution in wetlands. Sci. Res. Essays, 5(15),PP(1938-1949).
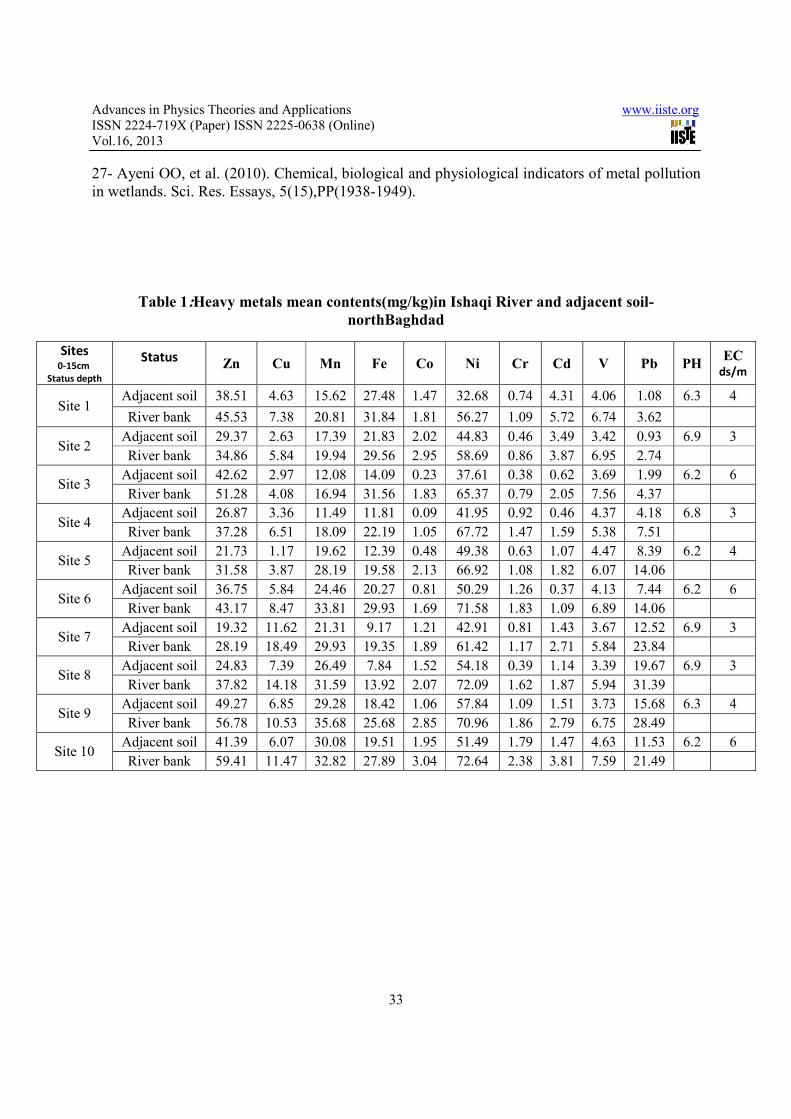
Table 1:Heavy metals mean contents(mg/kg)in Ishaqi River and adjacent soil-
northBaghdad
Sites 0-15cm
Status depth
Status Zn Cu Mn Fe Co Ni Cr Cd V Pb PH
EC ds/m
Site 1 Adjacent soil 38.51 4.63 15.62 27.48 1.47 32.68 0.74 4.31 4.06 1.08 6.3 4
River bank 45.53 7.38 20.81 31.84 1.81 56.27 1.09 5.72 6.74 3.62
Site 2 Adjacent soil 29.37 2.63 17.39 21.83 2.02 44.83 0.46 3.49 3.42 0.93 6.9 3
River bank 34.86 5.84 19.94 29.56 2.95 58.69 0.86 3.87 6.95 2.74
Site 3 Adjacent soil 42.62 2.97 12.08 14.09 0.23 37.61 0.38 0.62 3.69 1.99 6.2 6
River bank 51.28 4.08 16.94 31.56 1.83 65.37 0.79 2.05 7.56 4.37
Site 4 Adjacent soil 26.87 3.36 11.49 11.81 0.09 41.95 0.92 0.46 4.37 4.18 6.8 3
River bank 37.28 6.51 18.09 22.19 1.05 67.72 1.47 1.59 5.38 7.51
Site 5 Adjacent soil 21.73 1.17 19.62 12.39 0.48 49.38 0.63 1.07 4.47 8.39 6.2 4
River bank 31.58 3.87 28.19 19.58 2.13 66.92 1.08 1.82 6.07 14.06
Site 6 Adjacent soil 36.75 5.84 24.46 20.27 0.81 50.29 1.26 0.37 4.13 7.44 6.2 6
River bank 43.17 8.47 33.81 29.93 1.69 71.58 1.83 1.09 6.89 14.06
Site 7 Adjacent soil 19.32 11.62 21.31 9.17 1.21 42.91 0.81 1.43 3.67 12.52 6.9 3
River bank 28.19 18.49 29.93 19.35 1.89 61.42 1.17 2.71 5.84 23.84
Site 8 Adjacent soil 24.83 7.39 26.49 7.84 1.52 54.18 0.39 1.14 3.39 19.67 6.9 3
River bank 37.82 14.18 31.59 13.92 2.07 72.09 1.62 1.87 5.94 31.39
Site 9 Adjacent soil 49.27 6.85 29.28 18.42 1.06 57.84 1.09 1.51 3.73 15.68 6.3 4
River bank 56.78 10.53 35.68 25.68 2.85 70.96 1.86 2.79 6.75 28.49
Site 10 Adjacent soil 41.39 6.07 30.08 19.51 1.95 51.49 1.79 1.47 4.63 11.53 6.2 6
River bank 59.41 11.47 32.82 27.89 3.04 72.64 2.38 3.81 7.59 21.49

Advances in Physics Theories and Applications www.iiste.org ISSN 2224-719X (Paper) ISSN 2225-0638 (Online) Vol.16, 2013
34
Table 2 : Means, Standard Deviations(S.D.) and Correlation of heavy metal concentrations in
Ishaqi River and adjacent soil - north Baghdad
Heavy Metal Status Mean S. D. Correlation t-test P-value
Zn Adjacent soil 33.066 10.020
0.937 -2.066 0.053 River bank 42.590 10.583
Cu Adjacent soil 5.253 3.007
0.967 -2.185 0.042 River bank 9.082 4.653
Mn Adjacent soil 20.782 6.722
0.943 -1.939 0.068 River bank 26.780 7.110
Fe Adjacent soil 16.281 6.226
0.834 -3.216 0.005 River bank 25.150 6.105
Co Adjacent soil 1.084 0.678
0.724 -3.563 0.002 River bank 2.131 0.635
Ni Adjacent soil 46.316 7.755
0.786 -6.524 0.000 River bank 66.366 5.858
Cr Adjacent soil 0.847 0.142
0.852 -2.666 0.016 River bank 1.415 0.508
Cd Adjacent soil 1.587 1.301
0.919 -1.901 0.073 River bank 2.732 1.392
V Adjacent soil 3.956 0.440
0.024 -9.608 0.000 River bank 6.571 0.740
Pb Adjacent soil 8.341 6.463
0.993 -1.730 0.101 River bank 15.157 10.653
Advances in Physics Theories and Applications www.iiste.org ISSN 2224-719X (Paper) ISSN 2225-0638 (Online) Vol.16, 2013
35
Figure 1: Represents concentration variation of each metal in 10
sites

Advances in Physics Theories and Applications www.iiste.org ISSN 2224-719X (Paper) ISSN 2225-0638 (Online) Vol.16, 2013
36
Table 3: Classes of salinity and EC adapted from NRCS soil survey handbook.
Salinity Class EC (ds/m)
Non-saline 0 < 2
Very slightly saline 2 < 4
Slightly saline 4 < 8
Moderately saline 8 < 16
Strongly saline ≥ 16
Figure 2: Average Mean of Adjacent Soil and River Bank

Advances in Physics Theories and Applications www.iiste.org ISSN 2224-719X (Paper) ISSN 2225-0638 (Online) Vol.16, 2013
37
Figure 3: PH and EC in Adjacent Soil

This academic article was published by The International Institute for Science,
Technology and Education (IISTE). The IISTE is a pioneer in the Open Access
Publishing service based in the U.S. and Europe. The aim of the institute is
Accelerating Global Knowledge Sharing.
More information about the publisher can be found in the IISTE’s homepage:
http://www.iiste.org
CALL FOR PAPERS
The IISTE is currently hosting more than 30 peer-reviewed academic journals and
collaborating with academic institutions around the world. There’s no deadline for
submission. Prospective authors of IISTE journals can find the submission
instruction on the following page: http://www.iiste.org/Journals/
The IISTE editorial team promises to the review and publish all the qualified
submissions in a fast manner. All the journals articles are available online to the
readers all over the world without financial, legal, or technical barriers other than
those inseparable from gaining access to the internet itself. Printed version of the
journals is also available upon request of readers and authors.
IISTE Knowledge Sharing Partners
EBSCO, Index Copernicus, Ulrich's Periodicals Directory, JournalTOCS, PKP Open
Archives Harvester, Bielefeld Academic Search Engine, Elektronische
Zeitschriftenbibliothek EZB, Open J-Gate, OCLC WorldCat, Universe Digtial
Library , NewJour, Google Scholar


![Ecological Risk Assessment of Heavy Metals in Coastal ...the highest concentrations of toxic heavy metals in marine environment are found in sediments [1,6,7]. Coastal sediments are](https://img.pdfslide.net/doc/110x75/60777613a46f6a043806f637/ecological-risk-assessment-of-heavy-metals-in-coastal-the-highest-concentrations.jpg)