Embed Size (px)
Citation preview

NASA/TM--2000-210131 ./iv-- .,S
Analysis and Assessment of Peak
Lightning Current Probabilities
at the NASA Kennedy Space CenterD.L. Johnson
Marshall Space Flight Center, Marshall Space Flight Center, Alabama
W. W. Vaughan
University of Alabama in Huntsville, Huntsville, Alabama
May 1999
https://ntrs.nasa.gov/search.jsp?R=20000039434 2020-06-23T10:09:35+00:00Z

The NASA STI Program Office...in Profile
Since its founding, NASA has been dedicated tothe advancement of aeronautics and space
science. The NASA Scientific and Technical
Information (STI) Program Office plays a key
part in helping NASA maintain this importantrole.
The NASA STI Program Office'is operated by
Langley Research Center, the lead center forNASA's scientific and technical information. The
NASA STI Program Office prdvides access to the
NASA STI Database, the largest collection of
aeronautical and space science STI in the world. The
Program Office is also NASA's institutional
mechanism for disseminating the results of its
research and development activities. These results
are published by NASA in the NASA STI ReportSeries, which includes the following report types:
TECHNICAL PUBLICATION. Reports of
completed research or a major significant phase
of research that present the results of NASA
programs and include extensive data ortheoretical analysis. Includes compilations of
significant scientific and technical data andinformation deemed to be of continuing reference
value. NASA's counterpart of peer-reviewed
formal professional papers but has less stringent
limitations on manuscript length and extent of
graphic presentations.
TECHNICAL MEMORANDUM. Scientific and
technical findings that are preliminary or of
specialized interest, e.g., quick release reports,
working papers, and bibliographies that containminimal annotation. Does not contain extensive
analysis.
CONTRACTOR REPORT. Scientific and
technical findings by NASA-sponsored
contractors and grantees.
• CONFERENCE PUBLICATION. Collected
papers from scientific and technical conferences,
_ _symposia, seminars, or other meetings sponsored
or cosponsored by NASA.
• SPECIAL PUBLICATION. Scientific, technical,
or iaistorical _nformation from NASA programs,
prdjects, and mission, often concemed with
subjects having substantial public interest.
• TECHNICAL TRANSLATION.
English-language translations of foreign scientific
and technical material pertinent to NASA's
mission.
Specialized services that complement the STI
Program Office's diverse offerings include creatingcustom thesauri, building customized databases,
organizing and publishing research results...even
providing videos.
For more information about the NASA STI Program
Office, see the following:
• Access the NASA STI Program Home Page at
http://www.sti.nasa.gov
• E-mail your question via the Internet to
• Fax your question to the NASA Access Help
Desk at (301) 621-0134
• Telephone the NASA Access Help Desk at (301)
621-0390
Write to:
NASA Access Help Desk
NASA Center for AeroSpace Information7121 Standard Drive
Hanover, MD 21076-1320
NASA/TM--2000-210131
Analysis and Assessment of Peak
Lightning Current Probabilities
at the NASA Kennedy Space CenterD.L. Johnson
Marshall Space Flight Center, Marshall Space Flight Center, Alabama
W. W. Vaughan
University of Alabama in Huntsville, Huntsville, Alabama
National Aeronautics and
Space Administration
Marshall Space Flight Center • MSFC, Alabama 35812
May 1999

Acknowledgments
We acknowledge Hugh Christian, Douglas Mach, William Koshak, Dennis Boccippio, and their MSFC Global Hydrologyand Climate Center colleagues for advice, references, inputs, and reviews of the lightning probability section of this report.
Also appreciated are inputs and comments by Dawn Trout, Carolyn Goodloe, Tony Clark, Steve Pearson, O.E. Smith,
and Stanley Adelfang of the MSFC Electromagnetics and Aerospace Environments Branch (EL23). Thanks go to our NASA
Kennedy Space Center (KSC) colleague, John Madura at the KSC Weather Office, Michael Maier of Computer Sciences
Raytheon at Patrick Air Force Base, Wayne Ordway at NASA Johnson Space Center, and Mark Stanley at New MexicoInstitute of Technology, Socorro, NM, for their comments, encouragement, and help. Special thanks
to Margaret Alexander/EL23 for editing the draft and to Belinda Hardin, Memberof Technical Staff (Associate, CSC) for processing the manuscript.
Credit
Page ix: National Aeronautics and Space Administration photograph: Powerful electrical storm near
NASA Kennedy Space Center launch complex 39A prior to launch of STS-8, August 30, 1983.
Available from:
NASA Center for AeroSpace Information
7121 Standard Drive
Hanover, MD 21076-1320
(301) 62 i-0390
National Technical Information Service
5285 Port Royal Road
Springfield, VA 22161
(703) 487-4650
ii

PREFACE
This report presents a summary of lightning characteristics and lightning criteria for the protection
of aerospace vehicles and probability estimates for certain lightning strikes (peak currents of 200, 100,
and 50 kA) applicable to three operational phases of the Space Transportation System (STS) vehicle at
the NASA Kennedy Space Center, Florida. Presented are results of an extensive literature search to
compile information others developed for this area in order to answer key lightning current questions
posed by the Space Shuttle Program Office at the Johnson Space Center. Vehicle-triggered lightning
probability estimates for the various lightning current categories are still being worked. Section 4.5,
however, provides some insight on this subject.
iii
TABLE OF CONTENTS
1 INTRODUCTION l• . ....... ° * °*°. ° °. *° °. °...° ° .. ,.. ° ° ° ° °°. °° ° .°°. ° °° °° ° ° °. ** ° ° ° .°°. ° ° °° °°... °. ° °° ° °. ,. ° ° ° °° ° °. *° °°..°° ° °° .°° .° ° °°°.. •
2. LIGHTNING STRIKE PROBABILITY QUESTIONS ........................................................ 3
3. RESPONSE 4............. • ° .... .°°, ..... , ..... **°° ...... ,°°,,,°°°°°°,°°°°°°°,**°,°,°°°,°°°.. .... °°°.°°° .... *°°*°.°,,°°,,.,,°°.°°°°,°,°°,
4. RATIONALE....... '°' *°°..***°,°°°*°°°,.,,°°..,***°°°°H°.° .... ,°°° .... ,°,°°°°,,,°°°°,°°*** ..... °..°.°.,°*°°°°°,°**°°°.**°°°***°*°6° 5
4.1 Background 5............... • °,°,..,,, ..... ,°°.°,.°°°°,°°,,.°°,,.°°°, ...... ,°°°,°,°°°°°°°..,° ..... °**° .... °,.,°..,°,° .... ,,°,°,,,,
4.2 KSC Area and Pad Lightning .......................................................................................... 5
4.3 Probability forA >200, >100, and >50 kA Current Strike ............................................. 7
4.4 STS Vehicle Rollout Risk ................................................................................................ 9
4.5 STS Vehicle-Triggered Lightning ................................................................................... 10
5. CONCLUSIONS ............ •""'"'........... .... ................................. .... .................................. .... ...... 12
APPENDIX A--Literature Search 13........ °, .... ,**,,.,,.,,.,°,,°°°... ...... ,,°.,°°°.,, ..... ,,°°°.°.**°.°,,°°°°,°.,,°,.,,,,°°°,°,,°°°
A. 1 Lightning and Current Statistics ..................................................................................... 13
A.2 Positive Lightning ........................................................................................................... 13
A.3 Positive Superstrokes ...................................................................................................... 14
A.4 NLDN Statistics ....................................................................................................... 14
A.5 Sprites From Positive Flashes ......................................................................................... 14
A.6 Sprites Observed Over KSC ........................................................................................... 16
APPENDIX B--Space Shuttle Lightning Launch Commit Criteria ................................................ 18
REFERENCES 25...... ,,,,,,,.°.. .... , ...... ,.,°...,., ............. . .... ,°° ..... °,,...,°, ..... , ....... ,,.,°,.** ...... ,° ..... ,, ....... ,, ..... , ....
BIBLIOGRAPHY 29............. °°.,..,, ..... , ............... ..°..,, ...... ,, ...... ,,, ..... ,, ............. ,,,, .... ,°. ..... ***,°°,,., ...... °,,,°°
V
LIST OF FIGURES
1. Distribution of peak currents for first return stroke and subsequent strokes ......................... 6
LIST OF TABLES
°
2.
Probability estimates for natural CG lightning to strike STS vehicle during launch ............. 7
Estimated CPF's from figure 1 of <200, <100, and <50 kA peak lightning8
current occurrences ................................................................................................................
vi
ACRONYMS
AFB
CC
CG
CGLSS
CPF
CSC
EDT
EL23
ENE
ET
GBFM
IC
JSC
KSC
LCC
LPC
LPS
LST
MCS
MLP
MSFC
NASA
NLDN
NSTS
OTV
RP
RSS
SAE
SD
SLC
SRB
STS
TBD
TBP
TL
TM
U.S.
UTC
VAB
Air Force Base
continuing current; cloud to cloud
cloud to ground
cloud-to-ground lightning surveillance system
cumulative percentage frequency
Computer Sciences Corporation
eastern daylight time
Electromagnetics and Aerospace Environments BranchEast Northeast
external tank
ground-based field mills
in-cloud
Johnson Space Center
Kennedy Space Center
launch commit criteria
large peak currents
Lightning Protection Systemlocal standard time
mesoscale convective systems
mobile launch platform
Marshall Space Flight Center
National Aeronautics and Space Administration
National Lightning Detection Network
National Space Transportation Systemoperational television
return period (mean)
rotating service structure
Society of Automotive Engineersstandard deviation
space launch complex
solid rocket booster
Space Transportation Systemto be determined
to be published
triggered lightning
technical memorandum
United States
coordinated universal time
vehicle assembly building
vii
SYMBOLS AND ABBREVIATIONS
A
Av
av
elev
forfD
ft
h
K
kA
km
m
M
min
nm
P, PROB
PdPn
S
str
t
V/m
wk
Y, yr
approximatelyArea
vulnerability area
average
elevation
flash density
feet
hour
Kelvin
kilo amp
kilometer
meter
megaminute
nautical mile
probabilitydirect strike
nearby strike
second
lightning strike
exposure time
volts per meterweek
year
viii

PowerfulelectricalstormnearNASA KennedySpaceCenterlaunchcomplex39Aprior to launchof STS-8,August30, 1983.
ix


TECHNICAL MEMORANDUM
ANAINSIS AND ASSESSMENT OF PEAK LIGHTNING CURRENT PROBABILITIES
AT THE NASA KENNEDY SPACE CENTER
1. INTRODUCTION
On a cloudless day the electrical potential gradient in the atmosphere near the surface of the
Earth is relatively low (<300 V/m); but when clouds develop, this gradient increases. If the clouds
become large enough to have water droplets of sufficient size to produce rain, the atmospheric potential
gradient may result in a lightning discharge.
A variety of charge separation processes occurs at microphysical and cloud-size scales.I These
processes vary in importance depending on the developmental stage of convective clouds. It has been
suggested, however, that both induction and interface charging are the primary electrification mecha-
nisms in convective clouds. 2 Inductive charging involves bouncing collisions between particles in the
external field. The amount of charge transferred between the polarized drops at the moment of collision
depends on the time of contact, contact angle (no charge transferred at grazing collisions), charge
relaxation time, and net charge on particles. Interface charging involves the transfer of charge due to
contact or freezing potentials during collisions between rimming precipitation particles and ice crystals.
Sign and magnitude of the charge transfer depend on the temperature, liquid water content, and ice
crystal size and impact velocity.
The Earth-ionospheric system can be considered a large capacitor with the surface of the Earth
the negatively charged plate, the ionosphere the positively charged plate, and the atmosphere thedielectric.
When a cloud develops into the cumulonimbus state, lightning discharges result. For a discharge
to occur the potential gradient at a location reaches a value equal to the critical breakdown value of air
at that location. Laboratory data indicate a value as high as !M V/m at standard sea level atmospheric
pressure. Electrical fields measured at the surface of the Earth during lightning discharges are much
lower than 1M V/re. Reasons include the following:
1. Most clouds have centers of both polarities that tend to neutralize values measuredat the surface.
2. Each charge in the atmosphere and its image within the Earth resembles an electrical dipole.
The intensity of the electrical field decreases with the cube of the distance from the dipole.
3. Theatmosphericelectricfield measuredoverlandat thesurfaceof theEarth is limited bydischargecurrentswhicharisefrom groundedpointssuchasgrass,trees,andotherstructuresthationizetheair aroundthepointsandproducescreenspacecharges.
Lightning,a secondaryeffectof electrificationwithin athunderstormcloud system,is agiantelectricalsparkthatcanhaveapeakcurrentflow >200000A duringa fewmicroseconds.
Thunderresultsfrom suddenheatingof theair to =20000K by theflow of currentalonganarrowchannel.This flow of currentcanbe fromcloudto ground(CG) asseveralindividualstrokesseparatedby atenthof asecond.It canbefrom cloudto cloud(CC) in strokesnot readilyvisible fromthegroundbutwhichdiffusely illuminatethecloud.Theflow canalsobe from cloudthroughanaircraftor aerospacevehicleoperatingin thevicinity.About 1800thunderstormsareactiveoverthesurfaceoftheEarthatanygiventime.Lightning strikestheEarth--100timespersecond.
Whenlightningstrikesaprotectedor unprotectedobjectsuchasanaerospacevehicleonalaunchpad,thecurrentflows throughapathto trueground.Thevoltagedrop alongthispathmaybegreatenoughoverashortdistanceto bedangerousto peopleandequipment.While standingunderatreestruckby lightning,cattleandhumanshavebeenelectrocutedby thecurrentflow throughthegroundandthevoltagepotentialbetweentheir feet.
A staticchargemayaccumulateonanobjectsuchasanaerospacevehiclefrom its motionthroughanatmospherecontainingraindrops,iceparticles,or dust.A stationaryobject,if notgrounded,canaccumulatea chargefrom windborneparticles(often invisiblenuclei), rain, or snowparticlesstrikingtheobject.Thischargecanbuild until the localelectricfield at thepoint of sharpestcurvatureexceedsthebreakdownfield andtriggersa lightningdischarge.Thequantityof maximumchargedependson thesizeandshapeof theobject(especiallysharppointson thestructure).
If a chargebuildson a structure not grounded, discharges could ignite explosive gases or fuels,
interfere with radio cornmunications or telemetry, or cause severe shocks to people. Static electrical
charges occur most frequently during periods of low humidity in any geographical area.
Lightning protection assessment and design considerations are critical and important functions in
the development and design of an aerospace vehicle. The project lighting protection engineer must be
involved iq preliminary design and remain an integral ,nember of the design and development team until
construction of the vehicle is completed and all verification tests are accomplished. A National Aeronau-
tics and Space Administration (NASA) technical memorandum (TM) provides guidelines and an over-
view of considerations for an adequate lightning protection design. 3
This TM presents a summary of the probability of peak lightning strike currents to the NASA
Space Shuttle during rollout, on-pad, and boost/launch phases at the Kennedy Space Center (KSC).
2
2. LIGHTNING STRIKE PROBABILITY QUESTIONS
The NASA Johnson Space Center (JSC) Shuttle Systems Integration Office requested the
Electromagnetics and Aerospace Environments Branch (EL23) of the Marshall Space Flight Center
(MSFC) to provide probabilities for three peak lightning strike currents (i.e., 200, 100, and 50 kA) which
could occur if the Space Transportation System (STS) vehicle is hit by a lightning CG return stroke
during rollout, while on-pad, and for triggered lightning on ascent. This is referred to as question A. The
answer to this question is needed in order to provide lightning criteria applicable to a new STS avionics
box. Question B asked if all lightning launch commit criteria (LCC) rules are followed, what is the
probability of a 200, 100, and 50 kA peak current lightning strike while the STS vehicle is in the boost/
launch phase. The response given in this technical memorandum provides estimates for these questions.
Annual probabilities are expressed in percent and mean return period (RP) in years. Currents are ex-
pressed in kiloamps (kA). The launch site is KSC space launch complex 39 (SLC 39).

3. RESPONSE
Question A:
Rollout to pad (evening hours, no forecasting considered)
Lightning Peak Current >200 kA >100 kA
Point Probability Prob % _ Prob % RPy_£
Worst Case 0.002 180 45 963 0.005 90 16 934
KSC SLC 40 0.000 037 2 681 000 0.000 31 322 000
On-pad (STS vehicle protected by pad Lightning Protection System (LPS)
Lightning Peak Current >200 kA > 100 kA
Point Probability _Prob % _ Prob___._._%
Worst Case 0.002 260 44 220 0.061 38 1 629
KSC SLC 40 0.000 390 258 000 0.003 23 30954
>50 kA
Prob.______%
0.011 500 8696
01004 040 24 749
>50 kA
Prob %
0.119 53 837
0.042 00 2 381
Launch (lightning triggered by vehicle) (see sec. 4.5 STS Vehicle-Triggered Lightning)
Lightning Peak Current >200 kA >i00 kA >50 kA
Point Probability Prob % _ Pr__ob% RP_E_ Prob%
Worst Case TBD TBD TBD
KSC SLC 40 TBD TBD TBD
Question B:
Launch (STS protected by LCC storm distance rule only)
Lightning Peak Current >200 kA >100 kA
Point Probability Prob % _ .Prob %
KSC SLC 40 0.000 304 329 000 0.008 250 121 000
>50 kA
.Prob %
0.001 610 62 274
4

4. RATIONAL
4.1 Background
Lightning statistics and procedures from five published reports dealing with lightning
probabilities and the Florida/KSC/pad area are presented in this report. 4-8 Two key general references
were consulted regarding extreme lightning peak current cumulative percentage frequencies (CPF). 9,1°
A technical summary using three key KSC references (Stahman, Mach, and Chai) is given in
section 4.2. 5-7 Appendix A presents additional information from the literature on CG lightning stroke
peak current characteristics and statistics.
4.2 KSC Area and Pad Lightning
Since 1979 the Lightning Protection System (LPS) on SLC 39A at KSC was struck by lightning
an average of three times per year. 5 Stahmann's theoretical probability calculations for lightning striking
the 122-m (400-ft) tower are two strokes per year and produce an average peak current amplitude of 122
kA. 5 All calculations were based on a pad stroke density of 20 strokes/km2/yr.
Six years (1990 to 1995) of CG lightning surveillance system (CGLSS) measurements for Cape
Canaveral SLC 40 were analyzed and published by Chai. 7 His paper presents a summary of = 6 200 CG
events at or near (within 5 nmi) SLC 40. The absolute maximum peak current measured was -284 kA
(negative); the positive current peak was 144 kA. The 5-year total mean current peak was =30.5 kA
(standard deviation (SD) value =14.5 kA). The associated negative mean peak current was -30.9 kA; tiae
positive was 23.3 kA. A plot of the lightning peak current CPF for SLC 40 is shown in figure I (200 kA
peak current =99.9 percentile). Of the 6 186 flashes, 94.5 percent were negative and 5.5 percent positive.
Also, 91 percent of the flashes occurred from June through September and 9 percent from October
through May. Only three SLC 40 the flashes carried current >200 kA (i.e., -284, -281, and -203 kA).
These strikes ranged from 1.9 to 4.9 nmi from SLC 40. The probability for natural lightning current
>200 kA to occur within 5 nmi of SLC 40 per year is estimated to be 0.051 30 percent (l event in =! 950
yr). 7 This is an "area" probability and not a "point" probability.
A paper entitled "Shuttle Lightning Threat Analysis" by Mach gave lightning probability esti-
mates for various Space Shuttle operational phases. 6 Mach emphasized all his probabilities are estimates
and could be in error by more than an order of magnitude. In addition, his estimates do not account for
all possible pathways for lightning to damage the STS systems. 6 The three operational phases in his
paper of main interest in this report are rollout, on-pad, and launch.
During rollout, high current (200 kA) damage to the solid rocket booster (SRB) and continuing
current (CC) to the external tank (ET) are the greatest possibilities for major Space Shuttle damage. 6
The probability for lightning damage to the SRB is I in 3 20000 yr (or 3.1×[0 -7) and to the ET, I in55 000 yr (or 1.9x10⁻⁵).
99.99 99.9 99 98 95 90 80 70 60 50 40 30 20 10 5 2 1 0.1 0.011000 1000
¢D
p.
tJ
,Jl¢
OQ.
100 ,
10
FirstReturnStroke
SubsequentReturnStrokes
2OkA
100
"_ _._ _ Uman-., ,.. -- - _ 1st(-)"_ 3.1 k_,"_
10kA "_, KSC1st"%
"%,%
Uman"- 2nd (-)
3.1 kA1.5 kA
1 10.01 O.i 1 2 5 10 20 3040506070 80 90 95 98 99 99.9 99.99
% > Ordinate
10
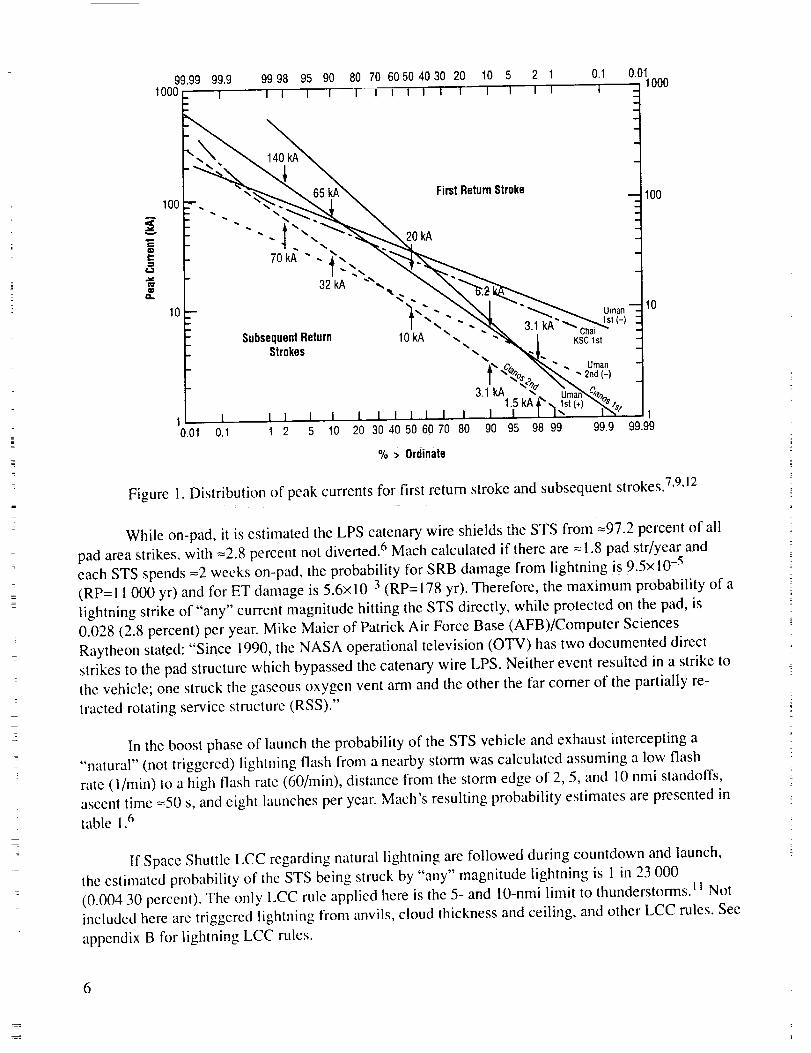
Figure 1. Distribution of peak currents for first return stroke and subsequent strokes. 7'9'12
While on-pad, it is estimated the LPS catenary wire shields the STS from =97.2 percent of all
pad area strikes, with =2.8 percent not diverted. 6 Mach calculated if there are = 1.8 pad str/year and
each STS spends =2 weeks on-pad, the probability for SRB damage from lightning is 9.5x 10⁻⁵
(RP=I 1 000 yr) and for ET damage is 5.6x10 -3 (RP=I78 yr). Therefore, the maximum probability of a
lightning strike of "any" current magnitude hitting the STS directly, while protected on the pad, is
0.028 (2.8 percent) per year. Mike Maier of Patrick Air Force Base (AFB)/Computer Sciences
Raytheon stated: "Since 1990, the NASA operational television (OTV) has two documented direct
strikes to the pad structure which bypassed the catenary wire LPS. Neither event resulted in a strike to
the vehicle; one struck the gaseous oxygen vent ann and the other the far corner of the partially re-
tracted rotating service structure (RSS)."
In the boost phase of launch the probability of the STS vehicle and exhaust intercepting a
"natural" (not triggered) lightning flash from a nearby storm was calculated assuming a low flash
rate (l/rain) to a high flash rate (60/rain), distance from the storm edge of 2, 5, and 10 nrni standoffs,
ascent time =50 s, and eight launches per year. Mach's resulting probability estimates are presented in
table 1.6
If Space Shuttle LCC regarding natural lightning are followed during countdown and launch,
the estimated probability of the STS being struck by "any" magnitude lightning is 1 in 23 000
(0.004 30 percent). The only LCC rule applied here is the 5- and 10-nmi limit to thunderstorms. ]1 Not
included here are triggered lightning from anvils, cloud thickness and ceiling, and other LCC rules. See
appendix B for lightning LCC rules.
6

Question A:
Table 1.
ExposureTimet(sec)
50505050
Probability estimates for natural CG lightning
to strike STS vehicle during launch*
StandoffFromStormEdge(nmi)
25 (LCC)
10(LCC)10(LCC)
StormSeverityFlashRate(min-1)
High = 60Avg = 6Low = 1High =60
ProbabilityPerYear(%)
0.625000.004340.000070.00434
ProbabilityRP(yr)
16023000
130000023000
*Assuming eight STS launches per year (Mach) 6
4.3 Probability for A >200, >100, and >50 kA Current Strike
The three references mentioned in section 4.1 provided the main statistics to develop the
conclusions in this section. 5-7 To estimate the probability for "any" peak current strike to the STS,
use the higher probability of lightning intercepting the STS (either on-pad 2.8 percent or in-flight
0.004 30 percent). Since the on-pad STS strike probability is higher, multiply the average strikes to
pad per year (3) by the probability of lightning striking the STS (0.028) by the 2-week pad exposure(0.038 46 yr). Results are
3xO.O28xO.03846 = 0.00323 str/yr or (0.323 percent and RP=310 yr) (])
This estimated probability includes "all" possible strike magnitude currents. To estimate the
probability of a >200, >100, or >50 kA strike, the proper (most representative) peak current CPF is used.
The probability of strong CG negative lightning and stronger CG positive lightning currents was applied
(but not the lower current-triggered lightning current probabilities). In the 1990 "Lightning Protection
of Aircraft," Fisher used the old 1972 Cianos peak current plot (fig. I) and gave 140 kA current at the
98 percentile. 10,12 Lightning peak currents fit a log-normal probability distribution well. 10,13 Uman's
peak current summary curves of first return stroke peak current CPF for both negative and positive
flashes and Chai's SLC 40 peak current CPF are also shown in figure I. 7,9 Much disagreement exists asto which lightning peak current probability curve to use. 9
Uman's first return stroke peak current has a range of 20 to 40 kA with median value of =30 kA
for negative flashes and =35 kA for positive flashes and <200 kA occurring at the =99 percentile level.
The Uman 95 percentile negative first stroke peak current is <80 kA and the positive first stroke is
<250 kA. 9 With exception of Uman's positive stroke curve, the more recent CPF current plots seem to
parallel each other and slope differently from the standard 1972 Cianos plots. 12 Table 2 presents the
various extreme probabilities for a <200, <100, and <50 kA peak return stroke CG lightning current bythe various investigators.
For the KSC area, use any of the first return stroke peak current CPF curves in figure 1 for
negative (and the higher magnitude positive) strokes. This partially answers question A. The Chai
CGLSS/SLC pad 40 lightning current statistics, however, may be more applicable and realistic for theSLC 39 area.
7
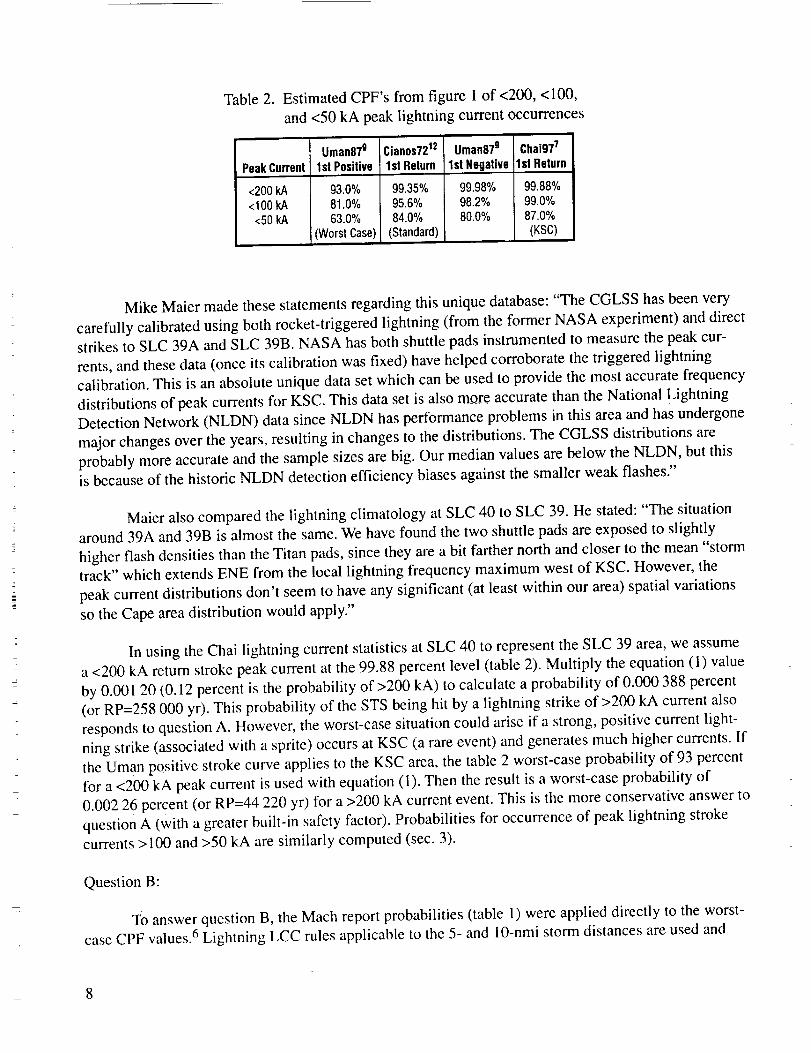
Table 2. Estimated CPF's from figure 1 of <200, <100,
and <50 kA peak lightning current occurrences
Peak Current
<200kA<100kA
<50 kA
Uman879
1st Positive
93.0%81.0%63.0%
i (Worst Case)
Cianos7212
1st Return
99.35%95.6%84.0%
(Standard)
Uman879
1st Negative
99.98%
98.2%80.0%
Chai977
1st Return
99.88%99.0%87.0%
(KSC)
Mike Maier made these statements regarding this unique database: "The CGLSS has been very
carefully calibrated using both rocket-triggered lightning (from the former NASA experiment) and direct
strikes to SLC 39A and SLC 39B. NASA has both shuttle pads instrumented to measure the peak cur-
rents, and these data (once its calibration was fixed) have helped corroborate the triggered lightning
calibration. This is an absolute unique data set which can be used to provide the most accurate frequency
distributions of peak currents for KSC. This data set is also more accurate than the National Lightning
Detection Network (NLDN) data since NLDN has performance problems in this area and has undergone
major changes over the years, resulting in changes to the distributions. The CGLSS distributions are
probably more accurate and the sample sizes are big. Our median values are below the NLDN, but this
is because of the historic NLDN detection efficiency biases against the smaller weak flashes."
Maier also compared the lightning climatology at SLC 40 to SLC 39. He stated: "The situation
around 39A and 39B is almost the same. We have found the two shuttle pads are exposed to slightly
higher flash densities than the Titan pads, since they are a bit farther north and closer to the mean "storm
track" which extends ENE from the local lightning frequency maximum west of KSC. However, the
peak current distributions don't seem to have any significant (at least within our area) spatial variations
so the Cape area distribution would apply."
In using the Chai lightning current statistics at SLC 40 to represent the SLC 39 area, we assume
a <200 kA return stroke peak current at the 99.88 percent level (table 2). Multiply the equation (1) value
by 0.001 20 (0.12 percent is the probability of >200 kA) to calculate a probability of 0.000 388 percent
(or RP=258 000 yr). This probability of the STS being hit by a lightning strike of >200 kA current also
responds to question A. However, the worst-case situation could arise if a strong, positive current light-
ning strike (associated with a sprite) occurs at KSC (a rare event) and generates much higher currents. If
the Uman positive stroke curve applies to the KSC area, the table 2 worst-case probability of 93 percent
for a <200 kA peak current is used with equation (1). Then the result is a worst-case probability of
0.002 26 percent (or RP=44 220 yr) for a >200 kA current event. This is the more conservative answer to
question A (with a greater built-in safety factor). Probabilities for occurrence of peak lightning stroke
currents >100 and >50 kA are similarly computed (sec. 3).
Question B:
To answer question B, the Mach report probabilities (table 1) were applied directly to the worst-
case CPF values. 6 Lightning LCC rules applicable to the 5- and 10-nmi storm distances are used and
8

only naturalCG (not triggered)lightning isassumed.ObservingLCC stormdistancerulesto calculatethepointprobability that theSTSwouldbestruck"naturally" onascentby a>200kA lightning-inducedpeakcurrent,multiply thetable1probability (0.00434) for "any" currentby theworst-caseprobability(0.07)to computearesultantvehicle-hitprobabilityof 0.0003038 percent(or RP=I in 329 164yr).
4.4 STS Vehicle Rollout Risk
To calculate the probability of a 200-kA current lightning strike to the STS during rollout, the
following assumptions were used. The height of the Space Shuttle atop the mobile launch platform
(MLP) and crawler is ---235 feet (72 m) above ground level. The horizontal dimensions of the MLP are
135 feet by i 60 feet for an =21 600 feet 2 (2 007 m 2) strike area. The terrain is assumed flat and level for
the =6-hr trip over the 4.2-mi distance from the vehicle assembly building (VAB) to pad 39B.
To determine the probability of "any" magnitude lightning strike (str) to "any" square area (A)
on the ground (between the VAB and pad 39) of 2 007 m 2, use the KSC annual flash density (f) of
20 strikes/km2/yr. Assuming a Poisson distribution as indicated by Santis, 8 the probability any flat
surface will be hit by any magnitude lightning in a certain number of years is
Y (yr) = I/(Axj') (2)
Hence,
Y = 24.91 yr/str or Py,. = 0.04014 str/yr (4.01%) (3)
To calculate the probability of a 200-kA current strike at KSC, apply the table 2 worst-case probability
(0.070) with other key parameters (elevated vehicle, worst month, 6-hour exposure period, and bestdiurnal time to roll out).
For an object 235 feet tall, Viemeister 14 presents a chart (fig. 50) indicating an isolated tower or
object up to 600 feet (on level terrain) located in a moderate (30 thunderstorm days/yr) lightning envi-
ronment has the probability of lightning strikcs directly related to height (i.e., an object 235 ft tall will be
hit twice as often as a ! 17-feet object). Viemeister's strike value for 235-fl height is I lightning strike per
year. Since the KSC area has more thunderstorm days (76) than Viemeister (30), this strike value of I is
multiplied by 2.533 (76/30) for 2.533 strikes per year. This figure is close to reality because elevated pad
39 is hit directly by lightning approximately two or three times per year. 5 Therefore,
P(yr clev) = (0.04014 str/yr) x (2.533) = 0. I0 !67 str/yr (or P (yr elcv) = l 0.17%) (4)
Since monthly analysis is needed, this yearly probability is converted to a monthly (any month) prob-ability by dividing by 12 to obtain
P(mo clcv)= 0.008473 (or P(mo elcv) = 0.847%) (5)
f_\
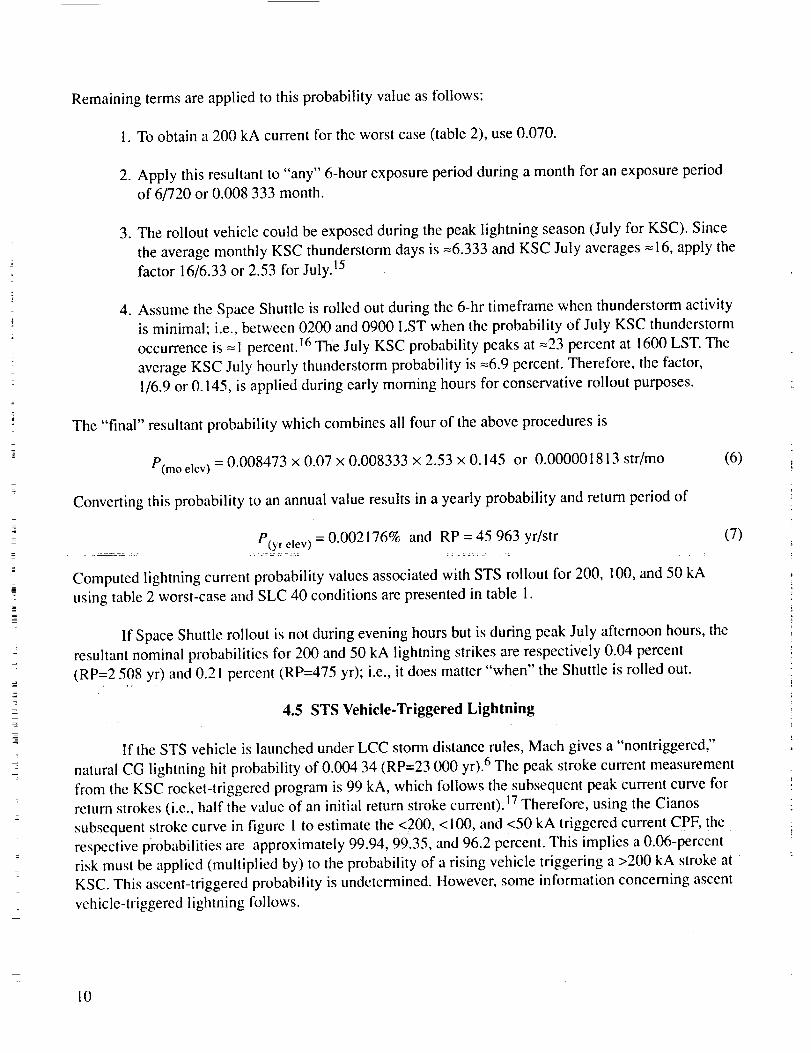
Remaining terms are applied to this probability value as follows:
1. To obtain a 200 kA current for the worst case (table 2), use 0.070.
2. Apply this resultant to "any" 6-hour exposure period during a month for an exposure period
of 6/720 or 0.008 333 month.
. The rollout vehicle could be exposed during the peak lightning season (July for KSC). Since
the average monthly KSC thunderstorm days is =6.333 and KSC July averages =16, apply the
factor 16/6.33 or 2.53 for July. 15
. Assume the Space Shuttle is rolled out during the 6-hr timeframe when thunderstorm activity
is minimal; i.e., between 0200 and 0900 LST when the probability of July KSC thunderstorm
occurrence is = 1 percent. 16 The July KSC probability peaks at =23 percent at 1600 LST. The
average KSC July hourly thunderstorm probability is =6.9 percent. Therefore, the factor,
I/6.9 or 0.145, is applied during early morning hours for conservative rollout purposes.
The "final" resultant probability which combines all four of the above procedures is
P(mo etev) = 0.008473 × 0.07 × 0.008333 × 2.53 × 0.145 or 0.000001813 str/mo
Convening this probability to an annual value results in a yearly probability and return period of
(6)
0.002176% and RP = 45 963 yr/str (7)P{yr elev) =
Computed lightning current probability values associated with STS rollout for 200, 100, and 50 kA
using table 2 worst-case and SLC 40 conditions are presented in table i.
If Space Shuttle rollout is not during evening hours but is during peak July afternoon hours, the
resultant nominal probabilities for 200 and 50 kA lightning Strikes are respectively 0.04 percent
(RP=2 508 yr) and 0.21 percent (RP=475 yr); i.e., it does matter "when" the Shuttle is rolled out.
4.5 STS Vehicle-Triggered Lightning
If the STS vehicle is launched under LCC storm distance rules, Mach gives a "nontriggered,"
natural CG lightning hit probability of 0.004 34 (RP=23 000 yr). 6 The peak stroke current measurement
from the KSC rocket-triggered program is 99 kA, which follows the subsequent peak current curve for
return strokes (i.e., half the value of an initial return stroke current). 17 Therefore, using the Cianos
subsequent stroke curve in figure 1 to estimate the <200, <100, and <50 kA triggered current CPF, the
respective probabilities are approxirnately 99.94, 9935' and 96.2 percent. This implies a 0.06-percent
risk must be applied (multiplied by) to the probability of a rising vehicle triggering a >200 kA stroke at
KSC. This ascent-triggered probability is undetermined. However, some information concerning ascent
vehicle-triggered lightning follows.
10
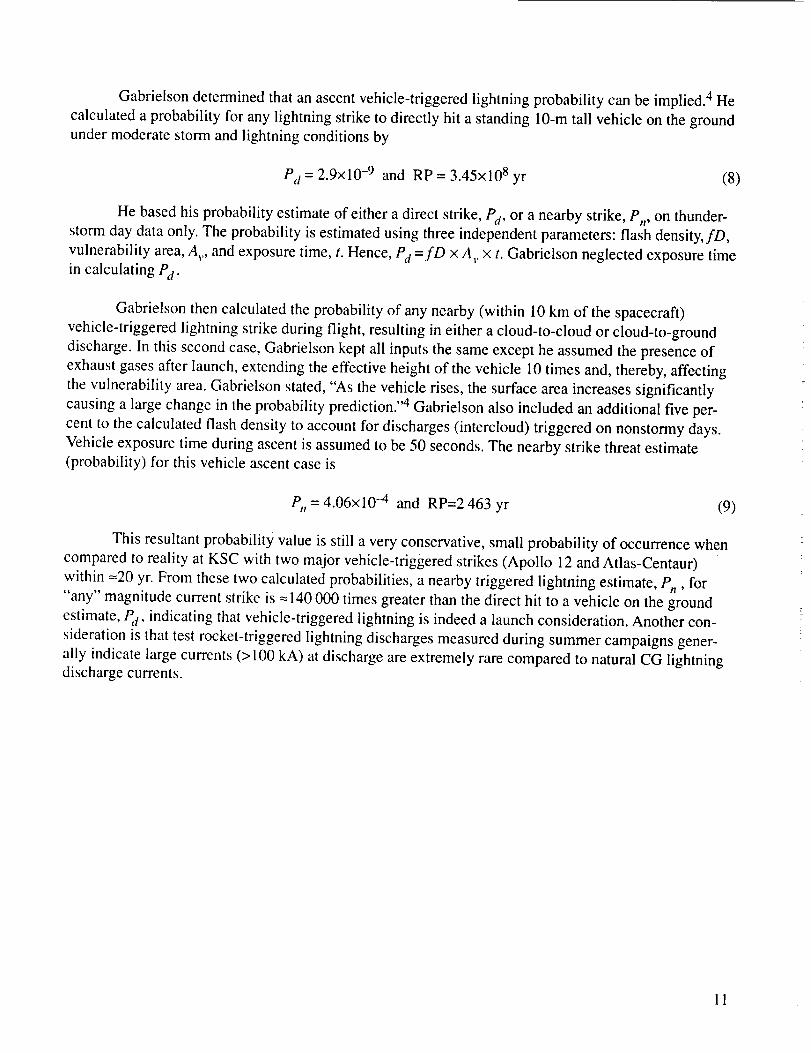
Gabrielsondeterminedthatanascentvehicle-triggeredlightningprobabilitycanbe implied.4Hecalculatedaprobability for anylightningstriketo directly hit a standing10-mtall vehicleon thegroundundermoderatestormandlightningconditionsby
Pd = 2"9x10⁻⁹ and RP = 3.45x10⁸ yr (8)
He based his probability estimate of either a direct strike, Pd, or a nearby strike, Pn' on thunder-
storm day data only. The probability is estimated using three independent parameters: flash density, fD,
vulnerability area, Av, and exposure time, t. Hence, Pd =fD x A,. x t. Gabrielson neglected exposure time
in calculating Pd"
Gabrielson then calculated the probability of any nearby (within 10 km of the spacecraft)
vehicle-triggered lightning strike during flight, resulting in either a cloud-to-cloud or cloud-to-ground
discharge. In this second case, Gabrielson kept all inputs the same except he assumed the presence of
exhaust gases after launch, extending the effective height of the vehicle 10 times and, thereby, affecting
the vulnerability area. Gabrielson stated, "As the vehicle rises, the surface area increases significantly
causing a large change in the probability prediction. ''4 Gabrieison also included an additional five per-
cent to the calculated flash density to account for discharges (intercloud) triggered on nonstormy days.
Vehicle exposure time during ascent is assumed to be 50 seconds. The nearby strike threat estimate(probability) for this vehicle ascent case is
P,t = 4.06×10 -4 and RP=2 463 yr (9)
This resultant probability value is still a very conservative, small probability of occurrence when
compared to reality at KSC with two major vehicle-triggered strikes (Apollo 12 and Atlas-Centaur)
within =20 yr. From these two calculated probabilities, a nearby triggered lightning estimate, Pn, for
"any" magnitude current strike is =140 000 times greater than the direct hit to a vehicle on the ground
estimate, Pd' indicating that vehicle-triggered lightning is indeed a launch consideration. Another con-
sideration is that test rocket-triggered lightning discharges measured during summer campaigns gener-
ally indicate large currents (> 100 kA) at discharge are extremely rare compared to natural CG lightningdischarge currents.
11

5. CONCLUSIONS
Estimates for the JSC questions concerning KSC SLC 39 "worst-case" lightning probabilities for
the STS vehicle are determined. Section 3 also presents KSC SLC 40 results.
The answer to JSC question A is the probability of a >200 kA peak lightning current strike to the
STS vehicle while protected on-pad is 0.002 26 percent with an RP of I in 44 220 yr.
The answer to JSC question B is the probability of a >200 kA peak natural lightning current
occurring on or near the launched STS while following the lightning LCC distance to storm rule only is
0.000 303 8 percent with an RP of 1 in 329 000 yr. Other lightning LCC rules such as anvil, thick cloud,
ceiling, etc. were not applied.
The answer to the JSC question regarding rollout is the probability of a >200 kA peak lightning
current strike to the STS during the 6-hour rollout in the worst KSC lightning month (July) and most
lightning inactive time of day (night hours) is 0.002 18 percent with an RP of 1 in 45 963 yr. Man fore-
casting is not considered here; but at KSC a weather forecast always precedes STS rollout. However, the
best condition, real-time forecast still allows for an = 10 percent chance of any lightning strike.
The answer to the JSC question regarding launch-triggered lightning is that the probability of a
>200 kA lightning strike current occurring is undetermined. However, a "triggering" factor of = 140 000
increase in probability and RP has been determined from one special case in the literature and will be
investigated to see if it applies to this question.
Lightning strike possibilities to the STS also exist during space shuttle exposure at locations
other than KSC, i.e., on the Edwards AFB runway for up to a week atop the Boeing 747 aircraft during
the return trip (no clouds or adverse weather present) to KSC. These operations are not included in this
report.
A reminder by the authors and Mach is the concluding probabilities in this report are estimates
only and can be greatly in error. 6 To quote Gabrielson, "It is difficult, if not impossible, to establish a
probability for lightning strikes with a high level of confidence. ''4
12

APPENDIX A Literature Search
This appendix presents a summary of key information from the literature on recent CG lightning
stroke peak current statistics and its application to this analysis for the STS vehicle at KSC.
A.1 Lightning and Current Statistics
Most lightning discharges produced by summer thunderstorms at KSC originate in the cloud
and lower (carry) negative charge to Earth in CG flashes. In-cloud (IC) lightning generally accounts for
--60 percent of all lightning occurrences with =40 percent as CG. 18 However, Boccippio believes that
this IC:CG ratio of 3:2 should be lowered. He states, "3:1 to 5:1 ratios are more in line with what the
lightning community tends to quote and have been confirmed by recent results from the NASA OTV
sensor." Peak currents generated in the first return CG stroke typically are 30 kA and range to a maxi-
mum of 250 kA. 9'12'19 Subsequent return strokes are typically one-half (=15 kA) the initial return stroke.
Negative flashes to ground account for =90 percent of the total CG's with positive flashes accounting for
--10 percent. Orville gives values <10 percent positive in summer storms compared to >50 percent
positive in winter for an entire year of data over the eastern U.S. 20,21 Fuquay reported only =3 percent
positive flashes (summertime, Rocky Mountains) and Reap --4 percent positive flashes (summer season,
entire U.S.). 21 However, a fraction of the positive lightning flashes can involve the highest measured
peak currents, more than generated from negative flashes. 10,19,22,23
A.2 Positive Lightning
Natural CG positive lightning occurrences are responsible for the largest recorded lightning peak
currents in the 200 to 300 kA range. 9 Positive lightning can be initiated from tall buildings and towers by
an upward-moving leader with no first return stroke of the type associated with downward (CG) initiated
flashes. 9"19 Winter thunderstorms, dissipating storms, and rocket-initiated triggered lightning generally
bring a higher percentage occurrence of positive charge to ground. 19,21 The occurrence frequency of the
positive flashes apparently increases with increasing latitude and elevation or from a low-level cloud
base. 19 From available measurements, there is no difference between the currents to towers and those to
ground. 9 An interesting conclusion from the 1983 to 1986 Florida triggered lightning studies was all
flashes triggered were of the classic type which lowered negative charge. 9 The Florida triggered light-
ning study in 1990 and in Alabama in 1991 lowered negative charge also and reported a 38 kA peak
current measurement. 24 The fact that positive flashes are less common at KSC latitudes is evidenced by
Mach's analysis of 130 KSC strokes in 1986. Of these, 86 were negative CG natural, 4 ! negative trig-
gered, 1 positive triggered, and 2 positive CG natural strokes (97.7 percent negative and 2.3 percent
positive). The 86 negative CG strokes had a peak current of 84 kA while the two positive CG strokes had
peak current values of 125 kA and 150 kA. 2-s Hence, peak positive currents should still be considered.
Rocket-triggered flash currents peaked at 60 kA (mean 15 kA) from 1985 to 1987. 26 The entire 1984 to
1991 summer rocket-triggered lightning program at KSC produced only one peak return stroke current
of magnitude 99 kA. [7 Artificially triggered lightning strokes are very similar to the subsequent strokes
of natural lightning. 24,27 Triggered lightning current strikes to instrumented aircraft have generally been
of lower amplitude than natural CG lightning measured at ground level. 9,1°
13
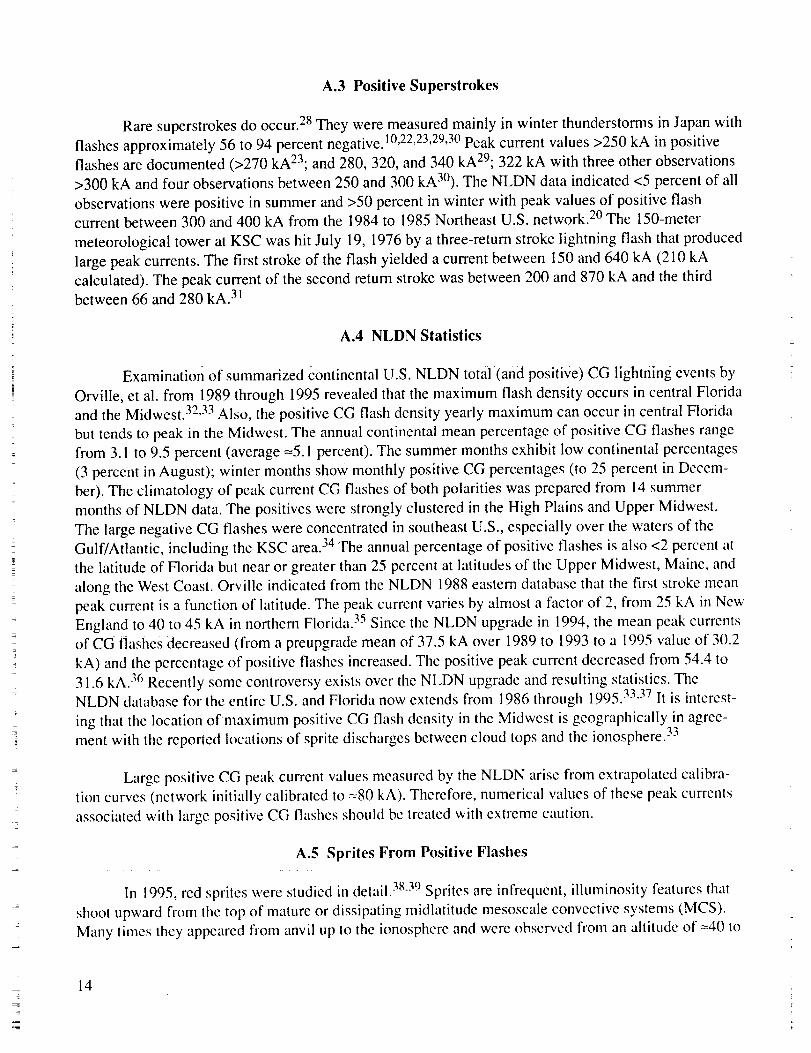
A.3 PositiveSuperstrokes
Rare superstrokes do occur. 28 They were measured mainly in winter thunderstorms in Japan with
flashes approximately 56 to 94 percent negative.I°,22,23,29,3° Peak current values >250 kA in positive
flashes are documented (>270 kA23; and 280, 320, and 340 kA29; 322 kA with three other observations
>300 kA and four observations between 250 and 300 kA3°). The NLDN data indicated <5 percent of all
observations were positive in summer and >50 percent in winter with peak values of positive flash
current between 300 and 400 kA from the 1984 to 1985 Northeast U.S. network. 2° The 150-meter
meteorological tower at KSC was hit July 19, 1976 by a three-return stroke lightning flash that produced
large peak currents. The first stroke of the flash yielded a current between 150 and 640 kA (210 kA
calculated). The peak current of the second return stroke was between 200 and 870 kA and the third
between 66 and 280 kA. 31
A.4 NLDN Statistics
Examination of summarized continental U.S. NLDN total (and positive) CG lightning events by
Orville, et al. from 1989 through 1995 revealed that the maximum flash density occurs in central Florida
and the Midwest. 32'33 Also, the positive CG flash density yearly maximum can occur in central Florida
but tends to peak in the Midwest. The annual continental mean percentage of positive CG flashes range
from 3.1 to 9.5 percent (average =5.1 percent). The summer months exhibit low continental percentages
(3 percent in August); winter months show monthly positive CG percentages (to 25 percent in Decem-
ber). The climatology of peak current CG flashes of both polarities was prepared from 14 summer
months of NLDN data. The positives were strongly clustered in the High Plains and Upper Midwest.
The large negative CG flashes were concentrated in southeast U.S., especially over the waters of the
Gulf/Atlantic, including the KSC area. 34 The annual percentage of positive flashes is also <2 percent at
the latitude of Florida but near or greater than 25 percent at latitudes of the Upper Midwest, Maine, and
along the West Coast. Orville indicated from the NLDN 1988 eastern database that the first stroke mean
peak current is a function of latitude. The peak current varies by almost a factor of 2, from 25 kA in New
England to 40 to 45 kA in northern Florida. 35 Since the NLDN upgrade in 1994, the mean peak currents
of CG flashes decreased (from a preupgrade mean of 37.5 kA over 1989 to 1993 to a 1995 value of 30.2
kA) and the percentage of positive flashes increased. The positive peak current decreased from 54.4 to
31.6 kA. 36 Recently some controversy exists over the NLDN upgrade and resulting statistics. TheNLDN database for the entire U.S. and Florida now extends from 1986 through 1995. 33.37 It is interest-
ing that the location of maximum positive CG flash density in thc Midwest is geographically in agree-
ment with the reported locations of sprite discharges between cloud tops and the ionosphere. 33
Large positive CG peak current values measured by the NLDN arise from extrapolated calibra-
tion curves (network initially calibrated to ---80 kA). Therefore, numerical values of these peak currents
associated with large positive CG flashes should bc treated with extreme caution.
A.5 Sprites From Positive Flashes
In 1995, red sprites were studied in detail. 38"39 Sprites are infrequent, illuminosity features that
shoot upward from the top of mature or dissipating midlatitude mesoscale convective systems (MCS).
Many times they appeared from anvil up to the ionosphere and wcre observed from an altitude of =40 to
14

95km.40TheMCS regionsproducednegativeCG strokesandpositives(with largepeakreturnstrokecurrents)from thestratiformprecipitationregions.In 1994BoccippiocomparedtheNLDN observationswith twodaysof spriteoccurrencesin theMidwest.For thesestormsystems,---85percentof all spriteeventscoincidedwith positiveCG eventsandexhibitedhigherpeak(>400kA) CGcurrent.This istwo timesgreaterthanthesubsetof positiveCG strokeswith nosprites.41ThespritepeakcurrentswereasmuchasthreetimeslargerthanthemediannegativeCGpeakcurrentobservedduringthis sameperiod.
Spritesoccurin thunderstormareacomplexeswheretheratioof positiveto negativeCG light-ning is higherthanusual.42Otherground-based(1993to 1997)andaircraft researchwasdonein Colo-radoandoverKansas,Nebraska,Minnesota,theSoutheast, etc. 34,40,41 The relationship between sprites,
Q-bursts, and positive CG strokes was confirmed and preference established to occur in decaying por-
tions of thunderstorms. 40,42-44 Lyons says the possibility exists that sprite flashes may be hazardous to
spacecraft and aircraft. 45 Sprites, however, appear weak compared to the CG strikes, despite beingdirectly related.
The best places in the U.S. to observe sprites are above the northern High Plains and Upper
Midwest in a broad belt from Colorado to North Dakota, to Minnesota, and down to Texas. Sprites
can occur above strong storms worldwide. 41 Using the CG NLDN climatology, an estimate was made
of the chance of the Space Shuttle encountering a sprite (or elve) during descent to KSC. The probability
is =1 in 100 (higher than the chance of a direct strike by conventional lightning during conditions con-
ducive to thunderstorm activity). 34 All lightning does not produce sprites. Approximately 40 percent of
lightning is CG. Only 5 to 10 percent of CG flashes are positives. Of the positive strokes only =10
percent create sprites. 18 Sprites are mentioned in this paper because the strongest currents generated
from CG lightning strikes appear to be associated with sprite occurrences to the ionosphere. As state-of-
the-art sprite research continues, peak CG lightning current extremes and probability of occurrence willbe understood better.
Lyons recently presented some interesting U.S. NLDN CG statistics derived from =60M CG
flashes over 14 summer months (June through September) from 1991 through 1995. 46 CG polarity,
diurnal features, multiplicity, and LPC >75, _>200, and _>400 kA are presented for the entire U.S. and
for the central U.S. which coincides with the heart of the sprite belt from 30 to 50 °N latitude and 88 to
110 °W longitude.
Lyons concluded the following: The average positive (+) CG peak current for the entire U.S. is
35.5 kA (with a peak occurrence of 580 kA); the average negative (-) CG peak current is 30.4 kA (with
a peak occurrence of 957 kA). For the entire U.S. =95 percent of all CG flashes are negative in polarity
with -_87 percent LPC -CG's, i.e., CG's _>75kA. This indicates that the vast majority of "LPC" strokes
nationally are negative in polarity. However, for the central U.S. =70 percent of all LPC CG's are nega-
tive (about 30 percent positive). These positive CG's in the central U.S. constitute ---67 percent of all
national NLDN LPC +CG's. This makes the region one of high positive CG count where sprites occur
most frequently. In the central U.S. the occurrence of positive and negative LPC CG's, as a percent of allLPC CG's, is _9 and 22 percent, respectively.
15
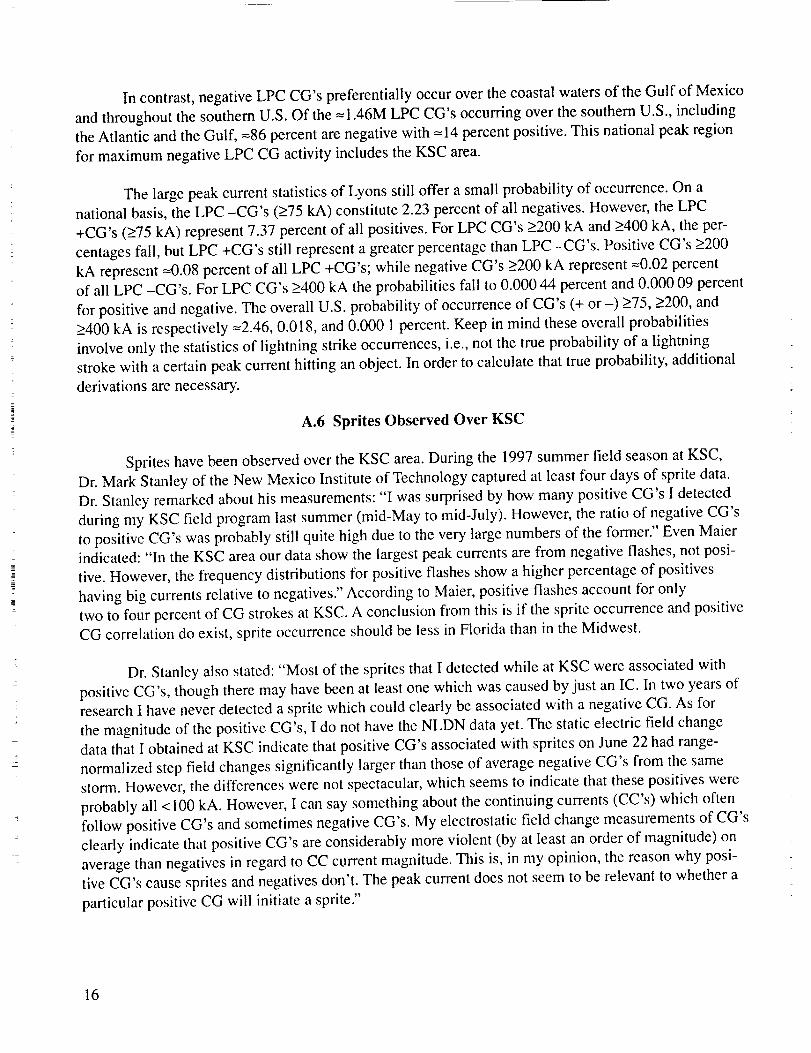
In contrast,negativeLPC CG's preferentiallyoccuroverthecoastalwatersof theGulf of MexicoandthroughoutthesouthernU.S.Of the=1.46MLPCCG'soccurringoverthesouthernU.S., includingtheAtlanticandtheGulf, =86percentarenegativewith =14percentpositive.This nationalpeakregionfor maximumnegativeLPC CG activity includestheKSC area.
Thelargepeakcurrentstatisticsof Lyonsstill offer asmallprobabilityof occurrence.On anationalbasis,theLPC-CG's (>75kA) constitute2.23percentof all negatives.However,theLPC+CG's(>75kA) represent7.37percentof all positives.ForLPCCG's >200 kA and >400 kA, the per-
centages fall, but LPC +CG's still represent a greater percentage than LPC -CG's. Positive CG's >200
kA represent =0.08 percent of all LPC +CG's; while negative CG's >200 kA represent =0.02 percent
of all LPC -CG's. For LPC CG's >400 kA the probabilities fall to 0.000 44 percent and 0.000 09 percent
for positive and negative. The overall U.S. probability of occurrence of CG's (+ or -) >75, >200, and
>400 kA is respectively =2.46, 0.018, and 0.000 1 percent. Keep in mind these overall probabilities
involve only the statistics of lightning strike occurrences, i.e., not the true probability of a lightning
stroke with a certain peak current hitting an object. In order to calculate that true probability, additional
derivations are necessary.
A.6 Sprites Observed Over KSC
Sprites have been observed over the KSC area. During the 1997 summer field season at KSC,
Dr. Mark Stanley of the New Mexico Institute of Technology captured at least four days of sprite data.
Dr. Stanley remarked about his measurements: "I was surprised by how many positive CG's I detected
during my KSC field program last summer (mid-May to mid-July). However, the ratio of negative CG's
to positive CG's was probably still quite high due to the very large numbers of the former." Even Maier
indicated: "In the KSC area our data show the largest peak currents are from negative flashes, not posi-
tive. However, the frequency distributions for positive flashes show a higher percentage of positives
having big currents relative to negatives." According to Maier, positive flashes account for only
two to four percent of CG strokes at KSC. A conclusion from this is if the sprite occurrence and positive
CG correlation do exist, sprite occurrence should be less in Florida than in the Midwest.
Dr. Stanley also stated: "Most of the sprites that I detected while at KSC were associated with
positive CG's, though there may have been at least one which was caused by just an IC. In two years of
research I have never detected a sprite which could clearly be associated with a negative CG. As for
the magnitude of the positive CG's, I do not have the NLDN data yet. The static electric field change
data that I obtained at KSC indicate that positive CG's associated with sprites on June 22 had range-
normalized step field changes significantly larger than those of average negative CG's from the same
stonn. However, the differences were not spectacular, which seems to indicate that these positives were
probably all <!00 kA. However, I can say something about the continuing currents (CC's) which often
follow positive CG's and sometimes negative CG's. My electrostatic field change measurements of CG's
clearly indicate that positive CG's are considerably more violent (by at least an order of magnitude) on
average than negatives in regard to CC current magnitude. This is, in my opinion, the reason why posi-
tive CG's cause sprites and negatives don't. The peak current does not seem to be relevant to whether a
particular positive CG will initiate a sprite."
16
Boccippiousedall May throughOctober1995NLDN CG datawithin I 000km of KSCtocomputediurnal cyclesfor "positive" CGcurrents>50,>100,and>200kA. Datacountsweretalliedforeachhour.Forpositiveflashes>50and>100kA, thepeakcount (>2000 and>400,respectively)occursat 0000UTC (2000EDT).Theminimumcount(about940and 165,respectively)occursat0600UTC(0200EDT).This indicatesdiurnalamplitudemodulationis afactorof =two for positivestrokesnearKSC.Thediurnalcyclefor peakpositiveCGcurrents>200kA waslessdiscernibledueto thesmallsamplesize(countbetween7 and32over24hours).
DiurnalpositiveCG KSCresultsby Boccippiodiffer with thediurnalresultsof Santis.8How-ever,Santisusedthetotal NLDN database(positivesandnegatives)for the entire U.S. between June 12,
1996, and October 9, 1996. Uniform diurnal cycle of CG strikes by Santis peaked at 1700 EDT (= 13
percent) with a minimum at 1000 EDT (<2 percent).
17
APPENDIX B Space Shuttle Lightning Launch Commit Criteria
Figure 9.8 in NASA TM 4511 depicts the SAE 1987 current test waveforms for severe direct
lightning strikes to the NASA Space Shuttle. 47
NSTS 16007 LAUNCH COMMIT CRITERIA AND BACKGROUND SSID: WEA-01
4.5 Natural and Triggered Lightning Constraints
NOTICE: ANY CHANGES TO THIS SECTION WILL REQUIRE COORDINATION
WITH THE 3OTH AND 45TH SPACE WING RANGE SAFETY OFFICES.
Even when constraints are not violated, if any other hazardous conditions exist, the Launch Weather
Officer will report the threat to the Launch Director. The Launch Director may HOLD at any time based
on the instability of the weather.
The Launch Weather Officer must have clear and convincing evidence the following constraints are not
violated:
A° Do not launch if any type of lightning is detected within I0 nautical miles (nmi) of the
flight path within 30 minutes prior to launch, unless the meteorological condition that
produced the lightning has moved more than 10 nmi away from the flight path.
NATURAL LIGHTNING IS AN OBVIOUS HAZARD (COMPARED TO VEHICLE
TRIGGERED LIGHTNING) AND IS ALSO THE MOST DIRECT EVIDENCE ELEC-
TRIC FIELDS ARE PRESENT WITH SUFFICIENT INTENSITY TO CAUSE TRIG-
GERED LIGHTNING. THE MEASURED FREQUENCY DISTRIBUTION OF THE
DISTANCE BETWEEN SUCCESSIVE FLASHES TO GROUND APPROACHES ZERO
NEAR 6 NMI; THUS 10 NMI PROVIDES A SAFETY FACTOR. THE 30-MINUTE
TIME PERIOD WITHOUT LIGHTNING INDICATES THE STORM HAS DISSIPATED
OR MOVED AWAY. HOWEVER, FORECASTERS MUST STILL REMAIN ALERT
FOR REDEVELOPMENT OR FORMATION OF A NEW CELL.
B. Do not launch if the flight path will carry the vehicle:
(1) Through a cumulus cloud with its top between the +5.0 °C and -5.0 °C levels unless:
(a) The cloud is not producing precipitation;
AND
18
(b) Thehorizontaldistancefrom thefurthestedgeof thecloudtop to at leastoneworking field mill is lessthanthealtitudeof the-5.0 °C levelor 3 nmi, whicheveris smaller.
AND
(c) All field mill readings within 5 nmi of the flight path are between -100 V/m
and + 1,000 V/m for the preceding 15 minutes.
(2) Through cumulus clouds with tops higher than the -5.0 °C level.
(3) Through or within 5 nmi (horizontal or vertical) of the nearest edge of cumulus clouds
with tops higher than the -10.0 °C level.
(4) Through or within 10 nmi (horizontal or vertical) of the nearest edge of any cumulon-
imbus or thunderstorm cloud, including nontransparent parts of its anvil.
(5) Through or within i 0 nmi (horizontal or vertical) of the nearest edge of a
nontransparent detached anvil for the first hour after detachment from the parent
thunderstorm or cumulonimbus cloud.
NOTE: Cumulus does not include altocumulus or stratocumulus.
B(1) CUMULUS (CONVECTIVE) CLOUDS CAN DEVELOP AND PRODUCE
ELECTRIC CHARGE VERY RAPIDLY. NORMALLY THIS OCCURS WELL ABOVE
THE FREEZING LEVEL. HOWEVER, THE +5.0 °C LEVEL WAS SPECIFIED
BECAUSE ELECTRIC CHARGE HAS BEEN SPECULATED TO OCCUR IN SOME
"WARM" CLOUDS IN THE TROPICS AND BECAUSE CUMULUS CLOUDS CAN
BUILD VERY RAPIDLY. CHARGE SUFFICIENT TO TRIGGER LICHTNING IS
NORMALLY NOT DETECTED UNTIL THE CLOUD REACHES WELL ABOVE THE
-10.0 °C LEVEL. THUS, IF THE CLOUD IS NOT PRODUCING PRECIPITATION
(PRECIPITATION IS BELIEVED TO BE A NECESSARY CONDITION FOR CLOUD
ELECTRIFICATION) AND THE GROUND-BASED FIELD MILLS ARE NOT
MEASURING ELEVATED ELECTRIC FIELDS ASSOCIATED WITH THE ONSET
OF CUMULUS CLOUD ELECTRIFICATION, THEN LAUNCH MAY BE PERMITTED
THROUGH CLOUDS BELOW THE -5.0 °C LEVEL.
B(2) AS CLOUD TOPS APPROACH-10.0 °C, CHARGE MAY DEVELOP VERY
RAPIDLY. THUS, NO LAUNCH IS PERMITTED THROUGH CLOUDS WITH TOPS
AT OR ABOVE -5.0 °C.
B(3) CLOUDS WITH TOPS ABOVE -10.0 °C CAN CREATE ELECTRIC FIELDS
OUTSIDE THE CLOUD WITH SUFFICIENT STRENGTH TO TRIGGER LIGHTNING.
THUS, NO FLIGHT PATH IS PERMITTED WITHIN 5 NMI, HORIZONTALLY OR
VERTICALLY, OF CLOUDS FROM -10.0 °C TO -20.0 °C.
19
C°
B(4) THE MOST DANGEROUS CLOUD IS THE CUMULONIMBUS WHICH TYPI-
CALLY PRODUCES NATURAL LIGHTNING. THUS, THE DISTANCE CRITERION
(10 NMI) IS THE SAME AS FOR NATURAL LIGHTNING IN RULE A. DANGEROUS
ELECTRIC CHARGE CAN ALSO BE ADVECTED INTO THE HIGH LEVEL ANVIL
PRODUCED BY A CUMULONIMBUS CLOUD, THUS THE FLIGHT PATH MUST
REMAIN 10 NMI HORIZONTALLY AND VERTICALLY, FROM THE ANVIL.
B(5) SIGNIFICANT CHARGE CAN REMAIN IN AN ANVIL FOR UP TO 1 HOUR
AFTER IT DETACHESFROM ITS PARENT SOURCE CLOUD. THUS, THE SAME
10 NMI DISTANCE CRITERION APPLIES AS IN RULE B(4). AFTER 1 HOUR THE
DETACHED CLOUD IS TREATED PER RULE F.
Do not launch if, for Ranges equipped with a working surface electric field mill network, at
any time during the 15 minutes prior to launch time the absolute value of any electric field
intensity measurement at the ground is >1,000 V/m within 5 nmi of the flight path unless:
(1) There are no clouds within 10 nmi of the flight path except
(a) Transparent clouds
OR
(b) Clouds with tops below the +5.0 °C level that have not been associated with
convective clouds with tops above the -10.0 °C level within the last 3 hours;
AND
(2) A known source of electric field (such as ground fog) that is occurring near the
sensor, and that has been previously determined and documented to be benign, is
clearly causing the elevated readings. (Documents dated April 3, 1997, defining
benign ground fog, smoke, and sunrise effect, and the criteria to evaluate their pres-
ence, are located in the 45th Space Wing's Range Weather Operation Instruction
15-3, entitled "Launch Weather Constraint Monitoring, Evaluation, and Reporting
Procedures.")
•NOTE: For confirmed failure of the surface field mill system, the countdown and launch
may continue, since the other lightning LCC completely describe unsafe meteorological
conditions.
GROUND-BASED FIELD MILLS (GBFM) JUST MEASURE THE ELECTRIC
POTENTIAL AT THE EARTH'S SURFACE. THEY CAN ONLY INFER THE
ELECTRIC FIELD IN AND NEAR CLOUDS ALOFT (WHICH PERHAPS DECREASE
WITH THE HORIZONTAL DISTANCE CUBED AND THE CHARGE HEIGHT
SQUARED); AND THEIR READINGS CAN BE MASKED BY INTERVENING
LAYERS OF SPACE CHARGE BETWEEN THE MILLS AND THE CLOUD.
20
MEASUREMENTSOF CHARGEALOFT USINGAIRCRAFT EQUIPPEDWITHFIELD MILLS, AND EXPERIMENTSWITH ROCKETSFIRED INTO CLOUDSTOTRIGGERLIGHTNING, INDICATE GBFM MEASUREMENTS>1,000V/M CAN BEINDICATIVE OFELECTRICFIELDSALOFT SUFFICIENTLYHIGH TO TRIGGERLIGHTNING.
THEREARE OTHERNEAR-SURFACESOURCESOFELECTRICCHARGENOTRELATEDTO CHARGEALOFT; FORINSTANCEGROUNDFOG,SMOKE,POWERLINES, SEASPRAY,ETC. IF THEREIS NO POSSIBLESOURCEOF CHARGEALOFT AND THEREISA CONFIRMED,DOCUMENTED SOURCEOFNEAR-SURFACECHARGE,THEN THISRULE IS NOTVIOLATED.
NOTE: DOCUMENTEDMEANS SUFFICIENTDATA HAS BEEN GATHEREDONTHE PHENOMENATO PROPERLYSTUDYIT, AND CIRCUMSTANCESCAUSINGIT TO BE PRESENTARE UNDERSTOODAND WRITTEI_IN A TECHNICALREPORT.
D. Do not launch if the flight path is through a vertically continuous layer of clouds with an
overall depth of 4,500 feet or greater where any part of the clouds is located between the0.0 °C and the -20.0 °C levels.
THIS RULE COVERS STRATIFORM CLOUDS. ELECTRIFICATION PROCESSES
PRIMARILY OCCUR WITHIN CLOUDS BETWEEN -0.0 AND -20.0 °C, AND
INCREASE WITH INCREASING CLOUD THICKNESS. IF CLOUD LAYERS ARE
CONNECTED BY TURRETS, THE CLOUD LAYER DEPTH IS DETERMINED BY
MEASURING FROM THE BASE OF THE LOWER CLOUD LAYER TO THE TOP OF
THE HIGHER CLOUD LAYER. THE TURRETS INDICATE POSSIBLE CHARGE-
PRODUCING CONVECTION, AND THE CHARGE MAY BE ADVECTED INTO THE
INDIVIDUAL LAYERS. THUS, AN INDIVIDUAL CLOUD LAYER MAY NOT BE
4,500 FEET THICK BUT THE RULE MAY BE VIOLATED IF TWO LAYERS ARE
CONNECTED AND THEIR LAYERS SUM TO 4,500 FEET OR GREATER.
E. Do not launch if the flight path is through any clouds that
(1) Extend to altitudes at or above the 0.0 °C level
AND
(2) Are associated with disturbed weather that is producing moderate (29 dBz) or greater
precipitation within 5 nmi of the flight path.
CLOUDS EXTENDING ABOVE THE FREEZING LEVEL AND SUFFICIENTLY
ACTIVE TO PRODUCE MODERATE OR GREATER PRECIPITATION CAN ALSO
CREATE ELECTRIC CHARGE. THIS CHARGE CAN BE ADVECTED INTO ASSOCI-
ATED CLOUDS AND CAN CREATE ELECTRIC FIELDS AT A DISTANCE. THUS, IF
THE PRECIPITATION IS WITHIN 5 NMI, THIS RULE IS VIOLATED.
21
F. Do not launchif theflight pathwill carry thevehicle:
(1) Throughanynontransparentthunderstormor cumulonimbusdebriscloudduring thefirst 3hoursafterthedebriscloudformedfrom theparentcloud.
(2) Within 5 nmi (horizontalor vertical)of thenearestedgeof anontransparentthunder-stormor cumulonimbusdebriscloudduringthefirst 3 hoursafterthedebriscloudformedfrom aparentcloud,UNLESS
(a) Thereis at leastone working field mill within 5 nmi of the debris cloud;
AND
(b) All electric field intensity measurements at the ground are between +1,000 V/m
and -1,000 V/m within 5 nmi of the flight path during the 15 minutes preceding
the launch time;
AND
(c) The maximum radar return from the entire debris cloud is <10 dBz during the
15 minutes preceeding launch time.
(3) The start of the 3-hour period is reckoned as follows:
(a) Detachment--if the cloud detaches from the parent cloud: The 3-hour period
begins at the time when cloud detachment is observed or at the time of the last
detected lightning discharge (if any) from the detached debris cloud, whichever is
later.
(b) Decay or detachment uncertain--if it is not known whether the cloud is detached
or the debris cloud forms from the decay of the parent cloud: The 3-hour period
begins at the time when the parent cloud top decays to below the altitude of the
-10.0 °C level, or at the time of the last detected lightning discharge (if any) from
the parent cloud or debris cloud, whichever is later.
CLOUDS PRODUCED BY CUMULONIMBUS AND THUNDERSTORMS CAN
RETAIN THEIR CHARGE EVEN AFTER THE PARENT STORM HAS DECAYED
AND STOPPED PRODUCING CHARGE, OR AFTER THE CLOUD HAS BROKEN
AWAY FROM THE CHARGE SOURCE. AIRBORNE FIELD MILL MEASUREMENTS
SUGGEST MOST OF THE CHARGE HAS DECAYED WITHIN 90 MINUTES. HOW-
EVER, THE CRITERION WAS SET AT 3 HOURS DUE TO THE UNCERTAINTY
REGARDING THE START OF THE CLOUD DECAY OR CLOUD BREAKOFF TIME,
AND THE POSSIBILITY OF BRIEF INTERNAL CHARGE GENERATION WITHIN
THE CLOUD EVEN AFTER BREAKING OFF FROM THE PARENT CLOUD.
22

SINCENEGLIGIBLE RADAR RETURNSAND BENIGN GBFM READINGSINDICATE THE CLOUD ISNOTPRODUCINGCHARGE,AND ANY RESIDUALCHARGEHAS DECAYEDSUBSTANTIALLY,THEN THE 5 NMI STANDOFFCANBE REDUCEDTO JUSTA "FLIGHT THROUGH" PROHIBITION.NOTEBENIGNGBFM VALUESCANNOTBE USEDBY THEMSELVESTO CONCLUDETHECLOUD CAN BE SAFELYPENETRATED,SINCESHIELDING LAYERSCAN MASKSIGNIFICANT FIELDS (AND CHARGE)INSIDE THE CLOUDSFROM THE GBFMNETWORK.
TRANSPARENTDEBRISCLOUDSARE NOT CONSIDEREDCAPABLEOFCARRY-ING SUFFICIENTCHARGETOBE DANGEROUS.
G. Definitions/Explanations
(1) Anvil stratiformor fibrouscloudproducedby theupperleveloutflow or blow-offfrom thunderstormsor convectiveclouds.
(2) Cloudedge--Thevisiblecloudedgeispreferred.If this is not possible,thenthe10dBz radarcloudedgeis acceptable.
(3) Cloudlayer--An arrayof clouds,notnecessarilyall of thesametype,whosebasesareapproximatelyat thesamelevel.Also, multiplearraysof cloudsat differentaltitudesthatareconnectedverticallybycloudelements;e.g.,turretsfrom onecloudarraytoanother.Convectiveclouds(e.g.,cloudsfalling underRuleB) areexcludedfrom thisdefinition unlesstheyareimbeddedwith othercloudtypes.
(4) Cloudtop--The visiblecloudtopis preferred.If this is notpossible,thenthe 13dBzradarcloudtop is acceptable.
(5) Cumulonimbuscloud--Any convectivecloudwith anypartabovethe-20.0 °Ctemperaturelevel.
(6) Debriscloud--Any nontransparentcloudthathasbecomedetachedfrom aparentcumulonimbuscloudor thunderstorm,or resultsfrom thedecayof a parentcumulon-imbuscloudor thunderstorm.
(7) Documentedwith respectto rule C(2),"documented"meanssufficientdatahasbeengatheredon thebenignphenomenato bothunderstandit andto developproceduresto evaluateit, andthesupportingdataandevaluationhavebeenreportedinatechnicalreport,journal article,or equivalentpublication.Forlaunchesat theEasternRange,copiesof thedocumentationshallbemaintainedby the45thWeatherSquadronandtheKSC WeatherProjectsOffice.Theproceduresusedto assessthephenomenaduringlaunchcountdownsshallbedocumentedandimplementedby the45thWeatherSquadron.
23

(8)
(9)
(lO)
(11)
(12)
Electric field (for surface-based electric field mill measurements)--The l-minute
arithmetic average of the vertical electric field (Ez) at the ground, such as measured by
a ground-based field mill. The polarity of the electric field is the same as that of the
potential gradient; that is, the polarity of the field at the ground is the same as that of
the charge overhead.
Flight path--The planned flight trajectory including its uncertainties ("error bounds").
Precipitating cloud--Any cloud containing precipitation, producing virga, or having
radar reflectivity greater than 13 dBz.
Thunderstorm--Any cloud that produces lightning.
Transparent synonymous with visually transparent--Sky cover through which higher
clouds, blue sky, stars, etc., may be clearly observed from below. Also, sky cover
through which terrain, buildings, etc., may be clearly observed from above. Sky cover
through which forms are blurred, indistinct, or obscured is not transparent.
24 -'
REFERENCES
I. Beard, K.; and Ochs, H.: "Cloud Electrification," Rev. in Geophys. Space Phys., Vol. 21,
pp. 984-992, 1983.
2. Leteinturier, C.; et al.: "Current and Electric Field Derivatives in Triggered Lightning Return
Strokes," .l. Geophys. Res., Voi. 95, pp. 818-828, 1990.
3. Goodloe, C.: "Lightning Protection Guidelines For Aerospace Vehicles," NASA/TM--1999-
209734, May 1999.
4. Gabrielson, B.: The Aerospace Engineer's Handbook of Lightning Protection, Interference Control
Technologies, Inc., 1988.
5. Stahmann, J.: "Launch Pad Lightning Protection Effectiveness," 1991 International Aerospace and
Ground Conference on Lightning and Static Electricity, Cocoa Beach, FL, pp. 3 I-1 through 31-
12, April 16-19, 1991.
6. Mach, D." "Shuttle Lightning Threat Analysls, AMS Third International Conference On Aviation
Weather Systems, Anaheim, CA, pp. 92-95, January 30-February 3, 1989.
7. Chai, J.; et al.: "Survey of CGLSS/SLC40 Lightning Data and Retest Criteria," IEEE 1997
International Symposium on Electromagnetic Compatibility, Austin, TX, pp. 391-396,
August ! 8-22, 1997.
8. Santis, L.: "The Calculated Risk of Experiencing a Lightning Caused Unplanned Detonation,"
ISEE Proceedings of tile 14th Annual Symposium o11 E.vplosives and Blasting Research, New
Orleans, LA, pp. 107-119, February 8-11, 1998.
9. Uman, M.: "The Lightning Discharge," Int. Geophys. Set, Vol. 39, Academic Press, Inc., 1987.
10. Fisher, E; ct al.: "Lightning Protection of Aircraft," Chapter 2, Lightning Technologies, Inc.,
Pittsfield, MA, 1990.
1 I. "Launch Commit Criteria and Background," NSTS 16007, Revision F, Change No. 99, Section 4.5,
"Natural and Triggered Lightning Constraints."
12. Cianos, N.; and Pierce, E.T.: "A Ground-Lightning Environment For Engineering Usage,"
Stanford Research Institute, Technical Report I, SRI Project 1834, August 1972.
13. Galeja, J.: Terrestrial Propagation of Long Electromagnetic Waves, Pergamon Press, 1972.
25
14. Viemeister,E: The Lightning Book," MIT Press, 1972.
15. Mailander, J.: "Climate of the Kennedy Space Center and Vicinity," NASA TM-103498, June 1990.
16. Golde, R.: Lightning--Volume 2---Lightning Protection, Academic Press, Inc., 1977.
17, Jafferis, W.: "Rocket Triggered Lightning--Kennedy Space Center and Beyond," 1995 Interna-
tional Aerospace and Ground Conference On Lightning and Static Electricity, p. 57-1, September
26-28, 1995.
18. Marshall, L.: "Capturing Sprites and Elves From Afar," Penn. State and AGU Release, December
16, 1996.
19. Volland, H. (Editor): Handbook of Atmospheric Electrodynamics, CRC Press, Chapter 4, "Light-
ning Currents," T. Ogawa, pp. 93-136, 1995.
20. Orville, R.; et al.: "Cloud-to-Ground Lightning Flash Characteristics from June 1984 Through
May 1985," J. Geophys. Res., Vol. 92, pp. 5640-5644, May 20, 1987.
21. Stolzenburg, M.: "Observations of High Ground Flash Densities of Positive Lightning in Summer-
time Thunderstorms," Monthly Weather Rev., Vol. 122, p. 1740, August 1994.
22. Ishif, M.; and Hojo, J.: "On The Statistics of Field Waveforms Associated With Lightning Return
Strokes," 1988 International Aerospace and Ground Conference On Lightning and Static Electric-
ity, Oklahoma City, OK, April 19-22, 1988.
23. Narita, K.; et al.: "Bipolar Lightning in Winter at Maki, Japan," J. Geophys. Res., Vol. 94, No. D11,
pp. 13191-13195, September 30, 1989.
24. Fisher, R.; et al.: "'Parameters of Triggered-Lightning Flashes in Florida and Alabama," J. Geophys.
Res., Vol. 98, No. DI2, pp. 22887-2902, December 20, 1993.
25. Mach, D.; and Rust, D.: "Photoelectric Return-Stroke Velocity and Peak Current Estimates
in Natural and Triggered Lightning," J. Geophys. Res., Vol. 94, No. DI 1, pp. 13237-13247,
September 20, 1989.
26. Bankson, N.: "Lightning Current Rate of Rise in the New Lightning Flash Model for the Space
Shuttle Program," 1991 International Aerospace & Ground Conference on Lightning and Static
Electricity, Cocoa Beach, FL, Vol. !, pp. 5-1 through 5-14,April 16-19, 1991.
27. Depasse, P.: "Statistics on Artificially Triggered Lightning," J. Geophys. Res., Vol. 99, No. D9,
pp. 18515-18522, September 20, 1994.
28. Turman, B.: "Detection of Lightning Superbolts," J. Geophys. Res., Vol. 83, p. 2566, 1977.
26

29.
30.
31.
32.
33.
34.
Goto,Y.;andNarita,K.: "ElectricalCharacteristicsof WinterLightning," J. Atmospheric and
Terrest. Phys., Vol. 57, No. 5, pp. 449-458, April l, 1995.
Sawada, S.; et al.: "Current Measurement of Lightning Superbolt at the Japan Sea Coast," NOAA
International Aerospace and Ground Conference on Lightning and Static Electricity, pp. 103-111,
April 1, 1988.
Uman, M.; et al.: "An Unusual Lightning Flash at Kennedy Space Center," Science, Vol. 201,
No. 4350, July 7, 1978.
Orville, R.; et al." "Cloud-to-Ground Lightning Flash Characteristics in the Contiguous United
States: 1989-1991," J. Geophys. Res., Vol. 99, pp. 10833-10841, May 20, 1994.
Orville, R.; and Silver, A.C.: "Annual Summary-Lightning Ground Flash Density in the Contigu-
ous United States: 1992-95," Monthly Weather Rev., Vol. 125, pp. 631--638, April 1997.
Lyons, W.: "Final Report--Sensor System to Monitor Cloud-to-Stratosphere Electrical Dis-
charges," submitted to NASA/KSC under NASA SBIR Phase II, Contract NAS 10-12113, April 25,1996.
35. Orville, R.: "Peak-Current Variations of Lightning Return Strokes as a Function of Latitude,"
Nature, Vol. 343, pp. 149-151, January 11, 1990.
36. Wacker, R.: "Changes in Measured Lightning Return Stroke Peak Current After the 1994 National
Detection Network Upgrade," M.S. thesis, Texas A&M University, May 1997.
37. Hodanish, S.; and Sharp, D.: "A 10-Yr. Monthly Lightning Climatology of Florida: 1986-1995,"
Weather & Forecasting, Vol. 12, pp. 439-448, September 1997.
38. Boccippio, D.; et al.: "Sprites, ELF Transients, and Positive Ground Strokes," Science, Vol. 269,
pp. 1088-1091, August 25, 1995.
39. Winckler, J.: "Further Observations of Cloud-Ionosphere Electrical Discharge Above Thunder-
storms," J. Geophys. Res., Vol. 100, pp. 14335-14345, 1995.
40. Sentman, D.; et al.: "Preliminary Results From the Sprites 94 Aircraft Campaign: Red Sprites,"
Geophys. Res. Letters, Vol. 22, No.10, pp. 1205-1208, May 15, 1995.
41. Lyons, W.: "Sprites, Elves, and Blue Jets," Weatherwise, August-September 1997.
42. Fullekrug, M.; et al.: "On the Accuracy of Arrival Azimuth Determination of Sprite-Associated
Lightning Flashes by Earth-Ionosphere Cavity Resonances," Geophys. Res. Letters, Vol. 23,
No. 25, pp. 3691-3694, December 15, 1996.
43. Inan, U.; et al.: "VLF Signatures of Ionospheric Disturbances Associated with Sprites," Geophys.
Res. Letters, Vol. 22, No. 24, pp. 3461-3464, December 15, 1995.
27
44.
45.
46.
47.
Staff: GeographyInstitute,Universityof Alaska,"Red SpritesandBlue Jets,"internethomepage,http://elf.gi.alaska.edu/sprites.html,1997.
Wakefield,J.: "High-Altitude FlashesMystify Scientists,"Eos AGU, Vol. 75, No. 51, pp. 601-602,
December 20, 1994.
Lyons, W.; et.al.: "Large Peak Current Cloud-to-Ground Lightning Flashes during the Summer
Months in the Contiguous United States," Monthly Weather Rev., Vol. 126, pp. 2217-2233,
August 1998.
Johnson, D.L.: "Terrestrial Environment (Climatic) Criteria Guidelines for Use in Aerospace
Vehicle Development, 1993 Revision, Section IX Atmospheric Electricity," NASA TM-4511,
August 1993.
28
BIBLIOGRAPHY
Boccippio, D.: Marshall Space Flight Center, Hydrology Research Office, personal communications,
January 1998.
Maier, M.: Patrick AFB, Computer Sciences Raytheon, persona! communications, February 1998.
Stanley, M.: New Mexico Institute of Technology, personal communications, February 1998.
29
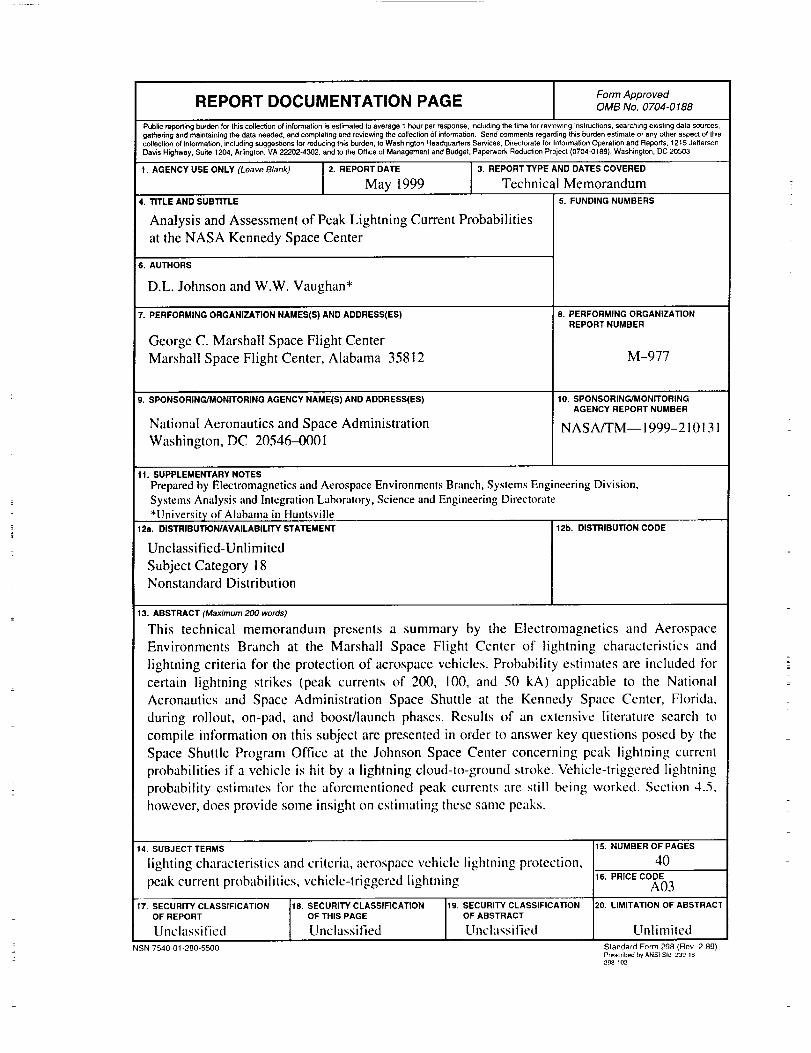
Form ApprovedREPORT DOCUMENTATION PAGE OMBNo.0704-0188
Public reporting burden for this collection of information is estimated to average t hour per response, including the time for reviewing instructions, searching existing data sources,gathering and maintaining the data needed, and completing and reviewing the collection of information, Send comments regarding this burden estimate or any other aspect of Ibiscoi]ect_onof information, including suggestions for reducing this burden, to Washington Headquarlers Services. Directorate for Information Operation and Reports, 12t 5 JeffersonDavis Highway. Suite t204. Arlington. VA 22202-4302, and to the Office of Management and Budget. Paperwork Reduction Project (0704-0188), Washington, DC 20503
1. AGENCY USE ONLY (Leave B/ank) 2. REPORT DATE 3. REPORT TYPE AND DATES COVERED
May 1999 Technical MemorandumTITLE AND SUBTITLE 5. FUNDING NUMBERS
Analysis and Assessment of Peak Lightning Current Probabilities
at the NASA Kennedy Space Center
AUTHORS
D.L. Johnson and W.W. Vaughan*
PERFORMINGORGANIZATIONNAMES(S)ANDADDRESS(ES)
George C. Marshall Space Flight Center
Marshall Space Flight Center, Alabama 35812
9. SPONSORING/MONITORINGAGENCYNAME(S)ANDADDRESS(ES)
National Aeronautics and Space Administration
Washington, DC 20546-0001
B. PERFORMING ORGANIZATIONREPORT NUMBER
M-977
10. SPONSORING/MONITORING
AGENCY REPORT NUMBER
NASA/TM--1999-21013 !
11. SUPPLEMENTARY NOTES
Prepared by Electromagnetics and Aerospace Environments Branch, Systems Engineering Division,
Systems Analysis and Integration Laboratory, Science and Engineering Directorate*University of Alabama in Huntsville
12a. DISTRIBUTION/AVAILABILITY STATEMENT
Unclassified-Unlimited
Subject Category 18Nonstandard Distribution
12b. DISTRIBUTION CODE
13. ABSTRACT (Maximum 200 words)
This technical memorandum presents a summary by the Electrornagnetics and Aerospace
Environments Branch at the Marshall Space Flight Center of lightning characteristics and
lightning criteria for the protection of aerospace vehicles. Probability estimates are included for
certain lightning strikes (.peak currents of 200, 100, and 50 kA) applicable to the National
Aeronautics and Space Administration Space Shuttle at the Kennedy Space Center, Florida.
during rollout, on-pad, and boost/launch phases. Results of an extensive literature search to
compile information on this subject are presented in order to answer key questions posed by the
Space Shuttle Program Office at the Johnson Space Center concerning peak lightning current
probabilities if a vehicle is hit by a lightning cloud-to-ground stroke. Vehicle-triggered lightning
probability estimates for the aforementioned peak currents are still being worked. Section 4.5.
however, does provide some insight on estimating these same peaks.
14. SUBJECT TERMS
lighting characteristics and criteria, aerospace vehicle lightning protection,
peak current probabilities, vehicle-triggered lightning
17. SECURITY CLASSIFICATION 18. SECURITY CLASSIFICATION 19. SECURITY CLASSIFICATIONOF REPORT OF THIS PAGE OF ABSTRACT
Unclassified Unclassified Unclassified
15. NUMBER OF PAGES
4016. PRICE CODE
A03
20.LIMITATIONOFABSTRACT
Unlimited
NSN 7540 01-280-5500 Standard Form 298 (Rev 2-89)Pres<:ribedby ANSI SId 239 lS298 102

ERRATA
NASA TECHNICALMEMORANDUM
NASA/TM-2000-210131
ANALYSIS AND ASSESSMENT OF PEAK LIGHTNING CURRENT
PROBABILITIES AT THE NASA KENNEDY SPACE CENTER
By D.L. Johnson and W.W. Vaughan
May 1999
Page 30, Block 10, Sponsoring/Monitoring Agency Report Number, change reportnumber from NASA/TM- 1999-210131 to NASA/TM-2000-210131.


![[0.94]Task Scheduling to Constrain Peak Current](https://img.pdfslide.net/doc/110x75/626e279cc1717a0a2577d3e5/094task-scheduling-to-constrain-peak-current-.jpg)