Embed Size (px)
Citation preview
1
AnalysisandmanagementoftrendbreaksinanERMframework-Applicationtobiometricandbehavioralriskfactors
FatoumataNDOYE1&AnaniA.OLYMPIO2&ThomasBEHAR3
ABSTRACT
Agoodriskculturerequiresanappropriationofallphenomenaof trendbreakthatcandistortourviewof risk factors.Asactuariesor riskmanagers,akeyquestionarises:areweable toanticipatefuture disruptions in a changing world and integrate these anticipatory measures into theassessmentofourcapital?
Themain objective of this article is to propose an improvement of our understanding of the lifeinsurance risk management system and to anticipate the evolutions of our environment whileguaranteeingoursolvencyandtherobustnessofourhypothesesinfrontofthemajorityofextremesituationsthatmayoccur.
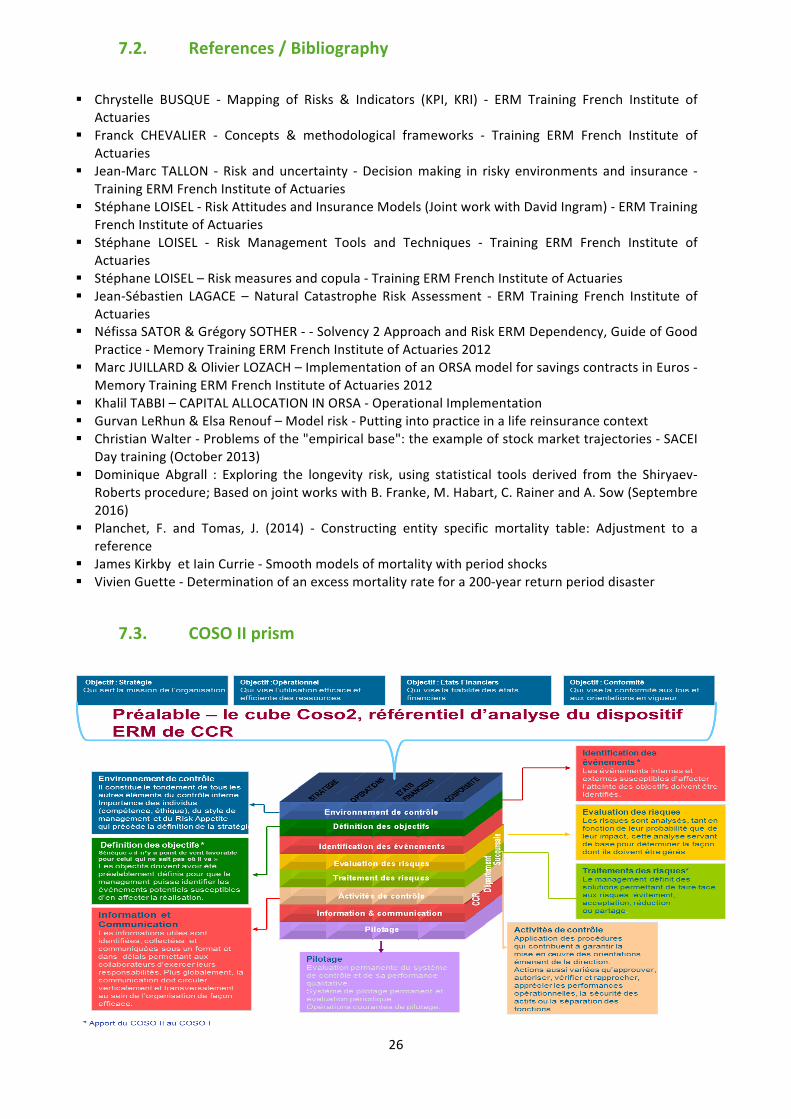
To achieve this goal,wehave chosen to adopt theCOSO II reference framework (see section 7.3)whichfacilitatesouranalysisasawhole.Westructuredourapproachinthreemainstages:
ThefirststepisRiskIdentification,wherewepresentourunderstandingoftrendbreakphenomenaandtherisksthatcanemergewhenwedonotconsidertheminourmodeling.
ThesecondstepwillbetheAssessmentandRiskQuantificationwherewewillpropose:
- The construction of a qualitative and quantitative basis bringing together all the specificities ofthesephenomenaofbreaksobservedontheinsuranceportfolios.Theexistenceandthefollow-upofthisbasewillmakeitpossibletoconstituteapanelofpastscenarios,whilereducingtheriskofbadappreciationoftheevolutionofthefactors.
- The identification of probable break scenarios (for the future) following interviewswith Expertsfromdifferentbackgroundsandspecialties.
-Theadoptionofashort-termanticipationstrategyrequiringtheexistenceofinternalandexternalindicesorindicatorsthatwewillcall"sensors".
-Theuseofa"jumpprocess"thatwilldynamizethestochasticmodelingofthevariousriskfactorsbycombiningpast,expertandmodel scenarios.Thismethodwill reduce the riskofmis-estimationofthe future riskevolution,by integrating theeffectsofvery likely future scenarios,observedornotobservedinthepast.
-Evaluationoftheimpactsofourapproachonriskandperformanceindicators.
-Theestablishmentofaprocessofautomaticmonitoringofbreaks.
InthethirdstageconcerningTreatmentandMonitoring,wewillshowthatthedynamisationofthedeterministic modeling of risk factors will be done in parallel with an adaptation of the currentgovernanceofrisks.Itisimportanttodefineandrespectasetofgoodpracticesnecessarytoreducethedifferentrisksidentified,butespeciallytothestabilityofinsuranceorganizations.
1 Actuaire IA, expert ERM CERA - R & D Actuary and Data'Lab Group - Group Technical Department – CNP Assurances
2 Actuary member of French Actuary Institute - Head of Method and Innovations Department - Group Technical Department – CNP Assurances
3Actuary member of French Actuary Institute, expert ERM CERA and President of European Association of Actuaries - Financial Performance Director - CNP Assurances
2
CONTENT
CONTENT................................................................................................................................................2
PREAMBLE..............................................................................................................................................3
1. IDENTIFICATIONOFRISKSANDDEFINITIONOFOBJECTIVES..........................................................4
1.2. Riskmapping............................................................................................................................5
1.3. Goalsdefinition........................................................................................................................6
2. EVALUATIONANDQUANTIFICATIONOFRISKS...............................................................................6
2.1. Prerequisites.............................................................................................................................6
2.2. CreatingtheTrendBreaksCatalog...........................................................................................7
2.3. ProspectiveAnalysisandCalibrationoftheFutureEvolutionofRisks....................................7
3. RISKTREATMENTANDMONITORING...........................................................................................14
3.1. StrengtheningtheactionsoftheGovernanceInstances.......................................................14
3.2. ManagementActionOrientation(MA)..................................................................................14
3.3. Alignmentofthecentralassumptionsoftheliabilities..........................................................15
3.4. Anticipationsinpricing...........................................................................................................15
3.5. Synthesesoftheimpactsoftreatment/riskmanagement...................................................16
4. CASESTUDYOFTHETOTALLAPSERISKINSAVINGS.....................................................................16
4.1. Analysis...................................................................................................................................16
4.2. TheCatalogofpasttrendbreaks...........................................................................................18
4.3. Short-termanticipatorymeasures:Theuseofsensors..........................................................19
4.4. CompletionoftheCatalogoftrendbreaksbyprobablescenarios........................................20
4.5. StatisticalriskmodelinginanORSAframework.....................................................................21
4.6. Detectionprocess...................................................................................................................22
4.7. Attitudestowardrisk:treatments..........................................................................................23
4.8. Summariesofindicatorvalues...............................................................................................23
5. LIMITS............................................................................................................................................24
6. CONCLUSION.................................................................................................................................24
7. APPENDICES...................................................................................................................................25
7.1. Glossary..................................................................................................................................25
7.2. References/Bibliography......................................................................................................26
7.3. COSOIIprism..........................................................................................................................26
3
PREAMBLE
After aperiod "2000-2010" seenas "the tenglorious" in the insurance sector, French insurers arepresented,withaviewto2020,withmoreuncertaintyinviewofthevariousscenariosthatsucceedtheinthelastfiveyears(TheimplementationofsolvencyIIandIFRS17,entryintoforceoftheANI-mutualhealthextendedtoallemployees-managementofunclaimedcontractswiththeACPRduetoEckertlaw,effectsoflawsontheresultsofinsuranceloans,FLATTAX,etc.)andotherscenariosthatmaydetermine their future.At the same time, it isnecessary tohelp thevariousdistributionnetworksinthemarketingofnewcontracts(EUROCROISSANCEtype)andtrainthesalesforcestothespecificitiesofunit-linkedcontractswiththehelpofDATASCIENCEtechniqueswhilebenefitingfromtheimpactofdigital,connectedobjects,BIGDATA.
Theseare just someof the issues that couldbedescribedasendogenous, as low interest ratesorclimate change, the rapid aging of the population, and the government's disengagement fromcoverage.social,allrelatedtotheexogenousenvironment,bringmanychallengestotheplayers intheprofession,creatingnewneedsandopportunities.
The situation is complex for insurers, who have to deal with these trend breaks, temporary oroccasional,whilethecurrentcontextisthattheyobserveadeclineinmargins.Therequirementsofmoreinformedcustomersaswellasmorestringentobligations(regulationandcompliance)requireadeepeningandbettermanagementofdriftphenomena.
The evolution of data quality, statistical techniques, the advent of BIG DATA make it possible toobtain a better knowledge of the customers (insured or partners) and create possibilities goingbeyond a better customer knowledge: these recent developments could also be used to evaluatethese trendbreaks (due to exogenousor endogenous factors) but especially to replicate them forpurposesofeconomiccapitalassessmentandbetterknowledgeofrisks.
The objective of this article is therefore to present a system of analysis, management andanticipation of the phenomena of drifting on the underwriting risks which will have to be fullyintegratedintotheORSAriskmanagementsystem,agile,coherent,framedandespeciallyrelatedtostrategies of appropriation of stress scenarios and control of solvency by the leaders of insuranceorganizations.
4
1. IDENTIFICATIONOFRISKSANDDEFINITIONOFOBJECTIVES
Ourknowledgeoftherisksaswellastheirevolutionrequirestodistinguishthevariousphenomenathatcancharacterizethem.Biometricandbehavioralrisksarecharacterizedbythecombinationoftwo(2)phenomena:trendanddrift.Wecanconsiderthetrendasexpected,reflectingtheintrinsicevolutionofrisk,towhichwecanaddtwoerrorterms:
-Theestimationerrorcorrespondingtotheerrormadeinestimatingtheparametersofthemodel.
-Theprocesserrororerrorprocess, linkedtothevariabilityoftherandomvariablesthatmakeupthemodel.
Examples of trends: general decline in the mortality rate linked to the improvement of livingconditions.
Examplesoffluctuationsrelatedtothetrend:underestimationoroverestimationofclaimsreportsfordisabilityordependence,refusalsoracceptancesofclaimsmoreorlessadvanced.
Driftortrendbreakcanbeconsideredasanextraordinarysituationthatmayoccur(notnecessarilyasaresultofadisaster)temporarilyorpermanentlyandresultinacleardemarcationbetweentheobserved(thefacts)andthepredicted.Thedriftcanbeconsecutivetoacrisis,thearrivalofanew"stateoftheworld"oranothersignificantevent.
Examples of break linked to a crisis: Banking and financial crisis of autumn 2008, Europeanperipheralcrisisduringtheyears2010and2011.
Examples of break unrelated to a crisis: Misreading / application of the general conditions of acontract,massivefraud,appearanceorcureofadreadeddisease.
We thus propose to associate the strong drifts (permanent or temporary) with the level riskassociatedtotheriskofmodel.
Fromwhencanwetalkaboutbreak?
We can talk about a breakwhenwe notice a significant difference between the observed and anestablishedrisklimit(boundsofconfidenceintervals,fixedquantiles)and/orasustainableincreaseoftheriskfactorthatcanbeexplainedbyoneormorefactor,internalorexternal.
1.1. Whichphilosophytoadoptintheownriskassessment?
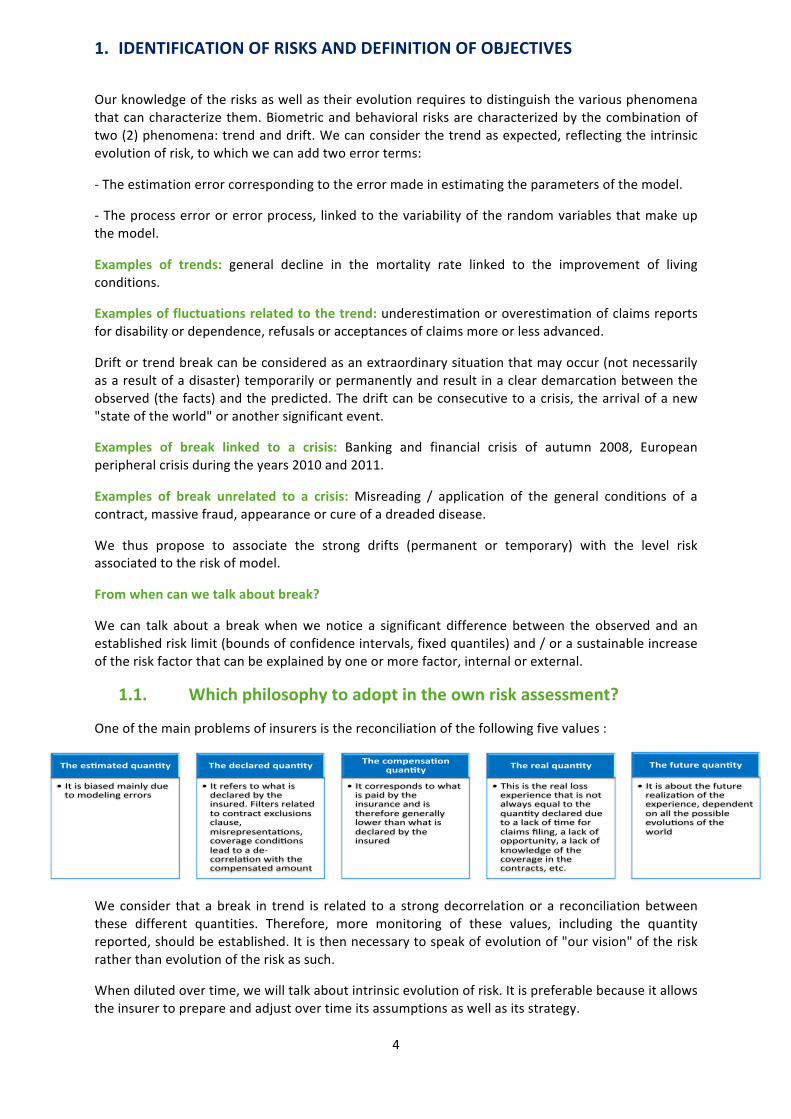
Oneofthemainproblemsofinsurersisthereconciliationofthefollowingfivevalues:
We consider that abreak in trend is related to a strongdecorrelationor a reconciliationbetweenthese different quantities. Therefore, more monitoring of these values, including the quantityreported,shouldbeestablished.Itisthennecessarytospeakofevolutionof"ourvision"oftheriskratherthanevolutionoftheriskassuch.
Whendilutedovertime,wewilltalkaboutintrinsicevolutionofrisk.Itispreferablebecauseitallowstheinsurertoprepareandadjustovertimeitsassumptionsaswellasitsstrategy.
Thees&matedquan&ty
• Itisbiasedmainlyduetomodelingerrors
Thedeclaredquan&ty
• Itreferstowhatisdeclaredbytheinsured.Filtersrelatedtocontractexclusionsclause,misrepresenta<ons,coveragecondi<onsleadtoade-correla<onwiththecompensatedamount
Thecompensa&onquan&ty
• Itcorrespondstowhatispaidbytheinsuranceandisthereforegenerallylowerthanwhatisdeclaredbytheinsured
Therealquan&ty
• Thisisthereallossexperiencethatisnotalwaysequaltothequan<tydeclaredduetoalackof<meforclaimsfiling,alackofopportunity,alackofknowledgeofthecoverageinthecontracts,etc.
Thefuturequan&ty
• Itisaboutthefuturerealiza<onoftheexperience,dependentonallthepossibleevolu<onsoftheworld
5
To identify a relevant ORSA scenario is to identify the possible causes of decorrelation orapproximationbetweenthesequantities.
The stochastic simulation logic around the trend (often adopted in the calculations of economiccapital)makesitpossibletotakeintoaccounttheprobabilisticdescriptionofthemodeledquantity:therecanbenoguaranteethattheimpactofabreakinfuturetrendiscontainedinthesedifferentvalues.Dependingonthescenarios(especiallythosewithastrongstallinthetrendthatmayresultinexceeding the risk limit set in the ORSA framework), an ORSA add-on capitalmay be required. Achallenge of risk appetite goals is also possible. Governance should allow rapid adaptation topotentialnewsituations.
1.2. RiskmappingMostFrenchinsurersalreadyhaveawell-establishedriskmapthatisupdatedregularly.Ourworktoimprove the ERM framework by integrating the management of biometric and behavioral trendbreaks,requiresarefinementofthismapping,ascertainspecificrisksemerge:endogenous(internaltothesystem)andexogenousrisks.
1.2.1. Endogenousrisks
Qualitativeandquantitativeanalyzesoftrenddisruptionsofriskfactorsrequireanincreasedanalysiscombiningvariousskills:actuarial,salesteams,doctors,dataadministrators,etc.
Thatsaid,weobservethattrend-breakingphenomenaarenotnecessarilyalwaysanalyzedand/ordocumented,withanimpactonthequantifiedriskfactor(wheredatapermit).Inaddition,trendsincertainportfoliosmaybereplicatedonothers,whethertheyaresimilarornot.Itisalsopossibleinsome contexts to think that some past events have an infinitesimal probability of reproducing,regardless of the portfolio, since attitudes towards these phenomena have evolved and havereducedoreliminatedtheeffectsassociatedwithrisk.
Mostinsurershadasprioritiesuntiltheendof2015theimplementationofSolvencyIIwitheconomiccapital calculations (and development of adapted tools), the aggregation of risks and especially astandardizationofsystemsandcalculations.comingfromvariousnetworks.Theyfounditdifficulttofind sufficient resources to easily deploy a comprehensive risk management strategy, particularlyfocusedonthecoreoftheirbusiness:underwritingrisks.
WeaskedsomeinsurancecompanydirectorsabouttheirORSApolicyanditshowsthatunderwritingrisk loss levels were calculated using risk models calibrated using historical volatilities. Thesevolatilitiesmaybepro-cyclicaland/ornot-adaptedtotheriskactuallyincurred:
-Theymaybetoolowandleadtounderestimationofrisk.
-Theymaybetoohigh,especiallyafterashockordisaster,implyinganoverestimateoffuturerisk.
-Theycanbetaintedwithdataerrors,changeofscope,etc.
Moreover, the estimation models most often make an assumption of normality of the residues,hence the appearance of the leptokurtic static problem (thinness of the densities). One of theillustrationsthatcanbemadetocharacterizethisphenomenonistheriskoftotal lapseofasavingportfolio(seesection4).
Theevolutionof risksalsobrings to lightaproblemof rapidadaptation in termsof complianceofliabilityandpricingassumptions.Indeed,itisinconceivabletokeepestimationmethodsbasedonthelastxyearsiftheycontainperiodsofstressorifwethinkthattheevolutionoftheriskfactorwillbedifferentintheshortterm.
Wefacetheriskofpoorriskeducation.
6
1.2.2. Exogenousrisks
Theriskscoveredbyinsurersareconstantlysubjecttonumerousevolutions,regulatory,contractual,socio-economicor taxchangesobserved in insurance:wearealso inaconstantlychangingmarketthat lives in its social context.Moreover, the socio-economic context of France (crises, change ofpresidentialpolicy,changeofsalesmethods,...)suggeststhatthecomingyearswillberichintermsofchanges.
1.3. GoalsdefinitionAlltheseobservationsshowthatitisnecessarytolookintoamoreefficientsolutionformonitoringinsurancerisks.Itisaquestionofestablishingamoreadequatearchitecturewhichmakesitpossibletobetterfollowtheevolutionoftheportfoliosandtohaveabetteranticipationofthefuture.
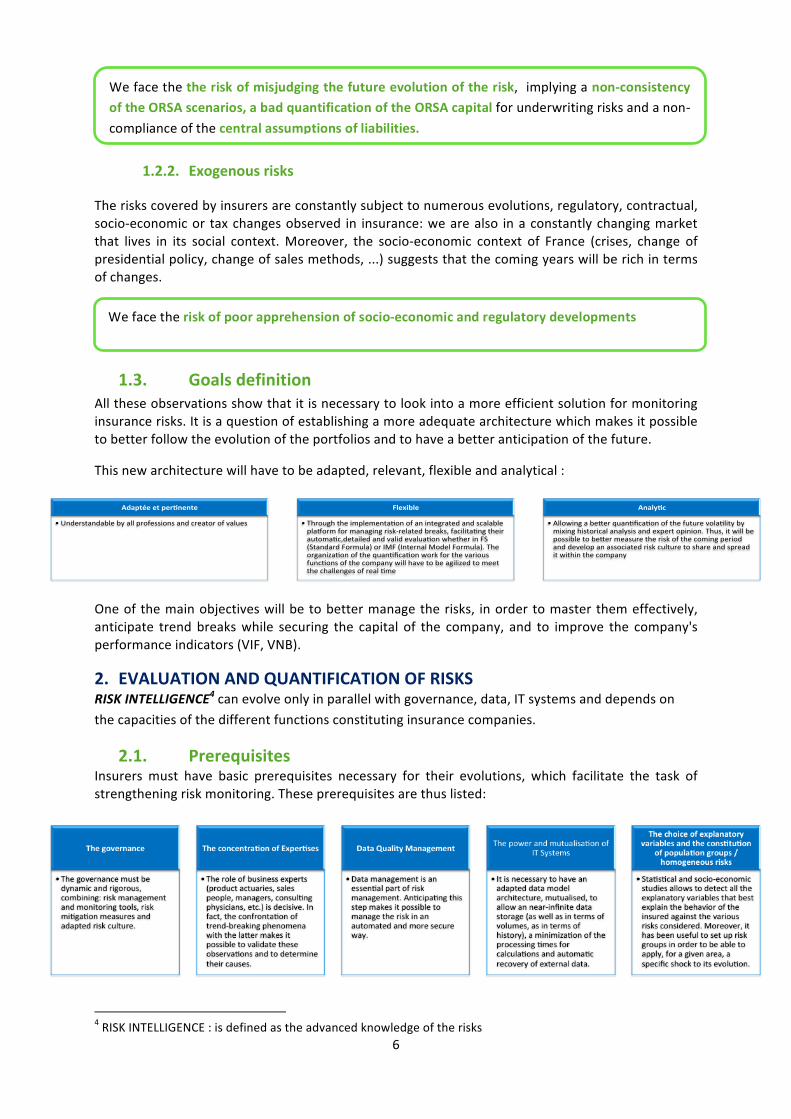
Thisnewarchitecturewillhavetobeadapted,relevant,flexibleandanalytical:
Oneof themainobjectiveswillbetobettermanagetherisks, inordertomasterthemeffectively,anticipate trendbreakswhile securing the capital of the company, and to improve the company'sperformanceindicators(VIF,VNB).
2. EVALUATIONANDQUANTIFICATIONOFRISKSRISKINTELLIGENCE4canevolveonlyinparallelwithgovernance,data,ITsystemsanddependsonthecapacitiesofthedifferentfunctionsconstitutinginsurancecompanies.
2.1. PrerequisitesInsurers must have basic prerequisites necessary for their evolutions, which facilitate the task ofstrengtheningriskmonitoring.Theseprerequisitesarethuslisted:
4RISKINTELLIGENCE:isdefinedastheadvancedknowledgeoftherisks
Adaptéeetper*nente
• Understandablebyallprofessionsandcreatorofvalues
Flexible
• Throughtheimplementa9onofanintegratedandscalablepla:ormformanagingrisk-relatedbreaks,facilita9ngtheirautoma9c,detailedandvalidevalua9onwhetherinFS(StandardFormula)orIMF(InternalModelFormula).Theorganiza9onofthequan9fica9onworkforthevariousfunc9onsofthecompanywillhavetobeagilizedtomeetthechallengesofreal9me
Analy*c
• AllowingabeJerquan9fica9onofthefuturevola9litybymixinghistoricalanalysisandexpertopinion.Thus,itwillbepossibletobeJermeasuretheriskofthecomingperiodanddevelopanassociatedriskculturetoshareandspreaditwithinthecompany
Wefacethetheriskofmisjudgingthefutureevolutionoftherisk,implyinganon-consistencyoftheORSAscenarios,abadquantificationoftheORSAcapitalforunderwritingrisksandanon-complianceofthecentralassumptionsofliabilities.
Wefacetheriskofpoorapprehensionofsocio-economicandregulatorydevelopments

7
2.2. CreatingtheTrendBreaksCatalogIn order to improve the ERM risk monitoringprocess, it can be very useful to establish a basisthat includes all the characteristics of the trendbreaksidentifiedonthetargetedunderwritingrisks:itistheCatalogoftrendbreaks.
Weproposetoestablishthefollowingindicators:
We also propose to integrate trend breaks observed on external perimeters (by checking at leastordersofmagnitude,aswellastheirabilitytohaveanimpactontheinternalperimeterstudied).Afterthecatalogoftrendbreakshasbeencreated, it ispreferabletosubmit it forvalidationtoallthe business experts who contributed to its completion. It can then be presented to the RiskCommittee.This catalog can be completed by a ranking of the origins of trend breaks that had the greatestimpactonthemagnitudeobserved.ThismakesitpossibletoraisetheawarenessoftheBusinessesandespeciallyall thedirectorsof insurancecompaniesabout the causesofnegative trendbreaks,butalsoaboutthemostefficientManagementActions-MA-.
2.3. ProspectiveAnalysisandCalibrationoftheFutureEvolutionofRisks2.3.1. Short-termanticipatorymeasures:theuseofsensors
Theadvantageofthisanticipatorystep is totake intoaccountrecent informationthatcanconfirmeither constancy or break of a trend in the short term (current year and next year),whether it isvisible inthedataornot.Toberesponsive,oneshouldnotwait for theestablishmentofaccountsandtheliquidationofclaims.
Inpractice, thisanticipationexercisecanbedifficult: theorientationof the trend (providedby theestimation models) is not easy, the opinions of the business experts can diverge, certain factorsinternalorexternaltothecompanycanchangetheexpectedeffects.
InourERMapproach,weproposeastate-basedanticipationmodelthatusesdatathatisinternalorexternaltoinsurancecompanies–wewillcallthemsensors-allowingshort-termdisruptioneffectstobe taken intoaccount. Thepurposeof thismethod, in addition toanticipation, is tobeable toenrichtheoverallriskassessment.
Whattypesofsensors?
Thesensorscanbeinternal(relatedtotheoperatingmodelofthecompany)orexternal(relatedtothesocialandeconomiccontext,forinstance);wehaveseveralcategories:
-Sensorsrelatedtothesocialenvironment(external):Householdconfidenceindex
-Sensorsrelatedtotheeconomicenvironment(external):Generalleveloffinancialmarkets,Housepriceindex,Governmentrating
-Sensorsrelatedtothestrategyormanagementmethodofthecompany(internalanddependingontheperimeterstudied):EfficiencyleveloftherecentlyestablishedMA(trenddiscountfactor),Leveloftheloyaltystrategy,LevelofCustomeradvicecompetence,LevelofCustomerIntelligence,LevelofMarketIntelligence,CustomerSatisfactionIndex
-Sensorsrelatedtotheevolutionofmedicine:Sensorsrelatedtotheevolutionofmedicine

8
Dependingontheunderwritingrisksortheperimetersconsidered,somesensorswillofcoursenothave(orhavelittle)impact:thecustomersatisfactionindexwillprobablyhavenoimpactontheriskofmortality!
These sensors arenot always "ahead"with respect to risk factordrift, but they can identify trendbreaks and serve aswarning signalswhen their evolution rate change.We can therefore considerthemasriskindicators.
Accordingtothevaluestakenbythesesensors,weproposetoestablishseveral"statesoftheworld"intheshort term(oneyear forexample),associatingwitheachof thesestatesaprobabilitysetbythebusinessexperts.
Howtobuildsensorsandintegratethemintotheriskmanagementprocess?
Somesensorsaredirectlyavailableandcalculatedbyaccreditedbodies (seecasestudybarometersectionErreur!Sourcedurenvoiintrouvable.).
Other sensorswillhave tobebuilt internallyusing statisticalmethodsand relyingoncross studiesandresearch.Thebuildingtaskscanbedelegatedtothebusinessexpertsand/ormembersofthedifferententitieserected,andautomatedthankstotheITsystems.
Eachsensormustbeassociatedwithanalerttriggerthresholddeterminedbythebusinessexpertsinchargeofitsmonitoring.
Whattodoifwedonothavesensors?
The traditionalmethod of anticipation should be used: collection of the opinions of the assignedbusiness experts with as basis the trend values and the associated risk limits estimated by theestimationmodelsforeachpopulationgroupandriskfactor.
Whichperformanceindicatorsaresuitedtoouranticipationapproach?
We propose the following indicator for the (annual) monitoring of the performance of our next
anticipationapproach: 1_
n
i ii
observé
p FIndicPerf Antic
F=
×=∑
,with:
- n=thenumberofstatesoftheestablishedworld.- Fithevalueoftheriskfactortobeestimatedinthestateoftheworldi.- Fobservedthetruevalueoftheriskfactor.- pitheprobabilityassociatedwiththestateoftheworldi.
Theseelementscanbeestablishedatthebeginningorinthemiddleoftheyearandtheindicatorwillbecalculatedsystematicallythefollowingyear(whentherealizedwillbeknown)andaccompaniedbythefollowingscaleallowingtomeasurethequalityofthestrategyofanticipation:
Itisimportanttonotethatourlimitedknowledgeofriskresultsinomittingcertainsensors.Theevolutionof contextsmay call in question the relevanceof our sensors:we therefore need aperpetualreviewofourindicators.
9
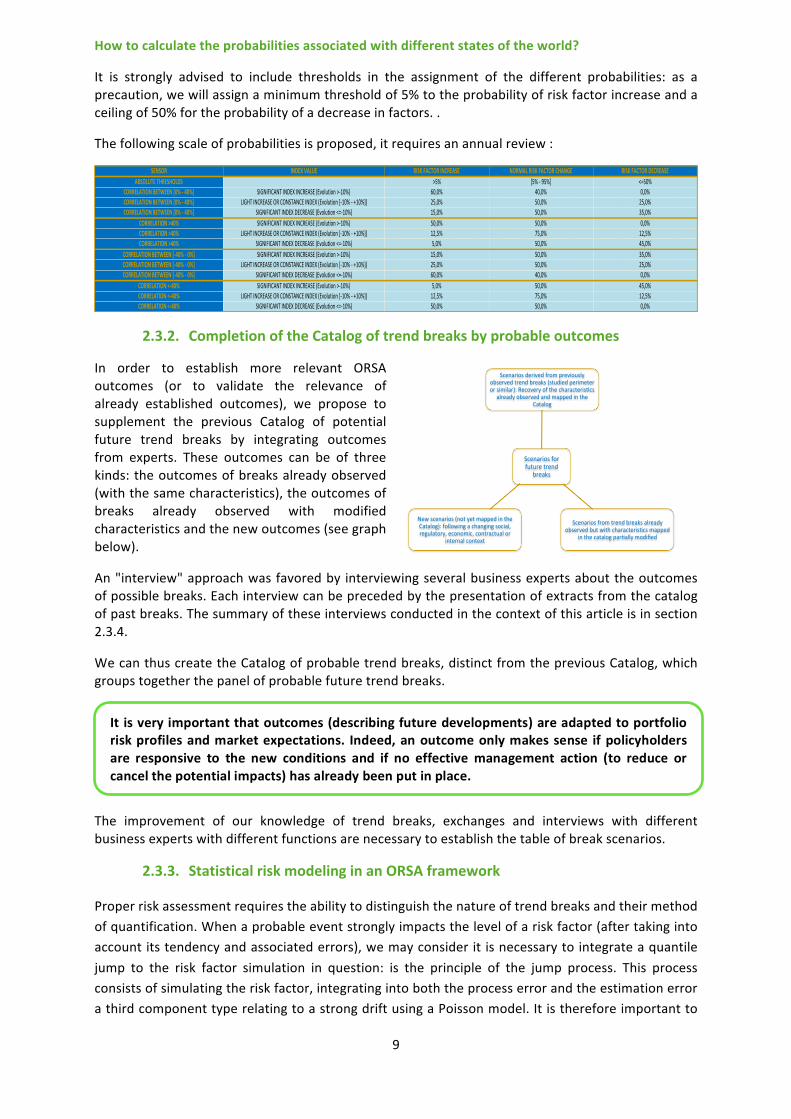
Howtocalculatetheprobabilitiesassociatedwithdifferentstatesoftheworld?
It is strongly advised to include thresholds in the assignment of the different probabilities: as aprecaution,wewillassignaminimumthresholdof5%totheprobabilityofriskfactorincreaseandaceilingof50%fortheprobabilityofadecreaseinfactors..
Thefollowingscaleofprobabilitiesisproposed,itrequiresanannualreview:
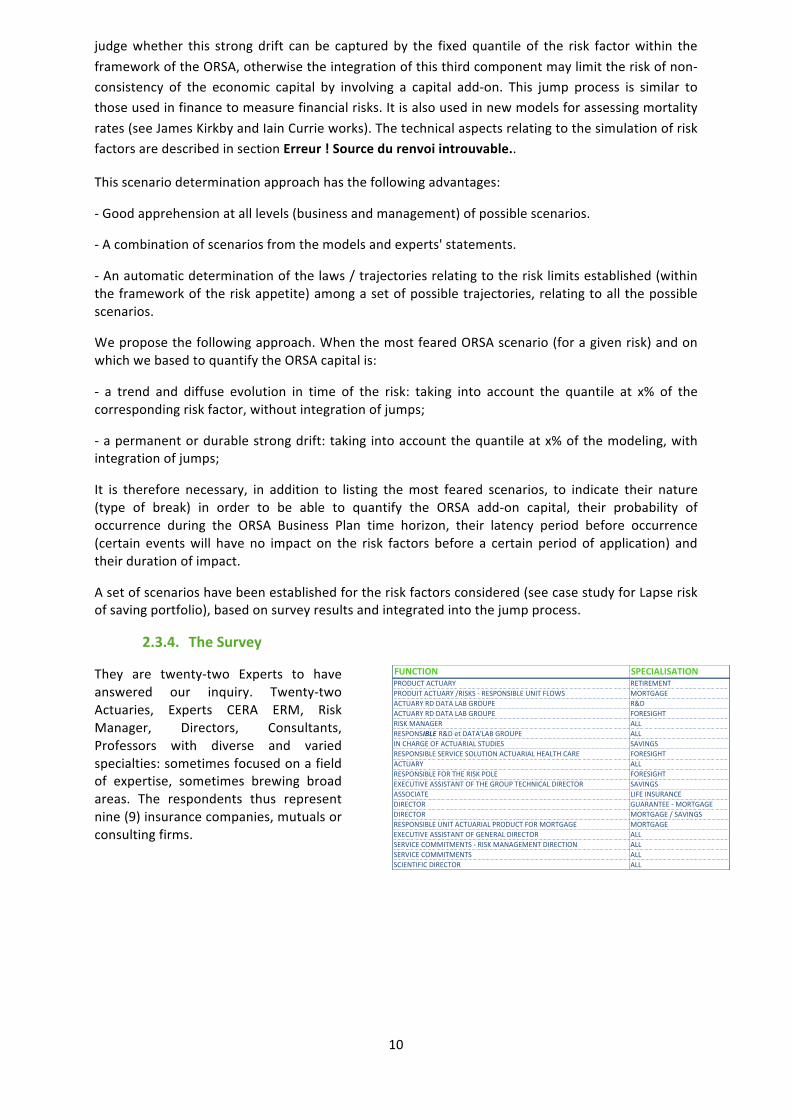
2.3.2. CompletionoftheCatalogoftrendbreaksbyprobableoutcomes
In order to establish more relevant ORSAoutcomes (or to validate the relevance ofalready established outcomes), we propose tosupplement the previous Catalog of potentialfuture trend breaks by integrating outcomesfrom experts. These outcomes can be of threekinds:theoutcomesofbreaksalreadyobserved(withthesamecharacteristics),theoutcomesofbreaks already observed with modifiedcharacteristicsandthenewoutcomes(seegraphbelow).
An"interview"approachwasfavoredby interviewingseveralbusinessexpertsabouttheoutcomesofpossiblebreaks.Eachinterviewcanbeprecededbythepresentationofextractsfromthecatalogofpastbreaks.Thesummaryoftheseinterviewsconductedinthecontextofthisarticleisinsection2.3.4.
WecanthuscreatetheCatalogofprobabletrendbreaks,distinctfromthepreviousCatalog,whichgroupstogetherthepanelofprobablefuturetrendbreaks.
The improvement of our knowledge of trend breaks, exchanges and interviews with differentbusinessexpertswithdifferentfunctionsarenecessarytoestablishthetableofbreakscenarios.
2.3.3. StatisticalriskmodelinginanORSAframework
Properriskassessmentrequirestheabilitytodistinguishthenatureoftrendbreaksandtheirmethodofquantification.Whenaprobableeventstronglyimpactsthelevelofariskfactor(aftertakingintoaccountitstendencyandassociatederrors),wemayconsiderit isnecessarytointegrateaquantilejump to the risk factor simulation in question: is the principle of the jump process. This processconsistsofsimulatingtheriskfactor,integratingintoboththeprocesserrorandtheestimationerrorathirdcomponenttyperelatingtoastrongdriftusingaPoissonmodel.Itisthereforeimportantto
SENSOR INDEXVALUE RISKFACTORINCREASE NORMALRISKFACTORCHANGE RISKFACTORDECREASEABSOLUTETHRESHOLDS >5% [5%-95%] <=50%
CORRELATIONBETWEEN[0%-40%] SIGNIFICANTINDEXINCREASE(Evolution>-10%) 60,0% 40,0% 0,0%CORRELATIONBETWEEN[0%-40%] LIGHTINCREASEORCONSTANCEINDEX(Evolution[-10%-+10%]) 25,0% 50,0% 25,0%CORRELATIONBETWEEN[0%-40%] SIGNIFICANTINDEXDECREASE(Evolution<=-10%) 15,0% 50,0% 35,0%
CORRELATION>40% SIGNIFICANTINDEXINCREASE(Evolution>-10%) 50,0% 50,0% 0,0%CORRELATION>40% LIGHTINCREASEORCONSTANCEINDEX(Evolution[-10%-+10%]) 12,5% 75,0% 12,5%CORRELATION>40% SIGNIFICANTINDEXDECREASE(Evolution<=-10%) 5,0% 50,0% 45,0%
CORRELATIONBETWEEN[-40%-0%] SIGNIFICANTINDEXINCREASE(Evolution>-10%) 15,0% 50,0% 35,0%CORRELATIONBETWEEN[-40%-0%] LIGHTINCREASEORCONSTANCEINDEX(Evolution[-10%-+10%]) 25,0% 50,0% 25,0%CORRELATIONBETWEEN[-40%-0%] SIGNIFICANTINDEXDECREASE(Evolution<=-10%) 60,0% 40,0% 0,0%
CORRELATION<-40% SIGNIFICANTINDEXINCREASE(Evolution>-10%) 5,0% 50,0% 45,0%CORRELATION<-40% LIGHTINCREASEORCONSTANCEINDEX(Evolution[-10%-+10%]) 12,5% 75,0% 12,5%CORRELATION<-40% SIGNIFICANTINDEXDECREASE(Evolution<=-10%) 50,0% 50,0% 0,0%
Scenariosforfuturetrend
breaks
Scenariosderivedfrompreviouslyobservedtrendbreaks(studiedperimeterorsimilar):Recoveryofthecharacteris;cs
alreadyobservedandmappedintheCatalog
Scenariosfromtrendbreaksalreadyobservedbutwithcharacteris;csmapped
inthecatalogpar;allymodified
Newscenarios(notyetmappedintheCatalog):followingachangingsocial,regulatory,economic,contractualor
internalcontext
It isveryimportantthatoutcomes(describingfuturedevelopments)areadaptedtoportfolioriskprofilesandmarketexpectations. Indeed,anoutcomeonlymakessenseifpolicyholdersare responsive to the new conditions and if no effective management action (to reduce orcancelthepotentialimpacts)hasalreadybeenputinplace.
10
judgewhether this strong drift can be capturedby the fixed quantile of the risk factorwithin theframeworkoftheORSA,otherwisetheintegrationofthisthirdcomponentmaylimittheriskofnon-consistency of the economic capital by involving a capital add-on. This jump process is similar tothoseusedinfinancetomeasurefinancialrisks.Itisalsousedinnewmodelsforassessingmortalityrates(seeJamesKirkbyandIainCurrieworks).ThetechnicalaspectsrelatingtothesimulationofriskfactorsaredescribedinsectionErreur!Sourcedurenvoiintrouvable..
Thisscenariodeterminationapproachhasthefollowingadvantages:
-Goodapprehensionatalllevels(businessandmanagement)ofpossiblescenarios.
-Acombinationofscenariosfromthemodelsandexperts'statements.
-Anautomaticdeterminationofthelaws/trajectoriesrelatingtotherisklimitsestablished(withintheframeworkoftheriskappetite)amongasetofpossibletrajectories,relatingtoallthepossiblescenarios.
Weproposethefollowingapproach.WhenthemostfearedORSAscenario(foragivenrisk)andonwhichwebasedtoquantifytheORSAcapitalis:
- a trend and diffuse evolution in time of the risk: taking into account the quantile at x% of thecorrespondingriskfactor,withoutintegrationofjumps;
-apermanentordurablestrongdrift:taking intoaccountthequantileatx%ofthemodeling,withintegrationofjumps;
It is therefore necessary, in addition to listing themost feared scenarios, to indicate their nature(type of break) in order to be able to quantify the ORSA add-on capital, their probability ofoccurrence during the ORSA Business Plan time horizon, their latency period before occurrence(certain eventswill have no impact on the risk factors before a certain period of application) andtheirdurationofimpact.
Asetofscenarioshavebeenestablishedfortheriskfactorsconsidered(seecasestudyforLapseriskofsavingportfolio),basedonsurveyresultsandintegratedintothejumpprocess.
2.3.4. TheSurvey
They are twenty-two Experts to haveanswered our inquiry. Twenty-twoActuaries, Experts CERA ERM, RiskManager, Directors, Consultants,Professors with diverse and variedspecialties:sometimesfocusedonafieldof expertise, sometimes brewing broadareas. The respondents thus representnine(9)insurancecompanies,mutualsorconsultingfirms.
FUNCTION SPECIALISATIONPRODUCTACTUARY RETIREMENTPRODUITACTUARY/RISKS-RESPONSIBLEUNITFLOWS MORTGAGEACTUARYRDDATALABGROUPE R&DACTUARYRDDATALABGROUPE FORESIGHTRISKMANAGER ALLRESPONSIBLER&DetDATA'LABGROUPE ALLINCHARGEOFACTUARIALSTUDIES SAVINGSRESPONSIBLESERVICESOLUTIONACTUARIALHEALTHCARE FORESIGHTACTUARY ALLRESPONSIBLEFORTHERISKPOLE FORESIGHTEXECUTIVEASSISTANTOFTHEGROUPTECHNICALDIRECTOR SAVINGSASSOCIATE LIFEINSURANCEDIRECTOR GUARANTEE-MORTGAGEDIRECTOR MORTGAGE/SAVINGSRESPONSIBLEUNITACTUARIALPRODUCTFORMORTGAGE MORTGAGEEXECUTIVEASSISTANTOFGENERALDIRECTOR ALLSERVICECOMMITMENTS-RISKMANAGEMENTDIRECTION ALLSERVICECOMMITMENTS ALLSCIENTIFICDIRECTOR ALL
11
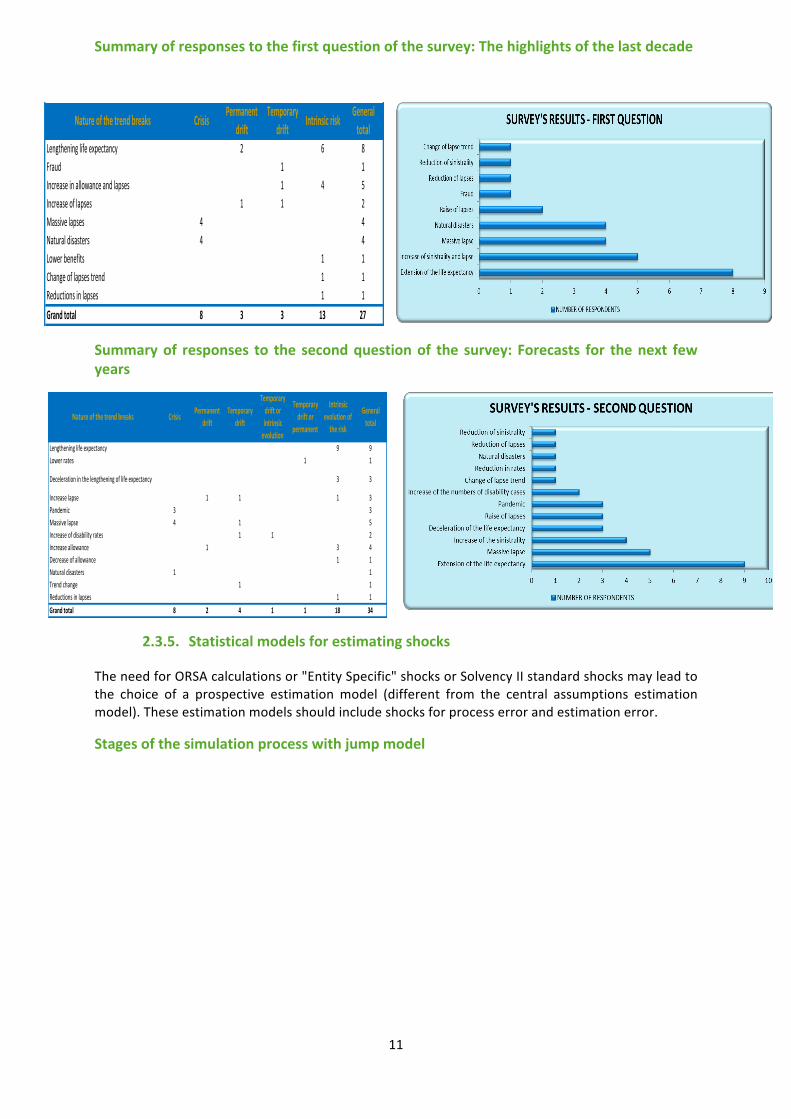
Summaryofresponsestothefirstquestionofthesurvey:Thehighlightsofthelastdecade
Summaryof responses to the secondquestionof the survey: Forecasts for thenext fewyears
2.3.5. Statisticalmodelsforestimatingshocks
TheneedforORSAcalculationsor"EntitySpecific"shocksorSolvencyIIstandardshocksmayleadtothe choice of a prospective estimation model (different from the central assumptions estimationmodel).Theseestimationmodelsshouldincludeshocksforprocesserrorandestimationerror.
Stagesofthesimulationprocesswithjumpmodel
Natureofthetrendbreaks Crisis Permanentdrift
Temporarydrift Intrinsicrisk General
totalLengtheninglifeexpectancy 2 6 8Fraud 1 1Increaseinallowanceandlapses 1 4 5Increaseoflapses 1 1 2Massivelapses 4 4Naturaldisasters 4 4Lowerbenefits 1 1Changeoflapsestrend 1 1Reductionsinlapses 1 1Grandtotal 8 3 3 13 27
Natureofthetrendbreaks Crisis Permanentdrift
Temporarydrift
Temporarydriftorintrinsicevolution
Temporarydriftor
permanent
Intrinsicevolutionoftherisk
Generaltotal
Lengtheninglifeexpectancy 9 9Lowerrates 1 1
Decelerationinthelengtheningoflifeexpectancy 3 3
Increaselapse 1 1 1 3Pandemic 3 3Massivelapse 4 1 5Increaseofdisabilityrates 1 1 2Increaseallowance 1 3 4Decreaseofallowance 1 1Naturaldisasters 1 1Trendchange 1 1Reductionsinlapses 1 1Grandtotal 8 2 4 1 1 18 34

12
TheparametersofthePoissonmodelintroducingthejumpsareasfollows:
- The latency period of the scenario lat : it is fixed according to experts and gives the number ofmonthsoryearsbeforeintegrationofascenariointhestochasticsimulations.
- The probability of occurrence of the scenario prob : it is fixed according to experts and isintegratedinthesimulationsviaaBernoullilaw.
-Theamplitudeofthescenarioaddedtotheriskfactornoted Amp : it iseitherfixedaccordingtoexperts,ortakenfromtheCatalogoftrendbreaks(incaseofscenariosalreadyobservedinthepast).ItisintegratedwithstochasticsimulationsviaaPoissonmodel.
-Thedurationofthescenario Dur :alsofixedbyexpertsandintegratedintostochasticsimulationsviaaPoissondistribution.
Theformulationoftheprocessisasfollows:
, , , ,
1_ _ 1 ( ) ( ) min(12,Poisson(Dur ))
lat t
ns prédit global s scen scen s scen s scen st t t t t t
scenEvol Facteur Evol Facteur Ber prob Poisson Ampε
<==
= + + × × ×∑
With:
- _ prédittEvol Facteur :Theestimatedevolutionoftheriskfactorbytheestimationmodel(seestep
3)withouterrors,foryeart.
- _ stEvol Facteur : the evolutionof the risk factorwith jumps integration, for the year t and the
simulations.
-n:thenumberofORSAscenariosfortheriskfactor
- ,global stε : theglobalerroraroundthetrendintegratingtheestimationerrorandtheprocesserror,
fortheyeartandthesimulations
• den%fica%onofthehistoricalperiod:itwouldbenecessarytokeepahistorysoastocorrectlyevaluatetrendsandadjustasta%s%calmodel.Thisstepallowstomodelonlythetrendoftheriskthatmustberepresenta%veofthecurrentviewoftheriskfactor
STEP1:CHOICEOFSTUDYHISTORY
• Weproposetomodeltheevolu%onrateoftheriskfactorbyhomogeneouspopula%ongroupsSTEP2:CHOICEOFTHEVARIABLETOMODEL
• Themodelshouldallowthejointsimula%onofprocessandes%ma%onerrors(basedontheevolu%onratesoftheriskfactorinSTEP2);theprocessandes%ma%onerrorcomponentsareassumedtobedecorrelated.Thisstepallowsthedetermina%onofshocksfores%ma%onandprocesserrorbyanintegratedapproachandbypopula%ongroups
STEP3:CHOICEOFTHESTATISTICALSIMULATIONMODEL
• Stochas%csimula%onoffutureriskevolu%onrates(withanumberofsimula%onshighenoughtoobtainadistribu%onoftheriskfactortobemodeled)
STEP4:STOCHASTICSIMULATIONOFTHEINTRINSICEVOLUTIONOFRISK
• Integra%onofarandomjumpprocesstoaddoneormoredevia%onsrelatedtothepoten%aldriHsofthestudyperimeter.Themodelmustmakeitpossibletoiden%fytheintegrateddriHscenariosforeachsimula%on
STEP5:ADDINGSCENARIOSOFFUTUREDERIVATIVES
• Recoveryofquan%les(atagivenconfidencelevel)andassociateddriHcharacteris%csforORSArequirements.Itisimportanttotransformtherisklimitintoascenariothatisunderstandabletoall
STEP6:RECOVERQUANTILESOFLAWSASSOCIATEDWITHRISKLIMITS
• Hedgera%o/capitalcalcula%onsforadversetrajectoriesSTEP7:CAPITALCALCULATIONS
13
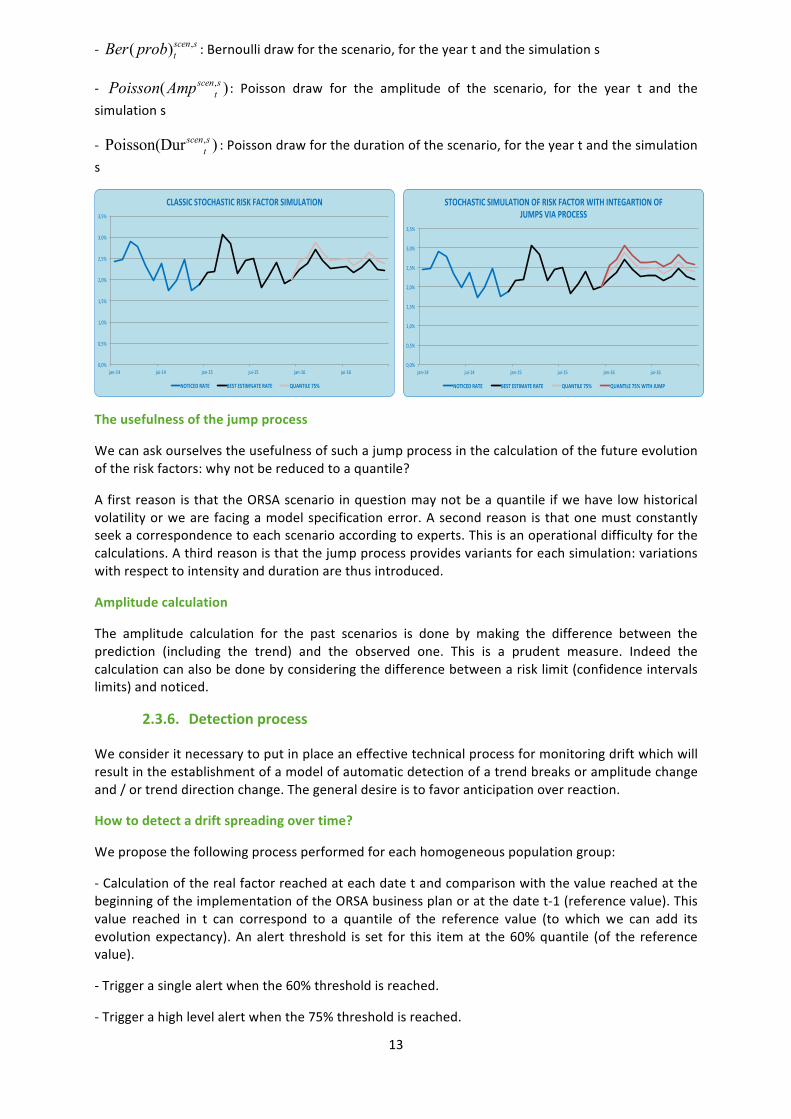
- ,( )scen stBer prob :Bernoullidrawforthescenario,fortheyeartandthesimulations
- ,( )scen stPoisson Amp : Poisson draw for the amplitude of the scenario, for the year t and the
simulations
- ,Poisson(Dur )scen st :Poissondrawforthedurationofthescenario,fortheyeartandthesimulation
s
Theusefulnessofthejumpprocess
Wecanaskourselvestheusefulnessofsuchajumpprocessinthecalculationofthefutureevolutionoftheriskfactors:whynotbereducedtoaquantile?
AfirstreasonisthattheORSAscenario inquestionmaynotbeaquantile ifwehavelowhistoricalvolatilityorwearefacingamodelspecificationerror.Asecondreason is thatonemustconstantlyseekacorrespondencetoeachscenarioaccordingtoexperts.Thisisanoperationaldifficultyforthecalculations.Athirdreasonisthatthejumpprocessprovidesvariantsforeachsimulation:variationswithrespecttointensityanddurationarethusintroduced.
Amplitudecalculation
The amplitude calculation for the past scenarios is done by making the difference between theprediction (including the trend) and the observed one. This is a prudent measure. Indeed thecalculationcanalsobedonebyconsideringthedifferencebetweenarisklimit(confidenceintervalslimits)andnoticed.
2.3.6. Detectionprocess
Weconsideritnecessarytoputinplaceaneffectivetechnicalprocessformonitoringdriftwhichwillresultintheestablishmentofamodelofautomaticdetectionofatrendbreaksoramplitudechangeand/ortrenddirectionchange.Thegeneraldesireistofavoranticipationoverreaction.
Howtodetectadriftspreadingovertime?
Weproposethefollowingprocessperformedforeachhomogeneouspopulationgroup:
-CalculationoftherealfactorreachedateachdatetandcomparisonwiththevaluereachedatthebeginningoftheimplementationoftheORSAbusinessplanoratthedatet-1(referencevalue).Thisvalue reached in t can correspond to a quantile of the reference value (to which we can add itsevolutionexpectancy).Analert threshold is set for this itemat the60%quantile (of the referencevalue).
-Triggerasinglealertwhenthe60%thresholdisreached.
-Triggerahighlevelalertwhenthe75%thresholdisreached.
0,0%
0,5%
1,0%
1,5%
2,0%
2,5%
3,0%
3,5%
jan-14 jui-14 jan-15 jui-15 jan-16 jui-16
CLASSICSTOCHASTICRISKFACTORSIMULATION
NOTICEDRATE BESTESTIM%ATERATE QUANTILE75%
0,0%
0,5%
1,0%
1,5%
2,0%
2,5%
3,0%
3,5%
jan-14 jui-14 jan-15 jui-15 jan-16 jui-16
STOCHASTICSIMULATIONOFRISKFACTORWITHINTEGARTIONOFJUMPSVIAPROCESS
NOTICEDRATE BESTESTIMATERATE QUANTILE75% QUANTILE75%WITHJUMP

14
Wecanaddasimplealerttriggerwhentherealizedisbelowafloorthresholdequalto40%.
Forregular(monthly)monitoring,weproposetheintegrationoftheCUSUMalgorithm,whichisanintrusion detection system to the IT systems. This algorithm has several advantages including thespeedof detectionof slowbreaks and theminimizationof the rateof false alarms. The thresholdlevels associated with this algorithm may be the same as those mentioned above. Despite theeffectiveness of this algorithm it has various limitations. For example the need to have a humancontroltocheckthedifferent"attacks".Itisalsoimpossibletoknowthetypeofevent,whichwillbefilledbytheparallelintroductionofsensorsandsendingalertmessages.
Howtodetectapointdrift?
For a follow-up of the high amplitude and punctual breaks, we propose to integrate also in thesystemsITanautomationofthecalculationsoftheriskfactorsatamonthlyfrequencyandtotriggeranautomaticalertincaseofexceedancesofthefixedthresholds.
Whattodowhenanalertisautomaticallytriggered?
When the alert is simple and the trendbreak is punctual, it is necessary to establish anexchangemeetingwiththebusinessexpertstoidentifythecauses,relyingonthesensors,andtomakeastudyinordertoinsertitintothecatalogofbreaks.
3. RISKTREATMENTANDMONITORINGQuantifying risks highlights the importance of implementing a risk review cycle that should befacilitated by strengthening good management practices such as validation and governance. Anumberofcomplexstepsaretobeforeseen/reviewedrequiringthegatheringofvariedskills.
3.1. StrengtheningtheactionsoftheGovernanceInstancesOBJECTIVES REALIZATION
3.2. ManagementActionOrientation(MA)Themajorchallengeforriskmanagersistolimit/anticipaterisksbystrengtheninggovernanceanddefiningmoreappropriatesolutionstodealwiththem(avoidance,acceptance,reductionorsharing).Moreover,itisnecessarytowaitfortheconfirmationofatrendbeforevalidatingthemanagement
Quantile 45%
Valuereachedint0+2fortheriskfactorX-Popula9ongroupY=>Noalerts
Quantile 63%
Valuereachedint0+3fortheriskfactorX-Popula9ongroupY=>simplealertlaunched
Quantile 86%
Valuereachedint0+5fortheriskfactorX-Popula9ongroupY=>highalerttriggered
(crisisorstrongdri?)
Adapttoanincreasinglycomplexandrigorousenvironment(requirementofregulators,integra9onofinforma9onsystems,socio-economicenvironment)
Sa9sfypartners,shareholdersormoreinvolvedcustomers,whoseekgreatertransparency
Systema9zetheuseofcriteriaorindicatorsinriskmonitoring
Focusonbusinessobjec9vestoensureefficiency
Privilegecau9onwhenmakingmethodologicalchoicestoobtainrobustassump9ons
Itmustincludearepresenta0veofallthefunc0onsthatcontributedtotheproduc0onofthecatalogoftrendbreaksandimpactcalcula0ons.
Itmustmeetatleasttwiceayear,andatthebeginningorendofthetransmissionofatrend-breakingscenarioalert.Itpre-validatesthedifferent"statesoftheworld"intheshortterm,aswellastheassociatedprobabili0es,fromthevalues��ofthesensors.ItreportstotheRiskCommiBee.
Thesteeringcommi.ee
Itmustbealertediflimitsareexceeded,trendbreaksanddecidecorrec0veac0onswiththebusinesslinesinvolved.Italsovalidatestheac0onsofthemanagement:inthisrespect,asynthesisofthecatalogofdriEs,impactsoftheMA,resultsofthedriEsimula0onsmustbetransmiBedtoit.
TheRiskCommi.ee
Itmustberegularlyinformedoftheexceedingoflimits,consequencesofdriEsorsitua0onsunderstress.Itvalidatesthecorrec0veorpreven0vemeasuresundertaken(MA).
Execu5veboard
15
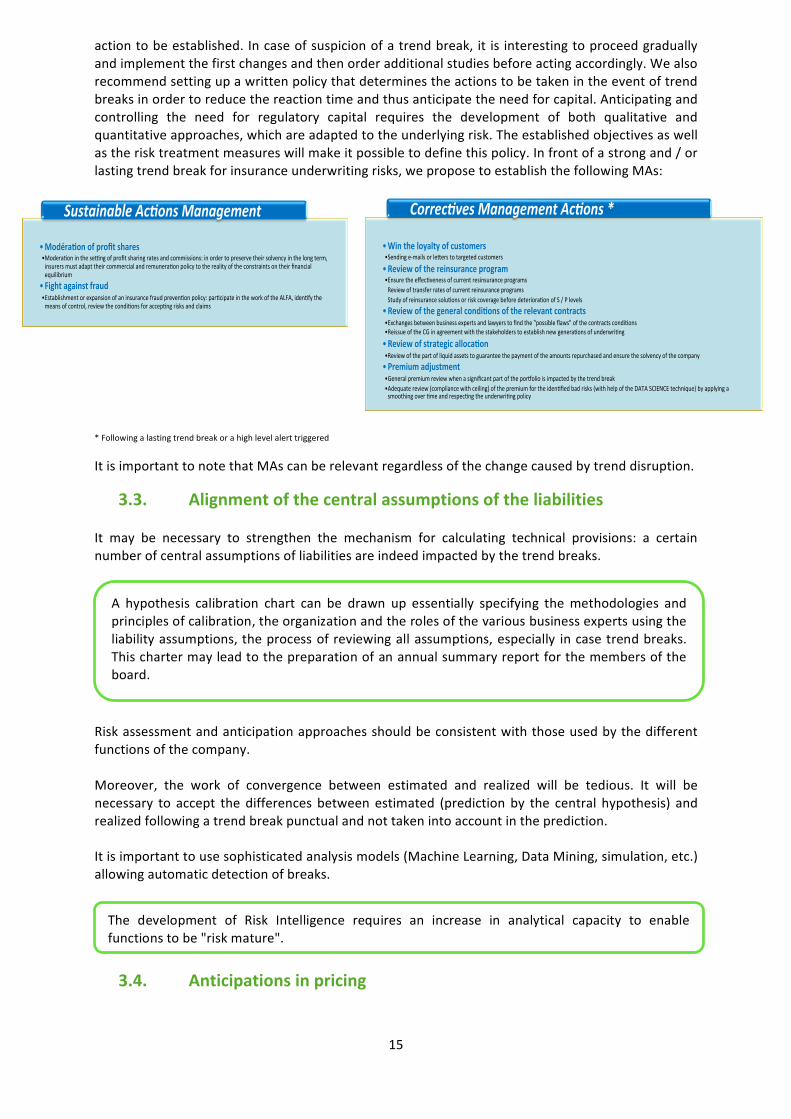
actiontobeestablished. Incaseofsuspicionofatrendbreak, it is interestingtoproceedgraduallyandimplementthefirstchangesandthenorderadditionalstudiesbeforeactingaccordingly.Wealsorecommendsettingupawrittenpolicythatdeterminestheactionstobetakenintheeventoftrendbreaksinordertoreducethereactiontimeandthusanticipatetheneedforcapital.Anticipatingandcontrolling the need for regulatory capital requires the development of both qualitative andquantitativeapproaches,whichareadaptedtotheunderlyingrisk.Theestablishedobjectivesaswellastherisktreatmentmeasureswillmakeitpossibletodefinethispolicy.Infrontofastrongand/orlastingtrendbreakforinsuranceunderwritingrisks,weproposetoestablishthefollowingMAs:
*Followingalastingtrendbreakorahighlevelalerttriggered
ItisimportanttonotethatMAscanberelevantregardlessofthechangecausedbytrenddisruption.
3.3. AlignmentofthecentralassumptionsoftheliabilitiesIt may be necessary to strengthen the mechanism for calculating technical provisions: a certainnumberofcentralassumptionsofliabilitiesareindeedimpactedbythetrendbreaks.
Riskassessmentandanticipationapproachesshouldbeconsistentwiththoseusedbythedifferentfunctionsofthecompany.Moreover, the work of convergence between estimated and realized will be tedious. It will benecessary to accept the differences between estimated (prediction by the central hypothesis) andrealizedfollowingatrendbreakpunctualandnottakenintoaccountintheprediction.Itisimportanttousesophisticatedanalysismodels(MachineLearning,DataMining,simulation,etc.)allowingautomaticdetectionofbreaks.
3.4. Anticipationsinpricing
• Modéra'onofprofitshares• Modera(oninthese/ngofprofitsharingratesandcommissions:inordertopreservetheirsolvencyinthelongterm,insurersmustadapttheircommercialandremunera(onpolicytotherealityoftheconstraintsontheirfinancialequilibrium
• Fightagainstfraud• Establishmentorexpansionofaninsurancefraudpreven(onpolicy:par(cipateintheworkoftheALFA,iden(fythemeansofcontrol,reviewthecondi(onsforaccep(ngrisksandclaims
SustainableAc.onsManagement
• Wintheloyaltyofcustomers• Sendinge-mailsorleGerstotargetedcustomers
• Reviewofthereinsuranceprogram• Ensuretheeffec(venessofcurrentresinsuranceprogramsReviewoftransferratesofcurrentreinsuranceprogramsStudyofreinsurancesolu(onsorriskcoveragebeforedeteriora(onofS/Plevels
• Reviewofthegeneralcondi'onsoftherelevantcontracts• Exchangesbetweenbusinessexpertsandlawyerstofindthe"possibleflaws"ofthecontractscondi(ons• ReissueoftheCGinagreementwiththestakeholderstoestablishnewgenera(onsofunderwri(ng
• Reviewofstrategicalloca'on• Reviewofthepartofliquidassetstoguaranteethepaymentoftheamountsrepurchasedandensurethesolvencyofthecompany• Premiumadjustment• GeneralpremiumreviewwhenasignificantpartoftheporPolioisimpactedbythetrendbreak• Adequatereview(compliancewithceiling)ofthepremiumfortheiden(fiedbadrisks(withhelpoftheDATASCIENCEtechnique)byapplyingasmoothingover(meandrespec(ngtheunderwri(ngpolicy
Correc.vesManagementAc.ons*
A hypothesis calibration chart can be drawn up essentially specifying themethodologies andprinciplesofcalibration,theorganizationandtherolesofthevariousbusinessexpertsusingtheliabilityassumptions,theprocessofreviewingallassumptions,especially incasetrendbreaks.Thischartermayleadtothepreparationofanannualsummaryreportforthemembersoftheboard.
The development of Risk Intelligence requires an increase in analytical capacity to enablefunctionstobe"riskmature".
16
Usually, the premium adjustments come after a period of deterioration of the results (premiumincrease)orafteraperiodofincreaseoftheresults(premiumdecrease).Weoftendenotealackofanticipation on changes in the experience, but also because the degradationmust be sufficientlysustainable, generalized to the market and known to the public to be acceptable to subscribers.Recentmajor developments (regulatory changes, Solvency II, development of distance selling andpricecomparators,pricecompetition, increasedanti-selection,enrichmentofserviceprovision)canchangethewayinwhichresultsandpricesaremanaged.Insurers'medium/shorttermcommitmentsareverysensitivetocyclicalfluctuations.Brutalshocksarerarelypredictable,butthedriftofthelossexperiencecanbeandtheratesadjustedaccordingly.The underwriters can thus capitalize on the use of sensors (see sectionErreur! Source du renvoiintrouvable.) and on the detection processes that serve as warning signals and establish theconsequences on profitability and premium. The main objective is to benefit from a betteranticipationonthebreaksoftrend,theriskstotakeandthosetoavoid,byanapproachbasedontheanticipationofprofitabilityandnolongeronindexedhistoricalbases.Fornewbusiness, it isnecessary toadaptpremiummorequickly thancompetitorsatnewmarketconditionsforbetterriskselection.Forclientsintheportfolio,wemustidentifyareasofprofitability,alertsubscribersveryearly(preventionandpsychologicalpreparation),raiseawarenessandinterestinresults.Wemustbeabletoofferalternativesolutionstothemostaffectedinsuredwithabettervisibilityoftherisksincurred.Towaituntilsubscribersarereadytoacceptpremiumincreases,wemustbeabletobuildamattressatthebeginningoftheboomperiod,agreetopresentsomeyearsdegradedresultsorevenlosses,andhaveaportfolioofinsuredrelativelyloyal,whichisresistanttohigherprices.
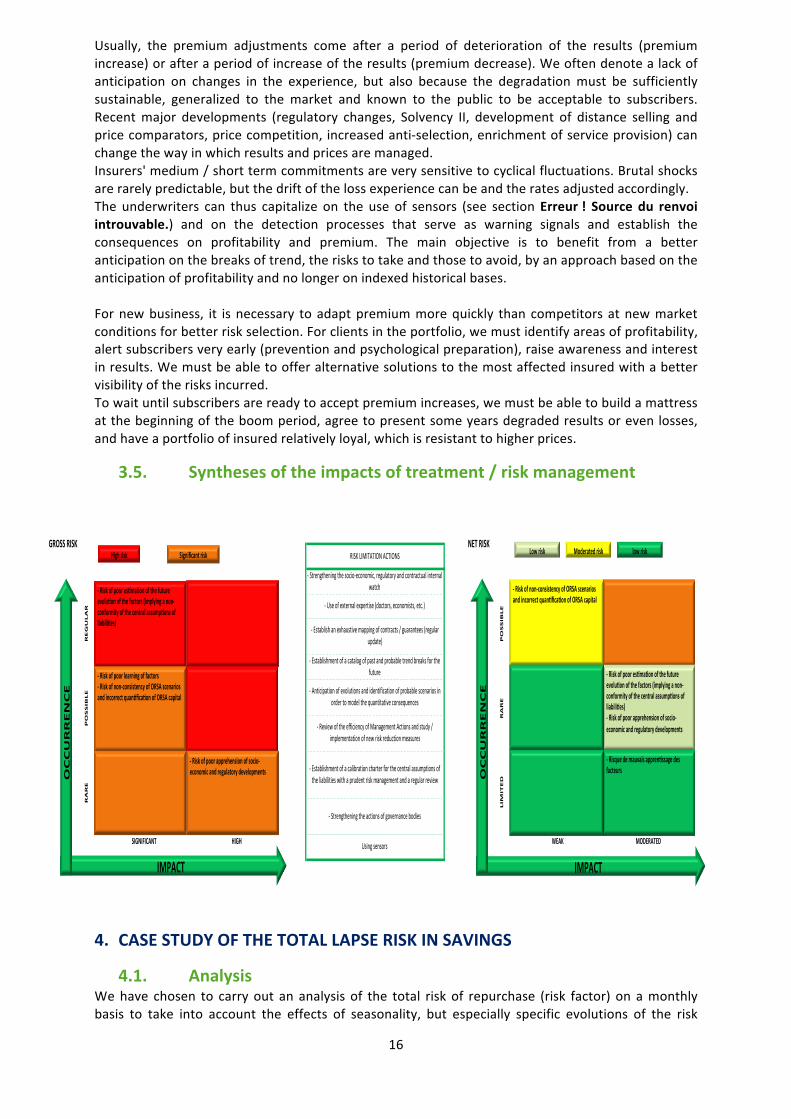
3.5. Synthesesoftheimpactsoftreatment/riskmanagement
4. CASESTUDYOFTHETOTALLAPSERISKINSAVINGS
4.1. AnalysisWehave chosen to carryout an analysis of the total risk of repurchase (risk factor) on amonthlybasis to take into account the effects of seasonality, but especially specific evolutions of the risk
SIGNIFICANT HIGH Usingsensors WEAK MODERATED
RARE
-Establishmentofacalibrationcharterforthecentralassumptionsoftheliabilitieswithaprudentriskmanagementandaregularreview
LIM
ITED
-Strengtheningtheactionsofgovernancebodies
-Useofexternalexpertise(doctors,economists,etc.)
-Establishanexhaustivemappingofcontracts/guarantees(regularupdate)
-Establishmentofacatalogofpastandprobabletrendbreaksforthefuture
POSSIBLE
RARE
-Anticipationofevolutionsandidentificationofprobablescenariosinordertomodelthequantitativeconsequences
-ReviewoftheefficiencyofManagementActionsandstudy/implementationofnewriskreductionmeasures
GROSSRISK NETRISKRISKLIMITATIONACTIONS
-Strengtheningthesocio-economic,regulatoryandcontractualinternalwatch
REGULAR
POSSIBLE
IMPACT
OCCURRENCE
-Riskofpoorapprehensionofsocio-economicandregulatorydevelopments
-RiskofpooresKmaKonofthefutureevoluKonofthefactors(implyinganon-conformityofthecentralassumpKonsofliabiliKes)
-Riskofpoorlearningoffactors-Riskofnon-consistencyofORSAscenariosandincorrectquanKficaKonofORSAcapital
Highrisk Significantrisk
IMPACT
OCCURRENCE
-RiskofpooresKmaKonofthefutureevoluKonofthefactors(implyinganon-conformityofthecentralassumpKonsofliabiliKes)-Riskofpoorapprehensionofsocio-economicandregulatorydevelopments-RisquedemauvaisapprenKssagedesfacteurs
-Riskofnon-consistencyofORSAscenariosandincorrectquanKficaKonofORSAcapital
ModeratedriskLowrisk lowrisk
17
factor.Statisticalanalyzes(usingtheK-MEANSandCAHclassificationmethods)havealreadymadeitpossibletoclassifyinsuredpersonsintogroupsofhomogeneouspopulations.
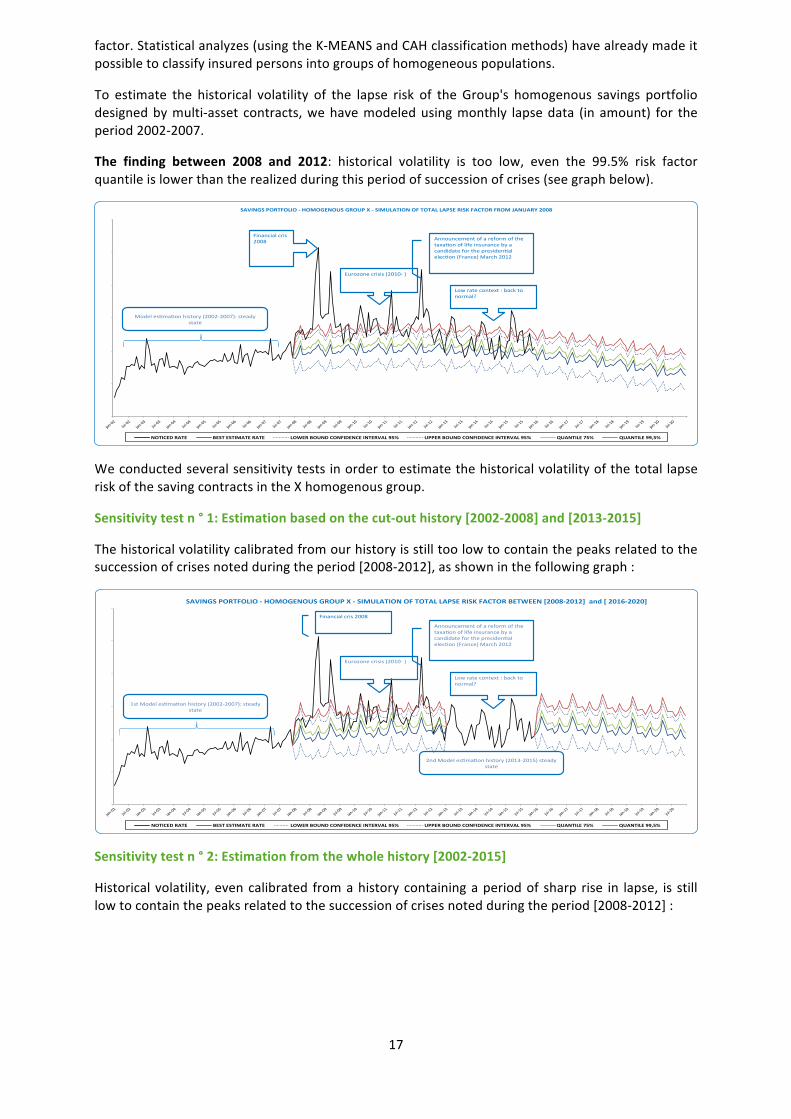
To estimate the historical volatility of the lapse risk of the Group's homogenous savings portfoliodesignedbymulti-asset contracts,wehavemodeledusingmonthly lapsedata (inamount) for theperiod2002-2007.
The finding between 2008 and 2012: historical volatility is too low, even the 99.5% risk factorquantileislowerthantherealizedduringthisperiodofsuccessionofcrises(seegraphbelow).
WeconductedseveralsensitivitytestsinordertoestimatethehistoricalvolatilityofthetotallapseriskofthesavingcontractsintheXhomogenousgroup.
Sensitivitytestn°1:Estimationbasedonthecut-outhistory[2002-2008]and[2013-2015]
Thehistoricalvolatilitycalibratedfromourhistoryisstilltoolowtocontainthepeaksrelatedtothesuccessionofcrisesnotedduringtheperiod[2008-2012],asshowninthefollowinggraph:
Sensitivitytestn°2:Estimationfromthewholehistory[2002-2015]
Historicalvolatility,evencalibrated fromahistorycontainingaperiodof sharp rise in lapse, is stilllowtocontainthepeaksrelatedtothesuccessionofcrisesnotedduringtheperiod[2008-2012]:
0,0%
1,0%
2,0%
3,0%
4,0%
5,0%
6,0%
jan-02
jui-02
jan-03
jui-03
jan-04
jui-04
jan-05
jui-05
jan-06
jui-06
jan-07
jui-07
jan-08
jui-08
jan-09
jui-09
jan-10
jui-10
jan-11
jui-11
jan-12
jui-12
jan-13
jui-13
jan-14
jui-14
jan-15
jui-15
jan-16
jui-16
jan-17
jui-17
jan-18
jui-18
jan-19
jui-19
jan-20
jui-20
SAVINGSPORTFOLIO-HOMOGENOUSGROUPX-SIMULATIONOFTOTALLAPSERISKFACTORFROMJANUARY2008
NOTICEDRATE BESTESTIMATERATE LOWERBOUNDCONFIDENCEINTERVAL95% UPPERBOUNDCONFIDENCEINTERVAL95% QUANTILE75% QUANTILE99,5%
Modeles:ma:onhistory(2002-2007):steadystate
Eurozonecrisis(2010-)
Announcementofareformofthetaxa:onoflifeinsurancebyacandidateforthepresiden:alelec:on(France)March2012
Lowratecontext:backtonormal?
Financialcris2008
0,0%
1,0%
2,0%
3,0%
4,0%
5,0%
6,0%
jan-02
jui-02
jan-03
jui-03
jan-04
jui-04
jan-05
jui-05
jan-06
jui-06
jan-07
jui-07
jan-08
jui-08
jan-09
jui-09
jan-10
jui-10
jan-11
jui-11
jan-12
jui-12
jan-13
jui-13
jan-14
jui-14
jan-15
jui-15
jan-16
jui-16
jan-17
jui-17
jan-18
jui-18
jan-19
jui-19
jan-20
jui-20
SAVINGSPORTFOLIO-HOMOGENOUSGROUPX-SIMULATIONOFTOTALLAPSERISKFACTORBETWEEN[2008-2012]and[2016-2020]
NOTICEDRATE BESTESTIMATERATE LOWERBOUNDCONFIDENCEINTERVAL95% UPPERBOUNDCONFIDENCEINTERVAL95% QUANTILE75% QUANTILE99,5%
1stModeles;ma;onhistory(2002-2007):steadystate
Eurozonecrisis(2010-)
Announcementofareformofthetaxa;onoflifeinsurancebyacandidateforthepresiden;alelec;on(France)March2012
Lowratecontext:backtonormal?
2ndModeles;ma;onhistory(2013-2015)steadystate
Financialcris2008

18
The observation is therefore always the same: the volatility is too low. We are facing a modelspecificationerror.
It shouldbenoted that spike reportingperiodsareshort,butas riskmanagers,wemayaskaboutpossibledurationsofotherlikelycrises.
4.2. TheCatalogofpasttrendbreaksExtractfromtheCatalogoftrendbreaks(establishedattheendof2015)
The disruptions in the total lapse risk observed in the savings portfolio scope revealed that thedynamiclapsepeakswerenotcausedbyadecorrelationbetweentherevaluationratesservedand
-1,0%
0,0%
1,0%
2,0%
3,0%
4,0%
5,0%
6,0%
jan-02
jui-
02
jan-03
jui-
03
jan-04
jui-
04
jan-05
jui-
05
jan-06
jui-
06
jan-07
jui-
07
jan-08
jui-
08
jan-09
jui-
09
jan-10
jui-
10
jan-11
jui-
11
jan-12
jui-
12
jan-13
jui-
13
jan-14
jui-
14
jan-15
jui-
15
jan-16
jui-
16
jan-17
jui-
17
jan-18
jui-
18
jan-19
jui-
19
jan-20
jui-
20
SAVINGSPORTFOLIO-HOMOGENOUSGROUPX-SIMULATIONOFTOTALLAPSERISKFACTORFROM2015
NOTICEDRATE BESTESTIMATERATE LOWERBOUNDCONFIDENCEINTERVAL95% UPPERBOUNDCONFIDENCEINTERVAL95% QUANTILE75% QUANTILE99,5%
Modeles:ma:onhistory(2012-2015)
Eurozonecrisis(2010-)
Announcementofareformofthetaxa:onoflifeinsurancebyacandidateforthepresiden:alelec:on(France)March2012
ContexteTauxbas:retouràlanormale?
Financialcris2008
PERIMETER
TOTALLAPSE TOTALLAPSE TOTALLAPSE TOTALLAPSE
SOURCE
ORIGIN
PRIMARYORIGINSubprimecrisis,Lehman'sBrother
bankruptcyDebtcrisisinsoutherncountries(Greece,
Portugal,Italy)Debtcrisisinsoutherncountries(Greece,
Portugal,Italy)
ThecandidateFrançoisHollandewhoseelectionwasannouncedbypollspromisestheendoftheadvantageoustaxationoflife
insuranceSTARTOFTHECAUSE Autumn2008 Spring2010 Spring2011 mars-12
NATURE ENDOGENEOUSDRIFT ENDOGENEOUSDRIFT ENDOGENEOUSDRIFT ENDOGENEOUSDRIFT
MEANING NEGATIVE NEGATIVE NEGATIVE NEGATIVE
PERIMETERAPPLICATION ALLCONTRACTS ALLCONTRACTS ALLCONTRACTS ALLCONTRACTS
DURATION Twomonths Twomonths Threemonths Amonth
OBJECTAPPLICATION LAPSERATE REDEMPTIONRATE REDEMPTIONRATE REDEMPTIONRATE
ABSOLUTEAMPLITUDEPERIMETERSAVINGS 1.53%inSeptemberand2.48%inOctober(+
0.63%fortheyear)
0.77%inMarchand0.43%inApril(+0.26%
fortheyear)
1.09%inMarchand0.76%inMay(+0.21%
fortheyear)1.46%(+0.27%fortheyear)
ABSOLUTEAMPLITUDEGROUP1 1.36%inSeptemberand2.20%inOctober(+
0.60%fortheyear)
0.88%inMarchand0.49%inApril(+0.33%
fortheyear)
1.17%inMarchand0.77%inMay(+0.28%
fortheyear)1.53%(+0.33%fortheyear)
ABSOLUTEAMPLITUDEGROUP2 2.23%inSeptemberand2.95%inOctober(+
1.02%fortheyear)
1.09%inMarchand0.41%inApril(+0.67%
fortheyear)
1.49%inMarchand0.95%inMay(+0.59%
fortheyear)2.07%(+0.59%fortheyear)
ABSOLUTEAMPLITUDEGROUP3 1.50%inSeptemberand2.49%inOctober(+
0.72%fortheyear)
-0.03%inMarchand-0.29%inApril(-0.27%
fortheyear)
0.55%inMarchand0.26%inMay(-0.04%for
theyear)0.72%(-0.04%fortheyear)
RELATIVEAMPLITUDEPERIMETERSAVINGS 59%inSeptemberand93%inOctober(+25%
fortheyear)
27%inMarchand17%inApril(+10%forthe
year)
37%inMarchand29%inMay(+8%forthe
year)49%(+10%fortheyear)
AMPLITUDERELATIVEGROUP1 60%inSeptemberand93%inOctober(+27%
fortheyear)
34%inMarchand21%inApril(+14%forthe
year)
43%inMarchand31%inMay(+11%forthe
year)55%(+12%fortheyear)
RELATIVEAMPLITUDEGROUP2 106%inSeptemberand134%inOctober(+
51%fortheyear)
47%inMarchand45%inApril(+31%forthe
year)
63%inMarchand46%inMay(+26%forthe
year)86%(+26%fortheyear)
RELATIVEAMPLITUDEGROUP3 101%inSeptemberand165%inOctober(+
51%fortheyear)
-2%inMarchand-13%inApril(-17%forthe
year)
31%inMarchand16%inMay(-7%forthe
year)39%(-2%fortheyear)
CAPACITYTOREPEATTHESAMEPHENOMENONONTHEOBSERVEDPERIMETER
YES YES YES YES
CAPACITYTOREPEATTHESAMEPHENOMENONONANOTHERPERIMETER
YES YES YES YES
NOTESAmplitudecalculatedbycomparingtheloss
periodlossexperiencewiththepredictedloss
ratiobythetrendcalculatedfor2002-2007
Amplitudecalculatedbycomparingtheloss
periodlossexperiencewiththepredictedloss
ratiobythetrendcalculatedfor2002-2007
Amplitudecalculatedbycomparingtheloss
periodlossexperiencewiththepredictedloss
ratiobythetrendcalculatedfor2002-2007
Amplitudecalculatedbycomparingtheloss
periodlossexperiencewiththepredictedloss
ratiobythetrendcalculatedfor2002-2007
STARTOFSETTINGSTARTEFFECT
ACTION
PERIMETERAPPLICATIONDURATIONRELATIVEAMPLITUDE[20-35[yearsRELATIVEAMPLITUDE[35-55[yearsRELATIVEAMPLITUDE[55-65[yearsNOTES
CARACT
ERISTIQUESM
ANAGEM
ENT
ACT
ION
CARACT
ERISTIQUESDER
IVE
FINANCIALCRISIS CRISISOFTHEEUROZONE CRISISOFTHEEUROZONE POLITICALANNOUNCEMENTONTAXATION
CATALOGOFTHETRENDBREAKS:UPDATEDATTHEENDOF2015
SAVING SAVING SAVING SAVING
19
thereferencerates:the2008crises,the2010-2011EurozonecrisisandthepeakofMarch2012aremainlyduetoapanicamongcustomersregardingthestabilityofthefinancialsystemornetcapitalloss.Inparticular,thepeakoflapsessetinMarch2012cameafteranannouncementofthechangeinthetaxationof life insurance(tothedetrimentofsomecustomers)announcedbythecandidateforthe2012presidentialelection,FrançoisHollande.
Current behavioral hypothesis donot specifically consider these effects, or they arediluted in thegeneraldata.Atpresent,theSapin2law(whichcameintoforcein2017)givesinsurersthepossibilitytofixyieldsandfreezerepaymentsandadvances:thiswouldthusmakeitpossibletolimitlossesandliquidityproblemsintheeventofmassivelapses.
4.3. Short-termanticipatorymeasures:TheuseofsensorsWeareinmid-2015, inacontextof lowinterestrates,andwewanttoanticipatethevaluesofthetotallapseriskfactorinoursavingsportfolio..
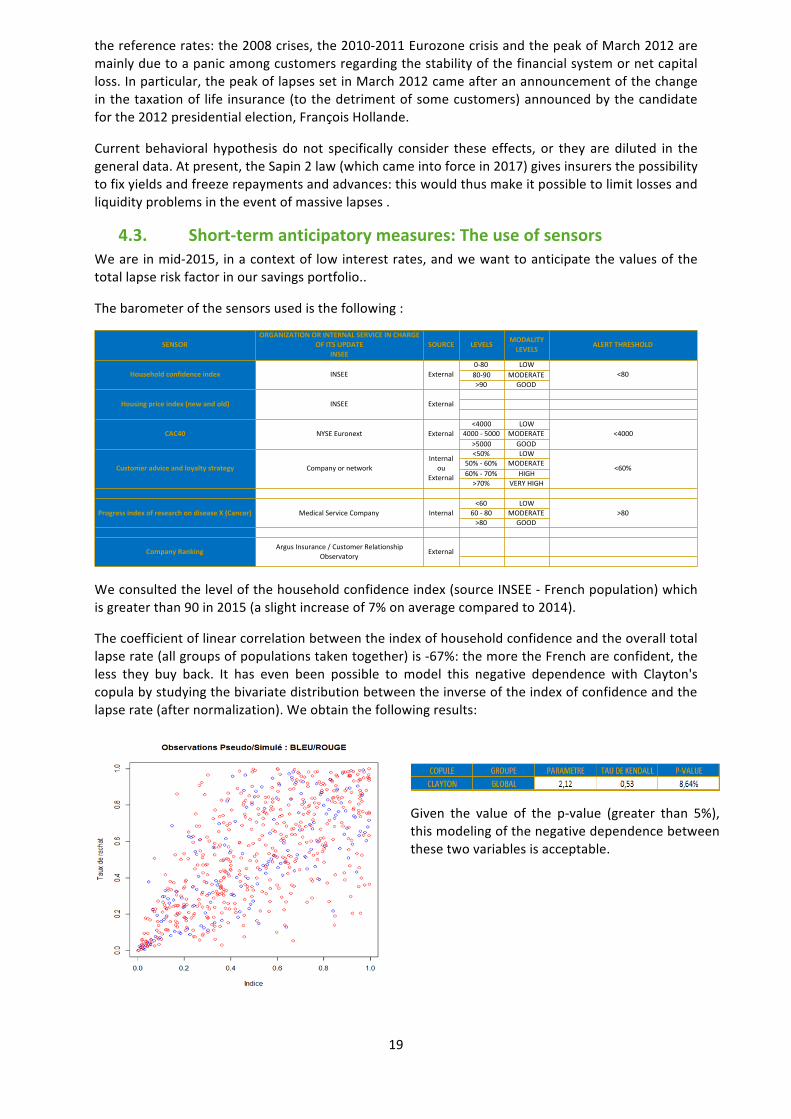
Thebarometerofthesensorsusedisthefollowing:
Weconsultedthelevelofthehouseholdconfidenceindex(sourceINSEE-Frenchpopulation)whichisgreaterthan90in2015(aslightincreaseof7%onaveragecomparedto2014).
Thecoefficientoflinearcorrelationbetweentheindexofhouseholdconfidenceandtheoveralltotallapserate(allgroupsofpopulationstakentogether)is-67%:themoretheFrenchareconfident,theless they buy back. It has even been possible to model this negative dependence with Clayton'scopulabystudyingthebivariatedistributionbetweentheinverseoftheindexofconfidenceandthelapserate(afternormalization).Weobtainthefollowingresults:
Given the value of the p-value (greater than 5%),thismodelingofthenegativedependencebetweenthesetwovariablesisacceptable.
SENSORORGANIZATIONORINTERNALSERVICEINCHARGE
OFITSUPDATEINSEE
SOURCE LEVELS MODALITYLEVELS ALERTTHRESHOLD
0-80 LOW80-90 MODERATE>90 GOOD
<4000 LOW4000-5000 MODERATE
>5000 GOOD<50% LOW
50%-60% MODERATE60%-70% HIGH>70% VERYHIGH
<60 LOW60-80 MODERATE>80 GOOD
ProgressindexofresearchondiseaseX(Cancer) MedicalServiceCompany Internal >80
CompanyRanking ArgusInsurance/CustomerRelationshipObservatory
External
CAC40 NYSEEuronext External <4000
Customeradviceandloyaltystrategy CompanyornetworkInternal
ouExternal
<60%
Householdconfidenceindex INSEE External <80
Housingpriceindex(newandold) INSEE External
20
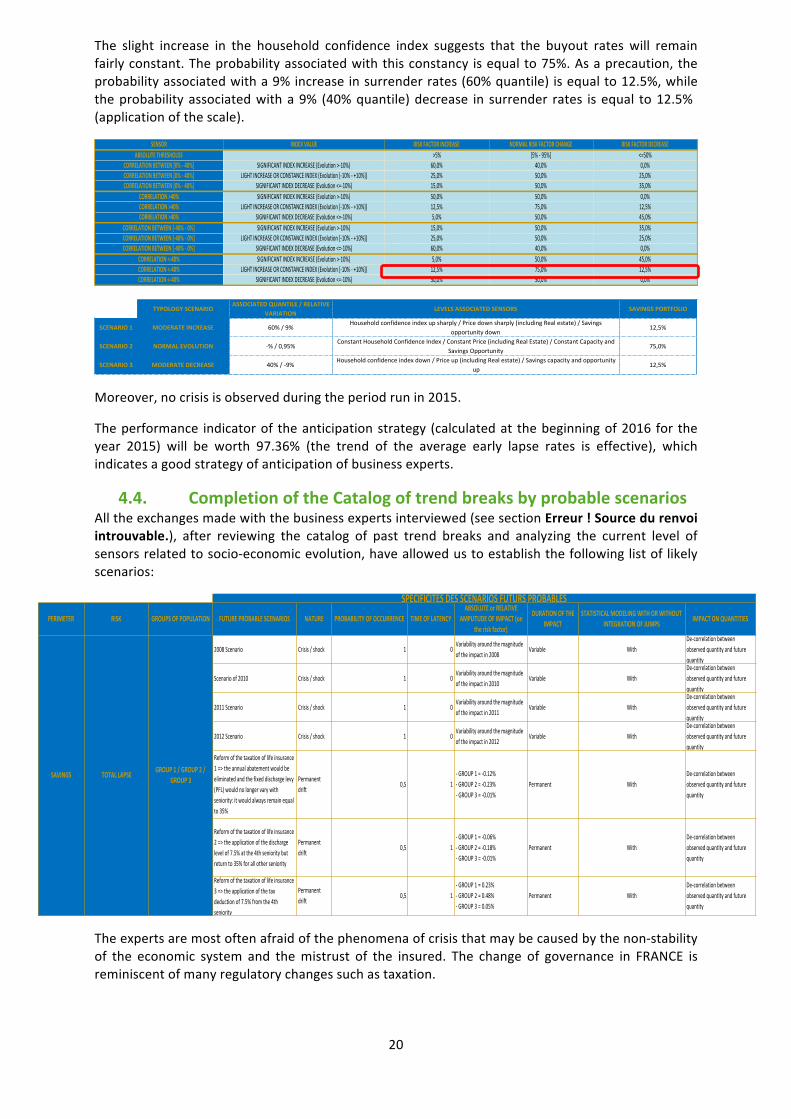
The slight increase in the household confidence index suggests that the buyout rates will remainfairlyconstant.Theprobabilityassociatedwiththisconstancy isequalto75%.Asaprecaution,theprobabilityassociatedwitha9%increaseinsurrenderrates(60%quantile) isequalto12.5%,whiletheprobabilityassociatedwitha9% (40%quantile)decrease in surrender rates isequal to12.5%(applicationofthescale).
Moreover,nocrisisisobservedduringtheperiodrunin2015.
Theperformance indicatorof theanticipationstrategy (calculatedat thebeginningof2016for theyear 2015) will be worth 97.36% (the trend of the average early lapse rates is effective), whichindicatesagoodstrategyofanticipationofbusinessexperts.
4.4. CompletionoftheCatalogoftrendbreaksbyprobablescenariosAlltheexchangesmadewiththebusinessexpertsinterviewed(seesectionErreur!Sourcedurenvoiintrouvable.), after reviewing the catalog of past trend breaks and analyzing the current level ofsensorsrelatedtosocio-economicevolution,haveallowedustoestablishthefollowinglistoflikelyscenarios:
Theexpertsaremostoftenafraidofthephenomenaofcrisisthatmaybecausedbythenon-stabilityof the economic system and themistrust of the insured. The change of governance in FRANCE isreminiscentofmanyregulatorychangessuchastaxation.
SENSOR INDEXVALUE RISKFACTORINCREASE NORMALRISKFACTORCHANGE RISKFACTORDECREASEABSOLUTETHRESHOLDS >5% [5%-95%] <=50%
CORRELATIONBETWEEN[0%-40%] SIGNIFICANTINDEXINCREASE(Evolution>-10%) 60,0% 40,0% 0,0%CORRELATIONBETWEEN[0%-40%] LIGHTINCREASEORCONSTANCEINDEX(Evolution[-10%-+10%]) 25,0% 50,0% 25,0%CORRELATIONBETWEEN[0%-40%] SIGNIFICANTINDEXDECREASE(Evolution<=-10%) 15,0% 50,0% 35,0%
CORRELATION>40% SIGNIFICANTINDEXINCREASE(Evolution>-10%) 50,0% 50,0% 0,0%CORRELATION>40% LIGHTINCREASEORCONSTANCEINDEX(Evolution[-10%-+10%]) 12,5% 75,0% 12,5%CORRELATION>40% SIGNIFICANTINDEXDECREASE(Evolution<=-10%) 5,0% 50,0% 45,0%
CORRELATIONBETWEEN[-40%-0%] SIGNIFICANTINDEXINCREASE(Evolution>-10%) 15,0% 50,0% 35,0%CORRELATIONBETWEEN[-40%-0%] LIGHTINCREASEORCONSTANCEINDEX(Evolution[-10%-+10%]) 25,0% 50,0% 25,0%CORRELATIONBETWEEN[-40%-0%] SIGNIFICANTINDEXDECREASE(Evolution<=-10%) 60,0% 40,0% 0,0%
CORRELATION<-40% SIGNIFICANTINDEXINCREASE(Evolution>-10%) 5,0% 50,0% 45,0%CORRELATION<-40% LIGHTINCREASEORCONSTANCEINDEX(Evolution[-10%-+10%]) 12,5% 75,0% 12,5%CORRELATION<-40% SIGNIFICANTINDEXDECREASE(Evolution<=-10%) 50,0% 50,0% 0,0%
TYPOLOGYSCENARIOASSOCIATEDQUANTILE/RELATIVE
VARIATIONLEVELSASSOCIATEDSENSORS SAVINGSPORTFOLIO
SCENARIO1 MODERATEINCREASE 60%/9%Householdconfidenceindexupsharply/Pricedownsharply(includingRealestate)/Savings
opportunitydown12,5%
SCENARIO2 NORMALEVOLUTION -%/0,95%ConstantHouseholdConfidenceIndex/ConstantPrice(includingRealEstate)/ConstantCapacityand
SavingsOpportunity75,0%
SCENARIO3 MODERATEDECREASE 40%/-9%Householdconfidenceindexdown/Priceup(includingRealestate)/Savingscapacityandopportunity
up12,5%
PERIMETER RISK GROUPSOFPOPULATION FUTUREPROBABLESCENARIOS NATURE PROBABILITYOFOCCURRENCE TIMEOFLATENCYABSOLUTEorRELATIVE
AMPLITUDEOFIMPACT(ontheriskfactor)
DURATIONOFTHEIMPACT
STATISTICALMODELINGWITHORWITHOUTINTEGRATIONOFJUMPS IMPACTONQUANTITIES
2008Scenario Crisis/shock 1 0Variabilityaroundthemagnitudeoftheimpactin2008
Variable WithDe-correlationbetweenobservedquantityandfuturequantity
Scenarioof2010 Crisis/shock 1 0Variabilityaroundthemagnitudeoftheimpactin2010
Variable WithDe-correlationbetweenobservedquantityandfuturequantity
2011Scenario Crisis/shock 1 0Variabilityaroundthemagnitudeoftheimpactin2011
Variable WithDe-correlationbetweenobservedquantityandfuturequantity
2012Scenario Crisis/shock 1 0Variabilityaroundthemagnitudeoftheimpactin2012
Variable WithDe-correlationbetweenobservedquantityandfuturequantity
Reformofthetaxationoflifeinsurance1=>theannualabatementwouldbeeliminatedandthefixeddischargelevy(PFL)wouldnolongervarywithseniority:itwouldalwaysremainequalto35%
Permanentdrift
0,5 1-GROUP1=-0.12%-GROUP2=-0.23%-GROUP3=-0.01%
Permanent WithDe-correlationbetweenobservedquantityandfuturequantity
Reformofthetaxationoflifeinsurance2=>theapplicationofthedischargelevelof7.5%atthe4thsenioritybutreturnto35%forallotherseniority
Permanentdrift
0,5 1-GROUP1=-0.06%-GROUP2=-0.18%-GROUP3=-0.01%
Permanent WithDe-correlationbetweenobservedquantityandfuturequantity
Reformofthetaxationoflifeinsurance3=>theapplicationofthetaxdeductionof7.5%fromthe4thseniority
Permanentdrift
0,5 1-GROUP1=0.23%-GROUP2=0.48%-GROUP3=0.05%
Permanent WithDe-correlationbetweenobservedquantityandfuturequantity
SPECIFICITESDESSCENARIOSFUTURSPROBABLES
TOTALLAPSESAVINGS GROUP1/GROUP2/GROUP3
21
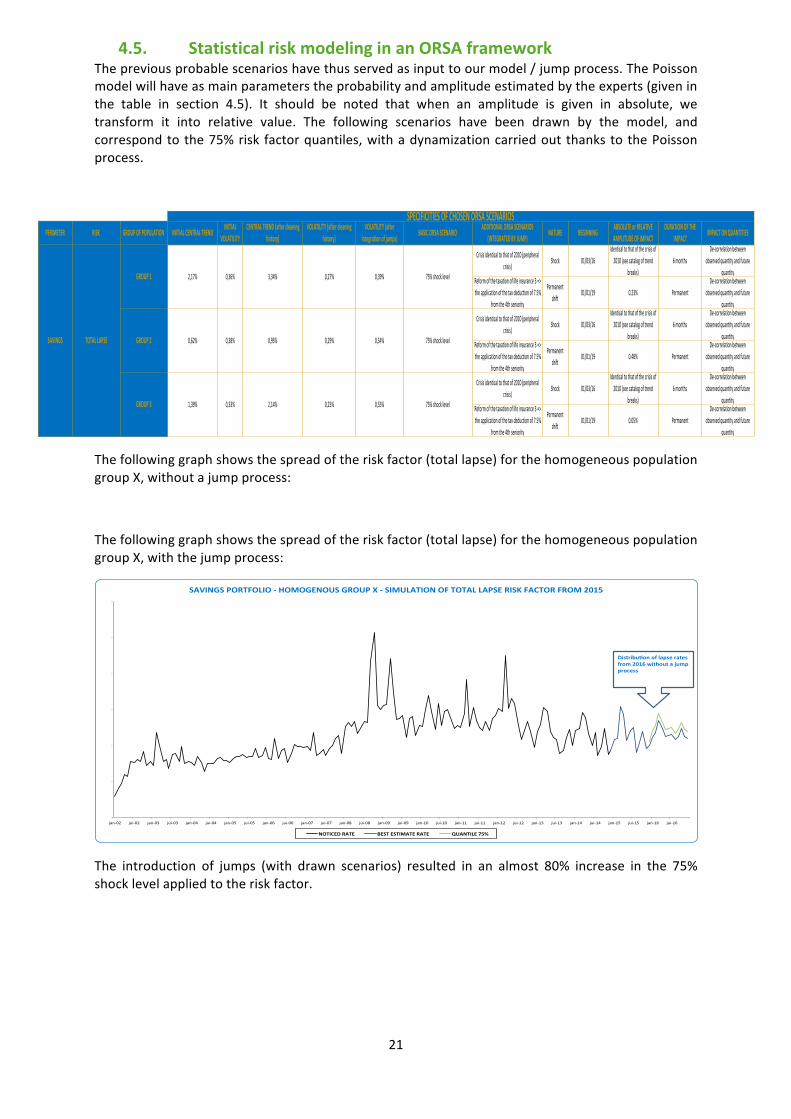
4.5. StatisticalriskmodelinginanORSAframeworkThepreviousprobablescenarioshavethusservedasinputtoourmodel/jumpprocess.ThePoissonmodelwillhaveasmainparameterstheprobabilityandamplitudeestimatedbytheexperts(giveninthe table in section 4.5). It should be noted that when an amplitude is given in absolute, wetransform it into relative value. The following scenarios have been drawn by the model, andcorrespondtothe75%risk factorquantiles,withadynamizationcarriedoutthankstothePoissonprocess.
Thefollowinggraphshowsthespreadoftheriskfactor(totallapse)forthehomogeneouspopulationgroupX,withoutajumpprocess:
Thefollowinggraphshowsthespreadoftheriskfactor(totallapse)forthehomogeneouspopulationgroupX,withthejumpprocess:
The introduction of jumps (with drawn scenarios) resulted in an almost 80% increase in the 75%shocklevelappliedtotheriskfactor.
PERIMETER RISK GROUPOFPOPULATION INITIALCENTRALTREND INITIALVOLATILITY
CENTRALTREND(aftercleaninghistory)
VOLATILITY(aftercleaninghistory)
VOLATILITY(afterintegrationofjumps) BASICORSASCENARIO ADDITIONALORSASCENARIOS
(INTEGRATEDBYJUMP) NATURE BEGINNING ABSOLUTEorRELATIVEAMPLITUDEOFIMPACT
DURATIONOFTHEIMPACT IMPACTONQUANTITIES
Crisisidenticaltothatof2010(peripheral
crisis)Shock 01/03/16
Identicaltothatofthecrisisof
2010(seecatalogoftrend
breaks)
6months
De-correlationbetween
observedquantityandfuture
quantityReformofthetaxationoflifeinsurance3=>
theapplicationofthetaxdeductionof7.5%
fromthe4thseniority
Permanent
drift01/01/19 0.23% Permanent
De-correlationbetween
observedquantityandfuture
quantity
Crisisidenticaltothatof2010(peripheral
crisis)Shock 01/03/16
Identicaltothatofthecrisisof
2010(seecatalogoftrend
breaks)
6months
De-correlationbetween
observedquantityandfuture
quantityReformofthetaxationoflifeinsurance3=>
theapplicationofthetaxdeductionof7.5%
fromthe4thseniority
Permanent
drift01/01/19 0.48% Permanent
De-correlationbetween
observedquantityandfuture
quantity
Crisisidenticaltothatof2010(peripheral
crisis)Shock 01/03/16
Identicaltothatofthecrisisof
2010(seecatalogoftrend
breaks)
6months
De-correlationbetween
observedquantityandfuture
quantityReformofthetaxationoflifeinsurance3=>
theapplicationofthetaxdeductionof7.5%
fromthe4thseniority
Permanent
drift01/01/19 0.05% Permanent
De-correlationbetween
observedquantityandfuture
quantity
75%shocklevel
GROUP3 1,39% 0,33% 2,14% 0,25% 0,55% 75%shocklevel
SPECIFICITIESOFCHOSENORSASCENARIOS
SAVINGS TOTALLAPSE
GROUP1 2,17% 0,36% 3,34% 0,27% 0,39% 75%shocklevel
GROUP2 0,62% 0,38% 0,95% 0,29% 0,54%
0,0%
1,0%
2,0%
3,0%
4,0%
5,0%
6,0%
jan-02 jui-02 jan-03 jui-03 jan-04 jui-04 jan-05 jui-05 jan-06 jui-06 jan-07 jui-07 jan-08 jui-08 jan-09 jui-09 jan-10 jui-10 jan-11 jui-11 jan-12 jui-12 jan-13 jui-13 jan-14 jui-14 jan-15 jui-15 jan-16 jui-16
SAVINGSPORTFOLIO-HOMOGENOUSGROUPX-SIMULATIONOFTOTALLAPSERISKFACTORFROM2015
NOTICEDRATE BESTESTIMATERATE QUANTILE75%
DistribuEonoflapseratesfrom2016withoutajumpprocess
22
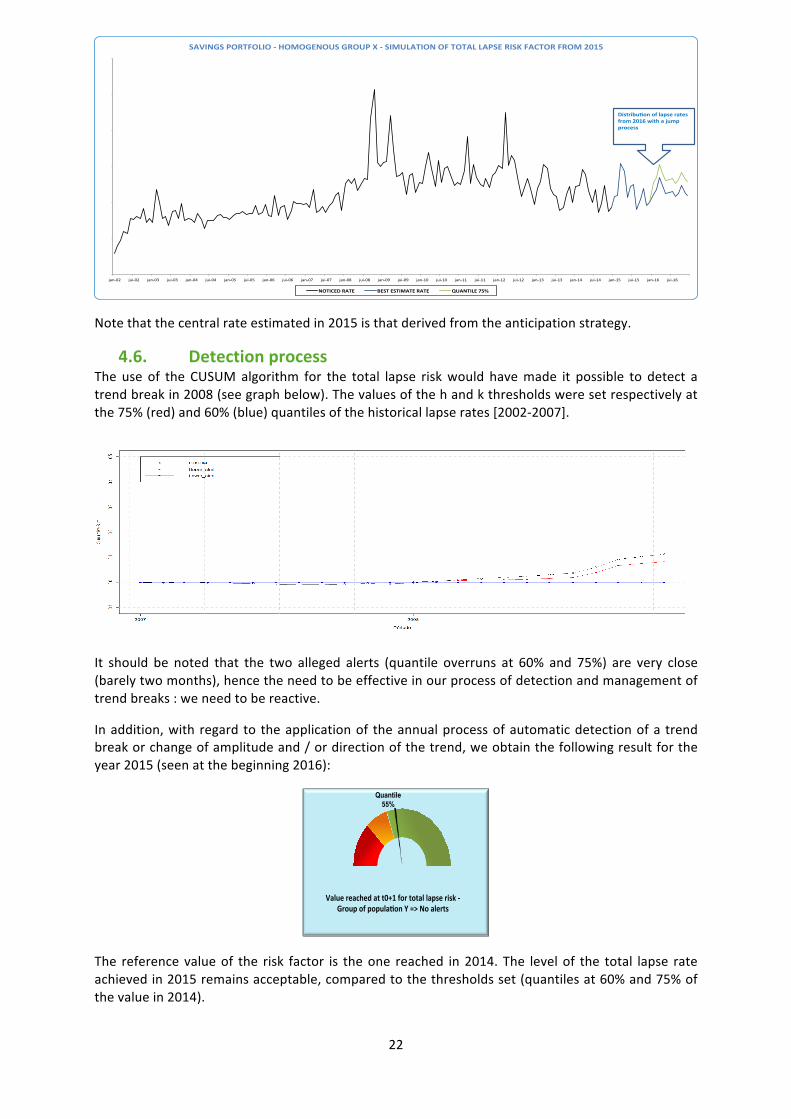
Notethatthecentralrateestimatedin2015isthatderivedfromtheanticipationstrategy.
4.6. DetectionprocessThe use of the CUSUMalgorithm for the total lapse riskwould havemade it possible to detect atrendbreakin2008(seegraphbelow).Thevaluesofthehandkthresholdsweresetrespectivelyatthe75%(red)and60%(blue)quantilesofthehistoricallapserates[2002-2007].
It should be noted that the two alleged alerts (quantile overruns at 60% and 75%) are very close(barelytwomonths),hencetheneedtobeeffectiveinourprocessofdetectionandmanagementoftrendbreaks:weneedtobereactive.
Inaddition,with regard to theapplicationof theannualprocessofautomaticdetectionofa trendbreakorchangeofamplitudeand/ordirectionofthetrend,weobtainthefollowingresultfortheyear2015(seenatthebeginning2016):
The referencevalueof the risk factor is theone reached in2014.The levelof the total lapse rateachievedin2015remainsacceptable,comparedtothethresholdsset(quantilesat60%and75%ofthevaluein2014).
0,0%
1,0%
2,0%
3,0%
4,0%
5,0%
6,0%
jan-02 jui-02 jan-03 jui-03 jan-04 jui-04 jan-05 jui-05 jan-06 jui-06 jan-07 jui-07 jan-08 jui-08 jan-09 jui-09 jan-10 jui-10 jan-11 jui-11 jan-12 jui-12 jan-13 jui-13 jan-14 jui-14 jan-15 jui-15 jan-16 jui-16
SAVINGSPORTFOLIO-HOMOGENOUSGROUPX-SIMULATIONOFTOTALLAPSERISKFACTORFROM2015
NOTICEDRATE BESTESTIMATERATE QUANTILE75%
DistribuEonoflapseratesfrom2016withajumpprocess
Quantile 55%
Valuereachedatt0+1fortotallapserisk-Groupofpopula7onY=>Noalerts
23
4.7. Attitudestowardrisk:treatmentsTheTechnicalDepartmentwishestoincorporateanewbehaviorallaw,thearbitragelaw,toensurethenon-unit linkedproducts /unit-linkedproducts transfer flowsobservedduringperiodsof crisis.Similarly, it isplannedtostudythepossibilityof incorporatingadynamiccomponentintothelapselawinlifeinsurancesavingportfolio,basedonthenetassetvaluesofunit-linkedproducts.
Furthermore, it is hoped that the estimatingperiodsof central lapse rates lawswill be revised: infact, they include periods [2008-2011] deemed volatile, with an upward trend in risk. We havereviewedourestimationhistorybyeliminatinglapsesobservedduringtheseperiods:thishashadapositiveimpactontheVIFandVNBvalues(valueincreasefollowingthereductionofthelapselevel),byallowingabetterconvergencebetweentherealizedandtheobservedin2015.
Since2014,theCompanyhaswishedtodevelopthesaleofproductswithaveryhighdetentionrateof unit-linked products. But facedwith the recognition of the high lapse rates recorded between2008and2011oncustomersinclinedtoinvestintounit-linkedplans(readingthecatalogueofpastruptures), it isplannedtostudy thepossibilityof transferring the risk toa reinsurer.Aguaranteedfloor could be proposed, in exchange for the payment of a premium. A transfer to counterpartywould follow the implementation of thismechanism,with transfer of all or part of the premiumsearnedontheguaranteedfloor.
TheFinanceDepartmentsuggestsadynamicassetallocationmethodtoreactquickly(inlessthanaweek)incaseofalertsfor:
-Thelevelofoneormoresocio-economicsensors.
-Thedetectionprocesses.
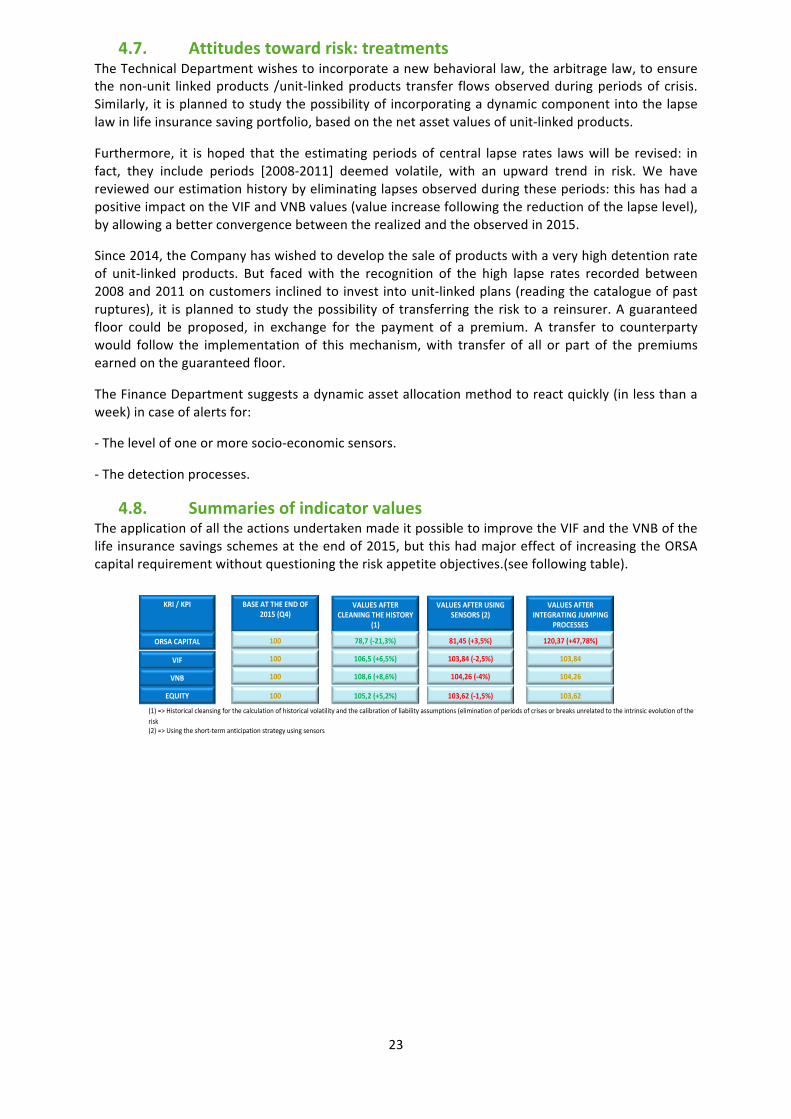
4.8. SummariesofindicatorvaluesTheapplicationofalltheactionsundertakenmadeitpossibletoimprovetheVIFandtheVNBofthelifeinsurancesavingsschemesattheendof2015,butthishadmajoreffectofincreasingtheORSAcapitalrequirementwithoutquestioningtheriskappetiteobjectives.(seefollowingtable).
(1)=>Historicalcleansingforthecalculationofhistoricalvolatilityandthecalibrationofliabilityassumptions(eliminationofperiodsofcrisesorbreaksunrelatedtotheintrinsicevolutionoftherisk(2)=>Usingtheshort-termanticipationstrategyusingsensors
KRI/KPI
ORSACAPITAL
VIF
VNB
EQUITY
BASEATTHEENDOF2015(Q4)
100
100
100
100
VALUESAFTERCLEANINGTHEHISTORY
(1)
78,7(-21,3%)
106,5(+6,5%)
108,6(+8,6%)
105,2(+5,2%)
VALUESAFTERUSINGSENSORS(2)
81,45(+3,5%)
103,84(-2,5%)
104,26(-4%)
103,62(-1,5%)
VALUESAFTERINTEGRATINGJUMPING
PROCESSES
120,37(+47,78%)
103,84
104,26
103,62
24
5. LIMITS
Themechanismpresentedinthisarticlerequireshavinganidentifiablepopulation(dataperinsured)andalonghistoryallowingacompleteanalysisofcertainphenomenaonthestudiedportfolios.Fineanalysisoftrendbreaksishardlypossiblewhenthedataareaggregated.
In addition, the data used is gross of reinsurance: we do not want to take into account thefluctuationsrelatedtochangesinreinsurancecoverage.
Forthebehavioralrisks(inparticularredemption),wecarriedoutaglobalstudy,bynotseparatingthestructuralonefromtheconjuncturalone.
Itwillalwaysbedifficult,whenseveraleventshappenat thesametime, tobeable to identify thepartassociatedwitheacheventonthedeformationoftheriskfactor.Likewise,itisalwayspossibleforaneventtocauseadisruptionofourriskfactorwithoutbeingabletodetectit.Nevertheless,theconcentrationandimprovementofthedifferentexpertisemakeitpossibletoreducethisrisk.
Ourarticledoesnottakeintoaccountthecorrelationeffectsofcertainscenariosbetweenrisksbutconcerns behavioral risks with market risks (for example: increase of surrenders due to a fall ofshares-valueinthemarket).However,aworkaroundistogeneratetheimpactsofcertainscenariossimultaneouslyonthemostsensitiveriskfactors.
6. CONCLUSION
The aim of this article was to propose a pragmaticmechanism for analyzing andmanaging trendbreaksforbiometricandbehavioralrisks.Giventhelimitationsofthemodels(integrationofrandomGaussian distribution), we present in this paper a method combining both historical scenarios,probable scenarios (according to experts) and scenarios derived from the models (oftenretranscribing only process and estimation errors). The idea is to have for each biometric andbehavioralriskapanelofscenariosinordertoconfrontthemtodrawthemostrelevantscenario.Itwillbeeasiertodescribetheconditionsinascenariothatleadtochangingtheriskfactoruptothequantiledefinedintherisklimits.
Our ERM approach based on the identification, evaluation, quantification and treatment of risksallows:
-tofacilitatethemonitoringofriskovertime,
-toanalyzeandexplainmoreeasilyonthemajorfactorsofthepasttrendbreakswhichmayhaveweighedonthestrategicobjectives,
-toanticipatefuturechanges,especiallywiththeemergenceofnewcustomerbehaviors,
-improvetheriskmanagementprocess,
-facilitatethestrategicchoicesofthegoverningpersonswithfasteraccesstorelevantinformation
That said, despite all anticipation efforts, somephenomenawill beunpredictable and canonly beobservedretroactively: thebestmanagementmethodremainsriskgovernance.The lattermustbereactive, efficient and endowed with "connected" human resources with the evolutions of theeconomic,socialandregulatoryenvironment.

25
7. APPENDICES
7.1. Glossary
ABBREVATION TERMUSES DEFINITION
SF STANDARDFORMULAModularmethodbasedontheapplicationofmarginalshockstodeterminetheprivateequityrequirementofaninsurance
companyundertheSolvencyIIDirective
IMF INTERNALMODELFORMULAMethodbasedonobtainingthedistributionoftheeconomic
capitalthataninsurancecompanymustholdundertheSolvencyIIDirective
ORSA OWNRISKSOLVENCYASSESSMENT Internalriskandsolvencyassessment
BU BUSINESSUNIT OperationalUnit
MA MANAGEMENTACTIONS Measuresofprevention/limitationofrisks
TP TECHNICALPROVISIONS
BP BUSINESSPLAN
MI MORTGAGEINSURANCE
VIF VALUEINFORCE Valueofinsuranceactivity
VNB VALUENEWBUSINESS ValueofNewBusiness
TG TERMSANDCONDITIONS
FFSA FEDERATIONFRANÇAISEDESSOCIETESD'ASSURANCE
ACPR AUTORITEDECONTROLEPRUDENTIELETDERESOLUTION
L’AutoritédecontrôleprudentieletderésolutionorthePrudentialSupervisoryandResolutionAuthority,an
independentadministrativeauthority,ensuresthestabilityofthefinancialsystemandtheprotectionofclients,insureds,membersandbeneficiariesofpersonsunderitscontrol.
GEMA GROUPEMENTDESENTREPRISESMUTUELLESD’ASSURANCES
ALFA AGENCEPOURLALUTTECONTRELAFRAUDEAL’ASSURANCE
Associationcreatedin1989attheinitiativeofFFSAandGEMAtoorganizethefightagainstinsurancefraud
ALM ASSETLIABILITYMANAGEMENT
AT Arrêtdetravail Disabilityrisk
R&D ResearchandDevelopment
UC UnitsofAccount
COMEX ExecutiveCommittee
26
7.2. References/Bibliography
§ Chrystelle BUSQUE - Mapping of Risks & Indicators (KPI, KRI) - ERM Training French Institute ofActuaries
§ Franck CHEVALIER - Concepts & methodological frameworks - Training ERM French Institute ofActuaries
§ Jean-Marc TALLON - Risk anduncertainty -Decisionmaking in risky environments and insurance -TrainingERMFrenchInstituteofActuaries
§ StéphaneLOISEL-RiskAttitudesandInsuranceModels(JointworkwithDavidIngram)-ERMTrainingFrenchInstituteofActuaries
§ Stéphane LOISEL - Risk Management Tools and Techniques - Training ERM French Institute ofActuaries
§ StéphaneLOISEL–Riskmeasuresandcopula-TrainingERMFrenchInstituteofActuaries§ Jean-Sébastien LAGACE – Natural Catastrophe Risk Assessment - ERM Training French Institute of
Actuaries§ NéfissaSATOR&GrégorySOTHER--Solvency2ApproachandRiskERMDependency,GuideofGood
Practice-MemoryTrainingERMFrenchInstituteofActuaries2012§ MarcJUILLARD&OlivierLOZACH–ImplementationofanORSAmodelforsavingscontractsinEuros-
MemoryTrainingERMFrenchInstituteofActuaries2012§ KhalilTABBI–CAPITALALLOCATIONINORSA-OperationalImplementation§ GurvanLeRhun&ElsaRenouf–Modelrisk-Puttingintopracticeinalifereinsurancecontext§ ChristianWalter-Problemsofthe"empiricalbase":theexampleofstockmarkettrajectories-SACEI
Daytraining(October2013)§ Dominique Abgrall : Exploring the longevity risk, using statistical tools derived from the Shiryaev-
Robertsprocedure;BasedonjointworkswithB.Franke,M.Habart,C.RainerandA.Sow(Septembre2016)
§ Planchet, F. and Tomas, J. (2014) - Constructing entity specific mortality table: Adjustment to areference
§ JamesKirkbyetIainCurrie-Smoothmodelsofmortalitywithperiodshocks§ VivienGuette-Determinationofanexcessmortalityratefora200-yearreturnperioddisaster
7.3. COSOIIprism


![[PPT]PowerPoint Presentation - Event Schedule & Agenda …schd.ws/hosted_files/2016agripspring/97/Joint ERM... · Web viewOutline ERM Frameworks Why CIS is Involved in ERM CIS ERM](https://img.pdfslide.net/doc/110x75/5ac13a447f8b9a4e7c8cc305/pptpowerpoint-presentation-event-schedule-agenda-schdwshostedfiles2016agripspring97joint.jpg)