Embed Size (px)
Citation preview
Analysis and Mitigation of Atmospheric Crosstalk
Kyle HilburnRemote Sensing Systems
May 21, 2015
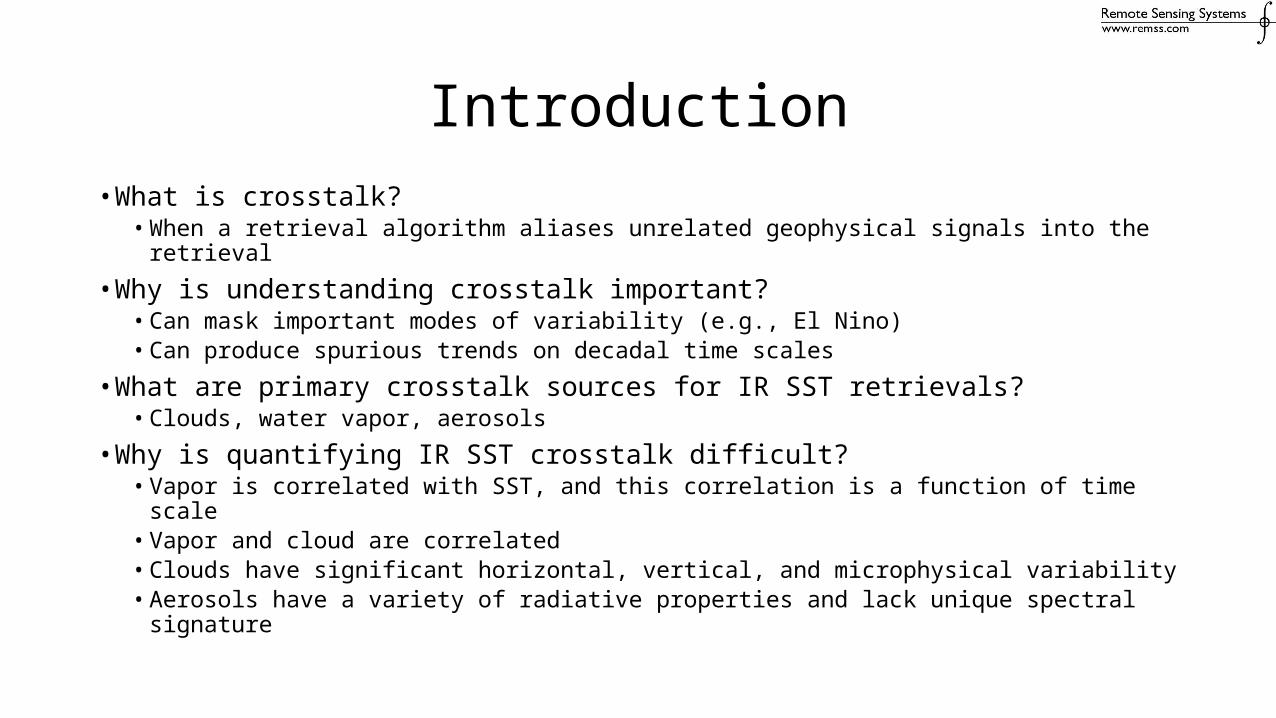
Introduction• What is crosstalk?
• When a retrieval algorithm aliases unrelated geophysical signals into the retrieval
• Why is understanding crosstalk important?• Can mask important modes of variability (e.g., El Nino)• Can produce spurious trends on decadal time scales
• What are primary crosstalk sources for IR SST retrievals?• Clouds, water vapor, aerosols
• Why is quantifying IR SST crosstalk difficult?• Vapor is correlated with SST, and this correlation is a function of time scale• Vapor and cloud are correlated • Clouds have significant horizontal, vertical, and microphysical variability• Aerosols have a variety of radiative properties and lack unique spectral signature
Objectives
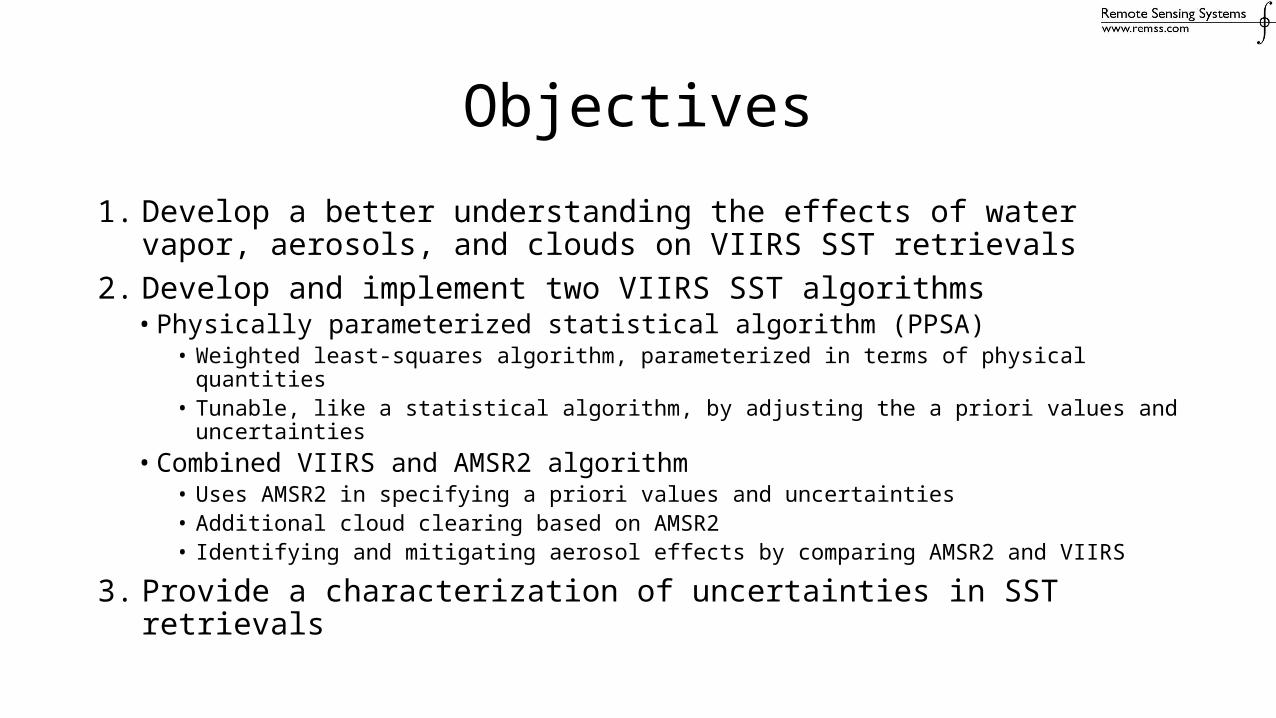
1. Develop a better understanding the effects of water vapor, aerosols, and clouds on VIIRS SST retrievals
2. Develop and implement two VIIRS SST algorithms• Physically parameterized statistical algorithm (PPSA)
• Weighted least-squares algorithm, parameterized in terms of physical quantities• Tunable, like a statistical algorithm, by adjusting the a priori values and uncertainties
• Combined VIIRS and AMSR2 algorithm• Uses AMSR2 in specifying a priori values and uncertainties• Additional cloud clearing based on AMSR2• Identifying and mitigating aerosol effects by comparing AMSR2 and VIIRS
3. Provide a characterization of uncertainties in SST retrievals
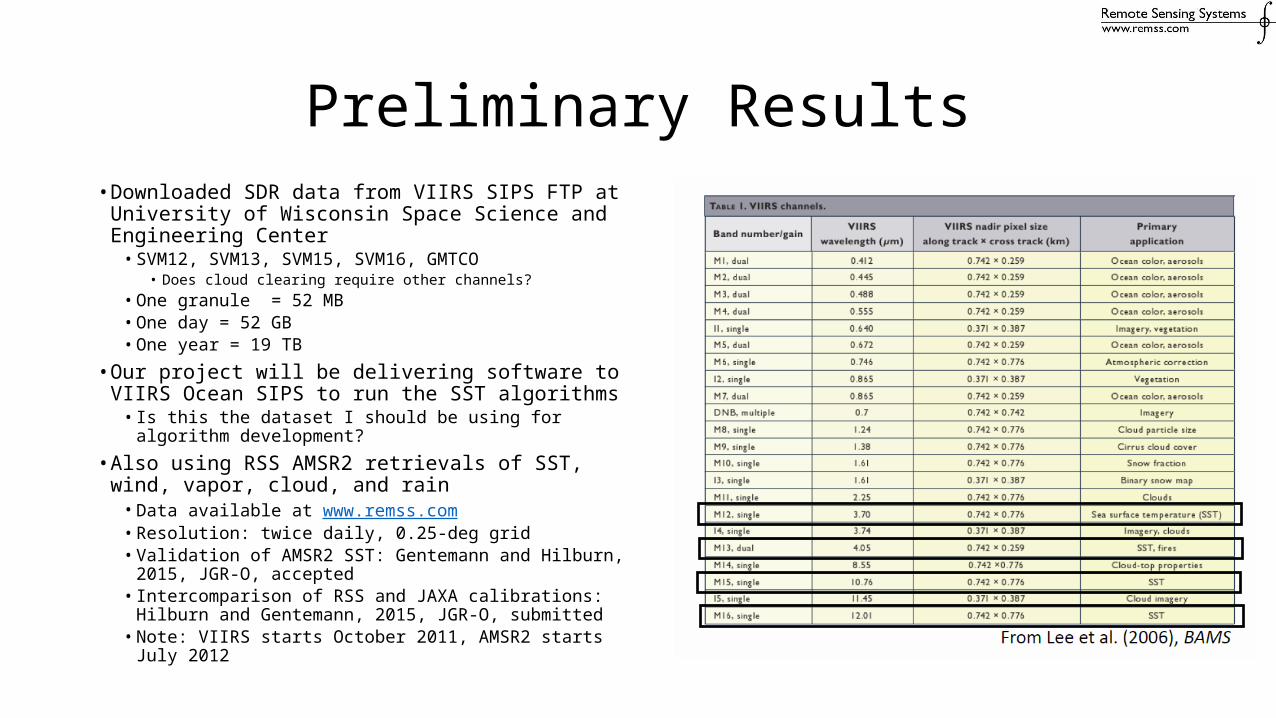
Preliminary Results• Downloaded SDR data from VIIRS SIPS FTP at University
of Wisconsin Space Science and Engineering Center• SVM12, SVM13, SVM15, SVM16, GMTCO
• Does cloud clearing require other channels?• One granule = 52 MB• One day = 52 GB• One year = 19 TB
• Our project will be delivering software to VIIRS Ocean SIPS to run the SST algorithms• Is this the dataset I should be using for algorithm
development?
• Also using RSS AMSR2 retrievals of SST, wind, vapor, cloud, and rain• Data available at www.remss.com• Resolution: twice daily, 0.25-deg grid• Validation of AMSR2 SST: Gentemann and Hilburn, 2015,
JGR-O, accepted• Intercomparison of RSS and JAXA calibrations: Hilburn and
Gentemann, 2015, JGR-O, submitted• Note: VIIRS starts October 2011, AMSR2 starts July 2012
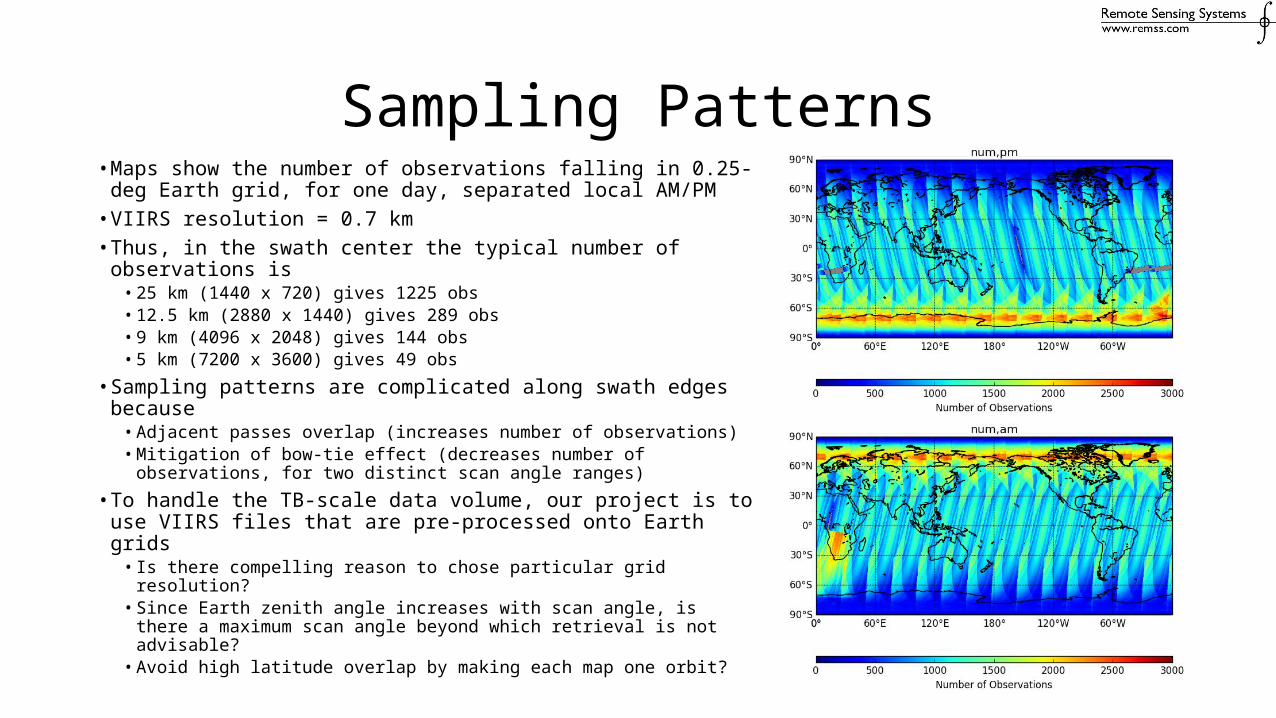
Sampling Patterns• Maps show the number of observations falling in 0.25-deg
Earth grid, for one day, separated local AM/PM• VIIRS resolution = 0.7 km• Thus, in the swath center the typical number of observations is
• 25 km (1440 x 720) gives 1225 obs• 12.5 km (2880 x 1440) gives 289 obs• 9 km (4096 x 2048) gives 144 obs• 5 km (7200 x 3600) gives 49 obs
• Sampling patterns are complicated along swath edges because• Adjacent passes overlap (increases number of observations)• Mitigation of bow-tie effect (decreases number of observations, for
two distinct scan angle ranges)
• To handle the TB-scale data volume, our project is to use VIIRS files that are pre-processed onto Earth grids• Is there compelling reason to chose particular grid resolution?• Since Earth zenith angle increases with scan angle, is there a
maximum scan angle beyond which retrieval is not advisable?• Avoid high latitude overlap by making each map one orbit?
Viewing Geometry
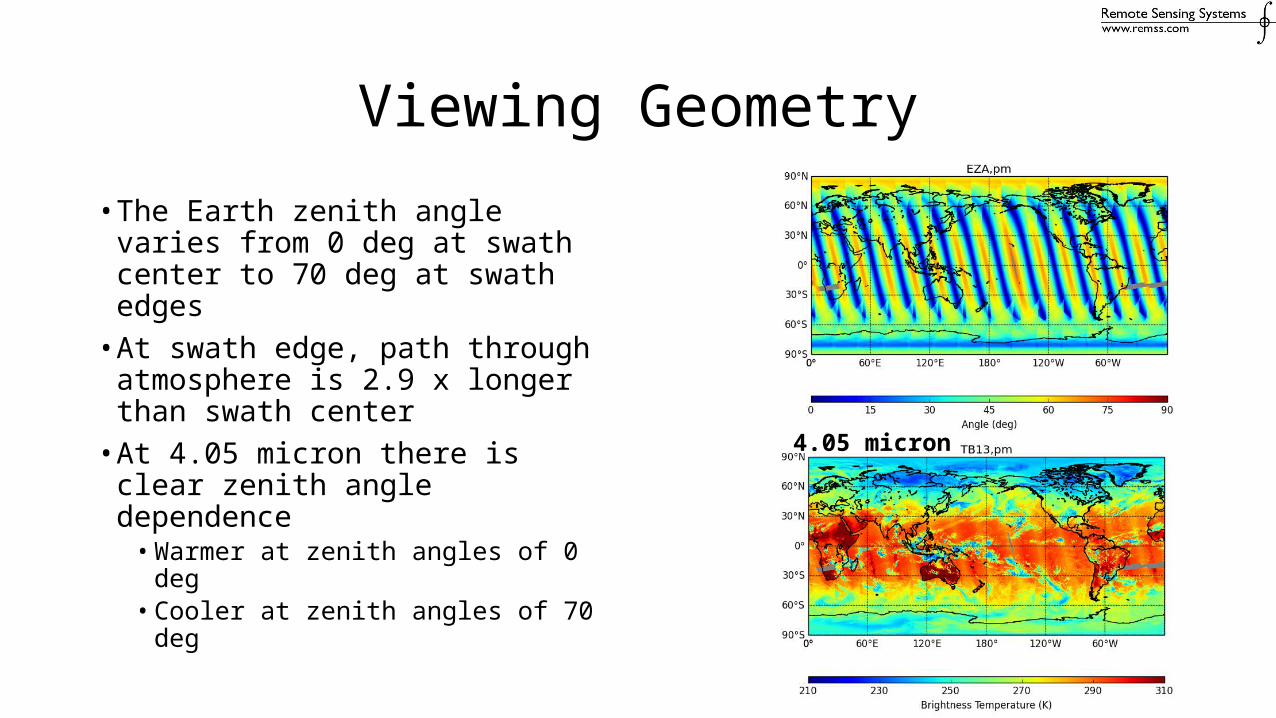
• The Earth zenith angle varies from 0 deg at swath center to 70 deg at swath edges• At swath edge, path through
atmosphere is 2.9 x longer than swath center• At 4.05 micron there is clear
zenith angle dependence• Warmer at zenith angles of 0 deg• Cooler at zenith angles of 70 deg
4.05 micron
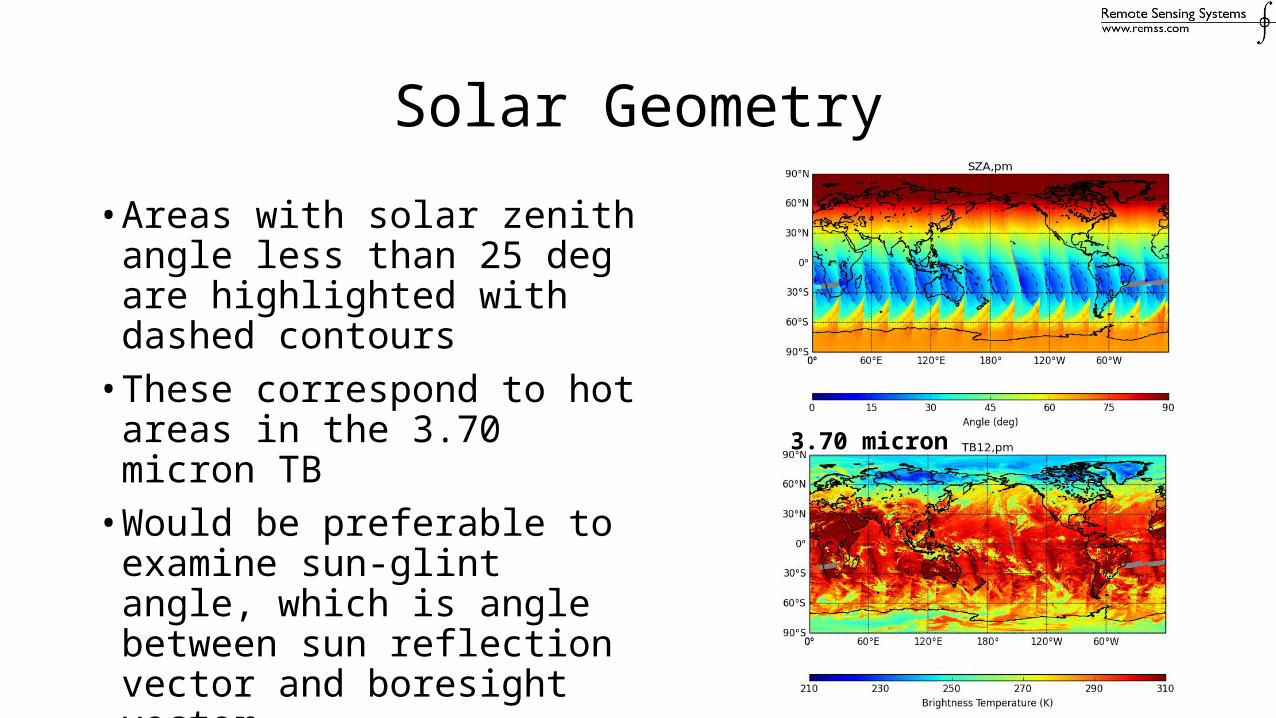
Solar Geometry
• Areas with solar zenith angle less than 25 deg are highlighted with dashed contours• These correspond to hot areas in
the 3.70 micron TB• Would be preferable to examine
sun-glint angle, which is angle between sun reflection vector and boresight vector
3.70 micron
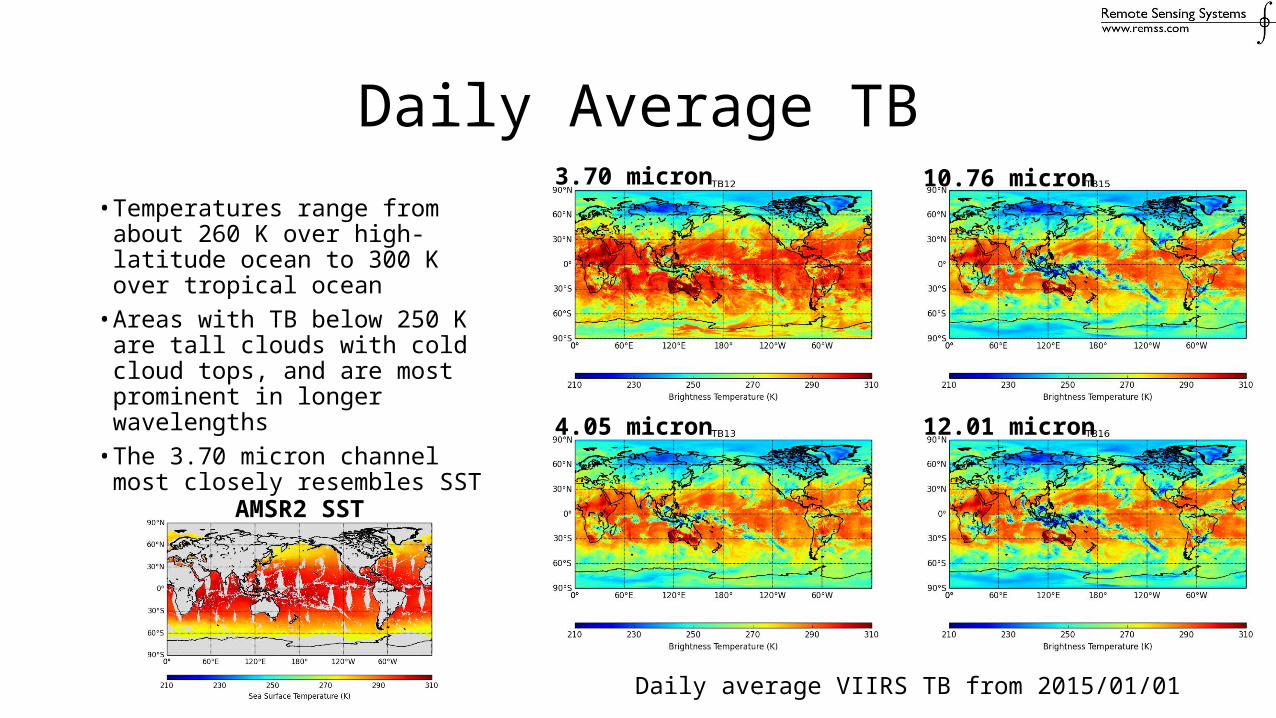
Daily Average TB
• Temperatures range from about 260 K over high-latitude ocean to 300 K over tropical ocean
• Areas with TB below 250 K are tall clouds with cold cloud tops, and are most prominent in longer wavelengths
• The 3.70 micron channel most closely resembles SST
3.70 micron
4.05 micron
10.76 micron
12.01 micron
Daily average VIIRS TB from 2015/01/01
AMSR2 SST
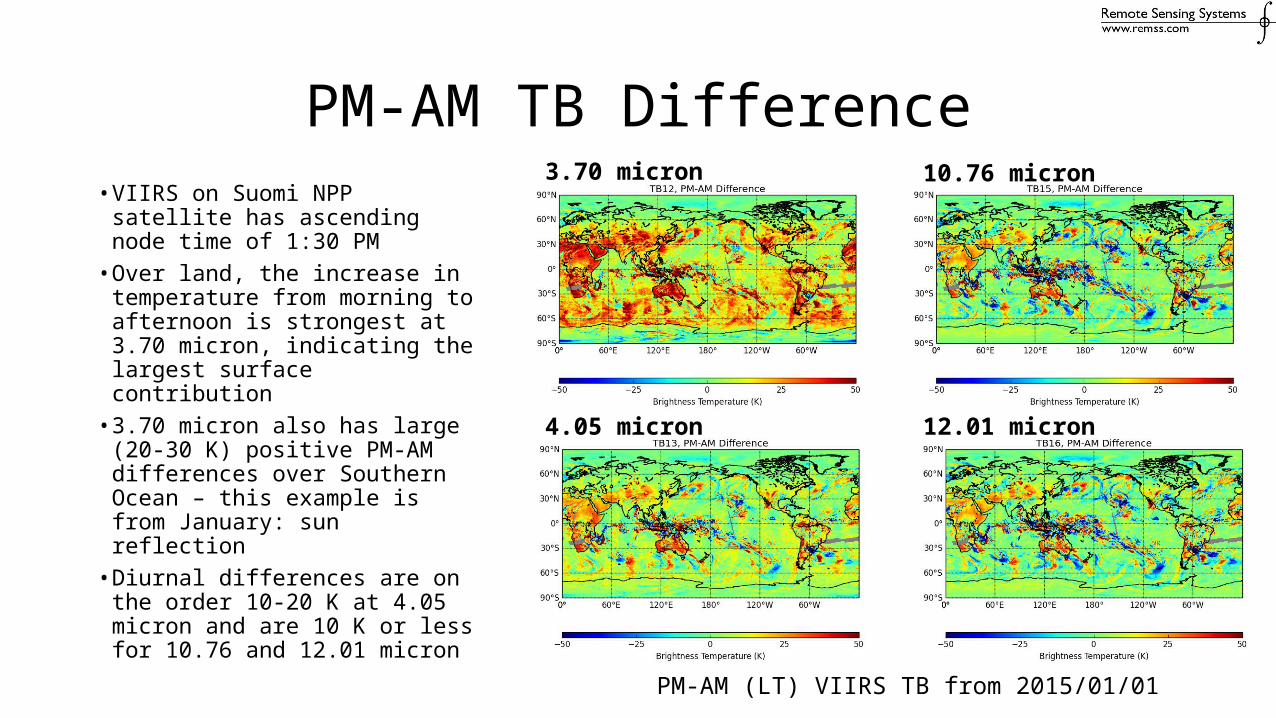
PM-AM TB Difference• VIIRS on Suomi NPP satellite has
ascending node time of 1:30 PM• Over land, the increase in
temperature from morning to afternoon is strongest at 3.70 micron, indicating the largest surface contribution
• 3.70 micron also has large (20-30 K) positive PM-AM differences over Southern Ocean – this example is from January: sun reflection
• Diurnal differences are on the order 10-20 K at 4.05 micron and are 10 K or less for 10.76 and 12.01 micron
3.70 micron
4.05 micron
10.76 micron
12.01 micron
PM-AM (LT) VIIRS TB from 2015/01/01
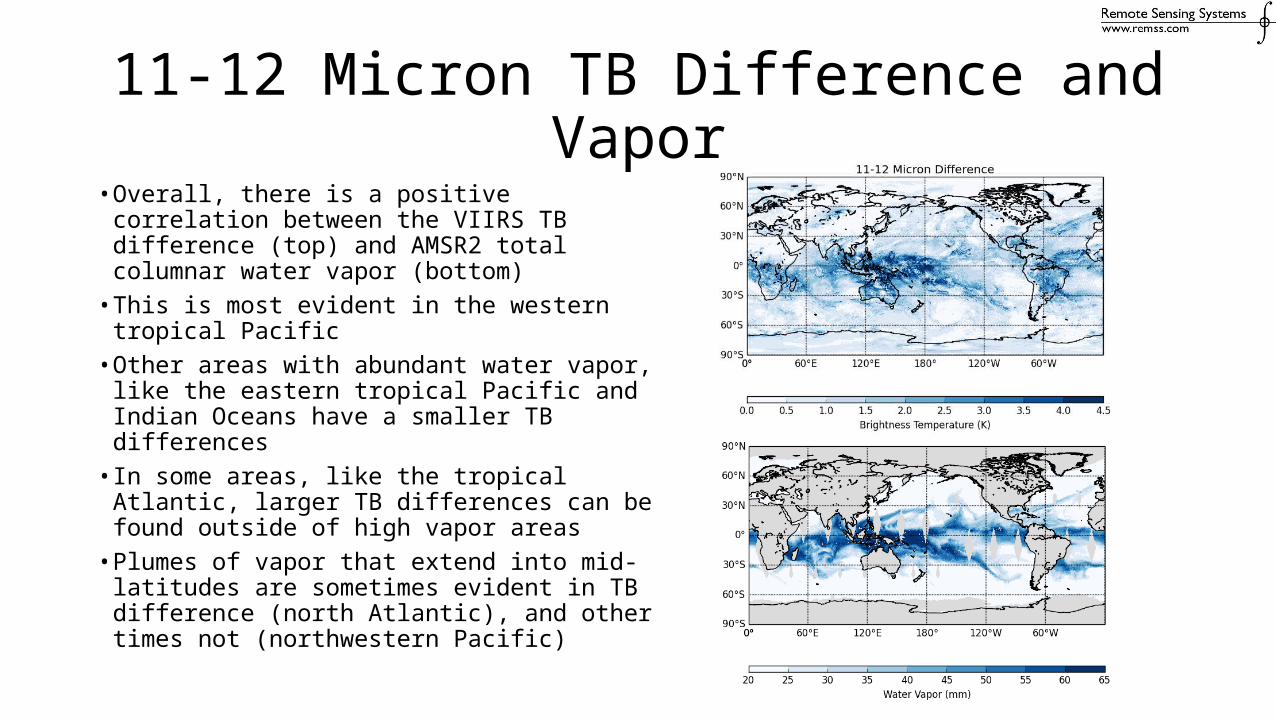
11-12 Micron TB Difference and Vapor
• Overall, there is a positive correlation between the VIIRS TB difference (top) and AMSR2 total columnar water vapor (bottom)
• This is most evident in the western tropical Pacific
• Other areas with abundant water vapor, like the eastern tropical Pacific and Indian Oceans have a smaller TB differences
• In some areas, like the tropical Atlantic, larger TB differences can be found outside of high vapor areas
• Plumes of vapor that extend into mid-latitudes are sometimes evident in TB difference (north Atlantic), and other times not (northwestern Pacific)
Summary and Conclusions
• Performed initial exploration of VIIRS data and comparison with AMSR2• There is a clear SST signal in VIIRS TBs• There is also a clear signal from clouds• Large TB-SST differences occur where water vapor is abundant• Large differences also can occur where vapor is low
• Suggests that effective air temperature also plays important role
• The relationship between 11-12 micron TB diff and vapor varies by region• First order of business: to produce gridded VIIRS TB with clouds cleared
• Q/C: sun glint, TB bounds check, scan angle threshold, number of obs threshold• Maps should also include time and Earth zenith angle