Embed Size (px)
Citation preview

Wayne State University
Wayne State University Dissertations
1-1-2012
Analysis and modeling of roofer and steel workerfall accidentsHulya CakanWayne State University,
Follow this and additional works at: http://digitalcommons.wayne.edu/oa_dissertations
Part of the Civil Engineering Commons
This Open Access Dissertation is brought to you for free and open access by DigitalCommons@WayneState. It has been accepted for inclusion inWayne State University Dissertations by an authorized administrator of DigitalCommons@WayneState.
Recommended CitationCakan, Hulya, "Analysis and modeling of roofer and steel worker fall accidents" (2012). Wayne State University Dissertations. Paper 498.

ANALYSIS AND MODELING OF ROOFER AND STEEL WORKER FALL ACCIDENTS
by
HULYA CAKAN
DISSERTATION
Submitted to the Graduate School
of Wayne State University,
Detroit, Michigan
in partial fulfillment of the requirements
for the degree of
DOCTOR OF PHILOSOPHY
2012
MAJOR: CIVIL ENGINEERING
Approved by:
____________________________________ Advisor Date
____________________________________
____________________________________
____________________________________

ii
ACKNOWLEDGEMENTS
I want first to thank my advisor Dr. Mumtaz Usmen for all the confidence he has
put on me, to undertake the challenges of doctoral research. During more than a
decade of studying under him, he has helped me to see scholarship and science in their
full depth, and taught me how to appreciate scientific work that helps the researcher’s
enterprise. He has enlightened me through his wide knowledge on construction safety
and professional ethics. His analytical approach amazed me and guided me through all
my challenges during this research project.
I thank Emrah Kazan for his friendship, encouragement and technical help during
my thesis preparations. I also thank Cem Poyraz for all his help during my dissertation
process.
I also thank my family for their continuous support during my PhD study.

iii
TABLE OF CONTENTS
Acknowledgements ...................................................................................................................... ii
List Of Tables ................................................................................................................................v
List Of Figures ............................................................................................................................ viii
CHAPTER 1 INTRODUCTION ...................................................................................................... 1
CHAPTER 2 STATE-OF-THE-ART LITERATURE REVIEW (SOA) .............................................. 8
2.1. Construction Accidents ............................................................................................. 9
2.2. Fall Safety ............................................................................................................... 18
CHAPTER 3 METHODOLOGY ................................................................................................... 39
3.1. Data Source And Data Acquisition .......................................................................... 39
3.1.1. Osha Data Taxonomy .......................................................................................... 40
3.1.2. Data Refinement .................................................................................................. 46
3.2. Statistical Analysis .................................................................................................. 50
3.2.1. Univariate Frequency Analysis ............................................................................ 50
3.2.2. Multivariate Analysis ............................................................................................ 51
3.2.2.1. Cross Tabulation, Chi Square Values And Phi Value ....................................... 51
3.2.2.1.1 Parameters ..................................................................................................... 53
3.2.3. Logistic Regression Modeling .............................................................................. 55
3.2.3.1. Model Construction ........................................................................................... 56
3.2.3.2. Model Validation ............................................................................................... 58
CHAPTER 4 RESULTS AND DISCUSSIONS ............................................................................ 60
4.1. Univariate Frequency Analysis Of Whole Data ....................................................... 60
4.2. Univariate Frequency Anaysis Of Roofers (Sic 1761) ............................................. 72
4.3. Univariate Frequency Anaysis Of Steel Workers (Sic 1791) ................................... 83
4.4. Summary Of Findings ............................................................................................. 93
4.4.1. Whole Data .......................................................................................................... 93
4.4.2. Roofers ................................................................................................................ 94
4.4.3. Steel Workers ...................................................................................................... 95

iv
4.5. Cross Tabulation Analysis Of Whole Data .............................................................. 97
4.5.1. Layered Cross Tabulation Of Selected Variables .............................................. 106
4.6. Cross Tabulation Of Roofer Accidents (Sic 1761) ................................................ 108
4.7. Cross Tabulation Analysis Of Steel Workers (Sic 1791) ....................................... 118
4.8. Summary Of Findings ........................................................................................... 127
4.8.1. Cross Tabulation For Whole Data ...................................................................... 127
4.8.2. Cross Tabulation For Roofers ............................................................................ 129
4.8.3. Cross Tabulation For Steel Workers .................................................................. 129
4.9. Logistic Regression Modeling Of The Whole Data ............................................... 129
4.10. Logistic Regression Modeling Of Roofers ........................................................... 132
4.11. Logistic Regression Modeling Of Steel Workers ................................................. 134
4.12. Summary Of Findings ......................................................................................... 136
4.12.1. Logistic Regression Modeling For Whole Data ................................................ 136
4.12.2. Logistic Regression Modeling For Roofers ...................................................... 137
4.12.3. Logistic Regression Modeling For Steel Workers ............................................ 137
CHAPTER 5 CONCLUSIONS AND RECOMMENDATIONS .................................................... 138
Appendix - A : Sample Accident Report ................................................................................. 142
Appendix - B : Osha’s Definitions For Accident Factors ...................................................... 145
References ............................................................................................................................... 146
Abstract .................................................................................................................................... 154
Autobiographical Statement ................................................................................................... 156

v
LIST OF TABLES
Table 1: The cause of fatal work-related death in the construction Industry (Janicak, 1998) .....25
Table 2 : Fatal work-related falls by construction trades (Janicak, 1998) ...................................26
Table 3: Original OSHA variables..............................................................................................40
Table 4: Initial research data taxonomy for combined SIC 1761 and 1791 ................................46
Table 5: Final research data taxonomy for combined SIC 1761 and 1791 .................................48
Table 6: Cross tabulation summary ...........................................................................................53
Table 7: Cross tabs with degree of injury vs. independent dichotomous variables ....................97
Table 8: Degree of injury vs. union status .................................................................................98
Table 9: Degree of injury vs. SIC code ......................................................................................98
Table 10: Degree of injury vs. task assignment .........................................................................99
Table 11: Degree of injury vs. project type .............................................................................. 100
Table 12: Degree of injury vs. fall safety protection system provided ...................................... 100
Table 13: Degree of injury vs. fall safety protection system used ............................................ 101
Table 14: Degree of injury vs. safety training provided ............................................................ 101
Table 15: Cross tabs with degree of injury vs. independent multi- valued variables ................ 102
Table 16: Degree of injury vs. age........................................................................................... 102
Table 17: Degree of injury vs. construction end use ................................................................ 103
Table 18: Degree of injury vs. project cost .............................................................................. 103
Table 19: Degree of injury vs. fall distance .............................................................................. 104
Table 20: Degree of injury vs. construction operation prompting fall ........................................ 104
Table 21: Degree of injury vs. fatality /injury cause ................................................................. 105
Table 22: Degree of injury vs. environmental factors ............................................................... 105
Table 23: Degree of injury vs. human factors .......................................................................... 106
Table 24: Degree of injury vs. union status vs. safety training provided .................................. 107
Table 25: Degree of injury vs. union status vs. SIC codes ....................................................... 108

vi
Table 26: Cross tabs with degree of injury vs. independent dichotomous variables for roofers .................................................................................................................... 109
Table 27: Degree of injury vs. union status for roofers ............................................................ 109
Table 28: Degree of injury vs. task for roofers ......................................................................... 110
Table 29: Degree of injury vs. project type for roofers ............................................................. 110
Table 30: Degree of injury vs. fall safety protection system provided for roofers ..................... 111
Table 31: Degree of injury vs. fall safety protection system used for roofers ........................... 111
Table 32: Degree of injury vs. fall safety training provided for roofer ....................................... 112
Table 33: Cross tabs with degreee of injury vs. multi – valued categorical variables for roofers .................................................................................................................... 112
Table 34: Degree of injury vs. age for roofers ......................................................................... 113
Table 35: Degree of injury vs. construction end use for roofers ............................................... 114
Table 36: Degree of injury vs. project cost for roofers ............................................................. 114
Table 37: Degree of injury vs. fall distance for roofers ............................................................. 115
Table 38: Degree of injury vs. construction operation prompting fall for roofers....................... 115
Table 39: Degree of injury vs. fatality / injury cause for roofers ............................................... 116
Table 40: Degree of injury vs. environmental factors for roofers .............................................. 117
Table 41: Degree of injury vs. human factors for roofers ......................................................... 118
Table 42: Cross Tabs with degree of injury vs. independent dichotomous variables for steel workers ................................................................................................................... 118
Table 43: Degree of injury vs. union status for steel workers ................................................... 119
Table 44: Degree of injury vs. task assignment for steel workers ............................................ 119
Table 45: Degree of injury vs. project type for steel workers ................................................... 120
Table 46: Degree of injury vs. fall safety protection system provided for steel workers ............ 120
Table 47: Degree of injury vs. fall safety protection system used for steel workers ................. 121
Table 48: Degree of injury vs. fall safety training provided ...................................................... 121
Table 49: Cross Tabs with degreeeof injury vs. independent multi – valued categorical variables for steel workers ...................................................................................... 122

vii
Table 50: Degree of injury vs. age for steel workers ................................................................ 122
Table 51: Degree of injury vs. construction end use for steel workers ..................................... 123
Table 52: Degree of injury vs. project cost for steel workers.................................................... 123
Table 53: Degree of injury vs. fall distance for steel workers ................................................... 124
Table 54: Degree of injury vs. construction operation prompting fall for steel workers ............. 124
Table 55: Degree of injury vs. fatality/ injury cause for steel workers ....................................... 125
Table 56: Degree of injury vs. environmental factors for steel workers .................................... 126
Table 57: Degree of injury vs. human factors for steel workers ............................................... 127
Table 58: Logistic regression modeling variables for whole data ............................................. 130
Table 59: Logistic regression results based on the whole data ............................................... 131
Table 60: Logistic regression modeling variables for roofers (SIC 1761) ................................. 133
Table 61: Logistic regression results based on the roofers data ............................................. 133
Table 62: Logistic regression modeling variables for steel workers ......................................... 135
Table 63: Logistic Regression results based on the steel workers data .................................. 135

viii
LIST OF FIGURES
Figure 1: BLS Fatality statistics - 2009 ....................................................................................... 2
Figure 2: BLS Fatality rates by trades – 2009 ............................................................................ 3
Figure 3: BLS Injury and Illness statistics by industry - 2009 ...................................................... 4
Figure 4: Causes of construction accidents investigated by OSHA 2010 (preliminary) ............... 5
Figure 5: Fatal events by victim’s situation ................................................................................11
Figure 6: Fatal events by work status ........................................................................................11
Figure 7: Impact and change graph during construction phases. Furst, Peter G., 2009, “Prevention through Design (Safety in Design)” ..........................................................15
Figure 8: Causes of work-related deaths, roofers, United States, yearly average,1992-98 (www.cpwr.com) .........................................................................................................21
Figure 9: Causes of deaths from falls, roofers, United States, yearly average, 1992-98 (www.cpwr.com) .........................................................................................................22
Figure 10: Logit function ............................................................................................................56
Figure 11: Degree of injury frequency analysis..........................................................................60
Figure 12: Union status frequency analysis ...............................................................................61
Figure 13: Age frequency analysis ............................................................................................61
Figure 14: SIC Code frequency analysis ...................................................................................62
Figure 15: Environmental factors frequency analysis ................................................................63
Figure 16: Human factors frequency analysis ...........................................................................64
Figure 17: Task frequency analysis ...........................................................................................65
Figure 18: Construction end use frequency analysis .................................................................65
Figure 19: Project type frequency analysis ................................................................................67
Figure 20: Project cost frequency analysis ................................................................................67
Figure 21: Fall distance frequency analysis ...............................................................................68
Figure 22: Construction operation prompting fall frequency analysis .........................................69
Figure 23: Fatality/ Injury cause frequency analysis ..................................................................69

ix
Figure 24: Frequency analysis for fall safety protection system provided ..................................71
Figure 25: Frequency analysis for fall safety protection system used ........................................71
Figure 26: Fall safety training provided frequency analysis .......................................................72
Figure 27: Degree of injury frequency analysis among roofers (SIC 1761) ................................72
Figure 28: Union status frequency analysis among roofers (SIC 1761) .....................................73
Figure 29: Age frequency analysis among roofers (SIC 1761) ..................................................73
Figure 30: Environmental factors frequency analysis among roofers (SIC 1761) .......................74
Figure 31: Human factors frequency analysis among roofers (SIC 1761) ..................................75
Figure 32: Task frequency analysis among roofers (SIC 1761) .................................................75
Figure 33: Construction end use frequency analysis among roofers (SIC 1761) .......................76
Figure 34: Project type frequency analysis among roofers (SIC 1761) .....................................77
Figure 35: Project cost frequency analysis among roofers (SIC 1761) ......................................78
Figure 36: Fall distance frequency analysis among roofers (SIC 1761) .....................................79
Figure 37: Construction operation prompting fall frequency analysis among roofers (SIC 1761) ................................................................................................................80
Figure 38: Fatality/ Injury cause frequency analysis among roofers (SIC 1761) ........................80
Figure 39: Frequency analysis among roofers (SIC 1761) for fall safety protection system provided ...................................................................................................................81
Figure 40: Frequency analysis among roofers (SIC 1761) for fall safety protection system used .........................................................................................................................81
Figure 41: Frequency analysis among roofers (SIC 1761) for fall safety training provided ........82
Figure 42: Degree of injury frequency analysis among steel workers (SIC 1791) ......................83
Figure 43: Union status frequency analysis among steel workers (SIC 1791) ...........................83
Figure 44: Age frequency analysis among steel workers (SIC 1791) .........................................84
Figure 45: Environmental factors frequency analysis among steel workers (SIC 1791) .............84
Figure 46: Human factors frequency analysis among steel workers (SIC 1791) ........................85
Figure 47: Task frequency analysis among steel workers (SIC 1791) .......................................86

x
Figure 48: Construction end use frequency analysis among steel workers (SIC 1791) ..............86
Figure 49: Project type frequency analysis among steel workers (SIC 1791) ............................87
Figure 50: Project cost frequency analysis among steel workers (SIC 1791) ............................87
Figure 51: Fall distance frequency analysis among steel workers (SIC 1791) ...........................88
Figure 52: Frequency analysis among steel workers (SIC 1791) for construction operation prompting fall ...........................................................................................................89
Figure 53: Frequency analysis among steel workers (SIC 1791) for Fatality / injury cause .......90
Figure 54: Frequency analysis among steel workers (SIC 1791) for fall safety protection system provided .......................................................................................................90
Figure 55: Frequency analysis among steel workers (SIC 1791) for fall safety protection system used .............................................................................................................92
Figure 56: Frequency analysis among steel workers (SIC 1791) for fall safety training provided ...................................................................................................................92

1
CHAPTER 1
INTRODUCTION
In the United States, there are 9.1 million construction workers in the construction
industry according to the National Institute for Occupational Safety and Health (NIOSH).
(http://www.cdc.gov/niosh/construction/). Construction work employs about six percent
of all U.S. workers. People who work on construction sites often find themselves facing
dangerous and sometimes life threatening conditions. Having multiple trades on a
construction site at the same time increases the risk of an accident which can lead to
injury or fatality. This research helps to identify the leading factors of the fall accidents
and shows the relationship between these factors by using statistical analysis while
developing models for predicting fatalities for roofers and steel workers. Safety
improvements to prevent fall accidents are the ultimate goal.
Concern over the frequency and extent of industrial accidents and the associated
health hazards in the U.S. led to the passage of the Occupational Safety and Health Act
of 1970, which established specific safety and health requirements for virtually all
industries, including construction. This act is administrated by The Occupational Safety
and Health Administration (OSHA) which was created in 1971. OSHA is a federal
agency that aims to ensure employee safety and health in the United States by working
with employers and employees. (www.osha.gov) The OSH Act created two other
agencies besides OSHA; the National Institute for Occupational (NIOSH) and the
Occupational Safety and Health Review Commission (OSHRC). These agencies have
different missions. NIOSH’s mission is to gather data documenting incidences of
occupational exposure, injury, illness and death in the United States

2
(http://www.cdc.gov/niosh) and OSHRC‘s mission is to ensure that OSHA’s
enforcement actions are carried out in accordance with the law, and that all parties are
treated in a consistent manner with due process when disputes arise with OSHA (http://
www.oshrc.gov). The responsibility for collecting statistics on occupational injuries and
illnesses was delegated to the Bureau of Labor Statistics (BLS) in 1972. (http: // www.
bls.gov)
Construction work includes many hazardous tasks in challenging conditions. In
fact, the construction industry has the largest number of fatalities reported for any of the
industry sectors in the United States. (http :// www. bls.gov)
In the US, there were 251,000 injury cases in the private construction industry
and 816 fatalities in 2009. These numbers represent the seriousness of safety and
health issue in construction. (See Figure 1)
Figure 1: BLS Fatality statistics-2009
According to preliminary BLS figures, the number of fatal work injuries in the
private industry construction sector declined by 10 percent in 2010. Economic

3
conditions may explain much of this decline with total hours worked having declined 6
percent in construction in 2010. Even with the lower fatal injury total, construction
accounted for more fatal work injuries than any other industry in 2010.
The BLS statistics presented in Figure 2 also show that roofers and structural
steel workers are in the highest risk occupations. As observed in this figure roofers were
exposed to fall accidents with a fatal injury rate of 34.7 (per 100,000full time equivalent
workers), followed by structural iron and steel workers with a rate of 30.3.
Figure 2: BLS Fatality rates by trades – 2009
The information published by Bureau of Labor Statistics (BLS) also indicates that
construction industry has a high nonfatal occupational injury and illness incidence rate;
which was 4.3 per 100,000 FTE workers per year in 2009, with the previously
mentioned 251,000 cases as shown in Figure 3.

4
Figure 3: BLS Injury and Illness statistics by industry - 2009
OSHA regulations dictate that all employers have a duty to protect the safety of
their employees on a construction work site. On a multi-employer work site, general
contractors also have a duty to implement and coordinate adequate safety precautions
with their subcontractors.
Fall accidents are one of the leading causes of workplace injuries in America.
Given the complexity of today’s construction projects, it may be somewhat surprising
that disabling or fatal accidents do not occur more frequently. Victims of these accidents
often suffer injuries that prevent them from returning to work. Falls from height is a
leading cause of death and injuries in the construction industry. If proper precautions
are taken, and the root causes of these accidents are understood, then fall accidents
can be prevented.

5
35
10 8
4
43
0
43
Leading cause of worker deaths on construction sites (2010) Total751 deaths
(preliminary)
Falls
Electrocution
Struck by Object
Caugth in Between
Others
Falls are the leading cause of death among construction workers. They account
for one-third of all construction injuries and fatalities and cause more than 68,000
serious injuries each year, according to earlier study by Rekus, 1999.
An annual report for construction site accidents is published by OSHA every
year. According to this published report, “falls” are the highest occurring accidents with
277 cases in 2009. (OSHA 2010)
Causes of construction accidents are classified by OSHA as struck by,
electrocution, caught in or between, falls and others. As it is shown in the pie chart
below Figure 4, falls are the highest occurring injury cases among the others.
As it is seen from the pie chart above; falls are the highest occurring cause (35%)
among the leading causes of construction worker fatalities. This clearly explains the
need of research on why this happening in spite of all OSHA regulations.
Fall from elevation is the leading cause of fatality and injury in construction and
roofers and steel workers are the two most critical trades. Fall accidents are divided into
*Others: Cardiovascular/ respiratory system failure, Struck against, inhalation, Rubbed/abraded, Absorption, Bite/sting/scratch, Repeated motion /Pressure, ingestion, others
Figure 4 : Causes of construction accidents investigated by OSHA 2010 (preliminary)

6
11 categories according to a classification manual that was published in 2003 by The
US Department of Labor. These categories are as follows:
• Falls from stairs or steps
• Falls through existing floor openings
• Falls from ladders
• Falls through roof surfaces (including existing roof openings and skylights)
• Falls from roof edges
• Falls from scaffolds or staging
• Falls from building girders or other structural steel
• Falls while jumping to a lower level
• Falls through existing roof openings
• Falls from floors, docks, or ground level
• Other non-classified falls to lower levels
Personnel who work on heights during the construction phase are exposed to fall
accidents and injuries. Unless preventive measures are effectively applied there can be
serious safety problems. If fall protection safety practices are not observed at the work
site, workers risk being exposed to fall hazards.
The primary objectives of this study are the following:
• To identify the factors that are potentially affecting the severity of
construction fall accidents (Severity is defined as whether a construction
fall results in a fatality)
• To establish the frequency distribution of the identified factors that are
likely to contribute to construction fall accidents.
• To determine the relationships between the factors contributing to
construction fall accidents.

7
• To distinguish between falls involving roofers and steel workers
• To develop models that can assist with predicting severity of falls from the
contributing factors
• To establish the feasibility of using multivariate statistical analysis to
model construction fall accidents using categorical variables.
Our research approach incorporated three phases. The first phase was the
literature survey, which involved reviewing the information and knowledge on fall
accidents in the construction industry. The second phase was data acquisition and
organization. In this phase, OSHA accident records were used covering roofers (SIC
1761) and steel workers (SIC 1791) on construction sites. The data was coded and
organized to construct categorical variables to be incorporated in statistical analysis.
The third and last phase was to perform univariate frequency analysis, cross tabulation
and logistic regression modeling. Following the literature review, the methodologies
employed and the results obtained are presented in the remainder of this dissertation.

8
CHAPTER 2
STATE-OF-THE-ART LITERATURE REVIEW (SOA)
Construction is one of the most dangerous occupations in the American economy
due to its variable, complex tasks and activities. Having more than one activity and
multiple trades on a construction site at the same time increases the risk of an accident
which can lead to injury or fatality. There have been many efforts by government
agencies, labor organizations, and researchers in the field of health and safety for
improvement and prevention; but, injuries and fatalities continue to affect the
construction industry.
A review of the existing literature shows that various investigators have
conducted analyses and published a number of research reports which examine
frequency distribution of accidents, fatalities and injuries for a wide range of construction
tasks and trades. Some studies have focused on multivariate analysis establishing the
relationship between variables. They all come to conclusions on how to prevent fall
accidents and/or lower their occurrence.
Scientific research has been done on workers’ health and safety since 1930’s. W.
Heinrich (1931 &1941) pioneered these research efforts. According to Heinrich, an
"accident" is one factor in a sequence that may lead to an injury. (Cleveland State
University Work Zone Safety and Efficiency Transportation Center, 2003). There are
many other theories of accident causation such as human factors theory,
accident/incident theory, epidemiological theory, systems theory, the energy release
theory. These accident theories guide safety investigations and have been used in
many research projects that analyze worker accidents.

9
Roofers and steel workers (SIC codes 1761 and 1791) are the highest risk
occupations among the construction trades. As stated in “fall protection in construction”
e-book (2011) by OSHA, falls are the leading cause of worker fatalities. Each year 100
to 150 workers are killed and more than 100,000 are injured as a result of falls at the
construction sites even though OSHA has rules for fall protection. OSHA rules are
established at ramps, runways, and other walkways, excavations, hoist areas, holes,
formwork, and reinforcing steel, leading edge work, unprotected sides and edges,
overhand brick laying, and related work, roofing work, precast concrete erection, wall
openings, residential construction, and other walking/working surfaces. According to the
OSHA rules, employers have the responsibility to protect the employees from fall
hazards and falling objects whenever a subjected employee is 6 feet or more above a
lower level.
2.1. CONSTRUCTION ACCIDENTS
Occupational injuries and fatalities among construction workers have been a
great concern to the construction industry. Researchers have analyzed existing reports
to categorize the most common types of accidents. Not only the type of accidents but
the specific trade types and how accidents happen have also been studied by
researchers. (T.J. Parsons et al., 1986)
Abdelhamid and Everett (2000) identified three root causes in their published
study of construction accidents. These causes were: (1) failing to identify unsafe
conditions that existed before the start of the activity, (2) deciding to proceed even
realizing the unsafe condition; and (3) deciding to act unsafe regardless of the
conditions. They also identified four unsafe conditions and their reasons, which were:

10
(1) management actions/inactions; (2) unsafe acts of worker or coworker; (3) non-
human-related event(s); and (4) an unsafe condition that is a natural part of the initial
construction site conditions. By creating an accident root causes tracing model (which
is a cause and effect diagram) they presented the accident investigators a tool to
determining the root causes of the accidents. The model provides a tool for
determining the areas that require more inquiry as a means to find facts about the
causes of particular accidents.
A study was conducted by the Construction Industry Research and Policy Center
at the University of Tennessee, Knoxville for OSHA’s Office of Statistics (2011). In order
to inspect fatal events in construction during the 2003 this group implemented univariate
frequency analysis on 707 accidents that occurred that year using OSHA accident
reports. Fall from/through roof led all other causes in number of fatal events (76 or 10.7
% of total fatal events), followed by fall from/with structure (74 or 10.5 %). The third
leading cause was crushing/run-over of non-operators by operating construction
equipment (7.9 %); followed by electrocution by equipment contacting wire (6.6 %);
electric shock from equipment installation/tool use (6.1 %); and trench collapse (5.8 %).
They also prepared a comparison of the year-to-year ranks of the proximal
causes during the years of 1991-2003 and calculated by using a Spearman rank
correlation procedure. This statistical test showed that individual ranks of the causes
vary very little from year-to-year. The author also analyzed and classified the fatal
events by victim’s situation (Figure 5) and fatal events by work status of the victim.
(Figure 6)
11
Figure 5: Fatal events by victim’s situation1
Figure 6: Fatal events by work status2
As can be seen from the pie charts above, task (main work) site was the most
frequently occurring place for fatal accident and the victim, himself, was the primary
initiator of the fatal accident. This study may shed some light to the effects of human
factors and environmental factors on fatalities.
1 , 2 Author of this dissertation using data from the original records.
61.2 21.6
15.6
1.6 Victim was theprimary initiator ofthe cause
Fellow worker wasthe primaryinitiator of thecause
Victim was in thewrong place at thewrong time
72.3
22.8
5
Victim was at thetask site
Victim wasentering/leaving oraway from their tasksite

12
Sawacha, et. al. (1999) prepared questionnaires after conducting exploratory
interviews of several safety related personnel in the construction industry. The
questions were related to research variables, covering historical, economical,
psychological, technical, procedural, organizational and environmental factors. Safety
performance was considered to be dependent variable. Among the variables that were
found to be significant were the operatives’ age, job experience, danger money,
productivity bonus payment, safety bonus payment, personal care for safety, impact of
Health and Safety act, ongoing safety training on site, supervisor's safety behavior,
asbestos awareness, use of ladders, scaffolding fixing and inspection, steel erection,
training on use of safety equipment, issuing of safety booklet, worker-management
relationship, control on sub-contract's safety behavior, site safety representative,
management-worker co-operation on safety, Safety committee policy, talk by
management on safety, safety poster display, planned and organized site (layout) and
tidy site.
The authors used Pearson's correlation coefficient (for linear) and factor analysis
(for non – linear groupings) to measure the strength of the relationship between the
research variables and safety performance. According to their findings there was a
strong relationship between the worker age and experience and their level of safety
performance. The worker age group between 16-20 was more prone to accidents and
after age of 28 accidents were tend to decline. They claimed that experience had a
lowering effect on accidents meaning experienced workers were more aware on safety
requirements. The high correlation between safety performance and hazard payment
and productivity bonus payments suggest that the workers who were paid hazard

13
money or productivity bonus subject to higher risk of accidents because they tended to
act unsafe in order to achieve higher production. They also found a strong correlation
between safety performance and psychological variables. The authors indicate that
workers who showed concern for personal safety had a better safety record compared
to those who did not. The author’s statistical work did not show any relation between
workmates safety behavior and safety performance. For the technical factors and safety
performance there was a significant relationship found between hazard awareness and
safety performance but not handling. When the procedural factors were investigated, it
was seen that providing safety kits alone did not have a diminishing effect on accident
occurrence but providing safety training on how to use these kits had a lessening effect
on accident occurrence. Organizational factors were found to be all linked to safety
performance. Managements’ viability and involvement had positive effect on successful
safety performance. They found a strong relationship between environmental factors
and safety performances which might translate to good housekeeping practices and
well planned out sites provide higher safety performance.
Marion Gillen, et. al. (2002), in their study titled, “injured construction workers'
perceptions of workplace safety climate, psychological job demands, decision latitude,
and coworker support, and the relationship of these variables”, used several
questionnaires involving these variables. Based on the survey, the authors found
significant positive correlation between injury severity and the safety climate scores, and
between the safety climate scores and union status. They stated that there were
statistically significant differences between union and nonunion workers' responses
regarding perceived safety climate. Union workers were more satisfied with safety

14
climate than non-union workers due to their safety awareness. The authors
recommended that dangerous work conditions and practices should be explained to
workers more often. The workers who practice safety should be praised for setting
examples on construction sites. This is one of the few studies that use multivariate
analysis on the construction safety and findings can be used to evaluate the safety
training methods and practices.
Many architects who have worked in the construction industry believe that the
design process should consider construction safety. Fall protection should ideally begin
at the designing stage and it should be the duty of the designers to work on the design
with the aim of providing safety for the workers in the work site. If the designers
incorporate certain requirements in to the design to initiate the safety from the beginning
of the project that would greatly benefit the workers’ safety (J. A. Gambatese, et. al.
(2005), M. Weinstein, et. al. (2005), M. Behm (2005)).
Gambatese and Hinze (1999) addressed this issue in their research entitled
“Designers can positively influence construction site safety by integrating safety
considerations into the design process”. They stated that designer involvement in
construction safety in the U.S. is a voluntary effort. Only in design – build firms, designer
and construction professionals work together and understand the importance of
incorporating construction safety in design. This research work aimed at developing
design suggestions. The authors recorded all the suggestions applicable to safety
design for construction projects. They used safety manuals, checklists, interviews and
various literatures to develop the mentioned suggestions. They observed from OSHA
accident reports of 1985 through 1989 that the majority of fatalities are from falls from

15
elevations and comparably the recorded suggestions were the highest in that area.
Some of the suggestions were: designing parapets 42 inch instead of 30 inch to satisfy
the OSHA guardrail requirements; and designing and scheduling permanent staircases
at the beginning of the construction to eliminate temporary stairs and scaffolding
hazards.
P.G. Furst (2009) is another author who has addressed the importance of
incorporating safety measures in design. The author pointed out in Figure 7 how safety
can be influenced and incorporated in projects in different phases of a construction
process. Furst showed that the opportunity to prevent construction accidents was the
highest during the planning phase, and adopting preventive measures would be harder
to apply to the projects once they reached the construction phase. He suggested that
there were new technological advancements in computer science technology, such as
Building Information Modeling (BIM), which could be adopted so construction hazards
could have been seen beforehand and preventive measures could have been taken
before accidents occur.
Figure 7: Impact and change graph during construction phases. Furst, Peter G., 2009,
“Prevention through Design (Safety in Design)”
Similarly, many other authors (J. A. Gambatese, et. al. (2005), M. Weinstein, et.
al. (2005), M. Behm (2005) conducted research on safety design which suggests the

16
incorporation of the needed safety preparation times to be added to project scheduling.
The only obstacle to incorporate the safety design concept to the design phase of a
project is educating the designers and the owners of the projects in terms of safety
design requirements and the extra time and expense required.
From a different perspective, Gillen et al (2004) carried out a qualitative
investigation by interviewing 22 construction managers. As a result of this interview they
came to the conclusion that “developing and expanding management skills of
construction managers may assist them in dealing with the complexity of the
construction work environment, as well as providing them with the tools necessary to
decrease work-related injuries.” This is useful research on the acknowledgement of
construction manager’s role on construction safety.
G. A. Howell, et. al. (2002) stated in a paper in the proceedings at the 10th
Annual Conference of the International Group of Lean Construction that, over the years,
construction safety had significantly improved but more improvement might come from
either applying best practices in the construction industry or from “breakthroughs” that
exceed the best practices. They claimed that “adopting a new definition of hazard and
applying better planning can enlarge the safety zone” and create fail-free tasks. Their
recommendation of worker training, worker motivation, pre-task hazard analysis and
post-accident analysis can serve as keys to preventing accidents.
X. Huang’s (2003) doctoral dissertation focused on the owner’s role in
construction safety. In this study, the author surveyed the relationship between project
safety performance and the owner's influence. The author sent survey questionnaires to
the owners of the big construction firms with at least 100,000 worker hours per year,

17
and used the survey results for statistical analysis. The author chose the OSHA
recordable injury rate as the dependent variable and different safety management
techniques as the independent variables in the analysis. In the first phase of the
analysis, descriptive statistics were used to obtain the frequency of several safety
practices. In the second phase, the association between the variables were tested, and
in the third phase a model to explain the cause and effect relationship between project
safety performance and several ways to owners’ involvement to safety in construction
safety management was developed. The author also created a scorecard to evaluate
owner involvement in safety. Based on linear regression modeling there was a strong
cause and effect relationship between the owner’s involvement, together with the
project characteristics and the contractual safety requirements, and the project safety
performance. The author also created a project scorecard to evaluate the safety
performance of a project. The owners could use the scorecard to evaluate the safety
performance of the project. Also there are a number of studies (R. S. Harper and E.
Koehn (1998), O. Abudayyeh, et al, (2006)) done on managements’ involvement in
construction safety. These studies clearly show the importance of manager/owner
involvement.
Baradan and Usmen (2005) used Bureau of Labor Statistics (BLS) data to study
and rank the risk factors and levels of building trades. The authors defined risk as the
product of the probability and severity and adopted the “risk plane concept” to evaluate
and rank the trades in terms of non-fatal injury rates. For the fatality rate based ranking
they used the” index of relative risk”, and combining two separate analyses, they
defined a combined risk score. Authors state that risk analysis based on both severity

18
and probability taken together is more comprehensive than performing separate
analysis. The authors also stated the fact that the highest number of fatalities among all
industries happens in construction. The information developed from the methodology in
this paper is very valuable for risk managers and project managers among many others.
In their risk-analysis the authors developed a two-step approach. First they have
analyzed the fatal and non-fatal injuries separately. Second they have combined risk
analysis of the two into an integrated risk analysis. Their results showed that the iron
workers have the highest non-fatal injury rate followed by roofers. The construction
workers have the highest median days away from work and cost of lost time among all
trades. Roofers and ironworkers are the top two trades in fatality rates. As a summary,
roofers and ironworkers ranked the highest in both non-fatal and fatal injuries and posed
the highest overall risks.
2.2. FALL SAFETY
Many studies have been conducted on falls and their prevention since the
1980’s. These studies have covered topics ranging from causes of the falls, falls from
the roofs, falls from the scaffolds and studies of the falls by type and scale of the
projects. The literature includes several occupational safety articles specific to falls in
construction.
A research study by X. Huang and J. Hinze, (2003) focused on the data OSHA
accumulated on construction worker accidents involving falls between January 1990
and October 2001. The authors’ aim in this study was to identify the root causes of fall
accidents and any information that might be helpful in reducing construction falls in the
future. Although the authors used a simple approach to analyze their data, the findings

19
of this research were quite comprehensive. However, there was a missed assumption
where the authors assumed all victims had experience in construction. From the data
they provided in their paper, this could not be proved. Despite this point, the authors’
conclusion on fall height occurrence would help the construction industry to focus more
on fall protection in certain heights during small commercial and residential construction.
The study was conducted to determine the causes of construction fall accidents
identify any particular patterns related to them and determine the impact of OSHA
regulation changes on fall prevention. Data used in this study was gathered from OSHA
investigations between the years 1990 through 2001. A total of 7543 cases were
identified; however, only 2955 cases were used in the study.
The paper analyzed the data according to different descriptors such as; the time
of fall occurrence, projects involving falls, fall height, and injuries resulting from fall
accidents. The authors also determined the immediate causes of fall accidents, which
were: work operations resulting in falls, the location of falls, and human errors resulting
in falls.
The authors concluded that falls were the most common accidents in the
construction industry, and they were the main cause of fatalities and serious injuries.
The authors warned safety personnel to pay extra attention to safety precautions for
heights over 30 feet. The authors also found that carpenters, roofers, and structural
metal workers should receive close attention and be trained accordingly.
The authors used data which was sent in Microsoft Access format which could be
easily converted to files that could be manipulated by a statistical package for the
analysis. The authors not only used a simple approach to analyze the data , such as bar

20
charts, pie charts, tables, plot charts, but they also clearly showed the most frequently
occurring fall accident heights in construction, while tying it to construction costs.
According to the authors, workers between the ages of 31 through 40 are the
most susceptible group to fall fatalities and suggest that work experience does not
contribute to cautious behavior in construction fall accidents.
The authors stated that among the 2741 fall accidents, 1018 cases indicated the
height of the projects and the number of stories. They pointed out that in 801(81 %) of
the projects fall accidents occurred with either one, two or three stories, and the
average building height was 37.4 ft. They concluded that more than 70 percent of the
fall accidents had occurred at heights less than 30 feet.
The authors proposed that the construction industry should pay more attention to
with small commercial and residential constructions. They also implied that even though
OSHA regulations strictly state all fall preventions should be implemented at all
elevations above 6 ft., fall prevention techniques may be too relaxed at lower elevations
in some projects, which is a very important point.
The authors used the OSHA database to see if there is an obvious pattern
among the fall accident reports that may be used to caution the construction industry.
Their statistical work identified numerous points that may enlighten the construction
industry on prevention of fall accidents. It was emphasized that 30 feet and lower
heights were the most susceptible to fall accidents; therefore, construction industry
should pay more attention to the lower heights.

21
While this paper delivered useful information, the author’s assumption that all the
workers in this age group must have had some experience without the support of any
records can be questioned. The authors do not describe the methods of how they
identified this age group of workers as experienced workers. The only weak point in this
research was lack of data on how they have drawn the conclusion on 31-40 years old
age group are the experienced construction workers. The authors should have had the
data on workers job experience in order to come to conclusion on experience had no
positive effect on fall prevention. Also, it may be a good idea to repeat this research in
5 year intervals and see the effects of their recommendations on construction industry
while identifying new patterns of fall accidents, if any.
When we review the literature in terms of trade types there were several studies
done on roofers. According to a study by the Center for Construction Research and
Training (www.cpwr.com), (2000), on the causes of roofers deaths, it was found that
roofers had the fifth highest work related death rate in construction. They analyzed a
total of 359 deaths for a seven year period. As seen in Figure 8, falls are
overwhelmingly the main cause of the deaths among roofers.
Figure 8: Causes of work-related deaths, roofers, United States, yearly average,1992-98 (www.cpwr.com)

22
The causal factors for roofer fall fatalities are shown below in Figure 9 indicating
that falling from the roof edges were the most frequently occurring incidents followed by
falls from ladders.
A total of 262 fall deaths were analyzed in a seven year period elapsed between
1992 and 1998. The document states that in residential construction, falls from roof
edges accounted for 70% of work-related-fall deaths and 90% of roof fall deaths for
roofers.
Figure 9: Causes of deaths from falls, roofers, United States, yearly average, 1992-98 (www.cpwr.com)
The study claims that the lack of adequate roof-edge fall protection was the
reason even when this was the clear requirement of OSHA. It also suggests that
guardrails, safety nets, or personal fall-arrest systems could have prevented most of
these deaths. This paper also claims that OSHA’s permission to use warning lines and
safety monitors were not serving as effective preventive measures. Several
recommendations were made to contractors and roofers to prevent fall accidents. These
recommendations are roofer safety training, usage of traditional means such as
guardrails and personal fall arrest system, solid covers on roof openings, guardrails
around skylight openings; de-energize the overhead power lines before the work. This

23
paper used a simple frequency analysis technique. The recommendations presented
are general commonsense recommendations and regulatory requirements which should
have been enforced on a continuing basis.
In another study, K. L. Hunting et. al. (2004) focused on occupational injuries
among construction workers to identify injury patterns for further examination and
developing aversion programs. They created a log entering all the injuries that were
treated in the Washington Hospital between 1991 and 1997. They identified 2,916
injured workers. The analysis showed that falls were the second injury causing factor
among all possibilities. When compared to other trades, steel workers were more
susceptible to falls, and 21% of the 133 steel workers had experienced falls compared
to 17% of the 2783 injured workers belonging to other trades.
Slips and trips were the major cause of falls. The authors’ recommendation for
slips and trips was more-efficient material staging practices. This study represents a
good observation on causes of falls for steel workers. Some important variables such as
human factors and victims’ training / retraining on fall safety precautions were missing
from the study to develop adequate recommendations. However, the study opens the
door to further investigations. This study, as well as the previous one, show that falls are
the main culprit for accidents involving roofers and steel workers.
Chia et al, (2005) reviewed 621 case reports that covered occupational fatal falls
occurring during the years of 1994 through 1997 in Taiwan. Their aim was to create
accident scenarios to propose prevention measures. They extracted various factors
from the case reports that might have had an effect on the accident, such as: type of the
industry, age, gender, experience level of the victim, source of the injury, the company

24
size (number of the workers employed), and accident type. Their frequency analyses
showed that majority of the victims were male and aged between 25 and 44; worked for
companies with fewer than 30 employees; and had less than one year of work
experience. They used multivariate analysis (Chi square test) to establish the
relationships between factors. There were significant relationships between gender and
cause of fall that showed that females were more likely to fall from heights. The authors
attributed this to the lack of communication between the female and male workers. This
reasoning does not seem very convincing but the social and physiological conditions of
Taiwanese female workers may affect this conclusion. They also looked at the relation
between the cause of fall and accident event. They determined the causes of falls as;
unguarded openings, poor work practices, inappropriate protection, improper use of
personal protective equipment (PPE), distraction, unauthorized access to hazardous
area, unsafe ladders and scaffoldings, and removal of protection measures. The
authors report the lack of accompanying scaffolding and bodily action as the main
causes’ of falls from scaffolds and staging and they recommend usage of guardrails.
The study also revealed that inexperienced workers and workers who work for small
companies are exposed to greater risks of fall accidents.
T. K. Fredericks, et. al. (2005) similarly reported from their research that roofers
who work on small companies (less than 11 employees) were in higher risk of falling
from the roof than big companies. Even though this study had used a significant
analytical approach to study the relationships between the cause of fall and other
factors, the recommendations came out to be well known, common sense approaches,
such as: safe work practices associated with roofing tasks.

25
M. G. Helander (1991) researched 739 fatal construction accidents in England.
He categorized the accidents and found out that the most frequently occurring accidents
were the falls.
C. A. Janicak (1998) also studied fall related fatal accidents, and his results were
in agreement with those of the previously mentioned study by Huang and Hinze (2003).
The author used fatality inspection reports of OSHA for the years 1992 through 1995
and categorized the 566 cases by the cause of fall. He used three different types of
statistical analysis; first was ANOVA to identify the significant differences in the mean
distances of falls based upon the cause; the second was PMP (proportionate mortality
ratios) for fall cause within the construction industry and the third was Mantel –
Haenszel Chi square of significance test to determine if the observed deaths were
significantly different from the expected. Table 1 below, created by Janicak, “The cause
of fatal work-related death in the construction industry”, shows that the lack of protection
in place was the most frequently identified cause appearing in 35.3% of all deaths from
falls.
Table 1: The cause of fatal work-related death in the construction Industry (Janicak 1998)
Cause Frequency Percentage No Fall Protection 200 35.3 Structure/equipment collapse 128 22.8 Slip-fall off ladder 57 10.1 Fall protection not attached 36 6.4 Improper work surface 33 5.8 Damaged fall protection 20 3.5 Erecting/dismantling scaffold 18 3.2 Other 17 3 Unknown 57 10.1 Total 566 100

26
The author also reported that fall accidents occurred mostly from work heights of
12 feet or less. He identified two different types of falls, falls from ladders and falls on
the same level due to slips and trips.
According to Janicak’s data presented in the Table 2, roofing workers are those
who are most frequently involved in fatal accidents. The author also emphasized
prevention techniques. He mentioned that commonly 45% of the accidents occurred
when there was a fall protection system in place, but the victim of the accident was not
using it. The author called attention to this issue and suggested that companies should
enforce the usage of fall protection systems when workers need to work on heights. He
also indicated the importance of good housekeeping to prevent falls on the same level.
As a final suggestion Janicak recommended that companies should give
adequate training to the workers on how to properly install, use, test, and inspect fall
protection systems.
Table 2 : Fatal work-related falls by construction trades (Janicak, 1998) Industry Frequency Percentage
Residential 26 4.8 Non-residential building 68 12 Highway and streets 9 1.6 Heavy Construction 44 7.8 Plumbing and heating 23 4.1 Painting 35 6.2 Electrical Work 40 7.1 Masonry 46 8.1 Carpentry 32 5.7 Roofing 109 19.3 Concrete 13 2.3 Miscellaneous trades 121 21.4 Total 566 100

27
Cattledge, et. al. (1996) analyzed the death certificates of all fatal falls in the
construction industry between 1980 and 1989. They reported that 49.6% of deaths were
from falls, and most of them were white young males, a finding which was also
underlined by Xinyu Huang and Jimmie Hinze’s (2003) research. Construction industry’s
domination by male workers can be the explanation of this finding.
F. C. Hadipriono (1992) focused on the engineering aspects of construction falls
from elevated openings (wall & floor, floor working platforms, roofs and scaffolds) in his
research. He used “Fault Tree Expert System Model” (a graphic model that shows
parallel and sequential causes of events that contribute to a predetermined top
undesired event) to investigate and prevent unintentional falls on a construction site. He
benefited from literature reviews to establish the causes of construction accidents and
their relationship, and represented them in a fault tree system. He divided the fall
causes into three distinctive areas: 1. the enabling causes (internal problems suffered or
experienced by the worker). 2. the triggering causes (active external events, causing the
worker to fall). 3. the support-related causes of the fall (passive, external events,
indicating the failure of components supporting the worker). In addition to graphical
representation of the fault tree models, the author also prepared qualitative analysis on
possible causes and combination of causes that resulted in falls. This study produced a
beneficial tool for experts to diagnose construction falls using after the fact data.
Suruda, et. al. (1995), in their paper named “Fatal Work-Related Falls from
Roofs”; provided general information on falls from roofs that can be useful in planning
preventive measures. The authors’ stated their purpose as examining the extent of falls
from the roofs.

28
In their data collection the authors used the death certificates of workers who
died. The National Institute for Occupational Safety and Health (NIOSH), National
Traumatic Occupational Fatalities (NTOF) database was used to obtain the death
certificates. This database includes all U.S deaths in 1980 and after. In these
certificates the ones where “injury at work” box was checked “yes” and “external cause
of death” was an “injury” according to the International Classification of the Diseases,
Ninth Revision (ICD-9, 1975). The authors chose the victims whose ages were16 and
older and certificates with the ICD-9 codes E800-E999 were searched for the years
1984 to 1986. Among these ICD codes E880-E886 or E-888 were the causes labeled
as deaths from falls. Also, they used a computer search of the certificates for the words;
“roof”, ”skylight”, “parapet”, “deck”, “rooftop”, “cover”, “dome”, “plastic”, “insulation”.
These records were then reviewed manually to determine if the fatal fall was from the
roof. The authors excluded the records from California, Michigan and Washington states
due to format incompatibility.
Suruda, et. al. (1995), matched all the NTOF records to the OSHA fatality
investigations of falls mentioning roofs. In this process they matched the records by
location, date of death, worker’s age and the site of fall. Bureau of the Census’ County
Business patterns (CBP) was used as the denominator for calculating rates based on
the Standard Industrial Classification (SIC).
Falls from roofs were categorized according to location. First they were
categorized as the perimeter fall or falls through the roof. Second they were categorized
further into “falls through skylights”, falls through roof openings”, and falls through fragile

29
materials”. Only the falls through the skylight in place (glass, fiberglass, plastic) were
counted as falls through the skylight.
In their results, Suruda, et. al., reported 1695 work related falls in three years of
which 288 (17%) were from roofs, and only one of them was female. The victims’
average age was 38.7 years. Out of 288 deaths; 232 were construction workers.
According to the SIC codes, SIC 17, special trade contractors; and 172 within 17,
roofing and structural steel erection had the highest fatality rates.
When the death certificates were matched out of the 288 fatal cases only 138
had complete OSHA report, and only 112 of them contained issued citations.
Location of the fall was reported according to the category described, and was
available only in 163 cases. 70 of the fatal falls were from roof perimeter; edge or
parapet and 93 of them were through the roof structure; and in 125 fall accidents there
were no details available.
Out of the 288, fall height information was available in 148 cases. One third of
the reported height cases were from 30 feet or less (3 stories or less) need adequate
fall protection.
The authors affirmed the OSHA regulations, including: 1. Railing, guarding the
skylights; 2. PPE wearing, making it the responsibility of the employer, 3.Using passive
protections such as safety nets, fixed covers, catch platforms. 4. Using motion-stopping
systems for the unprotected sides or edges of the roofs, 5. Training all roofers about the
fall hazards. They also recommended full protection on pitched roofs such as anchor or
tie point, safety belts and lanyards.

30
This paper did not look at the role of the environmental factors such as wind, rain
or slippery surfaces underfoot. They did not determine the work experience from OSHA
reports; the length of the worker’s stay on the roof is unknown. Supervisors’ attitude
towards safe work practices and workers’ beliefs that safe work habits decrease
productivity may be contributing factors, but these could not be determined.
In summary, this paper used two data sets (death certificates and OSHA reports)
combined to have a general descriptive analysis of fatal falls from the roofs. This study
did not have any details on the availability of PPE, usage, personal experience, and
environmental factors.
P. Kines (2001), focused on the Danish construction industry‘s male, fatal and
serious injury causing fall from elevation accidents between the years 1993 and 1999.
He tried to determine if the risk factors for fatal and nonfatal but serious injuries were
the same. He used descriptive statistics on 20 selected cases that occurred on slanted
roofs. According to Kines’s findings, risk factors for fatal and nonfatal accidents differ by
location (urban/non-urban), time of the day, and PPE use. The study found that most of
the fatal accidents occurred at non-urban locations, during afternoon hours, and due to
the lack of PPE usage. However, it was suggested that non- fatal serious injuries do
occur in urban locations, in the afternoon hours, and while the workers are using PPE.
Nevertheless, this study clearly indicates that the Danish construction industry needs to
train their non-urban located construction workers on PPE usage.
Sa, et.al., (2009) compared the residential roofers to commercial roofers in terms
of worker behavior, belief, work conditions, and attitudes towards the use of fall
protection devices which could lead to fall accidents. They did surveys on 252 roofers in

31
the Midwest. While preparing the surveys they benefited from the BLS statistics.
Authors administered frequency analysis for frequencies and log binominal regression
analysis to examine prevalence ratios (This type of statistical analysis is mostly used on
surveyed data) and reported results within the 95% confidence interval (CI). Authors
investigated the demographic characteristics, nature of injuries, fall protection provisions
and the causes of falls. According to the findings, residential roofers were more prone
to fall compared to commercial roofers; roofers who were working at the small
companies (less than 11 workers) inclined to have more accidents than larger
companies. This result was also in line with the findings of Chia et al, (2005). Sa et. al.
also stated that falls from roofs were more likely to be occurring at heights lower than 20
feet. One interesting demographic fact that came out of this study was that minority
workers were more likely to fall from roof than white workers. This finding is also
supported by another study which is done by Brunette (2004) on Hispanic worker
injuries at construction site. These findings clearly warn the residential roofing industry
about protecting the minority employees.
Stern, et. al. (2000), evaluated causes of mortality among 11,144 members of the
United Union of Roofers, Water Proofers, and Allied Workers (UURWAW). It is pointed
out by the authors that the U.S. roofing industry, including both roofing and
waterproofing applications, unionized and nonunionized, comprises about 25,000 firms,
employing approximately 300,000 people, and about 200,000 of these are involved in
the application of roofs.
Age-adjusted proportionate mortality ratios (PMRs) were computed with 95%
confidence intervals (CI) using U.S. age-, gender-, and race-specific proportional

32
mortality rates for the years of the study, 1950 through 1996.The authors used the
death benefits file maintained by the UURWAW and they found statistically significant
increases for PMRs for all injuries. Specifically, falls showed a PMR of 464 within a
confidence interval from 419 to 513.
The most notable mortality risk among roofers documented in the study was due
to falls, for where the PMR was significantly elevated reaching almost five times of that
expected. For roofers younger than 65 at death, the PMR for falls from a building was
3442, which is over 34 times higher than expected.
This study is important in providing epidemiologic information about the deaths of
roofers from all causes, and among these causes, falls constitute an important amount.
The weakness of the study is that it does not include any information about workers who
stopped paying their dues.
Authors do not have any new recommendations but they point out the
preventative efforts of the “roofing industry coalition” and also mention the “Roofing
Industry Partnership Program for Safety and Health''. The organizations that have
agreed to support and participate in this pilot program are: OSHA, The National Roofing
Contractors Association (NRCA), the UURWAW, CNA Insurance Companies, and the
National Safety Council. It was indicated that the pilot program might recommend more
intensive health and safety programs for roofers and their employers.
Ellis and Warner (1996) focused on promoting safety awards to prevent fall
accidents. They not only recommended strong and consistent fall protection training
programs, but also emphasized the importance of safety rewards on workers’ safety.
They suggested the ongoing recognition of successful performance. This, however, may

33
contradict with Sawacha, et. al.’s (1999) paper, which suggests that the productivity
bonuses may cause the workers to act unsafe in order to achieve higher production.
Winn, et. al. (2004) recognized that fall fatalities are number one among all the
construction incidents. They studied the literature in terms of the incentives’ role on fall
prevention. Based on their literature review and field questionaries’ on workers, they
found out that monetary incentives might have preventive effects. In addition, in their six
month of field survey, they observed that the monetary incentives had very short life,
such as a few days, on worker safety performance. They reported that non- material
(natural) incentives such as performance feedback, employee determined work
schedule, and independent work have longer term positive effects on fall safety
performance. Nevertheless, the nature of the construction work schedule may not allow
implementation of non-material incentives all the time.
Cohen and Lin (1991) focused on general ladder fall accidents on their research.
They stated that fall from the ladder accidents which resulted in hospital emergency
room admissions (nonfatal) were the second source of fall from elevation injury. They
administered 123 after the fact fall accident interviews with the victims for an 18 month
period. They coded the collected data by accident scenarios. According to their
frequency analysis, they found that 60% of the accidents occurred while the workers
were standing on the ladder; 26% were while they were descending from the ladder;
and 14% occurred while ascending from the ladder. The activities that were frequently
performed by the victims were 50% building maintenance and building construction,
which shows the importance of ladder fall hazards in the construction industry.
Overreaching while on the ladder was the highest frequency accident action. Their
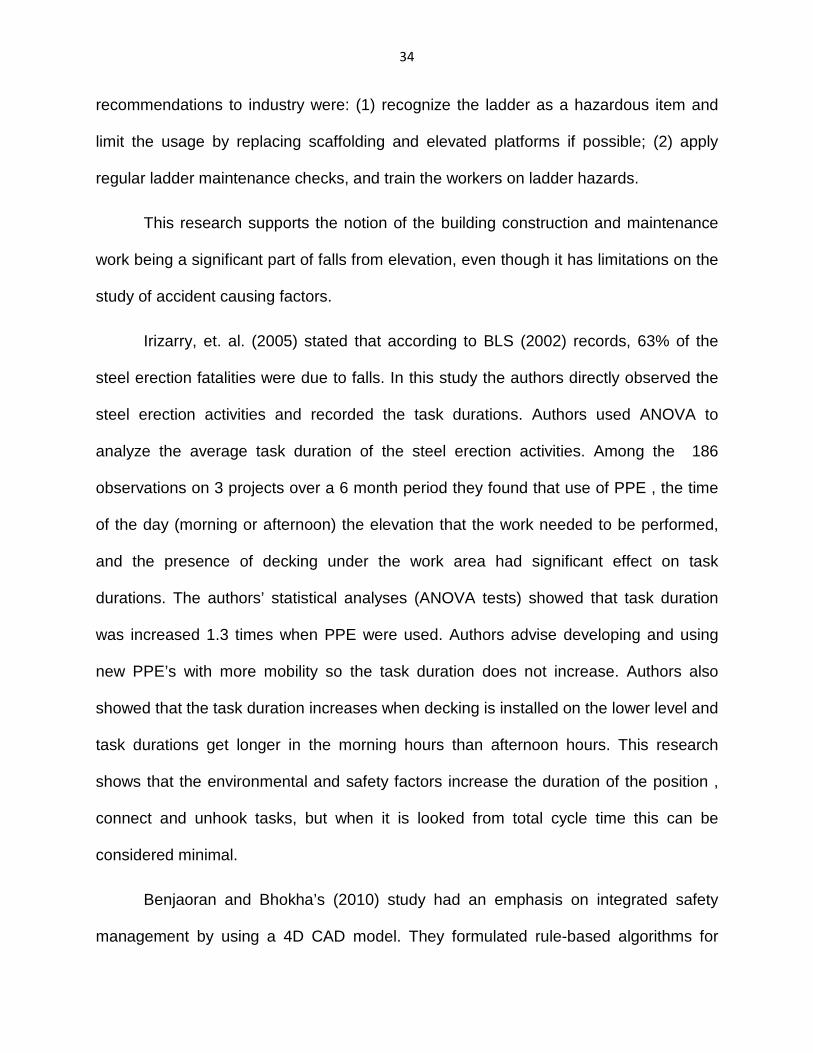
34
recommendations to industry were: (1) recognize the ladder as a hazardous item and
limit the usage by replacing scaffolding and elevated platforms if possible; (2) apply
regular ladder maintenance checks, and train the workers on ladder hazards.
This research supports the notion of the building construction and maintenance
work being a significant part of falls from elevation, even though it has limitations on the
study of accident causing factors.
Irizarry, et. al. (2005) stated that according to BLS (2002) records, 63% of the
steel erection fatalities were due to falls. In this study the authors directly observed the
steel erection activities and recorded the task durations. Authors used ANOVA to
analyze the average task duration of the steel erection activities. Among the 186
observations on 3 projects over a 6 month period they found that use of PPE , the time
of the day (morning or afternoon) the elevation that the work needed to be performed,
and the presence of decking under the work area had significant effect on task
durations. The authors’ statistical analyses (ANOVA tests) showed that task duration
was increased 1.3 times when PPE were used. Authors advise developing and using
new PPE’s with more mobility so the task duration does not increase. Authors also
showed that the task duration increases when decking is installed on the lower level and
task durations get longer in the morning hours than afternoon hours. This research
shows that the environmental and safety factors increase the duration of the position ,
connect and unhook tasks, but when it is looked from total cycle time this can be
considered minimal.
Benjaoran and Bhokha’s (2010) study had an emphasis on integrated safety
management by using a 4D CAD model. They formulated rule-based algorithms for

35
hazards for working at heights. They identified the specific hazards and developed a
system recommending the safety measures, such as safety precautions or
requirements. These algorithms and safety measures were embedded in the 4D CAD
model, so that each activity could be examined to determine if it contained hazards
associated with working at-heights. The system helps to identify hazards during design
and planning phases of construction projects, so safety measures can be easily
incorporated in the schedule.
Beavers, et. al., (2009) reported on fatality cases in steel erection during the
years 2000 through 2005. The authors analyzed OSHA’s IMIS data. Authors are part of
the Construction Industry Research and Policy Center (CIRPC) at the University of
Tennessee. This center, under contract with OSHA’s Directorate of Construction and
Directorate of Evaluation and Analysis, Office of Statistical Analysis, has been
evaluating the electronic records of these fatalities, which are available in the Agency’s
Integrated Management Information System (IMIS).
Based on its analysis of the IMIS records, CIRPC developed a mutually exclusive
list of 29 proximal cause codes of all fatal construction events. Each fatal event
occurring during the 16-year study period was classified and ranked by proximal cause
and annual reports were submitted to OSHA (CIRPC 1993).
According to this study “fall from/ through roof” was the number one cause in
terms of frequency, followed in rank order by “fall from/with structure (other than roof),”
“crushed/run-over of non-operator by operating construction equipment,” “electric shock
by equipment contacting power source,” and “hit, crushed, fall during lifting operations.”
These rankings have remained highly invariant from year to year. The five leading

36
proximal causes encompassed approximately 40% of the fatal construction events
inspected by OSHA Compliance Safety Health Officers throughout the nation from 1991
to 2006.
This paper concentrated on the fatalities involved in steel erections and falls were
the leading cause with 125 (75.3%) of the 166 fatal events. The authors critically
reviewed data from 166 steel-erection fatal events in the construction industry from
2000 to 2005 investigated by OSHA in the Federal Program States. The authors state
their primary purpose as “to determine what safety practices need to be improved in
steel erection.” Their key findings are as follows:
1. “Falls” dominated both steel decking and structural erection as the proximal
cause; 2. The leading factor contributing to the cause “falls” were “lack of fall protection”
and “fall protection not secured;” 3. The primary operation where the fatalities happened
was the construction operation “structural erection”; 4. “Placement of steel decking,”
was also a major source of fatalities; 5. Commercial building construction had the
greatest number of fatalities; 6.The victim’s own actions dominated the initiation of the
fatal event; 7. Most of the weaknesses in Safety and Health (SH) programs were in
enforcement, safety training, and communication with employees; 8. 73.2 % of the
victims were working at their task when the fatality occurred; 9. The action of the victim
was responsible for two thirds of the fatalities; 10. The dominant violations of OSHA
standards were failure to communicate safe work practices and to provide adequate fall
protection.
Authors’ recommendations were as follows: data enhancement by accurate and
complete data entry; and also data would help in developing intervention strategies.

37
This study also shows the lack of communication to employees so the obvious
recommendation is for employers to communicate safety requirements to the
employees and to have safety meetings during the construction process.
Also, the authors have shown in this study that the lack of fall protection was a
major cause of fatalities during the steel-erection process; and they recommend a
“safety person” who is present in the construction site at all times. This “competent”
person would make sure there is personal fall protection equipment available and
appropriate fall protection systems such as: guard rails, covers, nets, barriers, and
safety nets.
The authors also recommend that the employers should pay special attention on
fall protection standards and training of employees to understand fall protection
standards.
The literature review presented herein reveals that numerous studies have been
conducted on construction fall accidents to date by using either OSHA reports and data,
or similar foreign organization accident reports. Some researchers have conducted
surveys. The authors of these studies have mostly used univariate analysis, and a
limited number of studies adopted the multivariate analysis methodologies such as
analysis of variance (ANOVA), chi-square tests and binominal regression analysis. The
most recently published study on fall- related accidents recorded by OSHA covered the
years 1982 through 2002, and focused on all construction trades as a whole. In this
dissertation research study, univariate and multivariate analysis of fall-related accidents
recorded by OSHA between 1994 and 2008 were used. Our study specifically focused

38
on Standard Industrial Classification (SIC) Codes 1761 and 1791, which are roofing,
siding and sheet metal workers and structural steel erection workers.
As the methodology, three different types of analysis were carried out in this
study. First, univariate analysis was used, starting with the identification of variables and
generating univariate frequency values and percentages. Secondly, we obtained the
relationships between dependent and independent variables by cross tabulation and
used the chi-square test and phi values to determine the significance of the
relationships and their strengths. Lastly, the identified variables were used to develop
predictive models by utilizing logistic regression analysis.
Dichotomous categorical variables were used to first create a model for whole
(combined) data. Second, separate models were developed for roofers (SIC1761) and
for steel workers (SIC 1791). No published information has been encountered in the
literature that has utilized this type comparative modeling approach. A detailed
explanation of this approach is explained in the methodology part of this dissertation,
followed by results and conclusions.

39
CHAPTER 3
METHODOLOGY
3.1. DATA SOURCE AND DATA ACQUISITION
The data source for this research project is OSHA’s IMIS (Integrated
Management Information System) database containing recordable incident reports filed
for the time period of 1994 through 2008. Reports on all of the construction accidents
included in this database are publicly available, and detailed information on accidents
can be retrieved from OSHA’s web page (www.osha.gov). A sample accident report is
provided in Appendix A.
The data pertaining to SIC codes 1761 and 1791 were extracted from the OSHA
database by OSHA staff using appropriate filters. Secondary filtering was applied by the
researcher to obtain the data on fall from elevation cases.
The data initially provided to us by OSHA upon our request included the following
categories: summary number; the date (day, month and year) of the accident; state in
which the accident occurred; SIC code of the victim, union status; degree of injury;
nature of injury; age of the victim; sex of the victim; event description; environmental
factors; human factors; task regularity; event type; construction end use; project type;
project cost; non-building height; fall distance; fall height; construction operation cause
and fatality cause. OSHA‘s definitions of these terms appear in Appendix B. It should be
noted that only data pertaining to SIC codes 1761 and 1791 was requested and
received from OSHA.

40
Among the 2464 cases that were initially screened out, there were 253 cases
that had insufficient or unclear information on the construction operation that led to the
accident. Age and sex information were missing on 1155 cases and 169 cases lacked
information on construction end use. Similarly, information on project type, project cost
and fall distance were missing on 251, 259 and 40 cases, respectively. Finally, 701
cases for steel workers 1413 cases for roofers were determined to be complete and
useable for statistical analysis.
3.1.1. OSHA DATA TAXONOMY
The information provided by OSHA was represented by the following taxonomy
for categorical variables and their values, which were considered as a starting point for
constructing the final research database. Table 3 presents a listing of these variables
and their values, including the coding used by OSHA.
Table 3: Original OSHA variables VARIABLE VALUES
Day Monday, Tuesday, Wednesday, Thursday, Friday, Saturday,
Sunday
Month January, February, March, April, May, June, July, August,
September, October, November, December
Year 1994-2008
State All 50 states and territories
SIC code 1761 and 1791
Union status Union
Nonunion
Degree of injury 1.Fatality
2.Hospitalized
3.Non-hospitalized

41
Age 16 years old and over
Sex 1.Male
2.Female
Nature of the injury 1. Amputation 2. Asphyxia 3. Bruise/contus/abras 4. Burn(chemical) 5. Burn/scald(heat) 6. Concussion 7. Cut/laceration 8. Dermatitis 9. Dislocation 10.Electric shock 11.Foreign body eye 12.Fracture 13.Freezing/frost bite 14.Hearing loss 15.Heat exhaustion 16.Hernia 17.Poisoning(systemic) 18.Puncture 19.Radiation effects 20.Stra/spra 21.Other 22.Cancer
Environmental factors 1. Pinch Point Action 2. Catch Point/Puncture Action 3. Shear Point Action 4. Squeeze Point Action 5. Flying Object Action 6. Overhead Moving/Falling Obj Ac 7. Gas/Vapor/Mist/Fume/Smoke/Dust 8. Materials Handlg Equip./Method 9. Chemical Action/Reaction Expos 10.Flammable Liq/Solid Exposure 11.Temperature +/- Tolerance Lev. 12.Radiation Condition 13.Work-Surface/Facil-Layout Cond 14.Illumination 15.Overpressure/Underpressure 16.Sound Level 17.Weather, Earthquake, Etc. 18.Other

42
Human factors 1. Misjudgment, Haz. Situation 2. No Personal Protective Eq Used 3. No Appropr Protective Clothing 4. Malfunc In Securing/Warning Op 5. Distracting Actions By Others 6. Equip. Inappropr For Operation 7. Malfunc, Neuromuscular System 8. Perception Malfunc, Task-Envir. 9. Safety Devices Removed/Inoper. 10.Position Inapropriate For Task 11.Mater-Handlg Proced. Inappropr 12.Defective Equipment In Use 13.Lockout/Tagout Proced Malfunc 14.Other 15.Insuff/Lack/Housekeeping Program 16.Insuff/Lack/Expos/Biologcl Mntrg. 17.Insuff/Lack/Engineerng Controls 18.Insuff/Lack/Writn Wrk Prac Prog. 19.Insuff/Lack/Respiratory Proctect 20.Insuf/Lack/Protcv Wrk Clthg/Equip
Task 1.Regularly assigned
2.Not regularly assigned
Event type 1. Struck by
2. Caught in or between
3. Bite/sting/scratch
4. Fall (same level)
5. Fall (from elevation)
6. Struck against
7. Rubbed/abraded
8. Inhalation
9. Ingestion
10.Absorption
11.Rep. Motion/pressure
12.Card-vasc./resp. fail.
13.Shock
14.Other

43
Construction end use 1. Single family or duplex dwelling
2. Multi-family dwelling
3. Commercial building
4. Manufacturing plant
5. Refinery
6. Power plant
7. Sewer/water treatment plant
8. Other building
9. Highway, road, street
10. Bridge
11. Tower, tank, storage ,elevator
12. Shoreline development, dam, reservoir
13. Pipeline
14. Excavation, landfill
15. Power line, transmission line
16. Other heavy construction
17. Contractor's yard/facility
Project type 1. New project or new addition 2. Alteration or rehabilitation 3. Maintenance or repair 4. Demolition 5. Other
Project cost 1. UNDER $50K
2. $50-$250K
3. $250-$500K
4. $500K-$1M
5. $1-$5M
6. $5-$20M
7. $20 M over Non building height Nearest whole number Fall height Nearest whole number Fall distance Nearest whole number

44
Construction operation cause
1. Back filling and compacting 2. Bituminous concrete pavement 3. Construction of playing fields and tennis courts 4. Cutting concrete pavement 5. Demolition 6. Not Applicable 7. Elevator/ escalator installation 8. Emplacing reinforcing steel 9. Erecting structural steel 10. Not Applicable 11. Excavation 12. Exterior masonry 13. Exterior cladding 14. Exterior carpentry 15. Exterior painting 16. Fencing, installing lights, signs etc. 17. Not Applicable 18. Forming 19. Forming for piers and pylons 20. Installing interior walls ceilings and doors 21. Installing metal siding 22. Installing windows doors and glazing 23. Installing culverts and incidental drainage 24. Installing equipment (HVAC other) 25. Installing plumbing , lighting fixtures 26. Not Applicable 27. Interior tile work ( ceramic, vinyl , acoustic) 28. Not Applicable 29. Interior plumbing, ducting, electrical work 30. Interior carpentry 31. Exterior carpentry 32. Landscaping 33. Not Applicable 34. Not Applicable 35. Not Applicable 36. Placing bridge deck 37. Placing bridge girders and beams 38. Plastering 39. Pouring or installing floor decks 40. Pouring concrete floor at grade 41. Not Applicable 42. Pouring concrete foundation and walls 43. Roofing 44. Not Applicable 45. Site clearing and grubbing 46. Not Applicable 47. Not Applicable 48. Surveying 49. Not Applicable 50. Temporary work ( buildings, facilities) 51. Not Applicable

45
52. Trenching, installing pipe 53. Waterproofing 54. Steel erection of solid web -connecting 55. Steel erection of solid web – bolting – up /detail work 56. Steel erection of solid web –welding /burning/grinding 57. Steel erection of solid web-plumbing-up. 58. Steel erection of solid web-moving point to point. 59. Steel erection of solid web-landing materials (hoisting) 60. Steel erection of open web steel joists-connecting 61. Steel erection of open web steel joists-bolting-up 62. Steel erection of open web steel joists-welding 63. Steel erection of open web steel joists-plumbing 64. Steel erection of open web steel joists-moving point to point 65. Steel erection of open web steel joists-landing materials 66. Installation of decking-initial laying deck 67. Installation of decking-final attachment deck (welding) 68. Installation of decking-flashing of decking 69. Installation of decking-hoisting bundles 70. Other activities-installing ornamental and archite 71. Other activities-post decking detail work
Fatality cause 1. Asphyxiation / inhalation of toxic vapor 2. Caught in stationary equipment 3. Collapse of structure 4. Crushed/run over of non-operator by operating cons. 5. Crushed/run over/trapped of operator by operating cons. 6. Crushed/run over by construction equipment during 7. Crushed/run over by highway vehicle 8. Electrocution by touching exposed wire/source 9. Electrocution by equipment contacting wire 10. Electrocution from equipment installation / tool use 11. Electric shock, other and unknown cause 12. Drown, non-lethal fall 13. Elevator (struck by elevator or counter weights) 14. Fall from/with ladder 15. Fall from roof 16. Fall from/with scaffold 17. Fall from/ with bucket (aerial lift basket) 18. Fall from/ with structure other than roof 19. Fall from / with platform catwalk (attached to structure) 20. Fall through opening (other than roof) 21. Fall other 22. Fall from vehicle 23. Fire/ explosion 24. Heat / hypothermia 25. Lifting operations 26. Struck by falling object/ projectile 27. Not Applicable 28. Unloading/ loading equipment/ material (except by crane) 29. Wall (earthen) collapse 30 Other

46
3.1.2. DATA REFINEMENT
The taxonomy used by OSHA and presented in Table 3 was subsequently
modified; some variables were eliminated if they appeared to be not useful or relevant;
and new variables were created by reviewing the 2114 case reports to produce
potentially more useful and relevant variables. Also, some of the OSHA variables and
values were renamed to improve their ease of understanding in terms of practical
construction situations. For example, the “construction operation cause” name was
changed to “construction operation that prompted fall” to describe it better; and “fatality
cause” similarly was changed to “fatality/injury cause” because it contained both fatality
and injury cases. As a result, an initial version of the research database was created
with the variables and values listed in Table 4.
Table 4: Initial research data taxonomy Variables Values
1. Union status Union Nonunion
2. Degree of injury Fatal Nonfatal
3. Age AG1:15-25: AG4: 46-55 AG2:26-35: AG5: 56-65 AG3:36-45: AG6: 66 over
4. SIC code 1761 1791
5. Environmental factors Same as OSHA taxonomy
6. Human factors Same as OSHA taxonomy
7. Task assignment Same as OSHA taxonomy
8. Construction end use CEG1: Highway CEG5: Other CEG2: Heavy/civil CEG6: Industrial CEG3: Residential CEG4: Commercial

47
9. Project type PT 1: New project or new addition PT 2: Alteration/rehabilitation, maintenance/repair, demolition and other.
10. Project cost PC 1: less than $50K PC 2: more than $50K less than $5M PC 3: more than 5M
11. Fall distance FD 1: 0-10 feet FD 2: more than 10’ less than 20’ FD 3: more than 20’
12. Construction operation prompting fall Same as OSHA taxonomy 13. Fatality/ injury cause Same as OSHA taxonomy
It was noted that the variable work surface/facility layout condition was the
highest occurring environmental factor (1175 cases) causing the accidents, while the
term was somewhat ambiguous. So, a secondary review was performed on the
mentioned cases under this category to further identify subcategories of this variable.
These subcategories are as follows:
1. Hazardous work surface/ housekeeping problems
2. Structural failure (other than full collapse)
3. Unguarded/ improperly secured platforms, walkways, openings edges, ladders
4. Moving, flying or falling object
5. Wind and other weather related factors
6. Materials handling and equipment
7. Chemical and radiation action
8. Miscellaneous issues of work service facility layout conditions.
9. Other
The values of variables for age, human factors, construction end use,
construction operation prompting fall, fatality/injury cause were also re-organized. The

48
cases that had frequencies less than 5% were bulked together to form the final set of
values. On a separate effort, citation information was reviewed for each case and three
new variables were created. These three new categorical variables were named fall
safety system provided, fall safety system used, and safety training provided. The final
form of the research data taxonomy is displayed in Table 5.
Table 5: Final research data taxonomy
Variables Values
1. Degree of injury
1. Fatal
0. Nonfatal
2. Union status
1. Union
0. Nonunion
3. Age
1. AG 1≤30 years old
2. 30<AG 2< 50
3. AG 3≥50
4. SIC Code
1. 1761- roofers
0. 1791-steel workers
5. Environmental factors
1. Hazardous work surface/ housekeeping
problems
2. Structural failure (other than full collapse)
3. Unguarded/ improperly secured platforms,
walkways, openings edges, ladders
4. Moving flying or falling object
5. Wind and other weather related factors
6. Materials handling and equipment
7. Chemical and radiation action
8. Miscellaneous issues of work service facility
layout conditions.
9. Other

49
6. Human factors
1. Misjudgment of hazardous situation
2. Malfunctioning safety equipment/system
(including lockout /logout tag out)
3. Distracting actions by others
4. Human system malfunction
5. Inappropriate choice /use of equipment,
position, material handling, processing
6. Insufficient engineering and administrative
controls
7. Other
7. Task regularity
1. Regularly assigned
0. Non regularly assigned
8. Construction end use
CEG 1: Commercial and residential
CEG 2: Industrial
CEG 3: Heavy civil
CEG 4: Other
9. Project type
PT 1: New project or new addition
PT 2: Alteration or rehabilitation, maintenance or
repair, demolition and other.
10. Project cost PC 1: less than $50K PC 2: more than $50K less than $5M PC 3: more than 5M
11. Fall distance FD 1: 0-10 feet FD 2: more than 10’ less than 20’ FD 3: more than 20’

50
12. Construction operation prompting fall
1. Roofing
2. Erecting structural steel
3. Ext carpentry,
4. Installing metal siding & water proofing
5. Specific steel functions including decking
6. Other
13. Fatality/injury cause
1. Collapse of structure
2. Fall from /with ladder
3. Fall from roof
4. Fall from / with scaffold, bucket and platform
catwalk ( attached to the structure)
5. Fall through opening
6. Fall from /with structure other than roof
7. Other
14. Fall safety protection system provided (including proper cover and defective equipment, e.g. ladder, scaffold)
1: Provided
0: Not provided
15. Fall safety protection system is used
1: Used
0: Not used
16. Safety training and re-training provided
1: provided
0: not provided
3.2. STATISTICAL ANALYSIS
3.2.1. UNIVARIATE FREQUENCY ANALYSIS
Frequency distributions were established for the variables listed in Table 5 to
observe the magnitudes of the values pertaining to each variable. The SPSS software
was used for this analysis. The results, first for the whole data (2114 cases for SIC 1761

51
and 1791 combined), then for roofers (1413 cases for SIC code 1761), and lastly for
steel workers (701 cases for SIC 1791) were graphed and presented in the form of bar
charts.
3.2.2. MULTIVARIATE ANALYSIS
In this study, multivariate analysis were performed on the whole data (combined
SIC 1761 and SIC 1791), and then separately on SIC 1761 (roofer) and SIC 1791 (steel
worker) data. Cross tabulation was done to study the relationship between the
research variables. For this purpose, each variable’s effect on the degree of injury was
examined. The consequences of the accidents were divided into two categories; fatality,
and non-fatality. This is the degree of injury variable, which comes from the original
OSHA taxonomy. The degree of injury was adopted as the dependent variable, and all
the other variables were taken as independent variables. In other words, the effects of
the factors (independent variables) on the degree of injury (dependent variable) were
investigated. The SPSS program was used for this analysis, as well.
3.2.2.1. CROSS TABULATION, CHI SQUARE VALUES AND PHI VALUE
In this portion of the study, cross tabulation was used to examine the frequencies
of observations that belong to specific categories on two or more variables. By studying
these frequencies, we can identify the relationships between the cross -tabulated
variables. Cross tabbing was applicable, since most of the variables in this study were
categorical. However, it is possible to convert continuous variables to categorical
variables by recoding, and this was done, when needed.
The simplest form of cross tabulation is the 2 by 2 contingency table where two
variables are "crossed," and each variable has only two distinct values. Each cell

52
represents a unique combination of values of the two cross-tabulated values, and the
numbers in each cell indicate how many observations fall into each combination of
values. These observations are calculated simply by establishing the frequencies of
variables from the data set. The relationship can be determined by using the Pearson
chi square statistic or the maximum likelihood chi square statistic. The chi-squared test
works on the hypothesis that the row and column classifications are independent. It
displays the calculated test statistic and an associated p-value. If the p-value falls below
a critical value such as 0.05, the hypothesis of independence between rows and
columns is rejected at that significance level. The individual rows or columns of a cross-
tab table can be represented graphically by using histograms, bar charts, or line plots.
The basic approach taken to select the variables for cross tab analysis was to
consider the associations between the dependent variable and each of the independent
variables. This is summarized in Table 6.
Layered cross tabulation determines the collective effect on degree of injury from
two or more independent variables. Two layered cross tabulation analysis were done in
this research study. First, if safety training and union status had any collective effect on
fatality, second, SIC codes and union status’ collective effect were determined.

53
Table 6: Cross tabulation summary
Independent Variables Dependent variable
Union Degree of injury Sic Degree of injury Age Degree of injury Environmental factors Degree of injury Human factors Degree of injury Task assignment Degree of injury Construction end use Degree of injury Project type Degree of injury Project cost Degree of injury Fall distance Degree of injury Construction operation prompting fall Degree of injury Fatality/injury cause Degree of injury Fall safety protective system provided Degree of injury Fall safety protective system used Degree of injury Fall safety training provided Degree of injury Fall safety training provided and union status (layered) Degree of injury SIC Code and union status (layered) Degree of injury
3.2.2.1.1 Parameters:
Pearson chi square (X2) test is used to identify the significance of the relationship
variables, while p denotes the significance of the chi square value.
The relevant formula is:
𝐗𝟐 = ∑ (𝐎𝐢−𝐄𝐢 )𝟐
𝐄𝐢
𝐍𝐢=𝟏
where 𝐎𝐢 = Observed frequencies
𝐄𝐢 = Expected frequencies, and
N = Sample size
The “p-value” is used to determine whether or not the deviation of the observed
from that expected is due to chance.
Equation 1

54
When the p-value is less than the significance value of 0.05, (α=.05, confidence
level of 95%) the null hypothesis is rejected, and the result is said to be statistically
significant.
Furthermore, to know the relative strength of this relationship, Phi or Cramer’s
values are calculated. Phi value is applicable to only 2x2 cross- tab tables, while
Cramer’s V has no restriction.
Phi and V are calculated by:
∅ = �X2
N
m= (# rows-1) or (# columns-1), whichever is smaller
Phi values as well as Cramer’s V values vary from 0 to 1.
In this study, we adopted the below scale for that Ф or Cramer’s V values
indicate the following:
• 0-.1 – weak relationship
• .1-.3 – moderate relationship; and
• .3-1.0 – strong relationship
(Healey, 2011)
The odd is the ratio of the probability that an event of interest occurs to the
probability that it does not occur. This is often estimated by the ratio of the number of
times that the event of interest occurs to the number of times that it does not. (M.Bland.,
and D.G. Altman, 2000).
Equation 2 V = � X2
m. N

55
Odds=P1
1−P1
Where, p1= The probability of the occurrence of event 1.
Odds ratio=
P11−P1
�
P21−P2
�
Where, P2= The probability of the occurrence of event 2.
Events are dichotomous variables used in cross tabulation, V1, V2.
3.2.3. LOGISTIC REGRESSION MODELING
Logistic regression (LR) is a mathematical modeling approach which describes
the occurrence or nonoccurrence of an event. This method has been used in
epidemiological research for calculating the probabilities of certain disease outcomes;
(Kleinbaum, 1994); traffic accident causal factor probabilities (Al –Ghamdi, A.S., 2002);
and also in construction management (Huang, 2003). Like any other model building
technique, the goal of the logistic regression analysis is to find the best fitting and most
parsimonious, yet reasonable, model to describe the relationship between an outcome
(dependent or response variable) and a set of independent (predictor or explanatory)
variables (Hosmer and Lemeshow, 2000). Logistic regression does not have the
requirements for the independent variables to be normally distributed, linearly related, or
of equal variance within each group (Kleinbaum, et.al. 1994).
Equation 3
Equation 4

56
3.2.3.1. MODEL CONSTRUCTION
Logistic regression is useful for situations in which one wants to be able to
predict the presence or absence of a characteristic (outcome variable) based on the
values of a set of predictor variables. It is suited to models where the dependent
(outcome) variable is categorical and dichotomous. Logistic regression coefficients can
be used to estimate odds ratios for each of the independent (predictor) variables in the
model. The predictor variables can be categorical or continuous. (SPSS version 20
definitions, user manual 2012).
Logistic regression is used for prediction of the probability of occurrence of an
event by fitting data to a logit function curve. This function generates a cumulative
distribution function of S shape (Figure 10) where the probability must lie between 0 and
1. It should be noted that the relationship between probability and the independent
variables is nonlinear, but the relationship of the log odds and the independent variables
is linear.
Figure 10: Logit function In this study, logistic regression techniques are applied to determine how the
probability of the degree of injury can be predicted from information contained in
previous accident data. The relationship takes the form of an arithmetic equation;

57
Y = β0 + β1.X1 + β2.X2 + ... + βn.Xn Equation 5
Where, Y = Degree of injury (dependent variable); β0= exposure variable (or
constant); β1...n = regression coefficients; and X1...n= accident variables (independent/
input variables).
Y can also be written as:
Y = β0 + �(βi. Xi)n
i=1
𝐸𝑞𝑢𝑎𝑡𝑖𝑜𝑛 6
In the model P(x) denotes the probability that Y=1, which is the occurrence of the
fatal injury. Similarly, 1- P(x) defines the probability that Y=0, which is the absence of
fatal injury (or the existence of non-fatal injury). It should be mentioned that the x in the
expression P(x) is a vector representing the set of the independent predictor variables
X1, X2 …Xn. These probabilities can be written in the following form:
P(x) = P(Y = 1| X1, X2… Xn) Equation 7
and
1 – P(x) = P(Y = 0| X1, X2… Xn) Equation 8
Then the odds function can be expressed by using the logit transformation as:
𝐥𝐥 � 𝐏 �𝐘=𝟏�𝐗𝟏,𝐗𝟐,…,𝐗𝐥,�𝟏−𝐏�𝐘=𝟏�𝐗𝟏,𝐗𝟐,…,𝐗𝐥,�
� = 𝐥𝐥 � 𝐏(𝐱)𝟏−𝐏(𝐱)� = 𝛃𝑶 + 𝛃𝟏. 𝐗𝟏 + 𝛃𝟐. 𝐗𝟐 + ⋯ 𝛃𝒏. 𝐗𝒏 Equation 9
or
𝐥𝐥 � 𝐏 �𝐘=𝟏�𝐗𝟏,𝐗𝟐,…,𝐗𝐥,�𝟏−𝐏�𝐘=𝟏�𝐗𝟏,𝐗𝟐,…,𝐗𝐥,�
� = 𝐥𝐥 � 𝐏(𝐱)𝟏−𝐏(𝐱)� = 𝛃𝟎 + ∑ (𝛃𝐢 ∙ 𝐗𝐢)𝐥
𝐢=𝟏
For the purposes of this research, using the inverse of the logit transformation of
the above equation one can arrive at the following equation:
Equation 10

58
P(Y=1|X1, X2... Xn) = 𝟏
𝟏+𝐞−(𝐘) Equation 11
where P indicates the occurrence of the fatal injury. And in the equation Y is used
for β0 + ∑ (βi. Xi)ni=1
“Wald test” parameter is used to test the statistical significance of each
coefficient (β) in the model. Coefficient beta (β) is also used to calculate exponential
beta (EXP (β)) which is used as an odds ratio for each independent variable. This
essentially is a probability of an event occurring vs. not occurring.
The SPSS program was used to develop the regression models. The Hosmer
and Lemeshow test was used to measure of goodness of fit. It indicates a poor fit if the
significance value is less than 0.05.
3.2.3.2. MODEL VALIDATION
Predictive logistic regression models are developed in this study to make
informed decisions on the role of fall accident factors’ on fatality. Before predictions from
logistic regression models are attempted, predictive ability should be validated. Model
validation can be checked by studying residuals, defined as the difference between
predicted and observed outcome. Validation refers to the agreement of predicted and
observed predictions, e.g. 70% predicted = 70% observed. There are three ways to
validate the model. 1. Apparent: performance on the sample used to develop model;
2.Internal: performance on the population underlying the sample; 3.External:
performance on a related but slightly different population.

59
In this study the internal validation technique was used. A key characteristic for
internal validation is that data for model development and evaluation are both random
samples from the same underlying population. (Steyerberg et.al. 2001)
The SPSS program uses simulated Bernoulli trials to draw a random sample of
records from a finite population of records (Strand, 1979). This software randomly
assigns cases to sample groups. In this study a 70/30 split of the data was adopted for
validation. If the overall percentages of correct prediction values are close, this means
the model is validated.

60
CHAPTER 4
RESULTS AND DISCUSSIONS
4.1. UNIVARIATE FREQUENCY ANALYSIS OF WHOLE DATA
In the figures representing the results of the univariate frequency analysis, the
number at the top of the bar denotes count, and the number in the middle is the
corresponding percentage. This convention has been followed for Figures 11 through
Figure 56, which cover all of the research variables used in this study. Note that, these
figures have been designed to show the frequencies in descending order to facilitate
easier identification of high, medium and low values.
Figure 11: Frequency analysis for degree of injury
In reference to Figure 11, one can observe that the majority of the accidents
(56.5%) included in the analysis resulted in fatality in comparison to (43.5%) which were
nonfatal. These results show that the degree of injury is well balanced relative to the
distribution of fatal versus nonfatal accidents.

61
Figure 12: Frequency analysis for union status
The frequency analysis shown in Figure 12 indicates that most of the accident victims
were nonunion members (79%).
Figure 13: Frequency analysis for age
Age information was missing in 1155 cases, which represents more than fifty
percent of the whole data. The univariate frequency anaysis performed on the
remaining data clearly shows that age group 2 ( 50≥ AG 2 >30) is the most accident
prone age group, as can be seen from Figure 13. This observation is in line with the

62
findings of Huang and Hinze (2003), except for the fact that they covered all
construction trades. In a different study, however, Sawacha, et.al.(1996) identified the
worker age group of 16 to 20 as the most accident prone, and further suggested that
above the age of 28, accidents tended to decline. The authors tied this to experienced
workers being more careful on the task site. In contrast, Huang and Hinze (2003)
conculuded in their paper that experience in construction for more years may not
necessarily lead to a decrease in fall accidents.
Figure 14: Frequency analysis for SIC Code
The univariate frequency analysis for the two SIC codes (roofers and steel
workers) is shown in Figure 14, which indicates that the data is dominated by the
roofers (66.8%) versus steel workers (33.2%). This signifies that roofing industry is
more prone to accidents. Janicak (1998), stated in his paper that roofing is the most
fatality prone trade among all others.

63
Figure 15: Frequency analysis for environmental factors
Figure 15 displays the frequencies of subfactors (values) under the
environmental factor variable. It is clear that unguarded/improperly secured platforms,
walkways, openings, edges and ladders have occurred most frequently, closely followed
by the “other” category. This category includes pinch point action, catch point/ puncture
action, squeeze point action, temperature +/- tolerance level, illumination, and
overpressure/under pressure. Although in smaller frequencies, hazardous work surface/
housekeeping, structural failure, material handling and equipment and moving,
flying/falling object, also play roles in accidents as considered under environmental
factors.

64
Figure 16: Frequency analysis for human factors
So far as human factors are considered, inappropriate choice/use of equipment,
position, material handling, processing showed the highest frequencies, closely followed
by misjudgment of hazardous situation. These are laid out in Figure 16. A report, based
upon OSHA-inspected fatal events in construction during the calendar year of 2003,
suggests that in 61.2% of the fatal accidents the victim was the primary initiator of the
event, underscoring the importance of human element in accident causation.
(Construction Industry and research policy at the University of Tennessee, Knoxville for
OSHA’s Office of statistics, 2003).

65
Figure 17: Frequency analysis for task regularity
Figure 17 shows that a majority of the fall from elevation accidents occurred
while the victim was working on a regulary assigned task. Research done by
Construction Industry Research and Policy Center, University of Tennesse , Knoxville
(2003) confirms this finding. It was found in this study that in 72.3% of construction
accidents, the victim was at his/her regulary assigned task.
Figure 18: Frequency analysis for construction end use

66
Construction end use frequencies are graphed in Figure 18, where it is observed
that commercial and residential work has the highest accident frequency. Prior to
December 16, 2010, which is before the time period covering our resarch data, OSHA‘s
standard 03-00-001 allowed employers, who were engaged in certain residential
construction activities to, use alternative methods of fall protection that were specified to
them rather than conventional fall protection required by the residential construction fall
protection standard. But this was not effective. According to Assistant Secretary of
Labor for Occupational Safety and Health, Dr. David Michaels (December 2010),
“fatalities from falls are the number one cause of workplace deaths in construction and
that there should be no tolerant attitude towards workers getting killed in residential
construction accidents when there are effective means readily available to prevent their
deaths”. (http://www.hugsafety.com/2010/12/28/oshas-new-residential-roof-safety-
directiv/). This new directive, which become effective on December 16, 2010, indicates
that all residential construction employers must now comply with 29 Code of Federal
Regulations 1926.501(b)(13). This may provide better fall protection to construction
workers, especially residential roofers.

67
Figure 19: Frequency analysis for project type
Figure 20: Frequency analysis for project cost
As seen in Figure 19 and 20, most of the accidents occurred in new projects or
additions, and in projects costing between $50,000 and $ 5 million.
.

68
Figure 21: Frequency analysis for fall distance
Fall distance frequency analysis results are graphed in Figure 21. According to
these results, most of the accidents occurred for fall distances over 20 feet. The mean
fall distance for the whole data was 23.77 feet; the minimum fall height was 1 feet, and
the maximum fall height was 339 feet. Analyses by Huang and Hinze (2003) identified
the fall heights of 0 to 30 feet as the most frequently occurring in fall accidents for all
construction workers. However, in the study by Janicak (1998) based on review of 565
OSHA accident cases between the years of 1992 and 1995, it was found that falls
mostly occurred at work heights of 12 feet or less. This study may have included falls on
the same level.

69
Figure 22: Frequency analysis for construction operation prompting fall
Figure 22 exhibits frequencies for the various construction operations prompting
fall accidents. Here, roofing stands out as the dominating construction operation
(54.7%) that leads to an accident. Others with relatively significant percentages are
erecting structural steel, external carpentry, and installation of metal siding and water
proofing.
Figure 23: Frequency analysis for fatality/injury cause

70
Frequency values for fatality/injury cause are bar graphed in Figure 23, where fall
from roof comes out as the most frequently occuring fatality/injury cause, at a level of
53.7%. Falls from/with structures, from/with ladders,and from/with scaffolds and similar
platforms also show relatively high frequencies, but significantly below falls from roofs.
The Construction Industry Research and Policy Center, University of Tennesse,
Knoxville (2003) implemented univariate frequency analysis of 707 accidents that
occurred in 2003 based on OSHA’s accident reports. Their findings also support that fall
from roof is the leading fatality cause, which is 10.7% of all fatal cases.
Figure 24: Frequency analysis for fall safety protection system provided

71
Figure 25: Frequency analysis for fall safety protection system used
As previously explained in Chapter Three, fall safety protection system provided
and fall safety protection system used were created as new variables by reviewing all
the data to see if the cases have certain citation that indicates the lack of fall safety
protection system provisions and lack of usage. Frequencies established are given in
Figure 24 and Figure 25. The graphs indicate that 61.8% of the cases did not have fall
safety protection system provisions and 62.7% of the victims had not used the system
that was provided. We found that only very small fraction of the victims (.9%) had not
used the system even when the system was provided. These ties in with the earlier
comment regarding fatality cause eminating from the victim as the initiator of the
situation.

72
Figure 26: Frequency analysis for fall safety training provided
Another new variable was related to whether safety training was provided to the
victim. As seen in Figure 26, in 1421 cases the victim had recieved safety training
or/and retraining, versus 693 cases where the victim had no safety training. This
observation raises questions on the effectiveness of safety training for the cases
examined to prevent the fall accident.
4.2. UNIVARIATE FREQUENCY ANAYSIS OF ROOFERS (1761)
Figure 27: Frequency analysis for degree of injury among roofers

73
In reference to Figure 27, one can observe that a majority of the accidents
among roofers resulted in no fatality (58%).
Figure 28: Frequency analysis for union status among roofers
The frequency analysis shown in Figure 28 indicates that most of the accident
victims among roofers were nonunion members (90.7%).
Figure 29: Frequency analysis for age among roofers
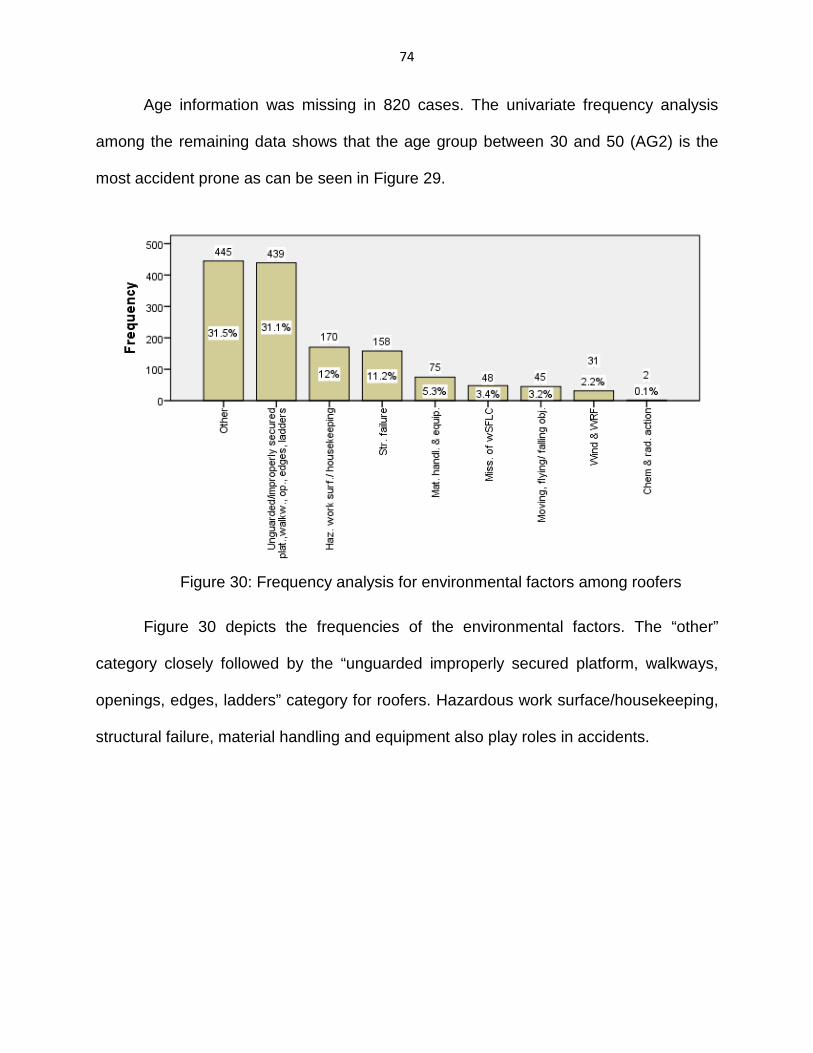
74
Age information was missing in 820 cases. The univariate frequency analysis
among the remaining data shows that the age group between 30 and 50 (AG2) is the
most accident prone as can be seen in Figure 29.
Figure 30: Frequency analysis for environmental factors among roofers
Figure 30 depicts the frequencies of the environmental factors. The “other”
category closely followed by the “unguarded improperly secured platform, walkways,
openings, edges, ladders” category for roofers. Hazardous work surface/housekeeping,
structural failure, material handling and equipment also play roles in accidents.

75
Figure 31: Frequency analysis for human factors among roofers
Figure 31 clearly shows that misjudgment of hazardous situation (34.7%) and
inappropriate choice/use of equipment, position, material handling and processing
(32.4%) are the highest frequency human factors that cause the accidents for roofers.
Figure 32: Frequency analysis for task assignment among roofers

76
Figure 32 shows that a majority of the fall from elevation accidents among
roofers occurred while the victim was working on a regularly assigned task.
Figure 33: Frequency analysis for construction end use among roofers
Figure 33 displays the construction end use frequencies among the roofers (SIC
1761). It can be observed that commercial and residential end use had the highest
accident frequency. As explained earlier, OSHA was accepting properly utilized fall
restrain system in lieu of a personal fall arrest system prior to new directive of
conventional fall protection which is under 29 Code of Federal Regulations 1926.501(b)
(13) which was effective since December 16, 2010. According to BLS data,
(http://www.hugsafety.com/2010/12/28/oshas-new-residential-roof-safety-directiv/) falls
from roofs were causing forty deaths among roofers each year which was clearly
showing the appropriateness of current change of OSHA enforcement on the issue.

77
Figure 34: Frequency analysis for project type among roofers
Figure 34 shows that a majority of the accidents occurred in PT2 category which
is alterations/rehabilitations, maintenance/repair, demolition and other (58.9%). The
roofing industry, which is mostly dominated by small companies which perform repairs
and maintenance, especially in residential construction. Fredericks et. al. (2005) also
found that roofers who work in small companies (less than 11 employees) were at a
higher risk of falling from the roof.

78
Figure 35: Frequency analysis for project cost among roofers
As seen in Figure 35 most of the accidents occurred in projects costing between
$50,000 and $5 million, but the projects that cost less than $50,000 had almost equal
frequencies. A paper prepared by Construction Industry Research and Policy Center,
University of Tennessee, Knoxville (2011), that was focused on randomly selected 154
fatal accidents occurring between 2005 and 2007, states that 32% of the fatal
construction incidents took place in projects costing less than $50,000. Residential
roofers mostly work on companies that employ less than 10 employees. (Sa, et. al.,
2009). According to BLS 2007, 20% of the roofers are self-employed and they might
have improper or no training on fall safety. All these factors affect roofer safety
negatively.

79
Figure 36: Frequency analysis for fall distance among roofers
Fall distance frequency analysis results are graphed in Figure 36. According to
these results most accidents occurred for fall distances between 10 and 20 feet (FD 2)
followed by fall distances more than 20 feet (FD 3). Analysis done by Chia et. al., (2005)
identified that falls from roofs were more likely to be happening at lower than 20 feet.
The roofers were most likely working on 2-story buildings in residential and light
commercial construction.

80
Figure 37: Frequency analysis for construction operation prompting fall among
roofers Figure 37 shows frequencies for the various construction operations prompting
fall accidents. Here roofing stands out as the dominating construction operation (77.4%)
that leads to an accident.
Figure 38: Frequency analysis for fatality/injury cause among roofers

81
Frequency values for fatality/injury cause are shown as bar graphs in Figure 38.
Fall from roof appears to be the most frequently occurring fatality/injury cause at a level
of 67.5%. Falls from/with ladder, falls from/with scaffolding, bucket, platform and catwalk
also show relatively high frequencies, but significantly below falls from roofs.
Figure 39: Frequency analysis for fall safety protection system provided among roofers
Figure 40: Frequency analysis for fall safety protection system used among
roofers
Fall safety protection system (fall restraint system which prevents falling and fall
arrest system which protects after one falls from higher level by stopping the fall before

82
one hits the surface below) was provided and used as shown in Figures 39 and 40.
These figures indicate that majority of the cases occurred because fall safety system
was not provided or it was provided by the company but was not used by the victim.
Janicak (1998) mentioned in his study that 45% of the accidents occurred when there
was a fall protection system in place, but the victim of the accident was not using it.
Figure 41: Frequency analysis for fall safety training provided among roofers
Figure 41 shows that fall safety training and retraining provisions were in place
in majority of the accidents. This indicates that training provision and effectiveness
should be evaluated.

83
4.3. UNIVARIATE FREQUENCY ANAYSIS OF STEEL WORKERS (1791)
Figure 42: Frequency analysis for degree of injury among steel workers
As seen in Figure 42, the majority of the accidents resulted in fatality (85.7%) for
steel workers.
Figure 43: Frequency analysis for union status among steel workers
Figure 43 indicates that most of the victims were nonunion. In comparison to
roofers which were 90.7% nonunion, steel workers were more unionized.

84
Figure 44: Frequency analysis for age among steel workers
Age information was missing in 335 cases which represent 48% of the steel
worker cases. The univariate analysis performed on the remaining data shows that age
group 2 (50≥ AG 2 >30) is the most accident prone age group as can be seen from
Figure 44. As shown in Figure 29, the age group 2 is also the most accident prone
group for roofers.
Figure 45: Frequency analysis for environmental factors among steel workers

85
Figure 45 displays that unguarded/improperly secured platforms, walkways,
openings, edges and ladders has occurred most frequently (36.4%). This category very
closely followed by the “other” (33.1%). Remaining categories showed less than ten
percent frequency distribution.
Figure 46: Frequency analysis for human factors among steel workers
So far as human factors considered, inappropriate choice/use of equipment
position, material handling and processing is the most frequently occurring human
factors for steel worker accidents, closely followed by misjudgment of hazardous
situation. These are laid out in Figure 46.

86
Figure 47: Frequency analysis for task assignment among steel workers
Figure 47 shows that for steel workers a majority of the falls from elevation
occurred while the victim was working on a regularly assigned task. This is consistent
with the results obtained for roofers.
Figure 48: Frequency analysis for construction end use among steel workers
Construction end use frequencies are graphed in Figure 48, where it is observed
that commercial and residential work had the highest accident frequency among steel
workers.

87
Figure 49: Frequency analysis for project type among steel workers
As seen in Figure 49, most accidents occurred in project type 1, which is new
project or addition. On the other hand, roofer accidents occurred mostly in project type 2
which is alterations/rehabilitations, maintenance/ repair, demolition and other.
Figure 50: Frequency analysis for project cost among steel workers

88
Even though the project cost less than $5 million and more than $50,000 was the
highest cost group for both trades, steel workers also had 30.5% of the accidents
occurring in projects costing over $5 million. It can be explained that steel worker
accidents mostly occur in large size and high rise construction projects. (Figure 50)
Figure 51: Frequency analysis for fall distance among steel workers
Steel workers mostly work on higher elevations compared to roofers; therefore,
as shown in Figure 51, over 20 feet was the most frequent height for fall accidents
occuring among steel workers. Referring back to Figure 36, heights of between 10 feet
to 20 feet were the most critical for roofers.

89
Figure 52: Frequency analysis for construction operation prompting fall among steel
workers
Figure 52 exibits frequencies for the various construction operations prompting
fall accidents among steel workers. Steel erection stands out as the dominating
construction operation (39.1%) that leads to an accident closely followed by exterior
carpentry (36.2%) . Others with relatively significant percentages are installing metal
siding and water proofing and roofing.
Frequency values for fatality/injury cause are bar graphed in Figure 53, where fall
from/with structure other than roof comes out as the most frequently occurring
fatality/injury cause (42.7%). Others with relatively significant percentages are fall from
roof, other, fall from/with ladder and fall from/with scaffold, bucket, platform and catwalk.
As shown in Figure 54 fall safety protection system, was not provided for 55.9 %
of the victims.

90
Figure 53: Frequency analysis for fatality/injury cause among steel workers
Figure 54: Frequency analysis for fall safety protection system provided among steel workers

91
OSHA Part 26, Steel Erection, rule 2645(1) requires that “fall protection for
employees engaged in steel erection activity, when they are exposed to a fall of more
than 15 feet above a lower level”. Fall protection includes guardrail systems, safety net
systems, personal fall arrest systems, positioning device systems, or fall restraint
systems. Also, connectors and workers who are working at the controlled decking zones
are under OSHA Part 26 rule 2646. It states that “person who is doing the connection
job working at the heights more than 30 feet must be provided and use fall protection. At
heights more than 15 feet and up to 30 feet connectors must wear fall protection
equipment with the ability to be tied off, unless guardrail systems or safety net systems
are in place”. (http://www.michigan.gov/documents /cis_wsh_constfact_steel_ erection _
163281_7.htm)
According the citations issued for the 701 cases, 55.9% of the cases did not have
fall safety protection system, or it was not in good working condition, which resulted in
accidents when combined with the other contributing factors. Also, Janicak (1998)
recommended in his research that companies should give adequate training to the
workers on how to properly install, use, test, and inspect fall protection systems in order
to prevent falls properly.
As shown in Figure 55, 57.3% of the steel workers did not use a fall safety
protection system. We noted that only a very small number of the victims (10 cases)
had not used the system even when the system was provided.

92
As seen in Figure 56, 79% of the cases the victim had safety training versus in
21% of the cases the victim had no safety training. This observation raises questions on
the effectiveness of safety training to prevent fall accidents among steel workers.
Figure 55: Frequency analysis for fall safety protection system used among steel workers
Figure 56: Frequency analysis for fall safety training provided among steel workers

93
4.4. SUMMARY OF FINDINGS
4.4.1. WHOLE DATA
• Residential and commercial construction was the highest frequency
construction end use (75.1%).
• Age group 2(50≥AG2>30) is the most accident prone group.
• New project or new addition constitutes a majority (57.3%) of the accidents.
• Project cost group 2 ($50K<PC2≤ $5M) is most accident susceptible.
• Most fall accidents occurred over heights exceeding 20 feet (44.8%). Average
fall distance was 23.77 feet.
• Roofing operation is the most frequently occurring construction activity
prompting fall accidents (54.7%).
• Fall safety protection system was not provided in 61.8% of the cases and not
used in 62.7% cases.
• Fall safety training was provided in 67.2% of the cases.
• A majority of the fall accidents (%79) occurred among nonunion workers.
• Unguarded/improperly secured platforms, walkways, openings, edges and
ladders were the highest frequency environmental factor associated with falls
(32.8%).
• A great majority of the accidents (92.6%) occurred while the victim was
working on a regularly assigned task.

94
• For the human factors, inappropriate choice/use of equipment, position,
material handling, and processing (34.9%) showed the highest frequencies,
closely followed by misjudgment of hazardous situation (33.6%).
• Most accidents occurred for roofers (66.8%).
4.4.2. ROOFERS
• Nonfatal falls accounted for 58% of the roofer accidents.
• The age group between 30 to 50 (Age group 2) is the most accident prone
(56.3%).
• The “other” category which includes pinch point action, catch point /puncture
action, squeeze point action, temperature +/- tolerance level, illumination, and
overpressure/under pressure, (31.5%) has occurred most frequently, closely
followed by the unguarded improperly secured platform, walkways, openings,
edges, ladders (31.1%) as the environmental factor.
• Fall from roof appears most frequently as the event leading to fatality/injury at a
level of 67.5%.
• A majority of the falls among roofers happened while the victim was working on a
regularly assigned task. (91.9%) Commercial and residential end use had the
highest accident frequency (82.6%).
• Most of the accidents occurred in Project type 2 which is
alterations/rehabilitation, maintenance/repair, demolition and other (58.9%) and
in projects costing between $50,000 and $5 million,(48.3%), while the projects
that cost less than $50,000 (45.8%) had almost equal frequencies.

95
• Fall distances between 10 and 20 feet (group 2) (43.7%) followed by fall
distances more than 20 feet (group 3) (39.4%) were the most accident prone
groups.
• Roofing stands out as the dominating construction operation (77.4%) that leads
to a fall accident.
• Majority of the cases occurred because fall safety system was not provided. In
.6% of the cases, even when it was provided by the company, it was not used by
the victim.
• Fall safety training provisions were in place in majority of the accidents (61.4%).
This indicates that training effectiveness should be evaluated.
4.4.3. STEEL WORKERS
• The majority of the accidents resulted in fatality (85.7%) for steel workers.
• Most of the victims were nonunion (55.5%); in comparison to roofers which
were 90.7% nonunion. However a larger percentage of steel workers (44.5%)
were unionized.
• Age group 2 (50≥ 2 >30) is the most accident prone age (60.4%).
• Unguarded/improperly secured platforms, walkways, openings, edges and
ladders is the most frequently occurring environmental factor (36.4%).
• Inappropriate choice/use of equipment position, material handling and
processing (39.8%) is the most frequently occurring human factor for steel

96
worker accidents, closely followed by misjudgment of hazardous situation
(31.2%).
• A majority of the fall from elevation accidents (94.2%)occurred while the steel
worker was working on regularly assigned task.
• Most steel worker falls, (90%) as opposed to roofer falls (41.1%), occurred in
new projects or additions.
• Even though projects costing less than $5 million and more than $50,000 was
the most accident occurring cost group for both trades, steel workers had
30.5% of the accidents occurring in the over $5 million projects compare to
48.3% of the accidents occurring in the less than $50,000 projects in roofers.
• Fall from/with structure other than roof came out as the most frequently
occurring fatality/injury cause (42.7%).
• Fall safety protection system was not provided for 55.9 % of the steel
workers.
• A majority of steel workers (57.3%) did not use a fall safety protection system.
• In a majority of the cases (79%) the victim had safety training while in 21% of
the cases the victim had no safety training. This observation raises questions
on the effectiveness of safety training to prevent fall accidents among steel
workers.
• Fall distance over 20 feet (group #3) was the most accident prone group
(55.8%).

97
4.5. CROSS TABULATION ANALYSIS OF WHOLE DATA
Cross tabulation analysis was performed on the variables previously listed in
Table 7. First, the seven dichotomous independent variables were analyzed, taking the
degree of injury as the dependent variable. The results are given in Table 8. As shown
in this table, p values for chi square hypothesis testing are below 0.05 for union status,
SIC code, project type, fall safety system provided, and fall safety system used,
indicating that they are significant. Phi values (also given in Table 7) indicate the
strength of the relationship between the degree of injury and the variables that are
found to be significant. Also note that there are negative weak relationships; however,
the negative sign can be ignored in interpreting these results.
(http://www.people.vcu.edu /~pdattalo /702SuppRead/MeasAssoc/NominalAssoc.html).
According to the convention adopted in this research, all but one of the
relationships is weak. The relationship between the degree of injury and SIC code has
moderate strength. The odds ratio values given in Table 7 are discussed below with
respect to each of the variables in Tables 8 through 14.
Table 7: Cross tabs with degree of injury vs. independent dichotomous variables Independent variable Chi
Square Value
Df. Significance (p)
Phi or Cramer’s V
Odds ratio
Union status 76.151 1 .000 .190 2.77 SIC code (1791 vs. 1761)
364.061 1 .000 .415 8.52
Task assignment 1.721 1 .190 - - Project type 25.461 1 .000 -.110 1.56 Fall safety protection system provided
4.382 1 .036 -.046 1.22
Fall safety protection system used
6.659 1 .010 -.056 1.27
Safety training provided .920 1 .338 - -

98
It is observed from Table 8 that among 2114 cases, nonunion worker fatalities
are 72.2 % compared to union fatalities of 27.8%. The chi square significance is less
than 0.05; hence there is a significant relationship between the degree of injury and
union status and based on phi, this relationship is a weak one. The odds ratio value
given in Table 7 indicate that if a worker was unionized the odds of fatality is 2.77 times
higher than if a worker is nonunionized.
Table 8: Degree of injury vs. union status Union status Nonfatal Fatal Total
1.Union 112 (12.2%)
332 (27.8%)
444
0.Nonunion 807 (87.8%)
863 (72.2%)
1670
Total 919 1195 2114
As observed in Table 9, among the 2114 falls from elevation cases, 1413
(66.8%) are roofers and 701 (33.2%) are steel workers. For the roofers, 42% of the
cases have resulted in a fatality and 58% are nonfatal. For steel workers, 85.7% of the
cases turned out fatal, and 14.3% turned out nonfatal. Although only 1/3 (33.2%) of the
total fall accidents involved steel workers, most of these resulted in fatalities (85.7%) in
comparison to 42% of roofer accidents ending up fatal. The phi value in Table 7 shows
a moderate significant relationship between the degree of injury and SIC code. Further,
the odds ratio shown in Table 7 reveals that being a steel worker increases the odds of
fatality 8.52 times compared to roofers.
Table 9: Degree of injury vs. SIC Code SIC code Nonfatal Fatal Total
1761 (roofers) 819 (58%)
594 (42%)
1413
1791 (steel workers) 100 (14.3%)
601 (85.7%)
701
Total 919 1195 2114

99
Results given in Table 10 show that 92% of the fatal accidents involve the
workers who worked on a regularly assigned task. In contrast, 8% of the fatalities
occurred in non-regularly assigned tasks. A report, based upon OSHA-inspected fatal
events in construction during calendar 2003 was conducted by Construction Industry
Research and Policy Center University of Tennessee, Knoxville for Office of Statistics
OSHA, U.S. Department of Labor (Construction Industry and research policy center,
University of Tennessee, Knoxville, OSHA’s Office of statistics, 2003), states that 72.3%
of the time the victim was on the regular task site when the accident occurred, which
supports this research finding. Fatal and nonfatal accidents happen more frequently on
regularly assigned tasks. As seen in Table 7 that the relationship between the degree of
injury and the task assignment is not significant.
Table 10: Degree of injury vs. task assignment Task assignment Nonfatal Fatal Total 1.Regular 859
(93.5%) 1099 (92%)
1958
0. Nonregular 60 (6.5%)
96 (8%)
156
Total 919 1195 2114
As seen from the cross tabulation results of Table 11, fatalities mostly occur
(62.1%) in project type 1 which is new construction or addition, in comparison to project
type 2 which is alteration/rehabilitation, maintenance/repair, demolition and other
(37.9%). The odds ratio in Table 7 shows that, working on a new project or addition
increases the odds of fatality among steel workers and roofers by 1.56 times.

100
Table 11: Degree of injury vs. project type Project type Nonfatal Fatal Total
PT1: New project or new addition 470 (51.1%)
742 (62.1%)
1212
PT2: Alteration/rehabilitation, maintenance/repair, demolition and other
449 (48.9%)
453 (37.9)
902
Total 919 1195 2114
As it shown in Table 12, most of the fatal accidents occurred while fall safety
protection system was absent (63.8%). Pearson chi square significance is “.036”, hence
there is a significant relationship between fall safety protection system provision and
degree of injury. The phi value of -.046 means there is a weak negative relationship. As
shown in Table 7, the odds ratio indicates that when the fall safety protection system is
not provided, the odds of fatality is 1.22 times higher compared to safety protection
system provided.
Table 12: Degree of injury vs. fall safety protection system provided
Fall safety protection system provided Nonfatal Fatal Total
Not provided 545 (59.3%)
762 (63.8%)
1307
Provided 374 (40.7%)
433 (36.2%)
807
Total 919 1195 2114
As shown in Table 13, workers who have not used the safety protective system
even when provided account for 65.1% of the fatalities. There is a significant
relationship between fall safety system used and the degree of injury and a phi value of
-.056 means a weak negative relationship. The odds ratio shown in Table 7 indicates
that if a worker is not using safety protection system, the odds of fatality is 1.27 times
higher compared to when safety protection system is used.

101
Table 13: Degree of injury vs. fall safety protection system used
Fall safety protection system used Nonfatal Fatal Total Not used 548
(59.6%) 778
(65.1%) 1326
Used 371 (40.4%)
417 (34.9%)
788
Total 919 1195 2114
It is observed in Table 14 that 66.4% of the fatal cases occurred with fall safety
training provided. As seen in Table 7 that there is not a significant relationship between
the degree of injury and safety training provision.
Table 14: Degree of injury vs. safety training provided
Safety training provided Nonfatal Fatal Total Not provided 291
(31.7%) 402
(33.6%) 693
Provided 628 (68.3%)
793 (66.4%)
1421
Total 919 1195 2114
After the seven dichotomous variables were analyzed, the seven multi-valued
variables were analyzed. The results are given in Table 15. As shown, the chi square
significance values are below 0.05 for construction end use, project cost, fall distance,
construction operation prompting fall, fatality/injury cause, environmental factors, and
human factors.

102
Table 15: Cross tabs with degree of injury vs. independent multi- valued variables
Independent variables Chi Square Value
df Significance (p)
Phi or Cramer’s V
Construction end use 76.294 3 .000 .190
Project cost 46.326 2 .000 .148
Fall distance 145.512 2 .000 .262
Construction operation
prompting fall
235.820 5 .000 .334
Fatality /injury cause 133.369 6 .000 .251
Environmental Factors 69.524 8 .000 .181
Human factors 21.633 6 .001 .101
As seen in Table 16, there were more than 50% (1155) of the cases which had
no age information. It should also be noted that there are no nonfatal accident cases
observed among the 959 cases; therefore, the cross tab analysis for age is not included
in Table 15.
Among age groups, group 2 (30<AG2 ≤50) was the highest fatality occurring
group, which agrees with the findings of Huang and Hinze (2003).
Table 16: Degree of injury vs. age Age Group Nonfatal Fatal
AG 1 ≤30 0 274 (28.5%)
30<AG 2 ≤50 0 555 (57.9%)
AG 3>50 0 130 (13.6%)
Total 0 959
Results of the cross tab analysis given in Table 17 show that commercial and
residential end use is the most frequently occurring fatal accident group. Also, this end
use group has the highest nonfatal accident occurrence. Going back to Table 15, the

103
Pearson chi square value is “.000”, hence there is a significant relationship between the
degree of injury and the construction end use. The phi value of .190 means a weak
relationship.
Table 17: Degree of injury vs. construction end use Construction end use Nonfatal Fatal Total
1: Commercial & residential 770 (83.8%)
818 (68.5%)
1588
2: Industrial 24 (2.6%)
90 (7.5%)
114
3: Heavy civil 9 (1.0%)
54 (4.5%)
63
4: Other 116 (12.6%)
233 (19.5%)
349
Total 919 1195 2114
According to Table 18, 53.9 % of the fatal accidents occur with the project cost
group of 2 ($50K< PC 2≤ $5M). As it indicated in Table 15, Pearson chi square is “.000”,
hence there is a significant relationship between the project cost and the degree of
injury, and a phi value of .148 means a weak relationship.
Table 18: Degree of injury vs. project cost Project cost Nonfatal Fatal Total PC 1 ≤$50K 362
(39.4%) 339
(28.4%) 701
$50K<PC 2≤$5M 472 (51.4%)
644 (53.9%)
1116
PC 3>$5M 85 (9.2%)
212 (17.7%)
297
Total 919 1195 2114
As seen in Table 19, the fall distance of 20 feet and higher is the most fatality
prone height (55.8%). Table 15 shows that Pearson chi square is “.000”, hence there is
a significant relationship between the fall distance and the degree of injury. A phi value
of .262 means there is a weak relationship.

104
Table 19: Degree of injury vs. fall distance Fall distance Nonfatal Fatal Total
FD 1 ≤10’ 182 (19.8%)
105 (8.8%)
287
10 <FD 2 ≤ 20’ 456 (49.6%)
423 (35.4%)
879
FD 3 >20’
281 (30.6%)
667 (55.8%)
948
Total 919 1195 2114
Table 20 shows that roofing is the highest fatality prone construction operation
prompting a fall (43.7%), followed by structural steel erection (19.9%). Again, Table 15
indicates that Pearson chi square is “.000”, so there is a significant relationship between
the construction operation prompting fall and the degree of injury. In this case, a phi
value of .332 denotes a moderate relationship.
Table 20: Degree of injury vs. construction operation prompting fall Construction operation prompting fall Nonfatal Fatal Total
1: Roofing 634 (69.0%)
522 (43.7%)
1156
2: Exterior carpentry 34 (3.7%)
230 (19.2%)
264
3:Specific steel functions including decking 60 (6.5%)
29 (2.4%)
89
4: Other 29 (3.2%)
32 (2.7%)
61
5: Erecting structural steel 73 (7.9%)
238 (19.9%)
311
6: Installing metal siding & water proofing 89 (9.7%)
144 (12.1%)
233
Total 919 1195 2114
As seen in Table 21, fall from the roof is the most frequently occurring fatality
causing action (50.2%), followed by fall from/with structure other than roof action
(22.9%). According to Table 15, Pearson chi square is “.000”, hence there is a
significant relationship between the fatality/injury cause and the degree of injury. A phi
value of .251 indicates a weak relationship.

105
Table 21: Degree of injury vs. fatality /injury cause Fatality /injury cause Nonfatal Fatal Total
1: Collapse of structure 27 (2.9%)
16 (1.3%)
43
2: Fall from /with ladder 129 (14%)
106 (8.9%)
235
3: Fall from roof 536 (58.3%)
600 (50.2%)
1136
4: Fall from / with scaffold, bucket and platform catwalk (attached to the structure)
112 (12.2%)
84 (7.0%)
196
5: Fall through opening 17 (1.8%)
39 (3.3%)
56
6: Fall from /with structure other than roof 65 (7.1%)
274 (22.9%)
339
7: Other 33 (3.6%)
76 (6.4%)
109
Total 919 1195 2114
As shown in Table 22, unguarded/improperly secured platforms, walkways,
openings, edges, ladders (38%) are the most fatal category, followed by the “other”
category (31.7%). According to Table 15, a weak significant relationship is found
between the degree of injury and the environmental factor.
Table 22: Degree of injury vs. environmental factors Environmental Factors Nonfatal Fatal Total
1: Hazardous work surface/housekeeping problems
113 (12.3%)
102 (8.5%)
215
2: Structural failure (other than full collapse) 129 (14%)
75 (6.3%)
204
3: Unguarded/ improperly secured platforms, walkways, openings, edges, ladders
240 (26.1%)
454 (38%)
694
4: Moving flying or falling object 45 (4.9%)
61 (5.1%)
106
5:Wind and other weather related factors 20 (2.2%)
22 (1.8%)
42
6:Materials handling and equipment 55 (6.0%)
57 (4.8%)
112
7: Other 298 (32.4%)
379 (31.7%)
677
8: Chemical and radiation action 0 (0%)
2 (0.2%)
2
9: Miss. Issues of WS/FLC 19 (2.1%)
43 (3.6%)
62
Total 919 1195 2114

106
Table 23 shows that inappropriate choice/use of equipment, position, material
handling, processing is the highest occurring human factor that affects fatal accidents
(38.2%), followed by misjudgment of hazardous situation (33.1%). As seen in Table 15,
Pearson chi square significance is “.001”, hence there is a significant relationship
between the human factors and the degree of injury; and a phi value of .101 indicates a
weak relationship.
Table 23: Degree of injury vs. human factors Human factors Nonfatal Fatal Total
1: Misjudgment of hazardous situation 315 (34.3%)
395 (33.1%)
710
2: Malfunctioning safety equipment/system (including lockout/logout tag out)
75 (8.2%)
66 (5.5%)
141
3: Distracting actions by others 5 (0.5%)
6 (0.5%)
11
4: Human system malfunction 28 (3.0%)
18 (1.5%)
46
5: Inappropriate choice/use of equipment, position, material handling, processing
281 (30.6%)
456 (38.2%)
737
6: Insufficient engineering and administrative controls
53 (5.8%)
71 (5.9%)
124
7: Others 162 (17.6%)
183 (15.3%)
345
Total 919 1195 2114
4.5.1. LAYERED CROSS TABULATION OF SELECTED VARIABLES
First, layered cross tabulation analysis was performed to examine if safety
training and union status had any collective effect on fatality. Second, SIC codes’ and
union status’ collective effect was determined.
As seen in Table 24, there are 1195 fatalities to be analyzed. Among them 793
fatal accidents occurred even though victims received safety training, and 402 victims

107
did not receive safety training. Union workers who did not have safety training (57/85) or
(67.1%) died from the fall accidents which indicate a relation between safety training
and fatality. Among the nonunion workers there is not a big difference in terms of the
percentage between fatal and nonfatal accidents. On the other hand, among the union
workers, who did have safety training, fatal accidents are much more frequent than
nonfatal ones (76.6% vs. 23.4%). For nonunion workers, who did have safety training
there was no significant difference in the numbers of fatal and nonfatal cases. The
percentages given in Table 24 are derived by dividing the number in each cell by the
total number shown in the rightmost column.
Table 24: Degree of injury vs. union status vs. safety training provided Union status Nonfatal Fatal Total
No fall safety training provided
Union
28 (33%)
57 (67%)
85
Nonunion 263 (43%)
345 (57%)
608
Total 291 402 693 Fall safety training
provided Union 84
(23%) 275
(77%) 359
Nonunion 544 (51%)
518 (49%)
1062
Total 628 793 1696
As shown in Table 25, in considering fatalities, out of 1195 deaths, 594 cases
involve roofers and 601 are for steel workers. Of these total fatalities, only 332 (27.8%)
are union workers and 72.2% are nonunion. There are a total of 1413 roofers and 594
of them had fatal accidents. Only 55 of the union roofing workers (9.3%) fell victim to
fatal accidents, in comparison to 539 (90.7%) nonunion workers. There are a total 701
steel workers, and 601 of them experienced fatality. Only 277 of them (46.1%) were
union workers, and 324 (53.9%) were nonunion workers. Nonunion roofers’ fatalities
add up to 45.1% of the total fall accident deaths. The percentages given in Table 25 are

108
computed by dividing the number in each cell by the total number shown immediately
below that number.
The layered cross tab analysis results show that this is a useful technique for
extracting detailed and useful relationship information out of the data that goes beyond
the regular cross tab analysis.
Table 25: Degree of injury vs. Union status vs. SIC codes Union status Nonfatal Fatal Total
SIC 1761 Union 77 (9.4%)
55 (9.3%)
132
Nonunion 742 (90.6%)
539 (90.7%)
1281
Total 819 594 1413 SIC 1791 Union 35
(35%) 277
(45.4%) 312
Nonunion 65 (65%)
324 (54.6%)
389
Total 100 610 701
4.6. CROSS TABULATION OF ROOFER ACCIDENTS (SIC 1761)
Cross tabulation analysis for roofers was performed first on the dichotomous
variables shown in Table 26. As seen in this table, chi square significance values are
below 0.05 for task assignment, project type, fall safety protection system provided, fall
safety system used, and safety training provided. Phi values as before indicate the
strength of the relationship between the degree of injury and the variables that are
found to be significant. According to the convention adopted in this research, all of the
relationships are weak.

109
Table 26: Cross tabs with degree of injury vs. independent dichotomous variables for roofers
Independent variables
Chi Square Value
df Significance (p)
Phi or Cramer’s V
Odds ratio
Union status .008 1 .928 - - Task assignment 5.278 1 .022 .061 1.56 Project type 15.757 1 .000 .106 1.54 Fall safety protection system provided
23.916 1 .000 -.130 1.76
Fall safety protection system used
27.831 1 .000 -.140 1.85
Safety training provided
28.782 1 .000 -.143 1.82
It is observed in Table 27 for roofer fatalities that 90.7% of them occurred when
the victim was a nonunion member. However, there exists no significant relationship
between the degree of injury and the union status (See significance >.05 in Table 26).
Table 27: Degree of injury vs. union status for roofers Union status Nonfatal Fatal Total
Nonunion 742 (90.6%)
539 (90.7%)
1281
Union 77 (9.4%)
55 (9.3%)
132
Total 819 594 1413
As indicated in Table 28, 89.9% of the fatal cases occurred while victims were
working on a regularly assigned task. The odds of fatality for roofers when they worked
on nonregularly assigned task is 1.56 times higher than the workers who worked on
regularly assigned task. The chi square test results in Table 26 shows that there is a
significant relationship between the degree of injury and task assignment regularity for
the roofers and the level of the strength of this relationship is weak (.061).

110
Table 28: Degree of injury vs. task assignment for roofers
As shown in Table 29, 65% of the roofers died while performing alteration/
rehabilitation, maintenance/repair, demolition and other project types. Chi square test
results in Table 26 shows that there is a significant relationship between the degree of
injury and the project type for roofers, and level of strength of this relationship is weak.
The odds of fatality when a worker works on project type 2 is 1.54 times higher than the
worker works on project type 1 for roofers.
Table 29: Degree of injury vs. project type for roofers Project type Nonfatal Fatal Total PT1: New project or new addition
373 (45.5%)
208 (35%)
581
PT2: Alteration/rehabilitation, maintenance/ repair, demolition and other
446 (54.5%)
386 (65%)
902
Total 819 594 1413
As seen in Table 30, 72.1% of the fatal cases among roofers occurred when fall
protection system is not provided. Chi square test (Table 26) shows that there is a
significant relationship between the degree of injury and fall safety system provision for
roofers, and the level of strength of this relationship is weak and negative. For roofers,
the odds of fatality when the fall protection system is not provided is 1.76 times higher
than when the fall protection system is provided (Table 26).
Task Nonfatal Fatal Total Regular 764
(93.3%) 534
(89.9%) 1298
Nonregular 55 (6.7%)
60 (10.1%)
115
Total 819 594 1413

111
Table 30: Degree of injury vs. fall safety protection system provided for roofers
Fall safety protection system Nonfatal Fatal Total Not provided 487 428
(72.1%) 915
Provided 332 166 (27.9%)
498
Total 819 594 1413
According to the cross tab analysis displayed in Table 31, 73.2% of the fatal
cases for roofers occurred while a fall protection system was not used. While in 72.1%
of the fatal cases fall safety protection was absent, only 1.1% of the victims had chosen
not to use the protective system. The chi square test shows that there is a significant
relationship between the degree of injury and fall safety system usage for roofers, and
level of strength of this relationship is weak, and negative (-.140). The odds of fatality
when the fall protection system is not used is 1.85 times higher than when the fall
protection system is used (Table 26).
Table 31: Degree of injury vs. fall safety protection system used for roofers
Fall safety protection system used Nonfatal Fatal Total
Not used 489 435 (73.2%)
924
Used 330 159 (26.8%)
489
Total 819 594 1413
Among the roofers, most fatalities occurred even the victim had received safety
training (Table 32). The chi square test result shown in Table 26 indicates that there is a
significant relationship between the degree of injury and fall safety training for roofers
and the level of strength of this relationship is negative weak (-.143). The odds of fatality
when the fall safety training is not provided is 1.82 times higher than when the fall safety
training is used for roofers (Table 26).

112
The odds ratio reveals that if the fall safety training is not provided, the odds of
fatality is increased by 1.82 for roofers.
Table 32: Degree of injury vs. fall safety training provided for roofer Safety training provided Nonfatal Fatal Total
Not provided 268 (32.7%)
278 (46.8%)
546
Provided 551 (67.3%)
316 (53.2%)
867
Total 819 594 1413
Cross tabulation analysis for roofers was performed separately for the multi-
valued categorical variables, and the results are shown in Table 33. As seen in this
table, chi square values are below 0.05 for construction end use, fall distance,
fatality/injury cause, environmental factors, and human factors. Further, the phi values
gauge the strength of the relationship between the degree of injury and the variables
found to be significant. According to the convention adopted in this research, all of the
relationships are weak.
As seen in Table 34, there were 820 of the cases which had no age information.
It should also be noted that there are no nonfatal accident cases observed among the
593 cases; therefore, the cross tab analysis for age is not included in Table 33.
Table 33: Cross tabs with degreee of injury vs. multi – valued categorical variables for roofers
Independent variables
Chi Square Value
df Significance (p)
Phi or Cramer’s V
Construction end use 37.707 3 .000 .163 Project cost 3.437 2 1.79 - Fall distance 105.607 2 .000 .273 Construction operation prompting fall
9.284 5 .098 -
Fatality/injury cause 40.625 6 .000 .170 Environmental factors 59.547 8 .000 .205 Human factors 21.633 6 .001 .101

113
As seen in Table 34, all of the victims for whom the age is known had fatal
accidents. Among them, the age group 2 (between 30 and 50 years of age) was the
most fatality prone age group.
Table 34: Degree of injury vs. age for roofers Age Nonfatal Fatal
AG 1 ≤30 0 182 (30.7%)
30<AG 2 ≤50 0 334 (56.3%)
AG 3>50 0 77 (13.0%)
Total 0 593
According to Table 35, roofer fatalities for commercial and residential
construction end use is the highest (76.1%). As mentioned in our univariate frequency
analysis discussion, the OSHA standard 03-00-001 prior to December 16, 2010,
allowed employers to use alternative methods of fall protection that were specified to
them rather than conventional fall protection required by the standard. This new
directive which took effect on December 16 2010 enforces that all residential
construction employers must now comply with 29 Code of Federal Regulations
1926.501(b) (13). This is expected to provide for better fall protection to construction
workers, especially residential roofers. Referring to Table 33, the chi square significance
values confirms that there is a significant relationship between the degree of injury and
construction end use for roofers, and level of strength of this relationship is weak.

114
Table 35: Degree of injury vs. construction end use for roofers
Construction end use Nonfatal Fatal Total 1: Commercial & residential 715
(87.3%) 452
(76.1%) 1167
2: Industrial 16 (2.0%)
41 (6.9%)
57
3: Heavy civil 1 (0.1%)
4 (0.7%)
5
4: Other 87 (10.6%)
97 (16.3%)
184
Total 819 594 1413
As shown in Table 36, the project cost group 1 (≤50K) is the highest fatality
frequency category (48.7%), closely followed by project cost group 2 (between $50,000
and $5 million) with frequency of 45.6%. The chi square result in Table 33 shows that
there is not a significant relationship between the degree of injury and the project cost
for roofers (p>.05).
Table 36: Degree of injury vs. project cost for roofers Project cost Nonfatal Fatal Total
PC 1 ≤50K 358
(43.7%)
289
(48.7%)
647
50K<PC 2<5M 412
(50.3%)
271
(45.6%)
683
PC 3≥5M 49
(6%)
34
(5.7%)
83
Total 819 594 1413
It is seen in Table 37 that among the roofers a fall distance of more than 20 feet
is the highest fatality prone category (54.7%). Going back to Table 33, the chi square
test shows that there is a significant relationship between the degree of injury and the
fall distance for roofers. In addition, the level of strength of this relationship is weak.

115
Table 37: Degree of injury vs. fall distance for roofers Fall distance Nonfatal Fatal Total
FD 1 ≤10’ 178 (22%)
60 (10.1%)
238
10 <FD 2 ≤ 20’ 409 (50%)
209 (35.2%)
618
FD 3 >20’
232 (28%)
325 (54.7%)
557
Total 819 594 1413
As noted in Table 38, roofing is the most frequently occurring construction
operation (79%) that prompts fall fatalities among the roofers. Again from Table 33, the
chi square test shows that there is no significant relationship between the degree of
injury and the construction operation prompting fall for roofers.
Table 38: Degree of injury vs. construction operation prompting fall for roofers Construction operation prompting fall Nonfatal Fatal Total
1: Roofing 624 (76%)
470 (79%)
1094
2:Exterior carpentry 4 (.6%)
6 (1%)
10
3:Specific steel functions including decking 60 (7.4%)
23 (4%)
83
4: Others 28 (3.4%)
24 (4%)
52
5: Erecting structural steel 21 (2.6%)
16 (3%)
37
6: Installing metal siding & water proofing 82 (10%)
55 (9%)
137
Total 819 594 1413
According to Table 39, 74.4% of the fatal cases are caused by falling from the
roof. Also, the chi square test shows that there is a significant relationship between the
degree of injury and fatality/injury causes for roofers, and the level of strength of this
relationship is weak.

116
Table 39: Degree of injury vs. fatality / injury cause for roofers
Fatality /injury cause Nonfatal Fatal Total
1: Collapse of structure 20
(2.4%)
3
(0.4%)
23
2: Fall from /with ladder 117
(14.3%)
61
(10.3%)
178
3: Fall from roof 512
(62.6%)
442
(74.4%)
954
4: Fall from / with scaffold, bucket and
platform catwalk (attached to the structure)
109
(13.3%)
41
(6.9%)
150
5: Fall through opening 14
(1.7%)
20
(3.4%)
34
6: Fall from /with structure other than roof 29
(3.5%)
11
(1.9%)
40
7: Other 18
(2.2%)
16
(2.7%)
34
Total 819 594 1413
Looking at Table 40, among roofers, unguarded/improperly secured platforms,
walkways, openings, edges, ladders collectively represent the highest fatality rate
(38.2%) among the environmental factors, followed by “other” (30.8%). The chi square
test result shown in Table 33 again tells us that there is a significant relationship
between the degree of injury and environmental factors for roofers, while the level of the
strength of this relationship is weak.

117
Table 40: Degree of injury vs. environmental factors for roofers
Environmental factors Nonfatal Fatal Total
1:Hazardous work surface / housekeeping problems 107
(13.1%)
63
(10.6%)
170
2: Structural failure ( other than full collapse) 119
(14.5%)
39
(6.6%)
158
3:Unguarded/ improperly secured platforms, walkways,
openings, edges, ladders
212
(25.9%)
227
(38.2%)
439
4:Moving flying or Falling object 35
(4.3%)
10
(1.7%)
45
5:Wind and other Weather related factors 19
(2.3%)
12
(2.0%)
31
6:Materials handling And equipment 48
(5.9%)
27
(4.5%)
75
7. Other 262
(32%)
183
(30.8%)
445
8: Chemical and radiation action 0
(0%)
2
(0.3%)
2
9: Miss. Issues of WS/FLC 17
(2.1%)
31
(5.2%)
48
Total 819 594 1413
As shown in cross tabulation Table 41 for human factors inappropriate
choice/use of equipment, position, and material handling, and processing come out as
the highest fatality frequency category (36%), followed by misjudgment of hazardous
situation (34.7%), among the roofers. The chi square test results shown In Table 33
again tells us that there is a significant relationship between the degree of injury and
human factors for roofers (1761). The level of strength of this relationship is weak.

118
Table 41: Degree of injury vs. human factors for roofers
Human factors Nonfatal Fatal Total 1: Misjudgment of hazardous situation 285
(34.8%) 206
(34.7%) 491
2: Malfunctioning safety equipment/system (including lockout /logout tag out)
69 (8.4%)
36 (6.1%)
105
3: Distracting actions by others 5 (0.6%)
1 (0.2%)
6
4: Human system malfunction 28 (3.4%)
7 (1.2%)
35
5: Inappropriate choice /use of equipment, position, material handling, processing
244 (29.8%)
214 (36%)
458
6: Insufficient engineering and administrative controls
42 (5.1%)
49 (8.2%)
91
7: Other 146 (17.8%)
81 (13.6%)
227
Total 819 594 1413
4.7. CROSS TABULATION ANALYSIS OF STEEL WORKERS (SIC 1791)
Cross tabulation analysis for steel workers was performed following a similar
approach for the one for roofers. Results for the dichotomous variables are presented in
Table 42. As seen in this table, chi square values are below 0.05 for only union status
and project type. Furthermore, the phi values for all of the relationships indicated weak
levels.
Table 42: Cross Tabs with degree of injury vs. independent dichotomous variables for steel workers
Independent variable Chi Square Value
df Significance (p)
Phi or Cramer’s V
Odds ratio
Union status 4.269 1 .039 .078 1.58 Task assignment .153 1 .696 - - Project type 6.333 1 .012 .095 4.17 Fall safety protection system provided
.205 1 .651 - -
Fall safety protection system used .130 1 .718 - - Safety training provided .291 1 .59 - -

119
Table 43 shows that among the steel workers, 53.9% experienced fatal accidents
if they are nonunion category. Chi square test results shown in Table 42 shows that
there is a significant relationship between the degree of injury and the union status for
steel workers and level of strength of this relationship is weak. For steel workers, the
odds of fatality when the steel worker is unionized is 1.58 times higher than when the
steel worker is not unionized.
This may be considered anomalous, and hence may call for further investigation.
Table 43: Degree of injury vs. union status for steel workers
Union status Nonfatal Fatal Total Union 35
(35%) 277
(46.1%) 312
Nonunion 65 (65%)
324 (53.9%)
389
Total 100 601 701
The cross tabulation results shown in Table 44 indicate that 94% of the fatal
cases occurred while victims are working on regularly assigned tasks. Chi square test
results in Table 42 reveal that there is not a significant relationship between the degree
of injury and task assignment regularity for steel workers (p>.05).
Table 44: Degree of injury vs. task assignment for steel workers
Task assignment Nonfatal Fatal Total Regular 95
(95%) 565
(94%) 660
Non regular 5 (5%)
36 (10.1%)
41
Total 100 601 701
As observed from the cross tabulation in Table 45, fatalities of steel workers most
frequently occur at new construction or additions (88.9%) in comparison to
alteration/rehabilitations, maintenance/repair, demolition and other (11.1%). For steel

120
workers, the odds of fatality when a steel worker is working on project type 2 is 4.17
times higher than the odds of fatality for workers who work on project type 1.
Pearson chi square is “.000”; hence there is a significant relationship between
the project type and the degree of injury. But, phi value is .095 so there is a weak
relationship.
Table 45: Degree of injury vs. project type for steel workers
Project type Nonfatal Fatal Total PT 1: New project or new addition 97
(97%) 534
(88.9%) 631
PT2: Alteration/rehabilitation, maintenance/ repair, demolition and other
3 (3%)
67 (11.1%)
70
Total 100 601 701
Table 46 reveals that 55.6% of the fatal cases among steel workers occurred
when a fall protection system is not provided. Further, chi square test shows that there
is not a significant relationship between the degree of injury and the provision of a fall
safety system for steel workers.
Table 46: Degree of injury vs. fall safety protection system provided for steel workers
Fall safety protection system Nonfatal Fatal Total
Not provided 58
(58%)
334
(55.6%)
392
Provided 42
(42%)
267
(44.4%)
309
Total 100 601 701
According to Table 47, 57.1% of the fatal cases among steel workers occurred
when fall protection system is not used. Since 55.6% of the fatal cases are the ones for
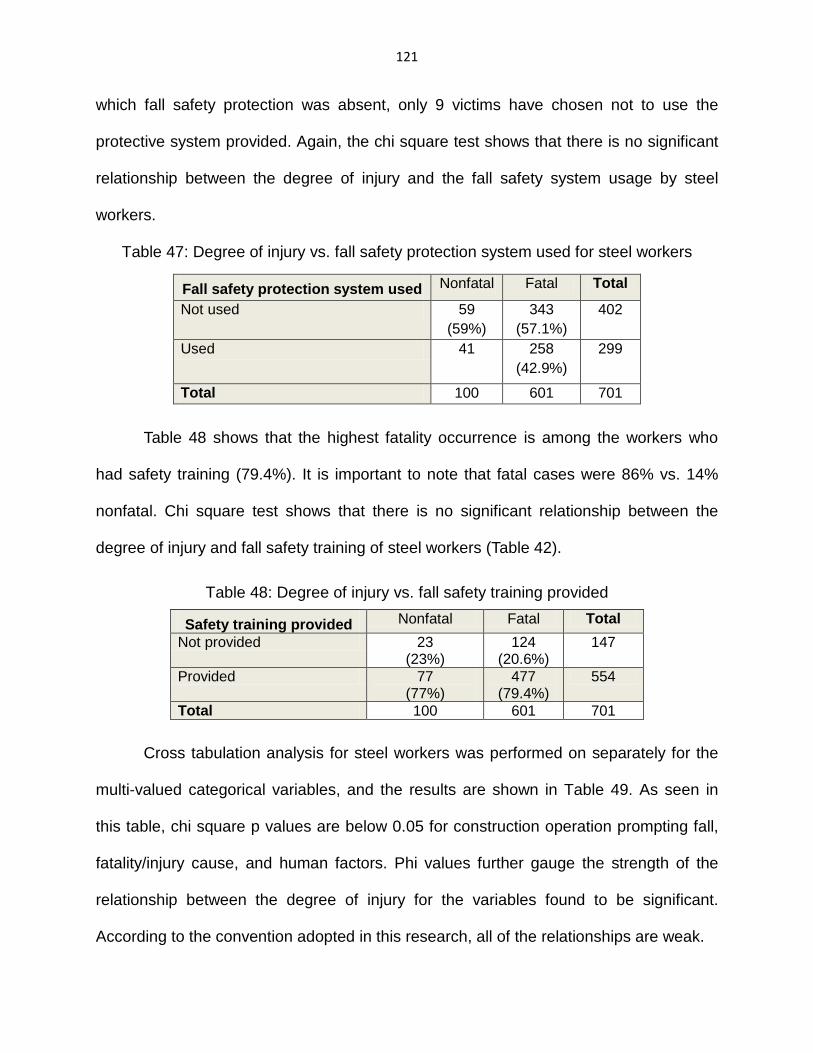
121
which fall safety protection was absent, only 9 victims have chosen not to use the
protective system provided. Again, the chi square test shows that there is no significant
relationship between the degree of injury and the fall safety system usage by steel
workers.
Table 47: Degree of injury vs. fall safety protection system used for steel workers
Fall safety protection system used Nonfatal Fatal Total
Not used 59 (59%)
343 (57.1%)
402
Used 41 258 (42.9%)
299
Total 100 601 701
Table 48 shows that the highest fatality occurrence is among the workers who
had safety training (79.4%). It is important to note that fatal cases were 86% vs. 14%
nonfatal. Chi square test shows that there is no significant relationship between the
degree of injury and fall safety training of steel workers (Table 42).
Table 48: Degree of injury vs. fall safety training provided
Safety training provided Nonfatal Fatal Total Not provided 23
(23%) 124
(20.6%) 147
Provided 77 (77%)
477 (79.4%)
554
Total 100 601 701
Cross tabulation analysis for steel workers was performed on separately for the
multi-valued categorical variables, and the results are shown in Table 49. As seen in
this table, chi square p values are below 0.05 for construction operation prompting fall,
fatality/injury cause, and human factors. Phi values further gauge the strength of the
relationship between the degree of injury for the variables found to be significant.
According to the convention adopted in this research, all of the relationships are weak.

122
Steel worker age information was missing in 335 cases and all of the known
cases were resulted fatal; hence age category is not included in Table 49. The
frequencies of the age groups are shown in Table 50.
Table 49: Cross Tabs with degreeeof injury vs. independent multi – valued categorical
variables for steel workers Independent variable
Chi Square Value
df Significance (p)
Phi or Cramer’s V
Construction end use 1.988 3 .575 - Project cost 3.28 2 1.94 - Fall distance 5.441 2 .066 - Construction operation prompting fall
11.292 5 .046 .127
Fatality/injury cause 14.84 6 .022 .145 Environmental factors 5.802 7 .563 - Human factors 12.978 6 .043 .136
As seen in Table 50, among the 701 steel worker accidents only 366 cases have
age information. All known cases were fatal. The age group 2 (between 30 and 50)
came out to be the most fatality prone group among the steel workers (60.4%).
Table 50: Degree of injury vs. age for steel workers Age Nonfatal Fatal
AG 1 ≤30 0 92 (25.1%)
30<AG 3 ≤50 0 221 (60.4%)
AG 3>50 0 53 (14.5%)
Total 0 366
According to Table 51, steel worker fatalities for commercial and residential
construction end use is the highest (60.9%). Referring to Table 49 the chi square values
confirm that there is not a significant relationship between the degree of injury and the
construction end use for steel workers (p>.05).

123
Table 51: Degree of injury vs. construction end use for steel workers
As shown in Table 52, the project cost group 2 (between $50,000 and $5 million)
is the highest fatality frequency category followed by cost group 3 (more than $5
million). As opposed to roofer accidents, which mostly occurred in cost groups 2 and 1
(less than $50,000), steel worker fatalities mostly occurs in cost group 2 and 3 which
suggests that steel workers mostly work in higher budgeted construction projects. The
chi square test result in Table 49 shows that there is not a significant relationship
between the degree of injury and the project cost of steel workers (p>.05) .
Table 52: Degree of injury vs. project cost for steel workers
Project cost Nonfatal Fatal Total PC 1 ≤50K 4 50
(8.3%) 54
50K<PC 2<5M 60 373 (62.1%)
433
PC 3≥5M 36 178 (29.6%)
214
Total 100 601 701
It is seen in Table 53 that among the steel workers, a fall distance of more than
20 feet is the highest fatality category (56.9%). It is a common fact that steel workers
mostly work at high elevations. Going back to Table 49 the chi square test shows that
Construction end use Nonfatal Fatal Total CEG1: Commercial & residential
55 (55%)
366 (60.9%)
421
2: Industrial 8 (8%)
49 57
3: Heavy civil 8 (8%)
50 58
4: Other 29 (29%)
136 (22.6%)
165
Total 100 601 701

124
there is not a significant relationship between the degree of injury and the fall distance
of steel workers (p>.05).
Table 53: Degree of injury vs. fall distance for steel workers
Fall distance Nonfatal Fatal Total FD 1 ≤10’ 4
(4%) 45
(7.5%) 49
10 <FD 2 ≤ 20’ 47 (47%)
214 (35.6%)
261
FD 3 >20’
49 (49%)
342 (56.9%)
391
Total 100 601 701
As noted in Table 54, exterior carpentry is the most frequently occurring
construction operation that prompts fall fatalities (37.3%), closely followed by erecting
structural steel (36.9%). Again from the chi square test shown in the Table 49, we see
that there is a significant relationship between the degree of injury and the construction
operation prompting fall for steel workers. In addition, the strength of this relationship is
weak.
Table 54: Degree of injury vs. construction operation prompting fall for steel workers
Construction operation prompting fall Nonfatal Fatal Total 1: Roofing 10
(10%) 52
(8.6%) 62
2:Exterior carpentry 30 (30%)
224 (37.3%)
254
3:Specific steel functions including decking 0 (0%)
6 (1%)
6
4: Other 1 (1%)
8 (1.4%)
9
5: Erecting structural steel 52 (52%)
222 (36.9%)
274
6: Installing metal siding & water proofing 7 (7%)
89 (14.8%)
96
Total 100 601 701
According to Table 55, 43.8% of the fatal cases are caused by falling from/with a
structure other than roof. Also, the chi square test shows that there is a significant

125
relationship between the degree of injury and fatality/injury causes for steel workers and
the strength of this relationship is weak.
Table 55: Degree of injury vs. fatality/ injury cause for steel workers
Fatality /injury cause Nonfatal Fatal Total
1: Collapse of structure 7
(7%)
13
(2.1%)
20
2: Fall from /with ladder 12
(12%)
45
(7.3%)
57
3: Fall from roof 24
(24%)
158
(26.3%)
182
4: Fall from / with scaffold, bucket and platform
catwalk (attached to the structure)
3
(3%)
43
(7.1%)
46
5: Fall through opening 3
(3%)
19
(3.6%)
22
6: Fall from /with structure other than roof 36
(36%)
263
(43.8%)
299
7: Other 15
(15%)
60
(9.8%)
75
Total 100 601 701
Looking at Table 56, among the steel workers, unguarded/improperly secured
platforms, walkways, openings, edges, ladders collectively represent the highest fatality
(37.8%) among the environmental factors, followed by “other” (32.6%), which embody
pinch point action, catch point/puncture action, squeeze point action, temperature (+/-)
tolerance level, illumination, overpressure/under pressure. The chi square test in Table
49 shows that there is not a significant relationship between the degree of injury and
environmental factors for steel workers (p>.05).

126
Table 56: Degree of injury vs. environmental factors for steel workers
Environmental factor Nonfatal Fatal Total
1: Hazardous work surface/housekeeping problems 6
(6%)
39
(6.5%)
45
2: Structural failure (other than full collapse) 10
(10%)
36
(6%)
46
3: Unguarded/improperly secured platforms,
walkways, openings, edges, ladders
28
(28%)
227
(37.8%)
255
4: Moving flying or falling object 10
(10%)
51
(8.5%)
61
5: Wind and other weather related factors 1
(1%)
10
(1.7%)
11
6: Materials handling and equipment 7
(7%)
30
(4.9%)
37
7. Other 36
(36%)
196
(32.6%)
232
8: Chemical and radiation action 0
(0%)
0
(0%)
0
9: Miss. Issues of WS/FLC 2
(2%)
12
(2%)
14
Total 100 601 701
As shown in the cross tabulation Table 57 for human factors, inappropriate
choice/use of equipment, position, and material handling, and processing came out as
the highest fatality frequency category (40.3%) followed by, misjudgment of hazardous
situation (31.4%) among the steel workers. The chi square test result shown in Table 49
tells us that there is a significant relationship between the degree of injury and human
factors for steel workers. The level of strength of this relationship is weak.

127
Table 57: Degree of injury vs. human factors for steel workers
Human factor Nonfatal Fatal Total
1: Misjudgment of hazardous situation 30
(30%)
189
(31.4%)
219
2: Malfunctioning safety equipment/system
(including lockout/logout tag out)
6
(6%)
30
(4.9%)
36
3: Distracting actions by others 0 5
(.9%)
5
4: Human system malfunction 0 11
(1.8%)
11
5: Inappropriate choice/use of equipment, position,
material handling, processing
37
(37%)
242
(40.3%)
279
6: Insufficient engineering and administrative controls 11
(11%)
22
(3.7%)
33
7: Other 16
(16%)
102
(17%)
118
TOTAL 100 601 701
4.8. SUMMARY OF FINDINGS
4.8.1. CROSS TABULATION FOR WHOLE DATA
There is a statistically significant relationship between union status, SIC code,
project type, fall safety protection system provision, fall safety system use, construction
end use, project cost, fall distance, construction activity prompting fall, fatality / injury
cause, environmental factors, human factors and the degree of injury.
A secondary analysis for multivalued independent variables showed that the
relationship between the degree of injury and human factors #2 (malfunctioning safety
equipment/system (including lockout/logout tag out)), #4 (human system malfunction),

128
and #5 (inappropriate choice/use of equipment, position, material handling, processing)
were significant.
The secondary analysis of individual factors showed that factors #1, #2, #3 and
#9 have significant relationship between the degree of injury.
The relationship between the degree of injury and construction operation
prompting fall #1(roofing), #2 (exterior carpentry), #3 (specific steel functions including
decking), and #5 (erecting structural steel) were significant.
The relationship between the degree of injury and construction cost #1 and #2
were significant.
A majority of fatalities are with nonunion workers 72.2 % versus union 27.8%.
The odds of fatality for unionized workers are 2.77 times higher than the fatality
odds for nonunionized workers. This may be considered anomalous, and hence may
call for further investigation.
The odds of fatality for the fall safety protection system is not in place is 1.22
times higher than the odds of fatality for fall safety system is provided.
The odds of fatality for a worker who is not using fall safety protection system, is
1.27 times higher compared to when fall safety protection system is used.
The odds of fatality for working on a new project or addition increases the odds of
fatality among steel workers and roofers by 1.56 times.

129
4.8.2. CROSS TABULATION FOR ROOFERS
The odds of fatality when a worker works on project type 2
(alterations/rehabilitation, maintenance/repair demolition and other) is 1.54 times higher
than the worker working on project type 1 (new project or addition).
The odds of fatality when fall protection system is not provided is 1.76 times
higher than when fall protection system is provided.
The odds of fatality when the fall protection system is not used is 1.85 times
higher than when the fall protection system is used.
The odds of fatality when the fall safety training is not provided is 1.82 times
higher than when the fall safety training is provided.
The odds of fatality for roofers when they worked on a nonregularly assigned
task is 1.56 times higher than the fatality odds for workers working on a regularly
assigned
4.8.3. CROSS TABULATION FOR STEEL WORKERS
The odds of fatality when the steel worker is unionized is 1.58 times higher than
when the steel worker is not unionized.
The odds of fatality when a steel worker is working on project type 2 is 9.26
times higher than the odds of fatality for workers who work on project type 1.
4.9. LOGISTIC REGRESSION MODELING OF THE WHOLE DATA
Since the response (dependent) variable is of a binary nature (i.e. has two
categories - fatal or nonfatal), the logistic regression technique was used to develop

130
models in this study, as explained in the methodology section. The intent was to provide
a model that can be used to assess the most important factors contributing to the fatality
resulting from fall from elevation based on information extracted from OSHA accident
reports. Five dichotomous categorical independent variables were used in the model
development process. These were the ones found to be significant in the cross tab
analysis. Table 58 lists these variables, their values and types.
Table 58: Logistic regression modeling variables for the whole data
Name of the variables in logistic
regression modeling #1
Values Type of variable
1. Degree of injury
Dependent variable
Fatal:1
Nonfatal: 0
Categorical,
Dichotomous
2. Union status Union:1
Nonunion: 0
Categorical,
Dichotomous
3. SIC 1761- roofers:1
1791-steel workers: 0
Categorical,
Dichotomous
4. Project type PT 1: new project or new addition
PT 2: alteration/rehabilitation,
maintenance/repair, demolition
and other
Categorical
Dichotomous
5. Fall safety protection
system is used
Used:1
Not used: 0
Categorical,
Dichotomous
6. Safety training and re-
training provided
Provided:1:
Not provided: 0
Categorical,
Dichotomous
The Hosmer and Lemeshow test shows the goodness of fit for the model. It
indicates a poor fit if the chi square significance (p) value is less than .05. In this case, p
value is .150 and greater than .05, therefore, the data fits the model adequately.

131
By comparing the observed and predicted results from the model using SPSS
program (classification table), it was found that fatality and nonfatality could be correctly
predicted in 68.3% of the cases.
Table 59: Logistic regression results based on the whole data
Variables β S.E. Wald df p Exp (β) 95 % C.I. for EXP (β)
Lower Upper SIC (1791) 2.423 .136 317.237 1 .000 11.278 8.636 14.723 Project type 2 .483 .108 19.948 1 .000 1.621 1.311 2.004 Fall safety protection system used
-.456 .103 19.789 1 .000 .634 .518 .775
Constant -.457 .092 24.784 1 .000 .633
For validation of the created model, rv.bernoulli (0.7) was used which selects
70% of the cases and compares the observed and expected values for selected and
unselected cases. (SPSS tutorial on logistic regression modeling). The created model
predicted fatality on selected cases (70%) and unselected cases (30%) with a
percentage of 68.5% and 67.6% respectively. This is an indication of the validation of
the model in terms of predicting the outcome.
According to logistic regression results given in Table 59, the observed level of
significance for regression coefficients for the three variables were less than .05; the
rest of the independent variables’ observed level of significance were more than .05.
This suggests that these significant three variables were the explanatory variables to be
included in the model. As can be observed in the model logistic regression Table 59:

132
Based on the odds ratio (Exp. β), fatality among steel workers, when the other
variables in the model held constant, is 11.278 times higher than odds of fatality for
roofers.
The odds of fatality among workers who work on project type 2
(alterations/rehabilitation, maintenance/repair, demolition and other), when the other
variables held constant, is 1.621 times higher than odds of fatality for project type 1
which is new project or addition.
The odds of fatality when the fall protection system is used, when the other
variables held constant, is .634 times lower than odds of fatality for the fall protection
system is not used. Upper and lower limits are given in the table.
4.10. LOGISTIC REGRESSION MODELING OF ROOFERS
The intent was to provide a model that can be used to assess the significant
factors contributing to fatality resulting from fall from elevation based on information
extracted from OSHA accident report for roofers. Five dichotomous categorical
independent variables were used in the model development process. These were the
ones found to be significant in the cross tab analysis with the dependent variable being
the degree of injury; Table 60 lists these variables, their values and types.

133
Table 60: Logistic regression modeling variables for roofers (SIC 1761)
Name of the variables in logistic regression modeling #2
Values Type of variable
1. Degree of injury Dependent variable
Fatal:1 Nonfatal: 0
Categorical, Dichotomous
2. Task regularity Regularly assigned:1 Non regularly assigned: 0
Categorical, Dichotomous
3. Project type PT 1: New project or new addition PT 2: Alteration/rehabilitation, maintenance/repair, demolition and other
Categorical Dichotomous
4. Fall safety protection system is used
Used:1 Not used: 0
Categorical, Dichotomous
5. Safety training provided Provided:1 Not provided: 0
Categorical, Dichotomous
6. Fall safety protection system provided
Provided:1 Not provided: 0
Categorical, Dichotomous
The Hosmer and Lemeshow test result is .247 which is greater than .05, which
indicates an adequate goodness of fit for the model. By comparing the observed and
predicted results from the model using SPSS it was found that fatality and nonfatality
could be correctly predicted in 61.1% of the cases.
Table 61: Logistic regression results based on the roofers data
Variables β S.E. Wald df p Exp (β)
95 % C.I. for EXP (β)
Lower Upper Project type 2 .438 .113 15.115 1 .000 1.550 1.243 1.932 Fall safety protection system used
-.456 .125 13.291 1 .000 .634 .496 .810
Fall safety training provided -.440 .119 13.686 1 .000 .644 .510 .813 Constant -.166 .111 2.237 1 .135 .847
For validation of the model, rv.bernoulli(0.7) was used again. The model predicts
the fatality on selected cases (70%) and unselected cases (30%) at levels of with 59.6%
and 62% accuracy.

134
According to the logistic regression results presented in Table 61, the observed
level of significance for regression coefficients for the three variables were less
than 5%, suggesting that these three variables were significant explanatory
variables.
The following observations can also be made from Table 61.
The odds of fatality among workers who work on project type 2
(alterations/rehabilitation, maintenance/repair, demolition and other), when the other
variables held constant, could be 1.55 times more likely to occur than odds of fatality
for project type 1 which is new project or addition.
The odds of fatality when the fall protection system is used, when the other
variables held constant, is .634 times lower than odds of fatality for the fall protection
system is not used.
The odds of fatality among roofers who had previous safety training, when the
other variables held constant, is .644 times lower than the odds of fatality for the ones
who has no safety training is provided. Upper and lower limits are given in the table.
4.11. LOGISTIC REGRESSION MODELING OF STEEL WORKERS
The intent was to provide a model that can be used to assess the significant
factors contributing to fatality resulting from fall from elevation based on information
extracted from OSHA accident reports for steel workers. Two dichotomous categorical
independent variables were used in the model development process. These were the
ones found to be significant in the cross tab analysis.

135
Again, the dependent variable is the degree of injury. Table 62 shows both the
dependent and the independent variables, their values and types.
Table 62: Logistic regression modeling variables for steel workers
Name of the variables in logistic regression modeling #3
Values Type of variable
1. Degree of injury Dependent variable
Fatal:1 Nonfatal: 0
Categorical, Dichotomous
2. Union status Union:1 Nonunion: 0
Categorical, Dichotomous
3. Project type PT 1: New project or new addition PT 2: Alteration/rehabilitation, maintenance/repair, demolition and other
Categorical Dichotomous
The Hosmer and Lemeshow test result value is .853 which is greater than .05
and verifies an adequate goodness of fit for the model. By comparing the observed and
predicted results from the model using SPSS. it was found that fatality and nonfatality
could be correctly predicted in 85.7% of the cases.
Table 63: Logistic Regression results based on the steel workers data
Variables β S.E. Wald df p Exp (β)
95 % C.I. for EXP (β)
Lower Upper Union status .494 .226 4.773 1 .029 1.639 1.052 2.553 Project type 2 1.445 .601 5.773 1 .016 4.242 1.305 13.788 Constant 1.503 .139 117.239 1 .000 4.493
For validation of the model, rv.bernoulli (0.7) was used one more time. The
selected cases are 85.1% and unselected cases are 87.4%, which indicates that the
model has a good fit and is predicting correctly. This validates the model.
According to logistic regression results displayed in Table 63 the observed level
of significance for regression coefficients for the two variables were less than .05

136
suggesting that these two variables were significant explanatory variables. We
further observe from Table 63 the following:
The odds of fatality for steel workers who are union members, with the other
constant variables in the model, is 1.639 times higher than the odds of fatality for
workers who are nonunion. This is an anomaly that needs further research.
The odds of fatality among steel workers who work on project type 2
(alterations/rehabilitation, maintenance/repair demolition and other), with the other
constant variables in the model, is 4.242 times higher than the odds of fatality for the
workers who work on “Project type 1” (new construction or addition).
4.12. SUMMARY OF FINDINGS
4.12.1. LOGISTIC REGRESSION MODELING FOR WHOLE DATA
Based on Exp. β, the odds of fatality among the steel workers, when the other
variables in the model are held constant, is 11.28 times higher than odds of fatality for
roofers.
The odds of fatality among workers who work on project type 2
(alterations/rehabilitation, maintenance/repair, demolition and other), when the other
variables are held constant 1.62 times higher than odds of fatality for project type 1
which is new project or addition.
The odds of fatality when the fall protection system is used, when the other
variables are held constant, is .63 times the odds of fatality for the fall protection
system is not used.

137
4.12.2. LOGISTIC REGRESSION MODELING FOR ROOFERS
Fatality among workers who work on project type 2, when the other variables are
held constant, are 1.55 times more likely to occur than fatality for project type 1.
The odds of fatality when the fall protection system is used, when the other
variables are held constant, is .63 times the odds of fatality when the fall protection
system is not used.
The odds of fatality among roofers who had previous safety training, when the
other variables are held constant, is .64 times the odds of fatality for those for whom
no safety training is provided.
4.12.3. LOGISTIC REGRESSION MODELING FOR STEEL WORKERS
The odds of fatality for steel workers who are union members, with the other
constant variables in the model, is 1.639 times higher than the odds of fatality for
workers who are nonunion. This is an anomaly that needs further research.
The odds of fatality among steel workers who work on project type 2, with the
other constant variables in the model, is 4.242 times higher than the odds of fatality for
the workers who work on project type 1.

138
CHAPTER 5
CONCLUSIONS AND RECOMMENDATIONS
This study was conducted to identify those variables contributing to fall accidents
for roofers and steel workers and to analyze these variables to establish the
relationships between them. Predictive models for accident severity based on the
contributing significant independent variables were also constructed as part of the
study. Comparisons were drawn between the two trades.
Major findings of this study were that; union status, task regularity, project type,
construction end use, SIC code, environmental factors, fall distance, age of the worker,
construction operation that prompts the fall, human factors, fatality/injury cause, fall
safety system provision, fall safety system provision usage, fall safety training
provisions were identified as variables potentially contributing to determination of
accident severity (fatality vs. nonfatality)
Univariate analysis for the whole data indicated the following highest
frequency/occurrences:
Project type: New project or addition.
Construction end use: Residential and commercial.
Victim age group: 2 (50≥AG2>30).
Project cost group 2: ($50K<PC2≤ $5M).
Fall distance: Over 20 feet.
Construction activity prompting fall: Roofing operation

139
Union status: Nonunion workers
Environmental factors: Unguarded/improperly secured platforms, walkways,
openings, edges and ladders.
Task assignment: Regularly assigned task.
Human factors: Inappropriate choice/use of equipment, position, material
handling, or processing.
Fall safety protection system provision and usage: Not provided and not
used.
Fall safety training provision: Provided
SIC Code: Roofers
Results were similar for data pertaining to just roofers and just steel workers,
except for the following:
Project type: New project or addition for roofers, alterations/rehabilitation,
maintenance/ repair demolition and other for steel workers.
Project cost: Less than $50,000 for roofers, more than $50,000 to $5 million for
steel workers.
Construction operation prompting fall: Roofing for roofers; structural steel
erection for steel workers.
Fatality/injury cause: Fall from the roof for roofers, fall from/with structure other
than roof for steel workers.

140
Cross tab analysis for whole data indicated that there were significant
relationships between the degree of injury and SIC code, union status, environmental
factor, project type, project cost, fall distance, construction activity prompting fall, the
provision of the fall safety protection system , the fall safety protection system usage,
human factors, fatality/injury cause, construction end use.
For the roofers there were a statistically significant relationship between the
degree of injury and task regularity, project type, fall safety system provision, fall safety
system usage, fall safety training, construction end use, fall distance, fatality/injury
cause, environmental factors, and human factors.
For the steel workers there were a statistically significant relationship between
the degree of injury and union status, project type, construction operation prompting fall,
fatality/injury cause, and human factors.
Based on logistic regression model for the whole data:
• Steel workers are more susceptible to fatal accidents than roofers.
• Project type 1 increases the fatality risk for workers compared to project type 2.
• Not using the fall safety protection system increases the odds for worker fatality.
The model for the roofers showed that:
• Roofers are more susceptible to fatal accidents while working on project type 2 as
compared to project type1.
• Safety training for roofers has a lowering effect on the odds of fatality.

141
For steel workers, the model showed that:
• Unionized steel workers are more susceptible to fatal accidents than nonunion.
• Working on project type 2 increases the odds for steel worker fatality as compared
project type 1.
Finally, this research study indicated that the multivariate analysis approach
taken and the associated methodologies employed produce meaningful and beneficial
results for improving our understanding of the factors contributing to fall accidents
involving roofers and steel workers.

142
APPENDIX - A : SAMPLE ACCIDENT REPORT

143

144

145
APPENDIX - B : OSHA’S DEFINITIONS FOR ACCIDENT FACTORS
Summary Number Provides a unique identifier for the accident investigation. This investigation may be linked to several inspections, e.g., if there were multiple contractors at a construction site.
Event description Provides a short one line description of the accident.
Event date Indicates the date on which the accident occurred.
State Indicates the state in which the accident occurred
Degree of injury Indicates whether the injured person was killed, hospitalized, or non-hospitalized injury.
Union status Indicates if the victim was a trade union member or not
Task Indicates if the victim was working at regularly assigned task or not
Environmental factors Physical factors that effect the victim
Human factors Indicates the human factors that effect the accident .
SIC code Indicates the 4-digit Standard Industrial Classification Code from the 1987 version SIC manual which most closely applies.
Construction end use Indicates the end-use of the structure being built
Nature of the injury Indicates the nature of the injury
Project type Indicates the project being a brand new or addition / alteration or demolition
Event type Indicates the type of the event that caused the accident
Project cost The sum total of all funds required to complete a total construction activity
Fall distance Distance of fall
Fall height Height of person when fell
Non-building height Height in feet when not a building
Construction operation cause
Construction operation that the victim was working on just before the accident ( prompting the accident)
Fatality cause The causal action of the fatality
Age Age of the victim
Sex of the victim Indicates the sex of the injured person.

146
REFERENCES
1. Abdelhamid, T. S. and Everett, J. G., 2000, “Identifying Root Causes of
Construction Accidents”, Journal of Construction Engineering and
Management, January /February, 52-60.
2. Abudayyeh, O., Fredericks, T.K., Butt, S.E., Shaar, A., (2006), “An
investigation of management’s commitment to construction safety”,
International Journal of Project Management 24, pages 167–174.
3. Al –Ghamdi, A.S., (2002), “Using logistic regression to estimate the influence
of accident factors on accident severity”, Accident Analysis and Prevention 34
(2002) 729 – 741.
4. Al-Qalyuby, H.A., (2004), “Inductive Learning Methodology Using OSHA
Construction Accident and Citation Data”. PhD Dissertation, Wayne State
University.
5. Bland, J. M., and Altman, D. G., 2000, “Statistics Notes, The odds ratio”
320(7247): 1468. BMJ VOLUME 320 27 MAY 2000, bmj.com
6. Baradan, S. and Usmen. M, 2005, “Comparative Injury and Fatality Risk
Analysis of Building Trades”, Journal of Construction Engineering and
Management, May 2006 / 533.
7. J. E. Beavers J. E. , Moore J.R., Schriver W.R. (2009), “Steel Erection
Fatalities in the Construction Industry”, Journal of Construction Engineering
and Management, ASCE, March 2009, 227-234.

147
8. Behm, M., 2005, “Linking construction fatalities to the design for construction
safety concept”, Safety Science 43, 2005, pages 589–611.
9. Benjaoran, V., and Bhokha, S., (2010), “An integrated safety management
with construction management using 4D CAD model”, Safety Science 48
(2010) page 395–403.
10. Brunette, M.J., 2004, “Construction safety research in the United States:
targeting the Hispanic workforce”, Injury Prevention 2004; 10:244–248. doi:
10.1136/ip.2004.005389
11. Bureau of Labor Statistics (BLS) web site, http://www.bls.gov
12. Cattledge, G. H., Hendricks, S., and Stanevich, R., 1996, “Fatal occupational
falls in the U.S. construction industry, 1980–1989” Accident Analysis &
Prevention, Volume 28, Issue 5, September 1996, Pages 647-654.
13. Cdc.gov http://www.cdc.gov/nchs/icd.htm
14. Chia C., Tin-Chang C., Hsin-I T., 2005, “Accident patterns and prevention
measures for fatal occupational falls in the construction industry”, Applied
Ergonomics 36, 391–400.
15. Cleveland State University Work Zone Safety and Efficiency Transportation
Center, 2003, “Theories Of Accident Causation”, http://www.academic
.csuohio.edu/duffy_s/Section_03.pdf
16. Cohen. H., and Lin, L., (1991) “A Scenario Analysis of Ladder Fall Accidents”
Journal of Safety Research Vol. 22, pp. 31-39.

148
17. Construction Industry Research and policy center, University of Tennessee,
Knoxville (2011), “Penalties in construction Fatalities: OSHA Experience
2005-2007”, Prepared for: OSHA office of statistical analysis OSHA
department of labor.
18. Construction Industry and research policy center, University of Tennessee,
Knoxville , OSHA’s Office of statistics, 2003
19. www.cpwr.com, “The center for construction research and training’s study”,
(2000)
20. Ellis, J.N., Warner, S., 1996, “Using safety awards to promote fall prevention”,
Occupational Hazards; Jun 1999; 61, 6.
21. Fredericks, Tycho K., Abudayyeh, Osama,. Choi, Sang D., Wiersma, Mike,
and Charles, Marcia, 2005, “Occupational Injuries and Fatalities in the
Roofing Contracting Industry”, Journal of Construction Engineering and
Management / Volume 131 / Issue 11, 8 pages.
22. Furst, Peter G., 2009, “Prevention through Design (Safety in Design)”, Notes
from a series of lectures at Harvard University, February
23. Gambatese, J., Hinze, J., 1999, “Addressing construction worker safety in the
design phase Designing for construction worker safety”, Automation in
construction 8, (1999) 643-649, Elsevier Science B.V.
24. Gambatese, J. A., Behm, M., Hinze, J. W, 2005, “Viability of Designing for
Construction Worker Safety”, Journal of Construction Engineering &
Management; Sep, 2005, Vol. 131 Issue 9, pages 1029-1036.

149
25. Gillen,M., Baltz,D., Gassel, M., Kirsch,D., Vaccaro,D., 2002, “Perceived
safety climate, job demands, and coworker support among union and
nonunion injured construction workers”, Journal of Safety Research 33 (2002)
pages 33 – 51.
26. Gillen, M., Kools, S., McCalla, C., Sumb, J., and Moulden, K., 2004,
“Construction managers’ perceptions of construction safety practices in small
and large firms: A qualitative investigation”, Work 23 233–243, IOS Press.
27. Healey, J., 2011, “Statistics: A tool for social research”, Wadsworth
Publishing; 9 edition.
28. Howell, G. A., Ballard, G., Abdelhamid, T.S., and Mitropoulos, P., 2002,
“Working near the edge: a new approach to construction safety”, Submitted
for inclusion in the proceedings of the 10th Annual Conference of the
International Group for Lean Construction.
29. Hadipriono, F.C., 1992, “Expert system for construction safety. I: fault-tree
models”, Journal of Performance of Constructed Facilities, Vol. 6, No.4,
November 1992.
30. Harper,R.S. and Koehn,E.,1998, “Managing industrial construction safety in
southeast Texas”, Journal of construction engineering and management/
November/ December 1998 pages 452-457.
31. Helander,M.G., 1991, “Safety hazards and motivation for safe work in the
construction industry”, International Journal of Industrial Ergonomics, Volume
8, Issue 3, November 1991, Pages 205–223.

150
32. Hinze, J., “Instructor’s Manual to accompany Construction Safety”, 1997,
Prentice-Hall, Inc.
33. Hosmer, W.D., and Lemeshow, S, 2000, “Business and Economics” Wiley
and Sons Inc.
34. Hosmer, W.D., and Lemeshow, S, 2000, “Applied Logistic regression “Wiley
and Sons Inc.
35. Huang, X. and Hinze, J., 2003, “Analysis of Construction Worker Fall
Accidents”, Journal of Construction Engineering and Management, May/June,
262-271.
36. Huang, X., 2003, “The owner’s role in construction safety”, a dissertation
presented to the graduate school Of the university of Florida in partial
fulfillment of the requirements for the degree of doctor of Philosophy
University of Florida, 2003.
37. Hugsafety.com (http://www.hugsafety.com/2010/12/28/oshas-new-residential-
roof-safety-directiv/)
38. Hunting,K.L., Murawski,J.A., Welch,L.S., (2004) “Occupational Injuries among
Construction Workers Treated at the George Washington University
Emergency Department, 1990-97”, The Center to Protect Workers’ Rights.
Suite 1000 , 8484 Georgia Ave. , Silver Spring, MD 20910,301-578-8500 ,
Fax: 301-578-8572 , www.cpwr.com , www.elcosh.org

151
39. Irizarry, J, Simonsen, K. L., and Abraham, D. M., 2005, “Effect of Safety and
Environmental Variables on Task Durations in Steel Erection”, Journal of
Construction Engineering and Management / Volume 131 / Issue 12.
40. Janicak, Christopher A., 1998, “Fall-Related Deaths in the Construction
Industry”, Journal of Safety Research, Volume 29, Issue 1, Spring 1998,
Pages 35-42.
41. Kines, P., 2002, “Construction workers’ falls through roofs: Fatal versus
serious injuries”, Journal of Safety Research 33 (2002) pages 195 – 208.
42. “Logistic regression: a self-learning text”, David G. Kleinbaum, Springer, New
York, 1994.
43. Michigan.gov, (http://www.michigan.gov/ documents/ cis_wsh_constfact_
steel_ erection_163281_7.htm)
44. The National Institute for Occupational Safety and Health (NIOSH) web site,
http://www.cdc.gov/niosh.
45. Occupational Safety and Health Administration (OSHA), 2000, ‘‘A preliminary
report: Annual report on work related injuries and fatalities’’, Publication 3146,
Washington, D.C.
46. Occupational Safety and Health Administration (OSHA) web site,
http://www.osha.gov.
47. Occupational Safety and Health Administration (OSHA), “Fall Protection In
Construction” e-book (2011).

152
48. Rekus, John F., 1999, “Understanding OSHA's Fall Protection Standard”
Occupational Hazards, April, 1999, Penton Media, Cleveland, Ohio, USA.
49. Sa, J., Seo, D.C., Choi, S. D. ,2009, “Comparison of risk factors for falls from
height between commercial and residential roofers”, Journal of Safety
Research, Volume 40, Issue 1, 2009, Pages 1–6.
50. Sawacha, E., Naoum, S., Fong, D., 1999, “Factors affecting safety
performance on construction sites”, International Journal of Project
Management Vol. 17, No. 5, pages 309-315.
51. SPSS version 20, user manual
52. Suruda, A., Fosbroke, D., and Braddee, R., “Fatal Work-Related Falls from
Roofs”,(1995), Journal of Safety Research, Vol. 26, No. I, pp. 1-8.
53. US Occupational Safety and Health Review Commission (OSHRC) web site,
http://www.oshrc.gov.
54. Weinstein, M., Gambatese, J., Hecker, S.,2005, “Can Design Improve
Construction Safety?: Assessing the Impact of a Collaborative Safety-in-
Design Process.”, Journal of Construction Engineering & Management; Oct,
2005, Vol. 131 Issue 10, p1125-1134.
55. Winn, G.L., Seaman, B., Baldwin, J.C., 2004, “Fall Protection Incentives in the
Construction Industry: Literature Review and Field Study”, International
Journal of Occupational Safety and Ergonomics (JOSE) 2004, Vol.10, No.1,
5-11.

153
56. Parsons, T.J., Pizatella, T.J., Collins, J.W., (1986), “Safety analysis of high
risk injury categories within the roofing industry”, Professional Safety [PROF.
SAF.]. Vol. 31, no. 6, pp. 13-17.
57. http://www.people.vcu.edu/~pdattalo/702SuppRead/MeasAssoc/NominalAsso
c.html
58. Stern, F.B., Ruder, A.M., Chen, G. ,(2000), “Proportionate Mortality Among
Unionized Roofers and Water proofers”, American journal of industrial
medicine 37:478±492
59. SPSS statistical program tutoring on logistic regression modeling.
60. Steyerberg, E.W., Harrell, F. E, Borsboom, G.J.J.M., Eijkemans, M.J.C.,
Vergouwe, Y., Habbema, J.D.F., 2001, “Internal validation of predictive
models: Efficiency of some procedures for logistic regression analysis”,
Journal of Clinical Epidemiology, Volume 54, Issue 8, August 2001, Pages
774–781.
61. Strand, M.L. 1979, “Estimation of a population total under a Bernoulli
sampling procedure”, The American statistician, May, 1979, Vol. 33, No:2,
pages: 81-84.

154
ABSTRACT
ANALYSIS AND MODELING OF ROOFER AND STEEL WORKER FALL ACCIDENTS
by
HULYA CAKAN
August 2012
Advisor: Dr. Mumtaz Usmen
Major: Civil and Environmental Engineering
Degree: Doctor of Philosophy
There are more than nine million construction workers in the US. Roofers and
steel workers are the highest risk construction trades according to BLS, and fall from
elevation accounts for a large percentage of fatalities and injuries among the
construction trades.
In this study, 2114 OSHA accident case reports involving roofers and steel
workers were reviewed to identify and analyze the factors contributing to construction
fall accidents. Using data for the years between 1994 and 2008, the relationships
between these factors were determined and further studied to develop predictive
models. Univariate frequency, cross tabulation and logistic regression analyses were
used to estimate the effect of the statistically significant factors on the degree of injury
(fatality vs. nonfatality)
Chi square tests on the entire data showed that there is a significant relationship
between the degree of injury and union status, SIC code, construction operation
prompting fall, environmental factor, human factor, project type, construction end use,
155
safety protective system provision, safety protective system usage, fall distance, and
fatality/injury cause.
Logistic regression model created for the combined SIC Codes of 1761 and 1791
showed that among the six independent dichotomous variables only four were
significantly associated with the degree of injury. These factors were project type, SIC
code, safety training and safety protection system usage.
Two separate logistic regression models, one for roofers and another for steel
workers were also developed. The roofers’ model showed that among the five
independent categorical dichotomous variables only three showed significant
association with injury severity. These were project type, safety training, and safety
protection system usage. The steel worker model showed that only two independent
variables had significant association with the degree of injury, and they were union
status and project type.
The study showed that cross tabulation analysis and logistic regression modeling
can be used for analyzing data on construction fall accidents in a meaningful way,
producing useful results.

156
AUTOBIOGRAPHICAL STATEMENT
Hulya Cakan is an architect with more than fifteen years of experience. She
holds a MSCE degree with specialization in Construction Management from Wayne
State University (WSU), Detroit, Michigan, and a previous master degree on
Architectural Design from Mimar Sinan University, Istanbul, Turkey.
Her experiences include new communities, mixed-use; residential, commercial
buildings, church, school, public park and residential renovations.
She has worked as a staff architect, project manager and consultant for
Hanahan/Strollo Associates at Ohio, Concrete Services Network at Michigan, Wilcox
Associates at Michigan, Professional Contracting Consultants (PCC) at Michigan,
Emlak Bank Design and Construction Company at Istanbul and Kutlutas Design and
Construction Company in Istanbul.
She has compiled a broad range of experiences providing planning, design and
coordination services for a wide variety of project types including Northland Credit Union
Building, Michigan; Piper School renovation and addition, Michigan; Grand Lake Church
addition, Michigan; Ashtabula County Medical Office building, Ohio; North Side Hospital,
adult Psychiatry section renovation, Ohio; Phar - Mor drug store chain renovation,
Ohio, Florida, Pennsylvania; Emlak Bank Branch renovations, Istanbul; Bahcesehir new
community design, Istanbul; Halkali and Atakoy high rise housing projects, Istanbul.
She worked as an associate professor in the College for Creative Studies, Detroit
MI between 2004 and 2012. She has also taught as an adjunct professor at Wayne
State University since 2004, specializing AutoCAD and BIM/Revit software applications
in civil engineering and construction.