Embed Size (px)
Citation preview

U.S. Environmental Projection Agency, Office of Research and Development
Analysis and Monitoring of Algal Toxins in Fresh and Coastal/Estuarine Environments
US EPA Cincinnati OH Heath Mash
14th Annual EPA Drinking Water Workshop August 22, 2017
U.S. Environmental Protection Agency, through its Office of Research and Development, funded and managed, or partially funded and collaborated in, the research described herein. It has been subjected to the Agency’s peer and administrative review and has been approved for external publication. Any opinions expressed in this paper are those of the author(s) and do not necessarily reflect the views of the Agency, therefore, no official endorsement should be inferred. Any mention of trade names or commercial products does not constitute endorsement or recommendation for use.

&EPA Harmful Algal Blooms (HABs)
HABs result in approximately $2.2B of associated costs annually in the US, from restricted use of recreational waters, declining waterfront real estate value, spending on recovery of biodiversity, and drinking water treatment.
Wide variety of taxa can produce blooms
Typically detrimental to the aquatic system and can be harmful to humans and land animals (contact and consumption)
Blooms are dependent on numerous factors, including nutrient loading, temperature, water flow and weather patterns
2
Microcystis
Oscillatoria
Nostoc
Anabaenopsis
Aphanocapsa
Haplosiphon
Pseudanabaena
Synechocystis
Synechococcus
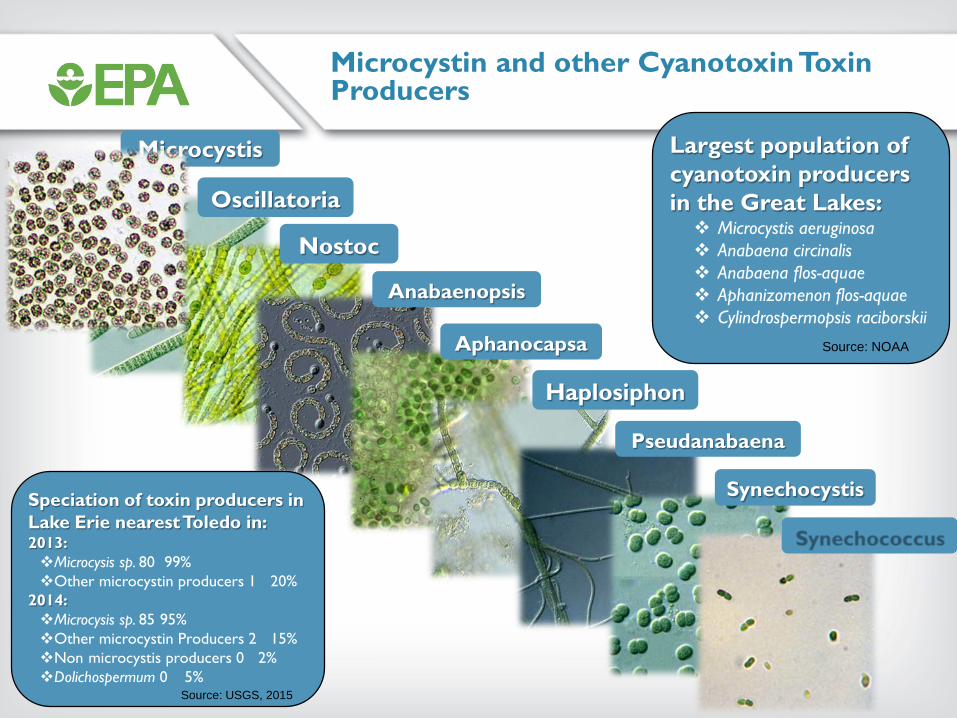
Microcystin and other Cyanotoxin Toxin Producers
Largest population of cyanotoxin producers in the Great Lakes: Microcystis aeruginosa Anabaena circinalis Anabaena flos-aquae Aphanizomenon flos-aquae Cylindrospermopsis raciborskii
Source: NOAA
Speciation of toxin producers in Lake Erie nearest Toledo in: 2013: Microcysis sp. 80 -99% Other microcystin producers 1 - 20%
2014: Microcysis sp. 85 -95% Other microcystin Producers 2 - 15% Non -microcystis producers 0 - 2% Dolichospermum 0 – 5%
Source: USGS, 2015
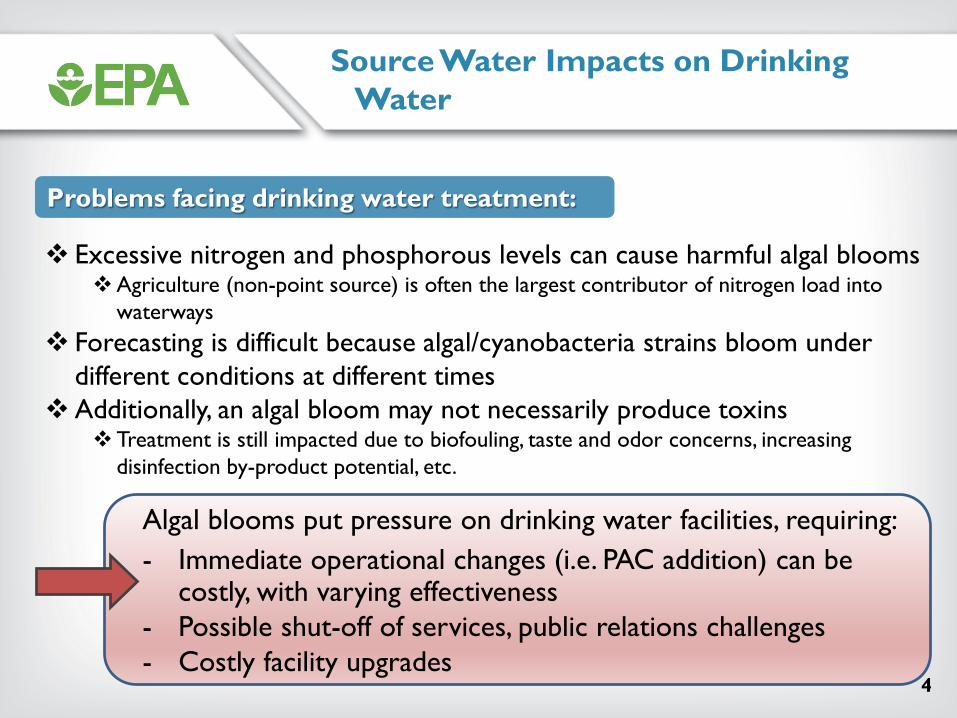
Source Water Impacts on Drinking Water
Problems facing drinking water treatment:
Excessive nitrogen and phosphorous levels can cause harmful algal blooms Agriculture (non-point source) is often the largest contributor of nitrogen load into
waterways Forecasting is difficult because algal/cyanobacteria strains bloom under
different conditions at different times Additionally, an algal bloom may not necessarily produce toxins
Treatment is still impacted due to biofouling, taste and odor concerns, increasing disinfection by-product potential, etc.
Algal blooms put pressure on drinking water facilities, requiring: - Immediate operational changes (i.e. PAC addition) can be
costly, with varying effectiveness - Possible shut-off of services, public relations challenges - Costly facility upgrades
4
Current Regulations/Guidance
5
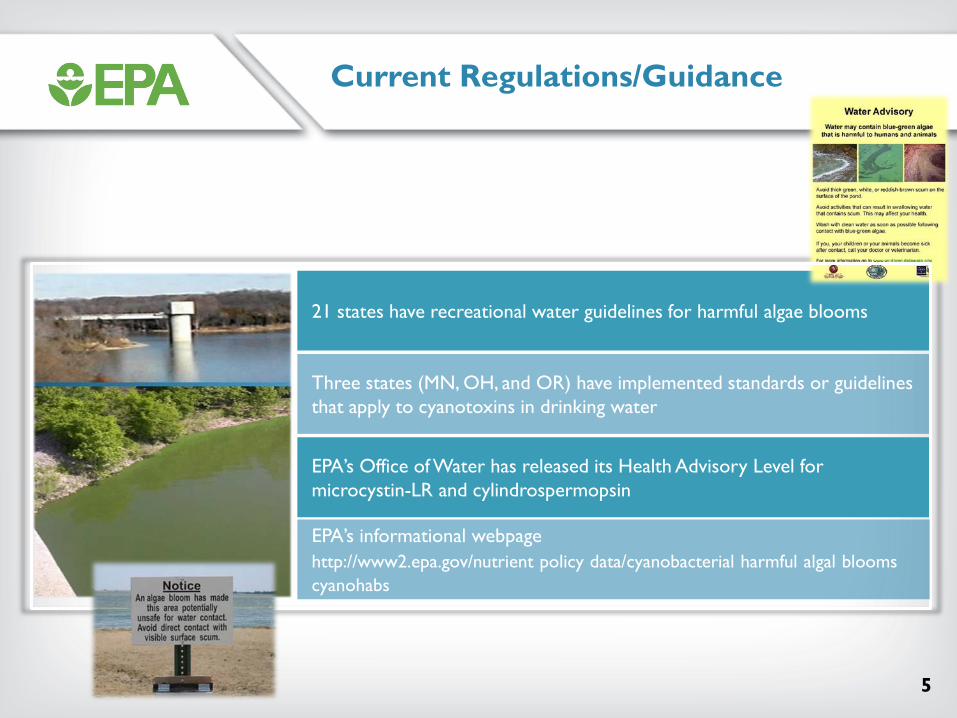
21 states have recreational water guidelines for harmful algae blooms
Three states (MN, OH, and OR) have implemented standards or guidelines that apply to cyanotoxins in drinking water
EPA’s informational webpage http://www2.epa.gov/nutrient -policy -data/cyanobacterial -harmful -algal -blooms -cyanohabs
EPA’s Office of Water has released its Health Advisory Level for microcystin-LR and cylindrospermopsin
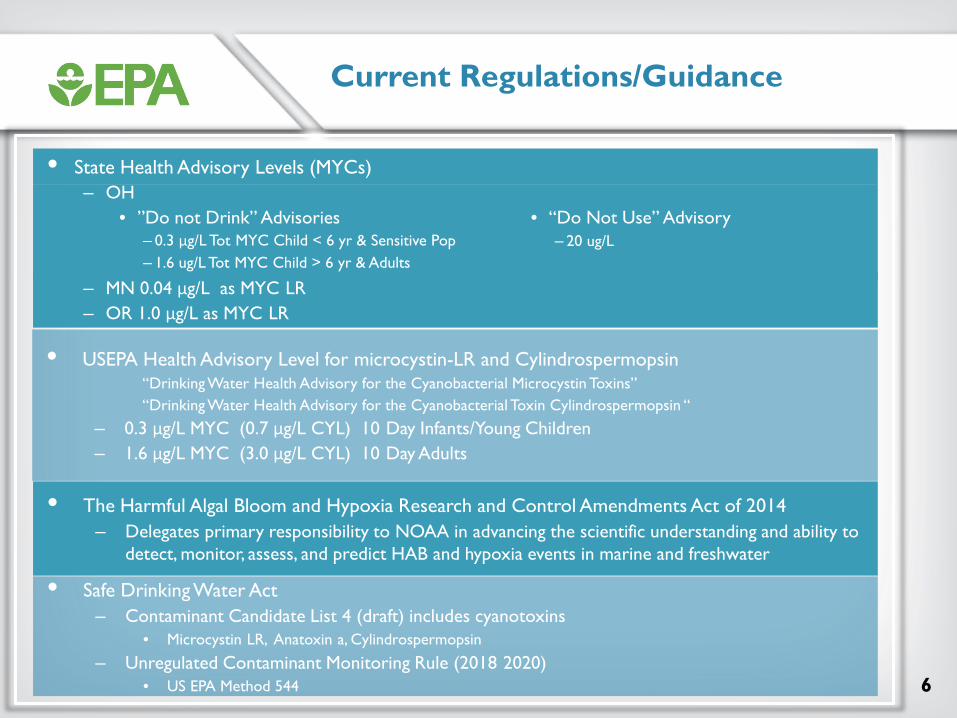
• The Harmful Algal Bloom and Hypoxia Research and Control Amendments Act of 2014 – Delegates primary responsibility to NOAA in advancing the scientific understanding and ability to
detect, monitor, assess, and predict HAB and hypoxia events in marine and freshwater
--
--
- -
-
--
Current Regulations/Guidance
– OH • ”Do not Drink” Advisories
– 0.3 μg/L Tot MYC Child < 6 yr & Sensitive Pop – 1.6 ug/L Tot MYC Child > 6 yr & Adults
• “Do Not Use” Advisory – 20 ug/L
• USEPA Health Advisory Level for microcystin-LR and Cylindrospermopsin “Drinking Water Health Advisory for the Cyanobacterial Microcystin Toxins” “Drinking Water Health Advisory for the Cyanobacterial Toxin Cylindrospermopsin “
– 0.3 μg/L MYC (0.7 μg/L CYL) 10 Day Infants/Young Children – 1.6 μg/L MYC (3.0 μg/L CYL) 10 Day Adults
• Safe Drinking Water Act – Contaminant Candidate List 4 (draft) includes cyanotoxins
• Microcystin LR, Anatoxin a, Cylindrospermopsin
– Unregulated Contaminant Monitoring Rule (2018 2020) • US EPA Method 544
– MN 0.04 μg/L as MYC LR – OR 1.0 μg/L as MYC LR
• State Health Advisory Levels (MYCs)
6
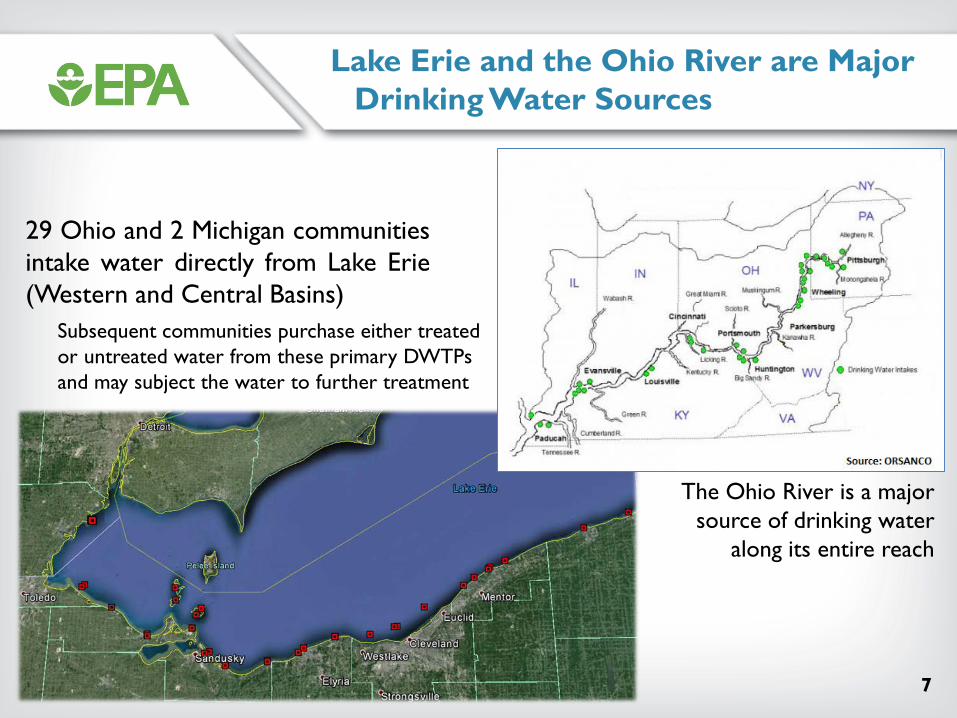
Lake Erie and the Ohio River are Major Drinking Water Sources
29 Ohio and 2 Michigan communities intake water directly from Lake Erie (Western and Central Basins)
Subsequent communities purchase either treated or untreated water from these primary DWTPs and may subject the water to further treatment
The Ohio River is a major source of drinking water
along its entire reach
7
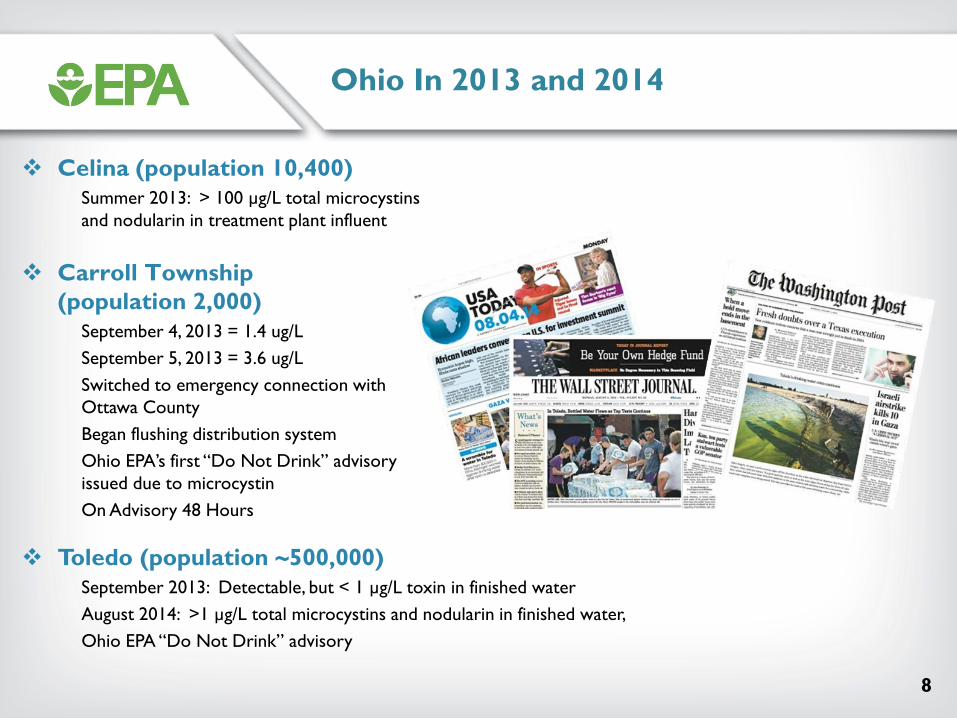
Ohio In 2013 and 2014
Celina (population 10,400) Summer 2013: > 100 µg/L total microcystins and nodularin in treatment plant influent
Carroll Township (population 2,000)
September 4, 2013 = 1.4 ug/L
September 5, 2013 = 3.6 ug/L
Switched to emergency connection with Ottawa County
Began flushing distribution system
Ohio EPA’s first “Do Not Drink” advisory issued due to microcystin
On Advisory 48 Hours
Toledo (population ~500,000) September 2013: Detectable, but < 1 µg/L toxin in finished water August 2014: >1 µg/L total microcystins and nodularin in finished water, Ohio EPA “Do Not Drink” advisory
8
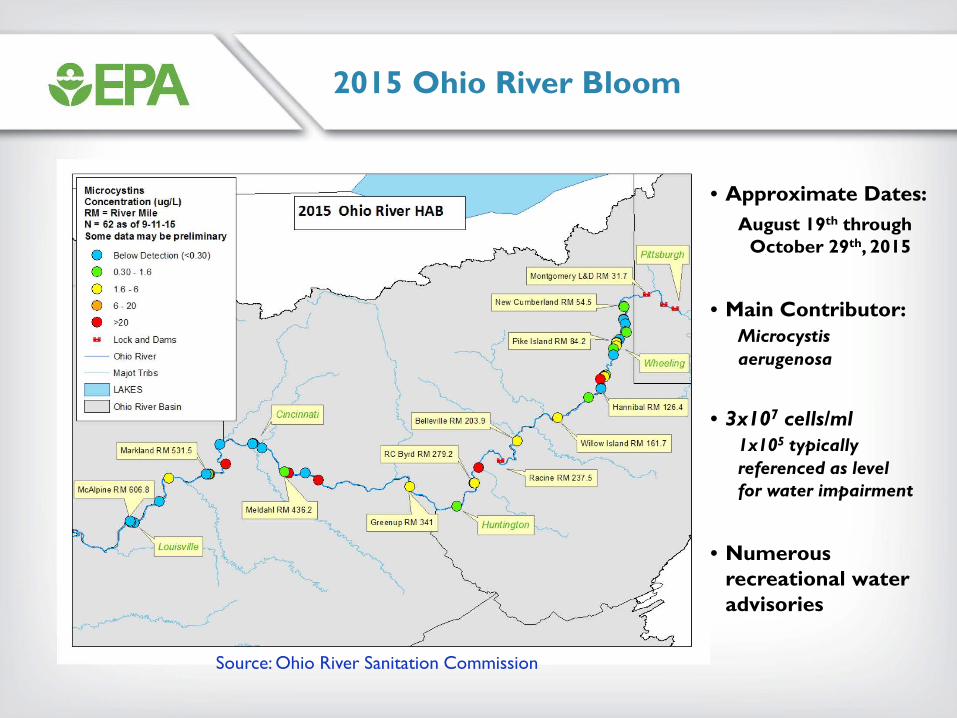
OEPA 2015 Ohio River Bloom
Microcystins Concentration (ug/L) RM = River Mile N = 62 as of 9-11-15 Some data may be prel iminary
0 Below Detection (<0.30)
0 0.30- 1.6
0 1.6 - 6
0 6 - 20
• >20 .. Lock and Dams
-- Ohio River
Majot Tribs
LJ LAKES
D Ohio River Basin
Markland RM 531 .5
2015 Ohio River HAB
Wheellllg
Belleville RM 20 3 .9
W illow Island RM 161 .7
• Approximate Dates:August 19th through
October 29th, 2015
• Main Contributor:Microcystisaerugenosa
• 3x10⁷ cells/ml1x105 typicallyreferenced as level for water impairment
• Numerousrecreational wateradvisories
Source: Ohio River Sanitation Commission
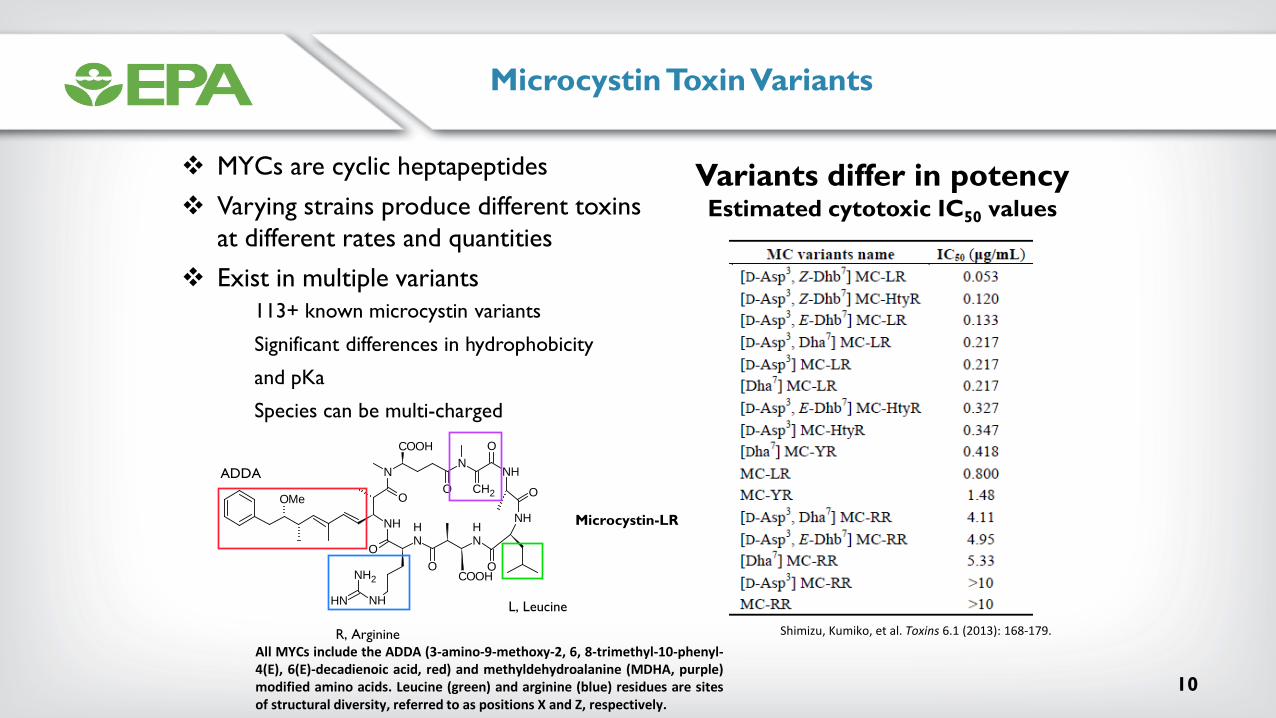
Microcystin Toxin Variants
10
MYCs are cyclic heptapeptides Varying strains produce different toxins
at different rates and quantities Exist in multiple variants
113+ known microcystin variants
Significant differences in hydrophobicity
and pKa
Species can be multi-charged
Variants differ in potencyEstimated cytotoxic IC50 values
Shimizu, Kumiko, et al. Toxins 6.1 (2013): 168-179.
All MYCs include the ADDA (3-amino-9-methoxy-2, 6, 8-trimethyl-10-phenyl-4(E), 6(E)-decadienoic acid, red) and methyldehydroalanine (MDHA, purple)modified amino acids. Leucine (green) and arginine (blue) residues are sitesof structural diversity, referred to as positions X and Z, respectively.
Microcystin-LR OMe
NH
O
N
COOH
O
N
CH2
O
NH
ONH
O
NH
O
NH
O
COOH
NH
NH2
NH
ADDA
R, Arginine
L, Leucine

Dissolved (toxin released from cell)
Solids removal processes ineffective
Typical disinfectants or dosages may not beeffective (e.g., permanganate, chlorine)
More effective treatments are expensive andplants typically do not have them in place(e.g., GAC)
Particulates (toxin in cell)
Solids removal processes effective
Do not want to lyse cell or toxin willbe released
Microcystin ToxinMicrocystis (cells)
Dissolved or Particulate?
11
Toxin within the cell and those that are dissolved require different sample processing and treatment

OEPA Lake Harsha Cyanobacteria Bloom Study
Lake Harsha Cyanobacteria Bloom Study
12

Study Site Lake Harsha (East Fork State Park)
EMB
EFLS/LD
BOUY
ENN
– 5 Sites• Inlet (ENN)• Beach (EMB)• Buoy near drinking water intake
(BOUY)• Drinking water intake – Surface (EFLS)• Drinking water intake – Intake at depth
(EFLS)
– Weekly sampling March-November– 3x/week during observed bloom– Bi-hourly sampling for 4 hours on
representative days
13
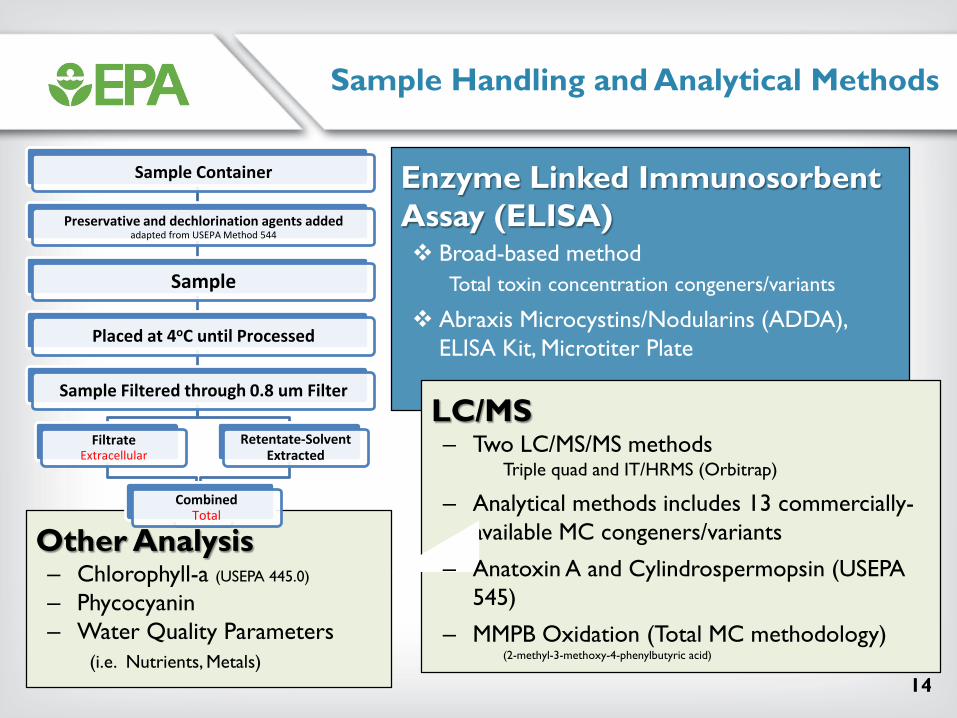
Sample Handling and Analytical Methods
Sample Container
Preservative and dechlorination agents added adapted from USEPA Method 544
Sample
Placed at 4oC until Processed
Sample Filtered through 0.8 um Filter
Filtrate Extracellular
Retentate-Solvent Extracted
Combined Total
Other Analysis – Chlorophyll-a (USEPA 445.0)
– Phycocyanin– Water Quality Parameters
(i.e. Nutrients, Metals)
Enzyme Linked Immunosorbent Assay (ELISA) Broad-based method
Total toxin concentration congeners/variants
Abraxis Microcystins/Nodularins (ADDA),ELISA Kit, Microtiter Plate
LC/MS – Two LC/MS/MS methods
Triple quad and IT/HRMS (Orbitrap)
– Analytical m ethods includes 13 commercially-available MC congeners/variants
– Anatoxin A and Cylindrospermopsin (USEPA545)
– MMPB Oxidation (Total M C methodology)(2-methyl-3-methoxy-4-phenylbutyric acid)
14

y Parameters
Microcystin Analytical Methods
Mass Spectroscopy
Algaltoxin Formula Mmi of Measured
Species [M+H]+ (Da)
Microcystin LF C52H71N7O12 986.523 Microcystin LR C49H74N10O12 995.556 Microcystin LW C54H72N8O12 1025.532 Microcystin LY C52H71N7O13 1002.518 Microcystin RR C49H75N13O12 519.792c
Microcystin WR C54H73N11O12 1068.543 Microcystin YR C52H72N10O13 1045.535 Nodularin C41H60N8O10 825.450 [D-Asp3-(E)-Hhb7] Microcystin-HphR C52H72N10O12 1029.540 [D-Asp3-(E)-Dhb7] Microcystin-RR C48H73N13O12 512.786c
Microcystin-N-Methyl-LR C50H76N10O12 1009.572 Microcystin-HilR C50H76N10O12 1009.572 Microcystin-HtyR C53H74N10O13 1059.551 [D-Asp3] Microcystin-RR C48H73N13O12 1024.557 [D-Asp3] Microcystin-LR C48H72N10O12 981.540
o LC-IT/HRMS (Orbitrap)o Dionex Ultimate 3000 UPLC
o 3400RS Analytical Pump o 3400SD Loading Pump o Equan Autosampler
o Thermo Discovery Orbitrapo MS/MS product scan o Primary and confirmatory ions observedo Internal standards added to samples and standardso 8 point standard curve used (0.0 to 1000 ppt)
o Internal Standardso 13C,15N2 17-Amino Geldanamycin (225 ng/L)o Clarithromycin (56.25 ng/L)o 13C6-Paclitaxel (562.5 ng/L)o Tacrolimus (56.25 ng/L)o Virustomycin A (1125 ng/L)o d5-Atrazine (45 ng/L)
15
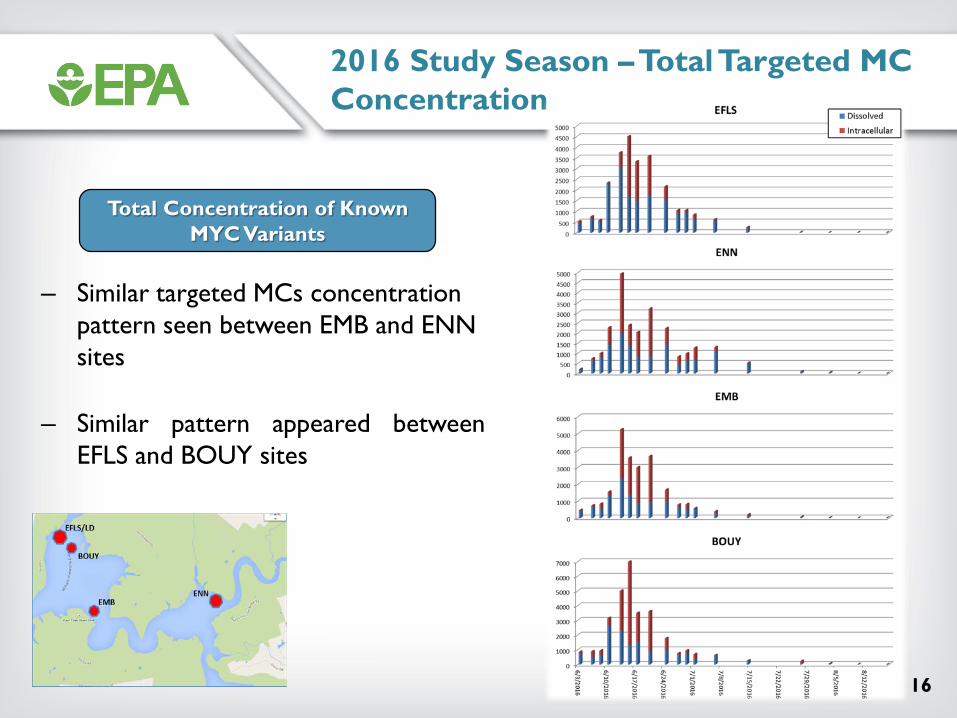
2016 Study Season – Total Targeted MC Concentration
Total Concentration of Known MYC Variants
– Similar targeted MCs concentrationpattern seen between EMB and ENNsites
– Similar pattern appeared betweenEFLS and BOUY sites
16
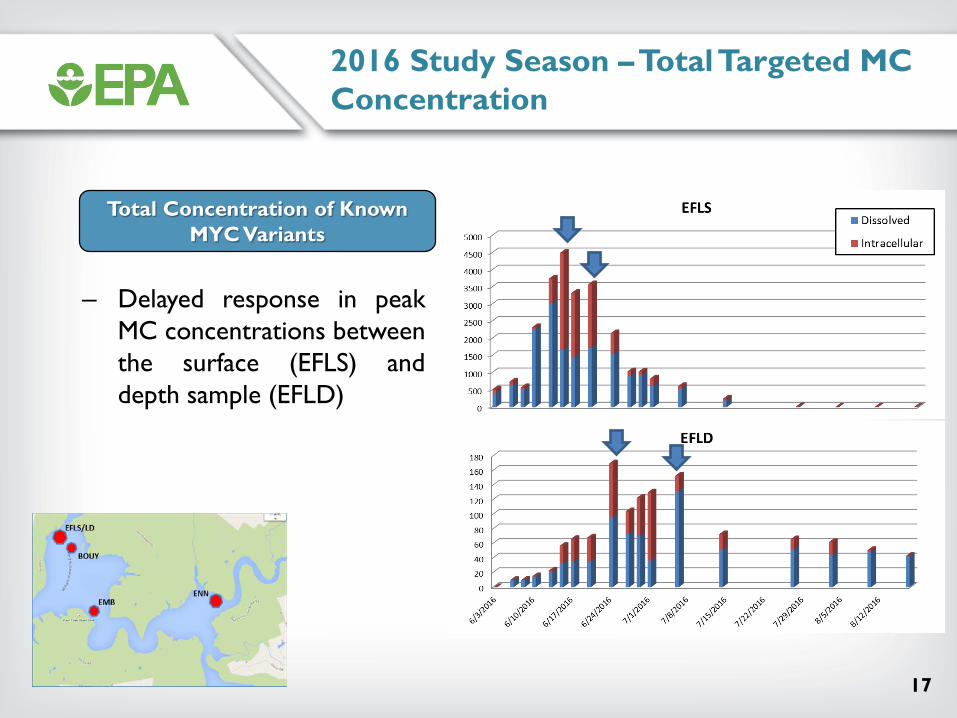
2016 Study Season – Total Targeted MC Concentration
Total Concentration of Known MYC Variants
– Delayed response in peak MC concentrations between the surface (EFLS) and depth sample (EFLD)
17

2017 Lake Harsha Monitoring Study –Comparing Methodologies
BOUY Site Fixed Camera Station
Fixed Camera Prediction of Cyanobacteria
July 18th at 10:30 am
Satellite Imaging
Estimated Cell Counts
July 18th at 10:49 am
EFLD/EFLS = 1,023,293 cells/ml • Camera Prediction: BUOY = 676,083 cells/ml • 10:30 am - 98.3% Probability of Bluegreens EMB = 323,594 cells/ml • 11:30 am 100% Probability of Bluegreens ENN = 1,258,925 cells/m
Courtesy of Jim Lazorchak/Blake Schaeffer 18
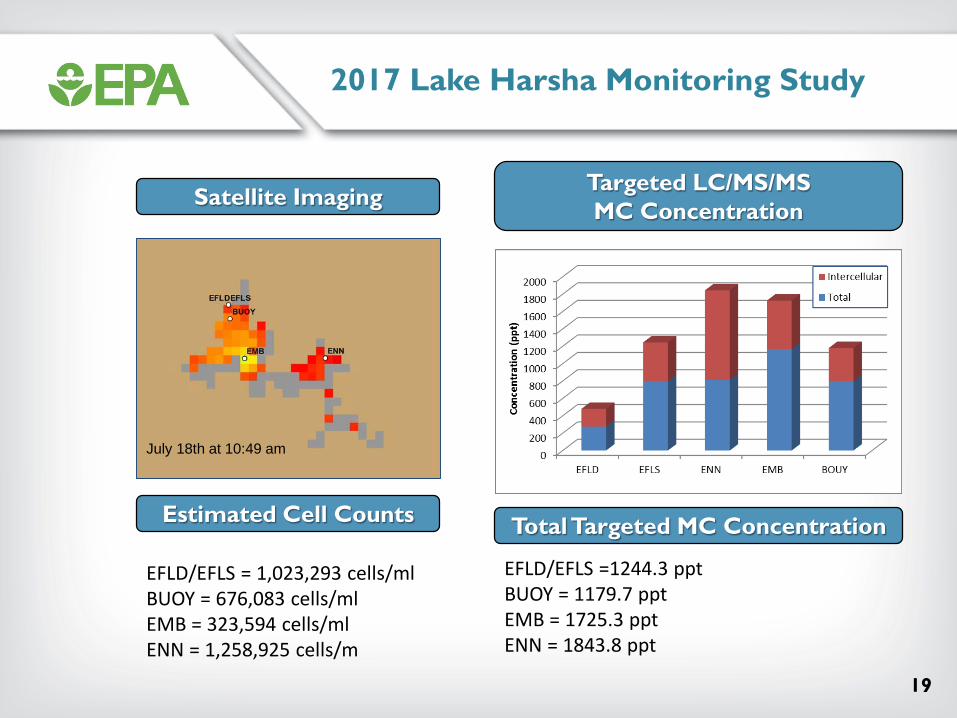
2017 Lake Harsha Monitoring Study
Targeted LC/MS/MS MC Concentration
Total Targeted MC Concentration
EFLD/EFLS =1244.3 ppt EFLD/EFLS = 1,023,293 cells/ml
Satellite Imaging
Estimated Cell Counts
July 18th at 10:49 am
BUOY = 1179.7 ppt BUOY = 676,083 cells/ml EMB = 1725.3 ppt EMB = 323,594 cells/ml ENN = 1843.8 ppt ENN = 1,258,925 cells/m
19

OEPA Lake Erie Drinking Water Treatment PlantStudy
Lake Erie Drinking Water Treatment Plant Study
20
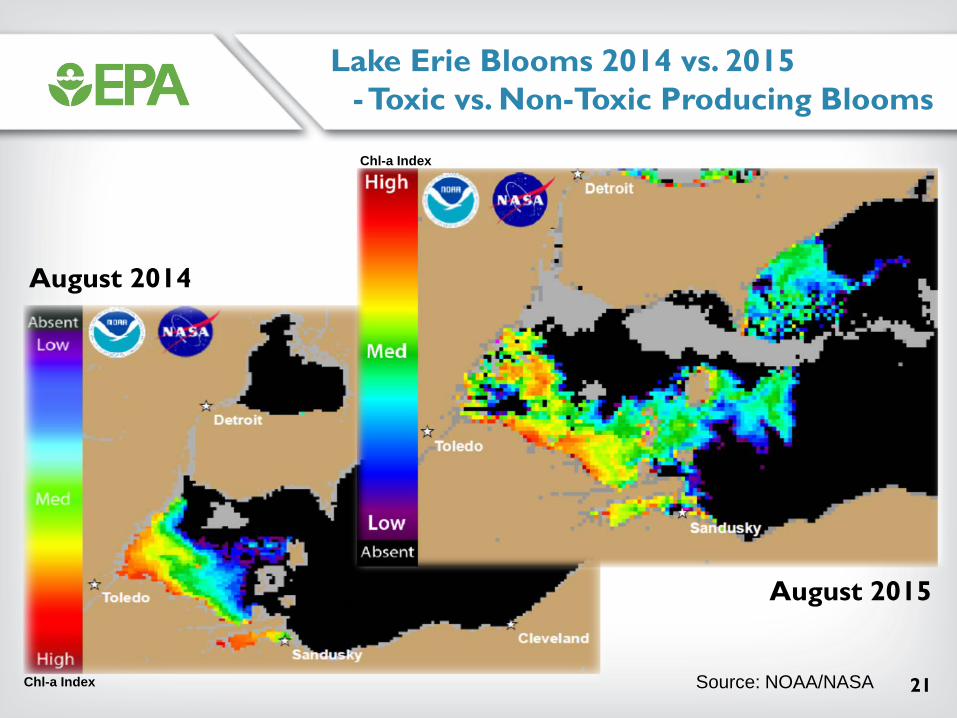
Lake Erie Blooms 2014 vs. 2015 -Toxic vs. Non-Toxic Producing Blooms
August 2014
Chl-a Index
Chl-A Index
Chl-a Index
August 2015
Source: NOAA/NASA 21
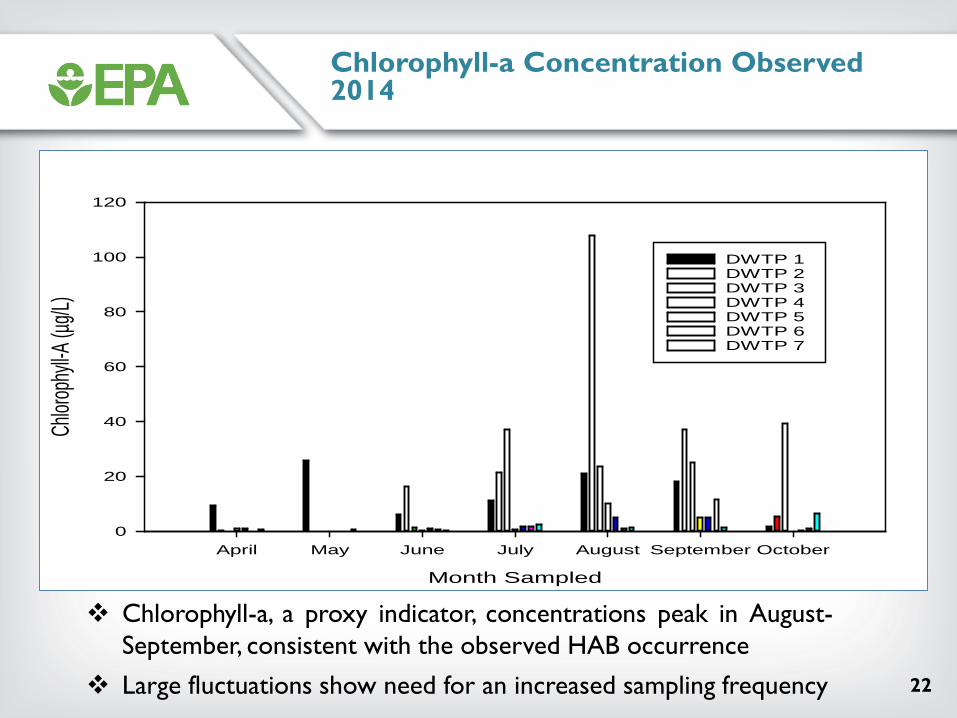
Chlorophyll-a Concentration Observed2014
Month Sampled
April May June July August September October
Chlor
ophyl
l-A (µ
g/L)
0
20
40
60
80
100
120
DWTP 1 DWTP 2 DWTP 3 DWTP 4 DWTP 5 DWTP 6 DWTP 7
Chlorophyll-a, a proxy indicator, concentrations peak in August-September, consistent with the observed HAB occurrence
Large fluctuations show need for an increased sampling frequency 22

Toledo
Oregon
Ottawa
Sandusky
ClevelandAshtabula
Toledo
Oregon
Ottawa
Sandusky
ClevelandAshtabula
Nutrient and Bloom Event Flux 2014
Inor
gani
c ni
troge
n (m
g/L
as N
)
4
3
2
1
0
Nitrogen
Plant 3 Plant 1 Plant 5 Plant 2 Plant 7 Plant 8
t rlyne s er e eru b bJu Ju gu m ctob
emA te O voepS N
110
100
90
80
70
60
50
40
30
20
10
0
Chlo
roph
yll A
(ppb
)
Plant 3 Plant 1 Plant 5 Plant 2 Plant 7 Plant 8
tlyne suJu Ju guA
Chlorophyll-a
er erb ber bm ote ct emO voepS N
Western basin intakes had Western basin intakes had higher nutrient loadings in higher blooms levels later
early summer in summer
23
110
Seasonal Bloom Dynamics
Apr May Jun Jul Aug Sep Oct Nov
Chl
orop
hyll
(µg/
L)
0
10
20
30
40
50
60
70
80
90
100
110
0
10
20
30
40
50
60
70
80
90
100 Plant 2: 2013 bloom season Plant 2: 2014 bloom season
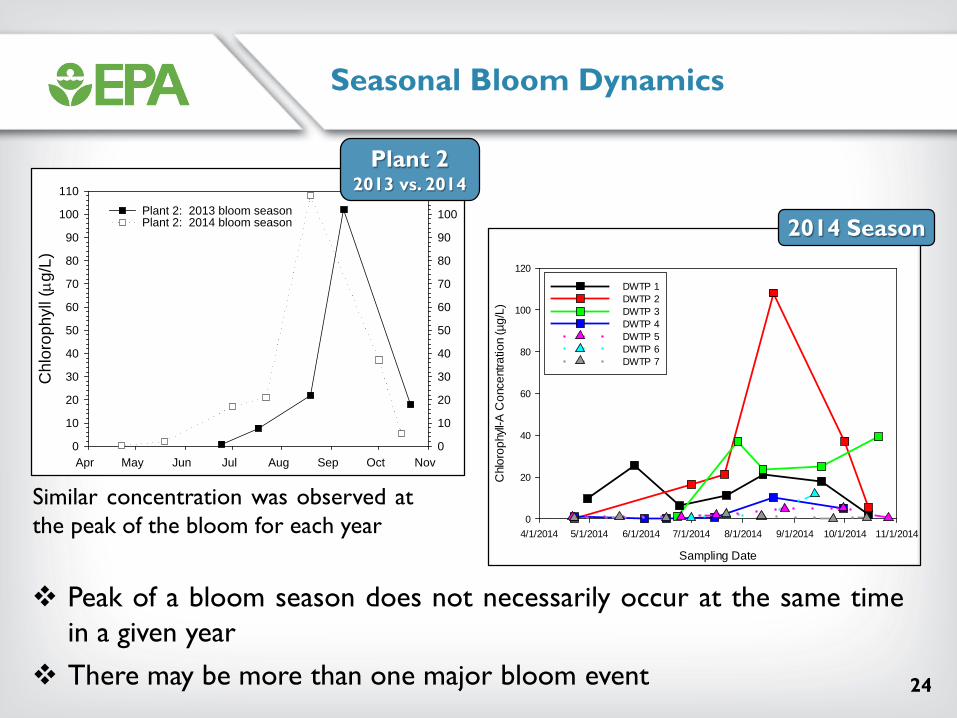
Similar concentration was observed at the peak of the bloom for each year
Plant 2 2013 vs. 2014
Sampling Date
4/1/2014 5/1/2014 6/1/2014 7/1/2014 8/1/2014 9/1/2014 10/1/2014 11/1/2014
Chl
orop
hyll-
A C
once
ntra
tion
(µg/
L)0
20
40
60
80
100
120
DWTP 1 DWTP 2 DWTP 3 DWTP 4 DWTP 5 DWTP 6 DWTP 7
2014 Season
Peak of a bloom season does not necessarily occur at the same time in a given year
There may be more than one major bloom event 24
w uent
hed 4 PAC
uent nORa sM l lff ff nit s E E it Po Fos er erP i tf li iFarlC
DWTP 1 DWTP 2 DWTP 3 DWTP 4 DWTP 5 DWTP 6 DWTP 7
Peak Event
Chlor
ophy
ll a (µ
g/L)
100
10
1
0.1
0.01
0.001
Chlorophyll-a Conc. Indicate Biomass is Effectively Removed Post-Clarification
Raw
Post MnO4
PostPAC
Clarifie
r eff
Filter e
ff
Finished
Chl
orop
hyll
a (u
g/L)
0.001
0.01
0.1
1
10
100
May 19 July 1 July 21
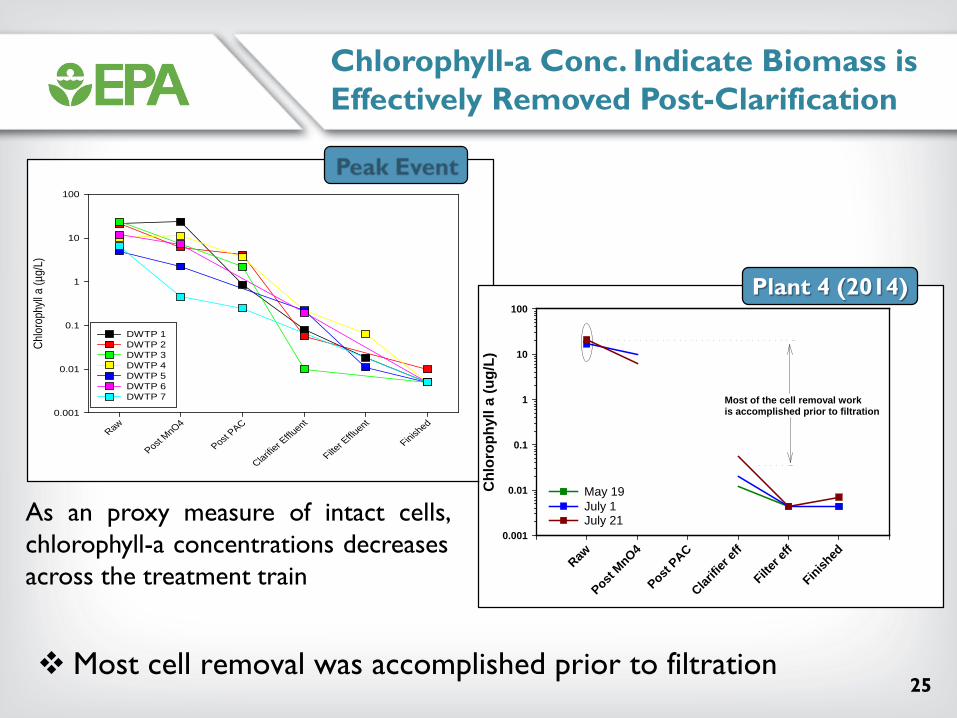
Most of the cell removal work is accomplished prior to filtration
Plant 4 (2014)
As an proxy measure of intact cells, chlorophyll-a concentrations decreases across the treatment train
Most cell removal was accomplished prior to filtration 25

Toxin
Con
cent
ratio
n by
LC/
MS/
MS
(µg/
L)
0
2
4
6
8
10
Extracellular Toxin Total Toxin
Release
LC-MS/MS
Raw Post-MnO4 Post-PAC Filter Influent Filter Effluent Plant Tap
Treatment Stage
Treatment Stage
Raw Post-MnO4 Post-PAC Filter Influent Filter Effluent Plant Tap
Toxi
n C
once
ntra
tion
by E
LISA
(µg/
L)
0
20
40
60
80
100
120
Extracellular Toxin Total Toxin
Release
Credit: Nick Dugan USEPA
ELISA
Toxin Propagation through DWTP - ELISA vs LC-MS/MS
Intracellular toxin release following MnO4 addition Added at crib intake, some residency/ contact time occurs before entering at the head of the treatment train
- Zebra mussel and taste & odor control
Unlike ELISA, total MYC measured by LCMS/MS decreases after MnO4 addition
- However, only 8 MYC (and NOD) variants were measured
26
[MCs
] by
LC/M
S/M
S an
d M
MPB
, ug/
L
8000
7000
6000
5000
4000
3000
2000
1000
0
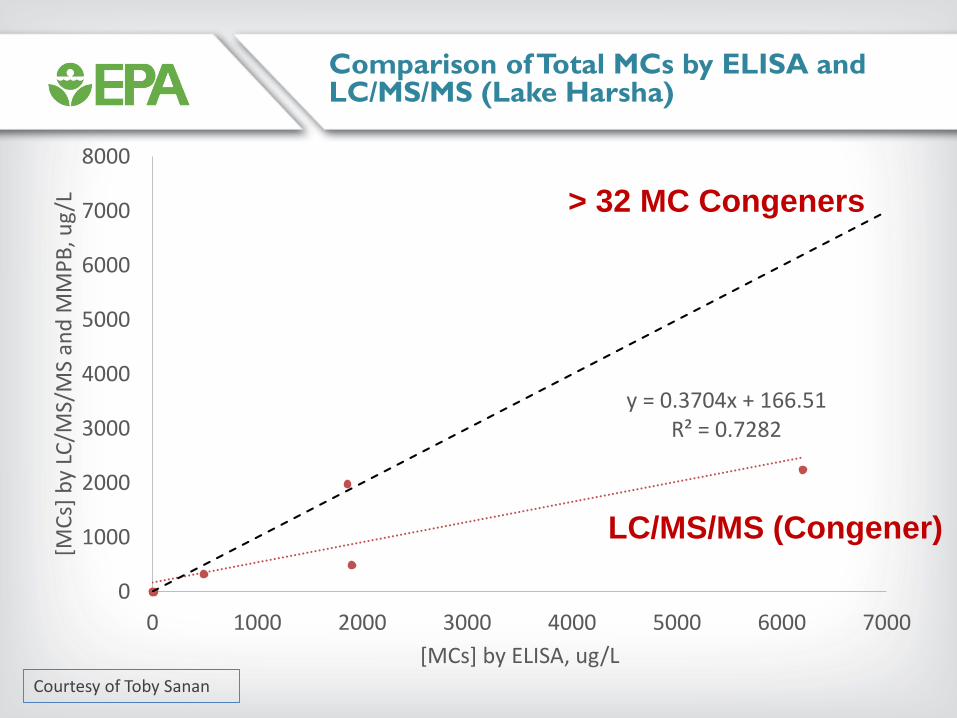
y = 0.3704x + 166.51 R² = 0.7282
LC/MS/MS (Congener)
> 32 MC Congeners
0 1000 2000 3000 4000 5000 6000 7000 [MCs] by ELISA, ug/L
Courtesy of Toby Sanan
Comparison of Total MCs by ELISA and LC/MS/MS (Lake Harsha)
Comparison of Total MCs by ELISA and LC/MS/MS (Lake Harsha)
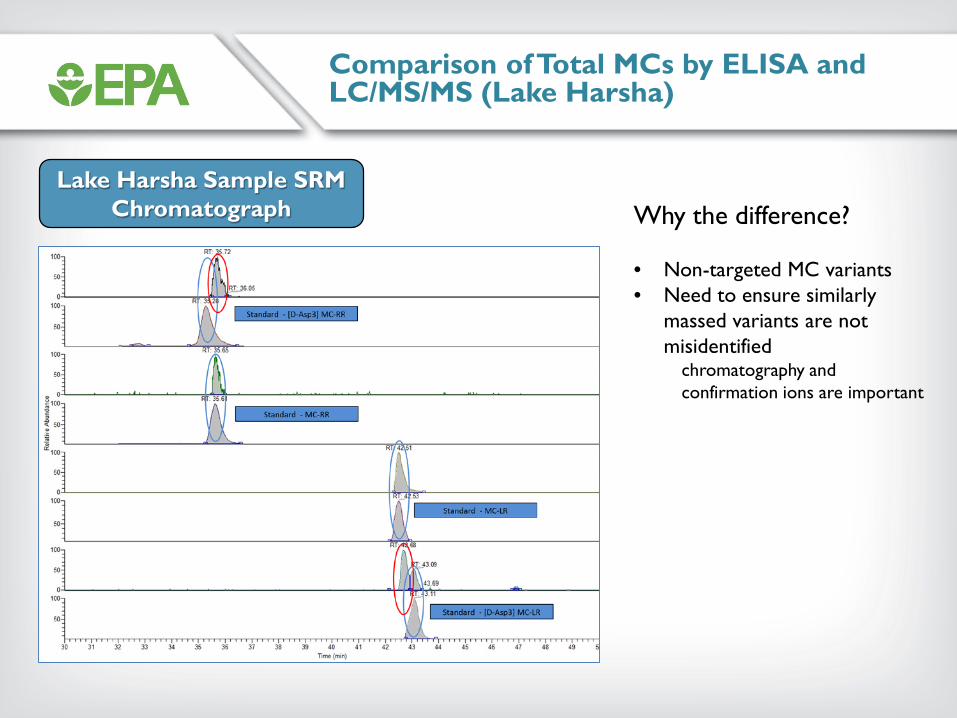
Lake Harsha Sample SRM Chromatograph Why the difference?
• Non-targeted MC variants • Need to ensure similarly
massed variants are not misidentified
chromatography and confirmation ions are important
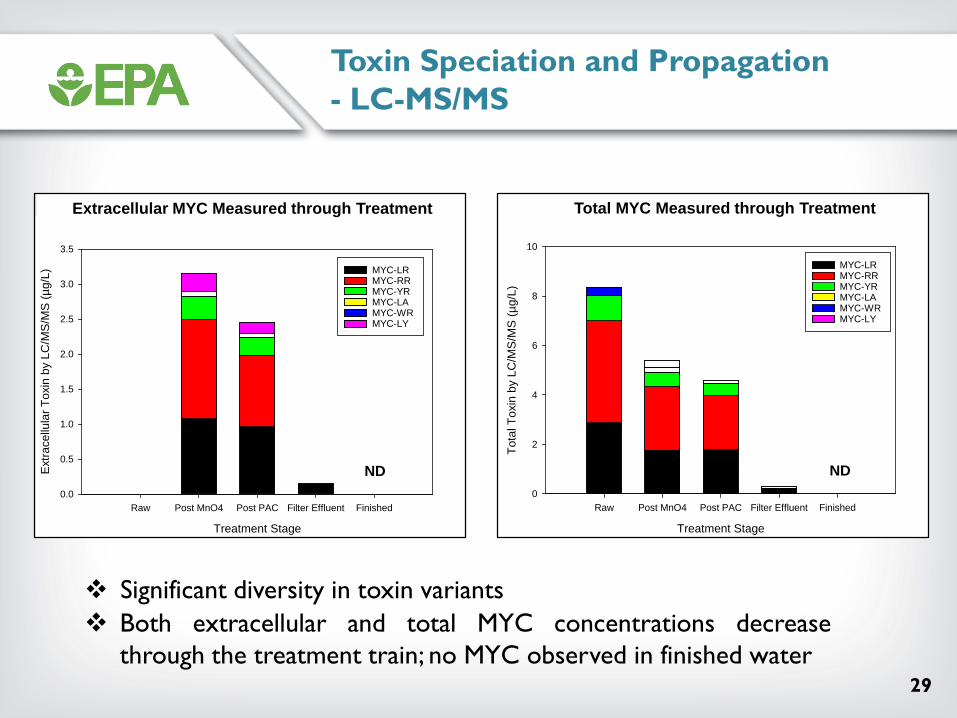
ND ND ND
Total Toxin Measurements Through Treatment by LC/MS/MS
Extracellular Toxin Measurements Through Treatment by LC/MS/MS
Toxin Speciation and Propagation - LC-MS/MS
Treatment Stage
Raw Post MnO4 Post PAC Filter Effluent Finished To
tal T
oxin
by
LC/M
S/M
S (µ
g/L)
0
2
4
6
8
10
MYC-LR MYC-RR MYC-YR MYC-LA MYC-WR MYC-LY
Total MYC Measured through Treatment
Treatment Stage
Raw Post MnO4 Post PAC Filter Effluent Finished
Extra
cellu
lar T
oxin
by
LC/M
S/M
S (µ
g/L)
0.0
0.5
1.0
1.5
2.0
2.5
3.0
3.5
MYC-LR MYC-RR MYC-YR MYC-LA MYC-WR MYC-LY
Extracellular MYC Measured through Treatment
NDND
Significant diversity in toxin variants Both extracellular and total MYC concentrations decrease
through the treatment train; no MYC observed in finished water 29
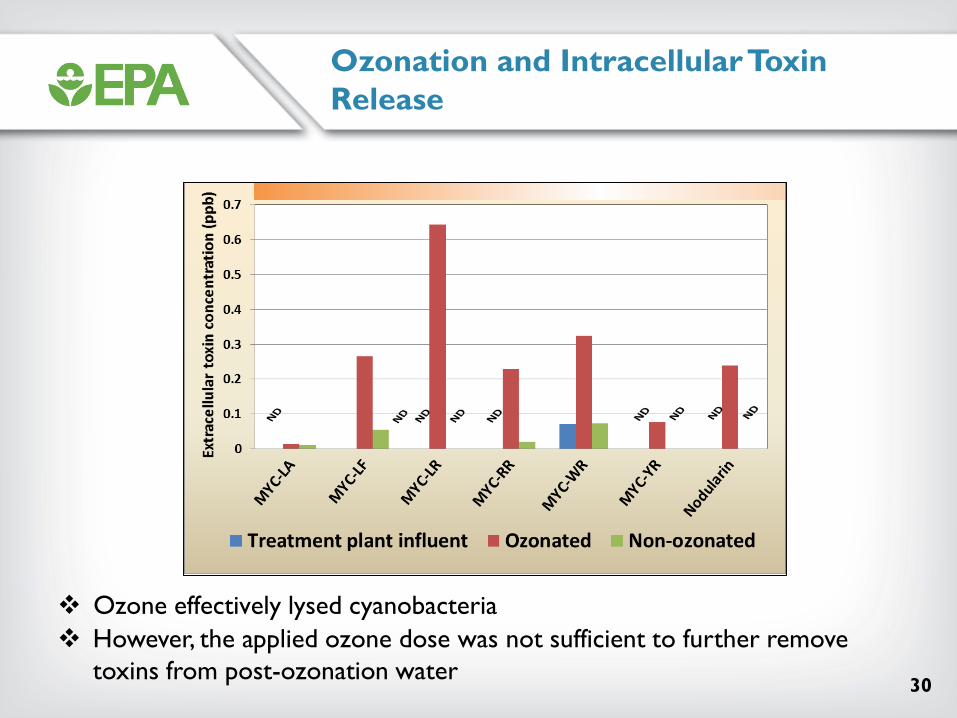
Ozonation and IntracellularToxin Release
Ozone effectively lysed cyanobacteria However, the applied ozone dose was not sufficient to further remove
toxins from post-ozonation water 30

OEPA Conclusions
Lake Erie water quality was significantly degraded in the western basin as compared to the eastern basin
The bulk of toxin in treatment facility influents was intracellular Therefore, if this holds true, a facility originally designed for particulate
control (conventional particulate removal strategies - coagulation, flocculation, sedimentation, filtration) are effective in removing biomass, hence intracellular toxins trapped within intact cells, and can serve as an effective barrier against exposure
Powdered activated carbon reduces the extracellular toxin - Treatment facilities are currently adding oxidants and powdered
activated carbon (PAC) at significant expense and uncertain effectiveness
Preliminary evidence indicates that common doses of oxidants (i.e. permanganate) are sufficiently high to damage cells and release toxins, yet may be too low to completely degrade the released toxin
More must be known about the formation and control of cyanobacteria and their toxins to assure safe drinking water 31
Special Thanks to: • The various Lake Erie DTWPs • Ohio EPA • Christy Muhlen, Maily Pham, Joel
Allen, Kit Daniels, Dana Macke, Toby Sanan
Questions?
EPA’s informational webpage http://www2.epa.gov/nutrient-policy-data/cyanobacterial-harmful-algal-blooms-cyanohabs
32