Embed Size (px)
Citation preview
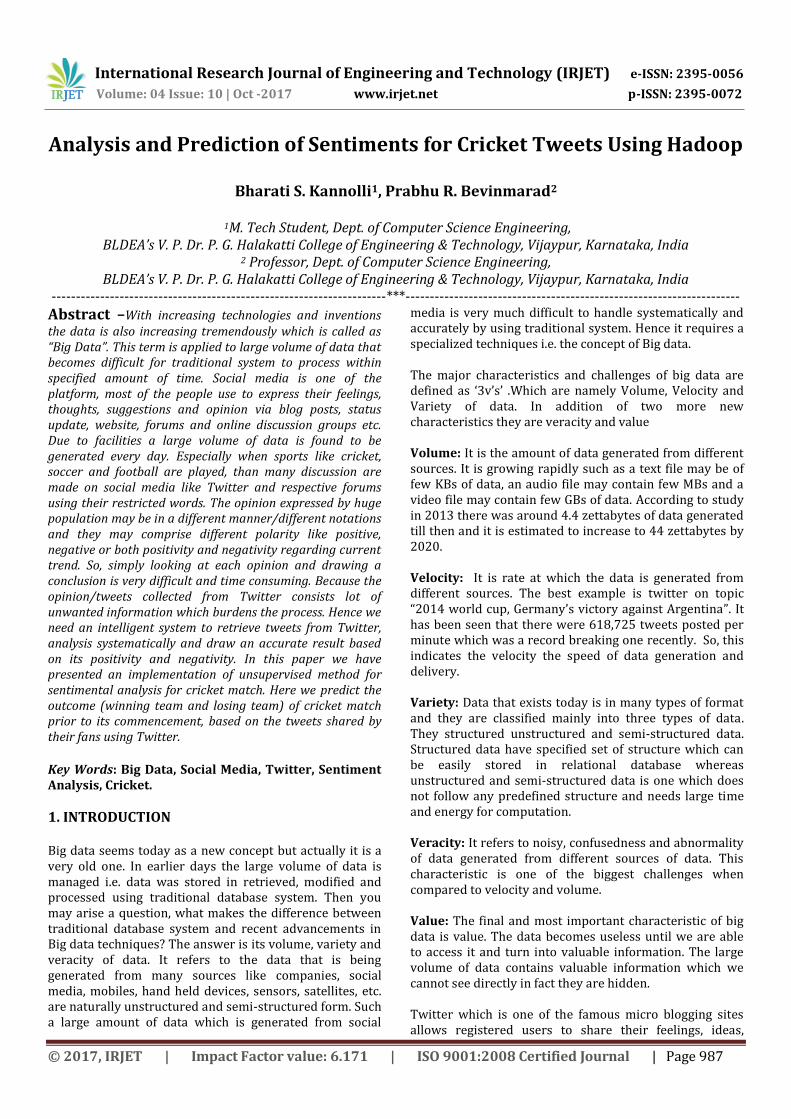
International Research Journal of Engineering and Technology (IRJET) e-ISSN: 2395-0056
Volume: 04 Issue: 10 | Oct -2017 www.irjet.net p-ISSN: 2395-0072
© 2017, IRJET | Impact Factor value: 6.171 | ISO 9001:2008 Certified Journal | Page 987
Analysis and Prediction of Sentiments for Cricket Tweets Using Hadoop
Bharati S. Kannolli1, Prabhu R. Bevinmarad2
1M. Tech Student, Dept. of Computer Science Engineering, BLDEA’s V. P. Dr. P. G. Halakatti College of Engineering & Technology, Vijaypur, Karnataka, India
2 Professor, Dept. of Computer Science Engineering, BLDEA’s V. P. Dr. P. G. Halakatti College of Engineering & Technology, Vijaypur, Karnataka, India
---------------------------------------------------------------------***---------------------------------------------------------------------
Abstract –With increasing technologies and inventions the data is also increasing tremendously which is called as “Big Data”. This term is applied to large volume of data that becomes difficult for traditional system to process within specified amount of time. Social media is one of the platform, most of the people use to express their feelings, thoughts, suggestions and opinion via blog posts, status update, website, forums and online discussion groups etc. Due to facilities a large volume of data is found to be generated every day. Especially when sports like cricket, soccer and football are played, than many discussion are made on social media like Twitter and respective forums using their restricted words. The opinion expressed by huge population may be in a different manner/different notations and they may comprise different polarity like positive, negative or both positivity and negativity regarding current trend. So, simply looking at each opinion and drawing a conclusion is very difficult and time consuming. Because the opinion/tweets collected from Twitter consists lot of unwanted information which burdens the process. Hence we need an intelligent system to retrieve tweets from Twitter, analysis systematically and draw an accurate result based on its positivity and negativity. In this paper we have presented an implementation of unsupervised method for sentimental analysis for cricket match. Here we predict the outcome (winning team and losing team) of cricket match prior to its commencement, based on the tweets shared by their fans using Twitter.
Key Words: Big Data, Social Media, Twitter, Sentiment Analysis, Cricket.
1. INTRODUCTION Big data seems today as a new concept but actually it is a very old one. In earlier days the large volume of data is managed i.e. data was stored in retrieved, modified and processed using traditional database system. Then you may arise a question, what makes the difference between traditional database system and recent advancements in Big data techniques? The answer is its volume, variety and veracity of data. It refers to the data that is being generated from many sources like companies, social media, mobiles, hand held devices, sensors, satellites, etc. are naturally unstructured and semi-structured form. Such a large amount of data which is generated from social
media is very much difficult to handle systematically and accurately by using traditional system. Hence it requires a specialized techniques i.e. the concept of Big data. The major characteristics and challenges of big data are defined as ‘3v’s’ .Which are namely Volume, Velocity and Variety of data. In addition of two more new characteristics they are veracity and value Volume: It is the amount of data generated from different sources. It is growing rapidly such as a text file may be of few KBs of data, an audio file may contain few MBs and a video file may contain few GBs of data. According to study in 2013 there was around 4.4 zettabytes of data generated till then and it is estimated to increase to 44 zettabytes by 2020. Velocity: It is rate at which the data is generated from different sources. The best example is twitter on topic “2014 world cup, Germany’s victory against Argentina”. It has been seen that there were 618,725 tweets posted per minute which was a record breaking one recently. So, this indicates the velocity the speed of data generation and delivery. Variety: Data that exists today is in many types of format and they are classified mainly into three types of data. They structured unstructured and semi-structured data. Structured data have specified set of structure which can be easily stored in relational database whereas unstructured and semi-structured data is one which does not follow any predefined structure and needs large time and energy for computation. Veracity: It refers to noisy, confusedness and abnormality of data generated from different sources of data. This characteristic is one of the biggest challenges when compared to velocity and volume. Value: The final and most important characteristic of big data is value. The data becomes useless until we are able to access it and turn into valuable information. The large volume of data contains valuable information which we cannot see directly in fact they are hidden. Twitter which is one of the famous micro blogging sites allows registered users to share their feelings, ideas,
International Research Journal of Engineering and Technology (IRJET) e-ISSN: 2395-0056
Volume: 04 Issue: 10 | Oct -2017 www.irjet.net p-ISSN: 2395-0072
© 2017, IRJET | Impact Factor value: 6.171 | ISO 9001:2008 Certified Journal | Page 988
opinion and thoughts etc. in short restricted number of characters. These messages are called as tweets. The Sentiment Analysis is a one of growing research field which allow us to analyse the people sentiment and feeling present in the text messages and draw the accurate conclusion. The analysed information further used by many companies in varieties of way. For example it allows companies to know sentiments of their customers towards their products, improve current working strategies, impose new policies and understand the client expectations etc. This is one of the toughest tasks because different people express different views in different ways. Until now many research work has been done in finding the sentiments from textual data generated from social media like Facebook, Twitter etc. to know the product reviews[1], movies reviews, etc. but very few research has been done on cricket matches and other sports. Now a days the sports and matches been played are discussed widely on social media especially on twitter. The Cricket match is a second most popular game after soccer and has millions of fans worldwide. They share their views and express their feelings. So, in this paper we will retrieve the tweets of cricket match and apply unsupervised algorithm to analyse predict the results of the cricket match. The remaining part of this paper is organised as follows. In section 2: Survey on recent work on sentimental analysis is presented. Section 3 and 4: consists of a short introduction to Hadoop, sentimental analysis and its lexicons. Section 5 comprises in detail the proposed approach for sentiment analysis. Finally section 6 includes the results and discussion.
2. SENTIMENT ANALYSIS APPROACHES There are mainly three types of approaches for sentiment analysis: (1) Machine learning based algorithms such as Naïve Bayes, S.V. M and KNN. (2) Classifying as unigrams or n-grams and assigning them positive and negative polarity (3) Using sentiment lexicons which classifies the words present i.e. positive, negative or neutral. Few even add their degree of sentiment to each word. In [2] P. D. Turney proposed a PMI-IR algorithm to classify the reviews on movies, banks, travelling areas, vehicles and he achieved the accuracy of 74% but among all movie reviews were found to be difficult to analyze because of annoying words present. In [3] S. Asur and B. A. Huberman considered movies for their studies to predict box office revenue. They were interested in finding how attentions are created in Twitter before the movie release. And predicted the box office revenues in the first weekend and also for given weekend. Finally results are compared with the Hollywood Stock Exchanges to check for the accuracy.
In [4] R. Piryani et al. presented a method for sentiment analysis, which are expressed from reviews of movies and blog posts. They considered are of two types data for analysis i.e. movie reviews and blog posts from Libya and Tunisia. Their main aim was to find out the performance of SentiWordNet approach using two main machine learning techniques. They are SVM and NB for sentiment classification. It was found that using Naive Bayes and SVM techniques approaches has better performance as compared to SentiWordNet approach. Also it was found that the performance level was not same for both movies reviews and blog posts using SVM and NB, whereas the performance is same in case of SentiWordNet for both varieties of datasets. In [5], the authors have discussed a machine learning and symbolic techniques for analyses of sentiments of any electronic items like PC, mobiles etc. Here they used a Twitter API to collect the tweets and then pre-processed to remove URL’s, misspellings and slang words. After that features related to emoticons and hash tags are extracted. Finally the extracted features are classified using machine learning techniques namely, Naïve Bayes, SVM, Maximum Entropy classifier, and Ensemble classifier. According to obtained result it is found that Naïve Bayes classification technique has gave a good precision over other classifiers. In [6], author A.H.A. Rahnama propose a system which works on streaming data. The pre-processing step of the proposed system stores the summarized data in the main memory. For pre-processing the data distributed system is used because to cope up with the streaming data, so that none are left unvisited or unattended. Sentinel system is used to support the distributed processing of data. The streaming data which used for preprocessing is generated by using Twitter API. Once data preprocessing is done the features are classified using different classifiers. Such as Vertical Hoeffding Tree as well as Multinomial Naïve Bayes. Finally their results are compared and it was found that vertical Hoeffding Tree gave faster and accurate results compared to Multinomial Naïve. In [7], author proposed a method to find out the sentiment from the social media. The proposed system uses various novel machine learning techniques such as NB, SVM and maximum entropy. The model was designed as a WEKA and SentiView tool which are widely used as a data visualization tools. In [8] authors, did a research on predicting the outcome of cricket match based on tweets collected from the twitter social media. The inputs were based on 2014 IPL match and 2015 world cup match. From them some linguistic features are extracted to predict three basic things: (1) No. of fan followers (2) No. of tweets (3) prediction of scores by classifying the tweets as positive, negative and neutral. Here they found that SVM technique gave more accurate results with accuracy 75%.
International Research Journal of Engineering and Technology (IRJET) e-ISSN: 2395-0056
Volume: 04 Issue: 10 | Oct -2017 www.irjet.net p-ISSN: 2395-0072
© 2017, IRJET | Impact Factor value: 6.171 | ISO 9001:2008 Certified Journal | Page 989
In [9] J. Chungand E. Mustafaraj proposed a system to predict the outcomes of the election by using the tweets tweeted on election held at Massachusetts in 2010. The proposed system uses SentiWordNet lexicons to increase the efficiency and obtained results with 80% accuracy. N. Azam et al. [10] presented a method to analyze the sentiment of the tweets by tokenizing them using n-gram technique. The features are extracted using Latent Dirichlet allocation and then the tweets are represented using vector space model. Also to find the dense regions the Markov clustering method is applied on the tweets and finally the author concluded that, they can achieve better results by using hybrid model.
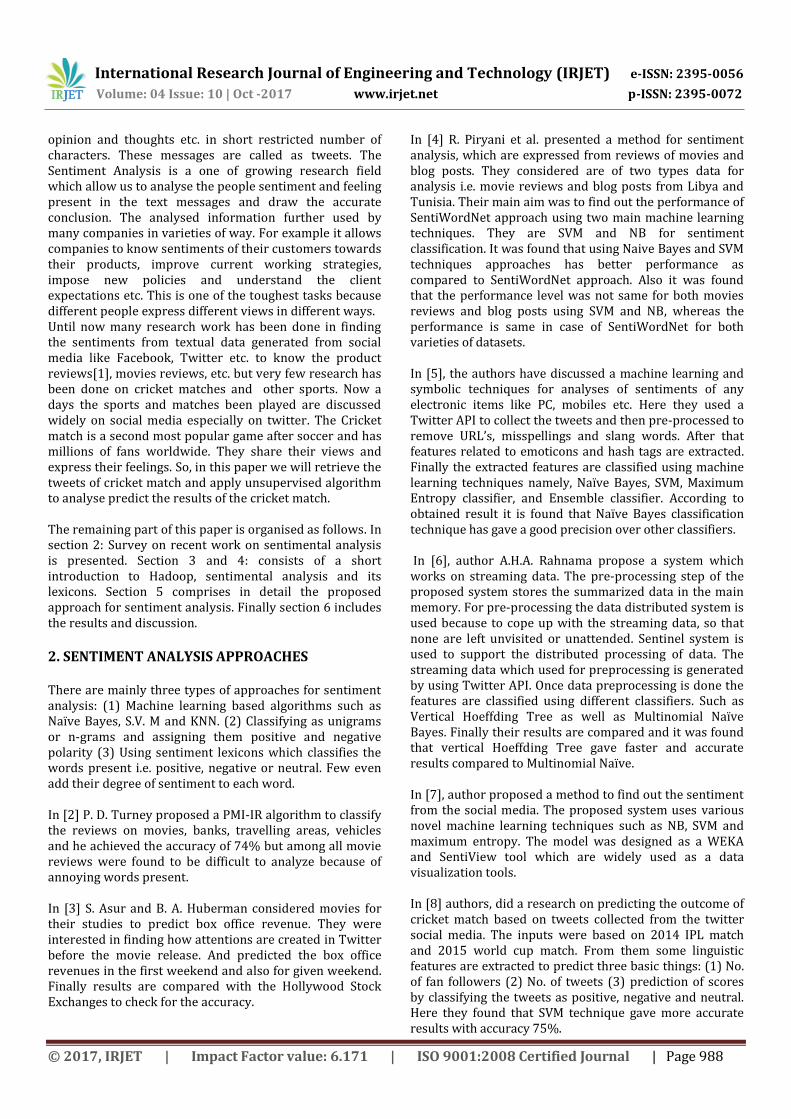
3. HADOOP Since the proposed system works on streaming tweets for a cricket match collected from twitter. We need some distributed system to handle streaming data. In traditional system it is difficult to process such type of data. Because for processing streaming data it requires slower data rate than processing. But this is not possible in traditional approach. So we need a distributed system which can work on streaming as well as unstructured data. Hadoop is a one of the open source platform widely used for analysis of big data. It solves the problems of big data by providing a flexible infrastructure for large scale computation and data processing on a network commodity of hardware systems. Hadoop works on map-reduce concept through master slave method. The map() function takes an input key/value pair and produces a list of intermediate key/value pairs. Intermediate pairs based on the intermediate keys and passes them to reduce () function for producing the final results.
Fig -1: Map-Reduce working through Master slave methodology
Name node acts as a master node manages the HDFS metadata and assigns task to data nodes which are slaves. The job tracker tracks whether the assigned work by master has been done by slaves or not. Finally the task tracker runs the map-reduce operation and gives the results.
4. SENTIMENT ANALYSIS Sentiment Analysis is the field of study used to find the sentiment, emotions, feelings and expression present in the textual data. It can be studied at three different levels: (1) Document level (2) Sentence level and (3) Entity level. In document level the whole document is analyzed to determine whether it produces positive or negative opinion. In sentence level sentiment analysis each sentence is checked to verify its opinion towards positive, negative and neutral. In case of entity level analysis the holder’s like or dislike about the target can be explored.
4.1. SENTIMENT LEXICONS A sentiment lexicon refers to a phrase or bag of words that gives us a negative or positive polarity based on the data. In sentimental analysis lexicons are essential resource which gives the information of the feelings about each word or
feature or linguistic unit. Till now many lexicons are developed and are used for different level of analysis. They are described as follow:
1) MPQA subjective lexicon: This is a part of MPQA
opinion corpus4. These are accessible under certain terms called as GNU License. It describes different entries, which signifies word, word length, polarity, strength and POS. This lexicon provides a wide range of information which helps in study of various fields.
2) SentiWordNet: In SentiWordNet lexicon each word sentiment scores are added to indicate the polarity for sentiment, which may be positive, negative and objective. Here each word may contain the speech information other than that its context information to enhance the structure of lexicon.
3) VADER Sentiment Lexicon6: These lexicons are especially used for sentimental analysis of data collected from social media and micro-blogging sites. Here the polarity and strength are provided to each for analysis purpose.
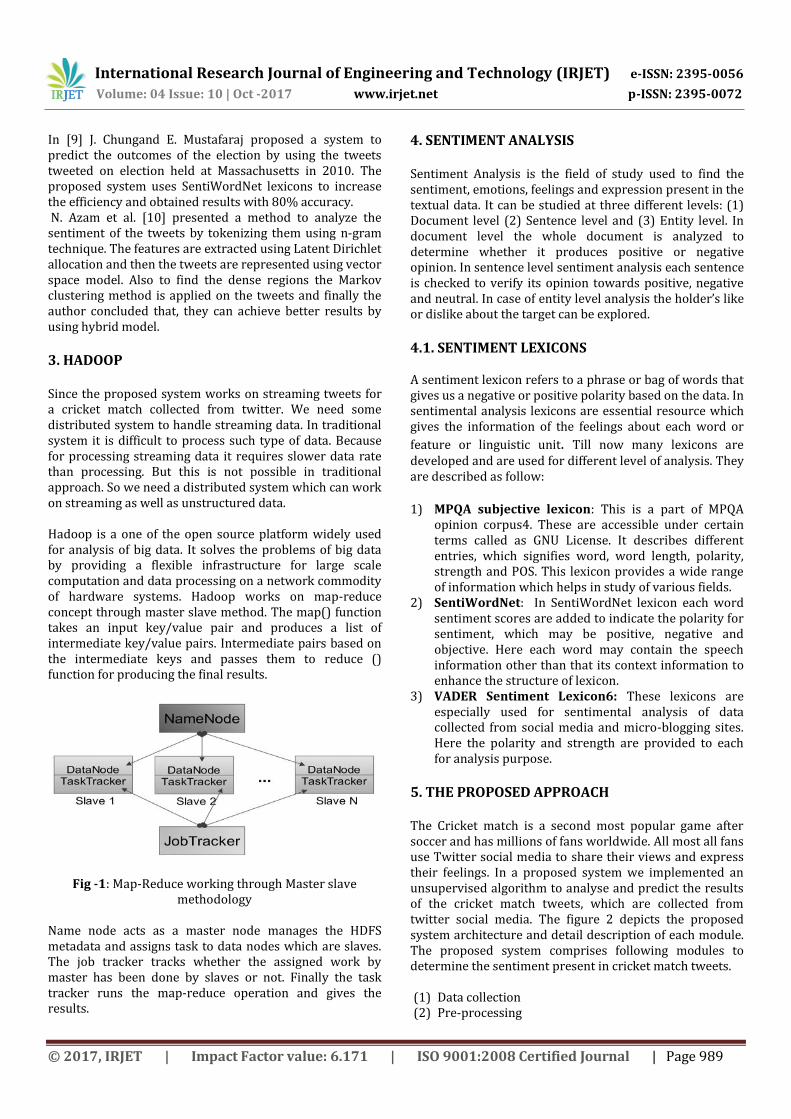
5. THE PROPOSED APPROACH The Cricket match is a second most popular game after soccer and has millions of fans worldwide. All most all fans use Twitter social media to share their views and express their feelings. In a proposed system we implemented an unsupervised algorithm to analyse and predict the results of the cricket match tweets, which are collected from twitter social media. The figure 2 depicts the proposed system architecture and detail description of each module. The proposed system comprises following modules to determine the sentiment present in cricket match tweets. (1) Data collection (2) Pre-processing
International Research Journal of Engineering and Technology (IRJET) e-ISSN: 2395-0056
Volume: 04 Issue: 10 | Oct -2017 www.irjet.net p-ISSN: 2395-0072
© 2017, IRJET | Impact Factor value: 6.171 | ISO 9001:2008 Certified Journal | Page 990
(3) Sentiment Classification (4) Sentiment Analysis
Fig -2: System architecture of proposed system
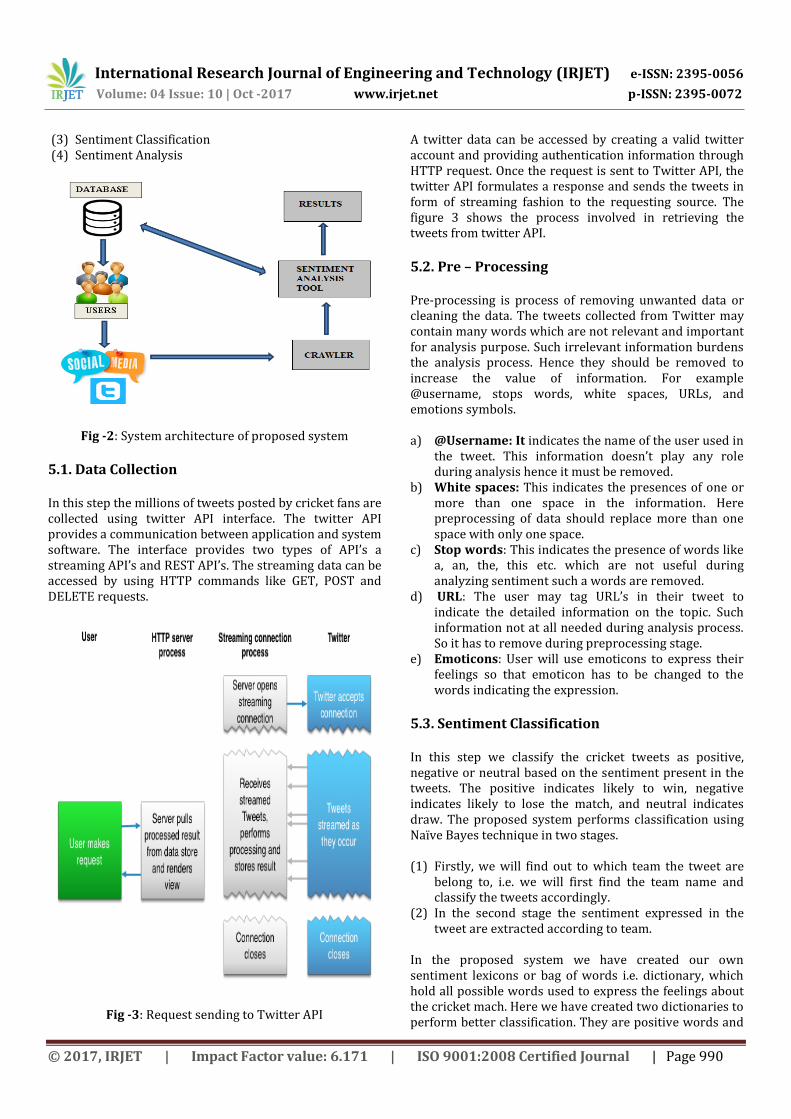
5.1. Data Collection In this step the millions of tweets posted by cricket fans are collected using twitter API interface. The twitter API provides a communication between application and system software. The interface provides two types of API’s a streaming API’s and REST API’s. The streaming data can be accessed by using HTTP commands like GET, POST and DELETE requests.
Fig -3: Request sending to Twitter API
A twitter data can be accessed by creating a valid twitter account and providing authentication information through HTTP request. Once the request is sent to Twitter API, the twitter API formulates a response and sends the tweets in form of streaming fashion to the requesting source. The figure 3 shows the process involved in retrieving the tweets from twitter API.
5.2. Pre – Processing Pre-processing is process of removing unwanted data or cleaning the data. The tweets collected from Twitter may contain many words which are not relevant and important for analysis purpose. Such irrelevant information burdens the analysis process. Hence they should be removed to increase the value of information. For example @username, stops words, white spaces, URLs, and emotions symbols. a) @Username: It indicates the name of the user used in
the tweet. This information doesn’t play any role during analysis hence it must be removed.
b) White spaces: This indicates the presences of one or more than one space in the information. Here preprocessing of data should replace more than one space with only one space.
c) Stop words: This indicates the presence of words like a, an, the, this etc. which are not useful during analyzing sentiment such a words are removed.
d) URL: The user may tag URL’s in their tweet to indicate the detailed information on the topic. Such information not at all needed during analysis process. So it has to remove during preprocessing stage.
e) Emoticons: User will use emoticons to express their feelings so that emoticon has to be changed to the words indicating the expression.
5.3. Sentiment Classification In this step we classify the cricket tweets as positive, negative or neutral based on the sentiment present in the tweets. The positive indicates likely to win, negative indicates likely to lose the match, and neutral indicates draw. The proposed system performs classification using Naïve Bayes technique in two stages. (1) Firstly, we will find out to which team the tweet are
belong to, i.e. we will first find the team name and classify the tweets accordingly.
(2) In the second stage the sentiment expressed in the tweet are extracted according to team.
In the proposed system we have created our own sentiment lexicons or bag of words i.e. dictionary, which hold all possible words used to express the feelings about the cricket mach. Here we have created two dictionaries to perform better classification. They are positive words and
International Research Journal of Engineering and Technology (IRJET) e-ISSN: 2395-0056
Volume: 04 Issue: 10 | Oct -2017 www.irjet.net p-ISSN: 2395-0072
© 2017, IRJET | Impact Factor value: 6.171 | ISO 9001:2008 Certified Journal | Page 991
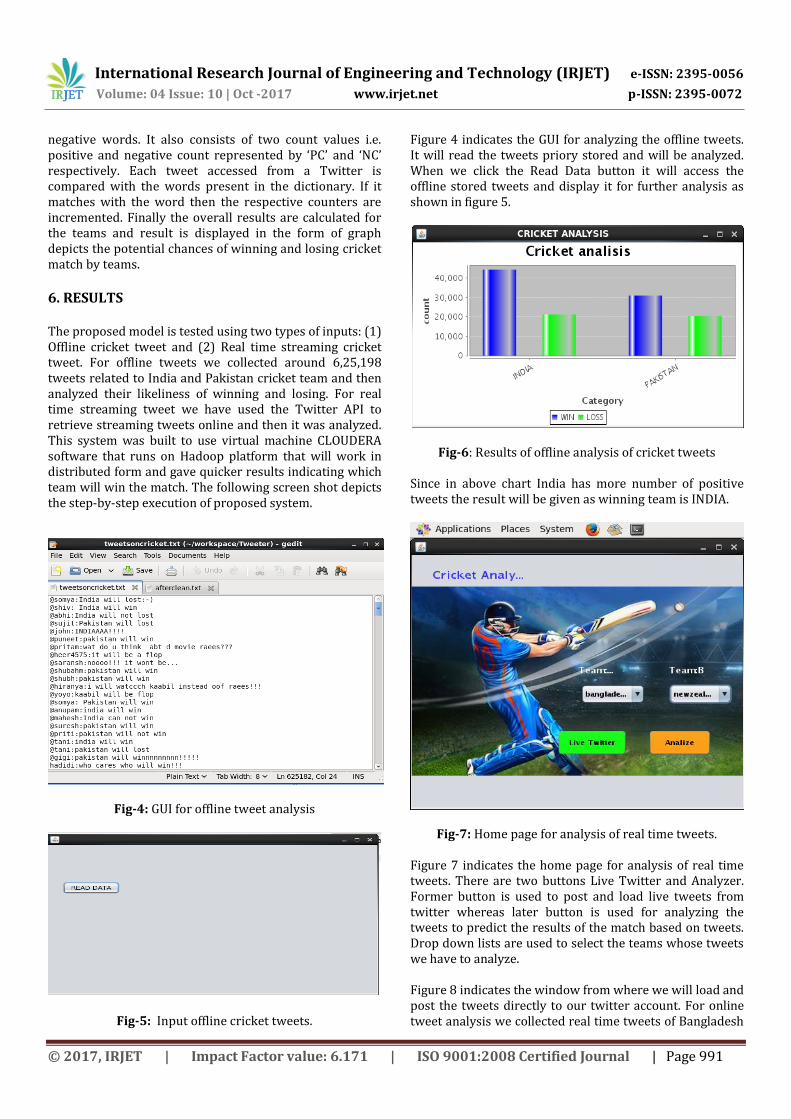
negative words. It also consists of two count values i.e. positive and negative count represented by ‘PC’ and ‘NC’ respectively. Each tweet accessed from a Twitter is compared with the words present in the dictionary. If it matches with the word then the respective counters are incremented. Finally the overall results are calculated for the teams and result is displayed in the form of graph depicts the potential chances of winning and losing cricket match by teams.
6. RESULTS The proposed model is tested using two types of inputs: (1) Offline cricket tweet and (2) Real time streaming cricket tweet. For offline tweets we collected around 6,25,198 tweets related to India and Pakistan cricket team and then analyzed their likeliness of winning and losing. For real time streaming tweet we have used the Twitter API to retrieve streaming tweets online and then it was analyzed. This system was built to use virtual machine CLOUDERA software that runs on Hadoop platform that will work in distributed form and gave quicker results indicating which team will win the match. The following screen shot depicts the step-by-step execution of proposed system.
Fig-4: GUI for offline tweet analysis
Fig-5: Input offline cricket tweets.
Figure 4 indicates the GUI for analyzing the offline tweets. It will read the tweets priory stored and will be analyzed. When we click the Read Data button it will access the offline stored tweets and display it for further analysis as shown in figure 5.
Fig-6: Results of offline analysis of cricket tweets
Since in above chart India has more number of positive tweets the result will be given as winning team is INDIA.
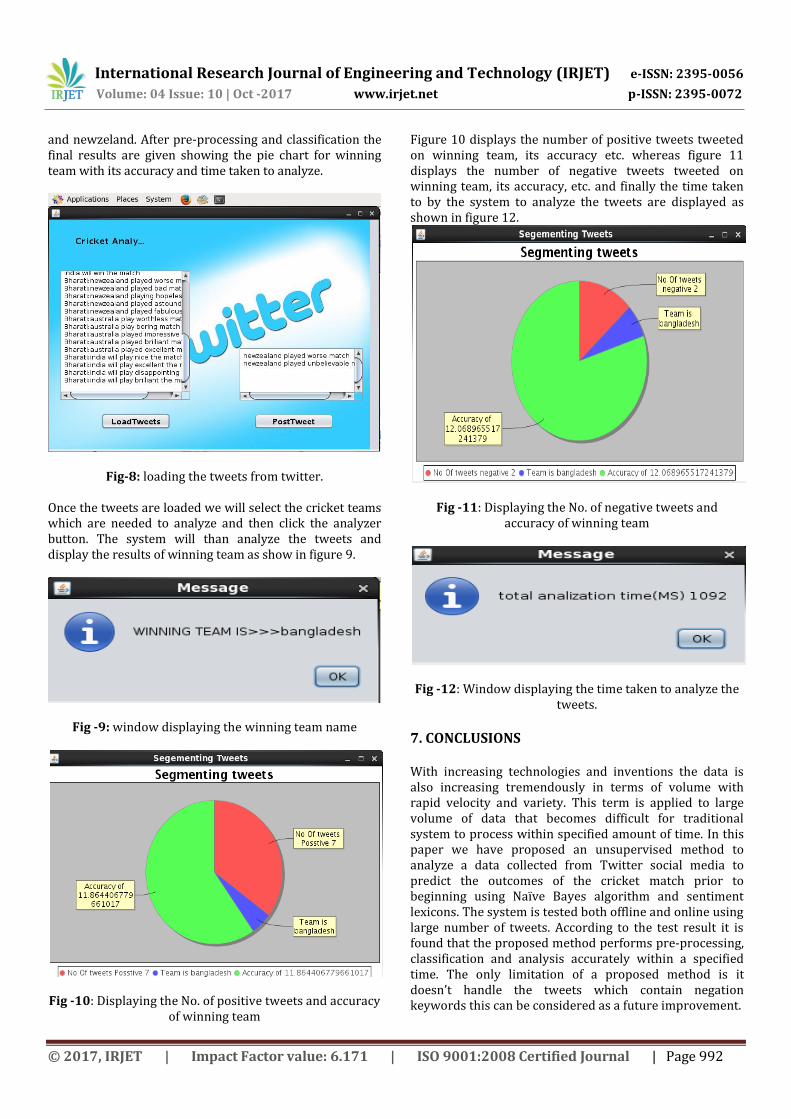
Fig-7: Home page for analysis of real time tweets. Figure 7 indicates the home page for analysis of real time tweets. There are two buttons Live Twitter and Analyzer. Former button is used to post and load live tweets from twitter whereas later button is used for analyzing the tweets to predict the results of the match based on tweets. Drop down lists are used to select the teams whose tweets we have to analyze. Figure 8 indicates the window from where we will load and post the tweets directly to our twitter account. For online tweet analysis we collected real time tweets of Bangladesh
International Research Journal of Engineering and Technology (IRJET) e-ISSN: 2395-0056
Volume: 04 Issue: 10 | Oct -2017 www.irjet.net p-ISSN: 2395-0072
© 2017, IRJET | Impact Factor value: 6.171 | ISO 9001:2008 Certified Journal | Page 992
and newzeland. After pre-processing and classification the final results are given showing the pie chart for winning team with its accuracy and time taken to analyze.
Fig-8: loading the tweets from twitter.
Once the tweets are loaded we will select the cricket teams which are needed to analyze and then click the analyzer button. The system will than analyze the tweets and display the results of winning team as show in figure 9.
Fig -9: window displaying the winning team name
Fig -10: Displaying the No. of positive tweets and accuracy of winning team
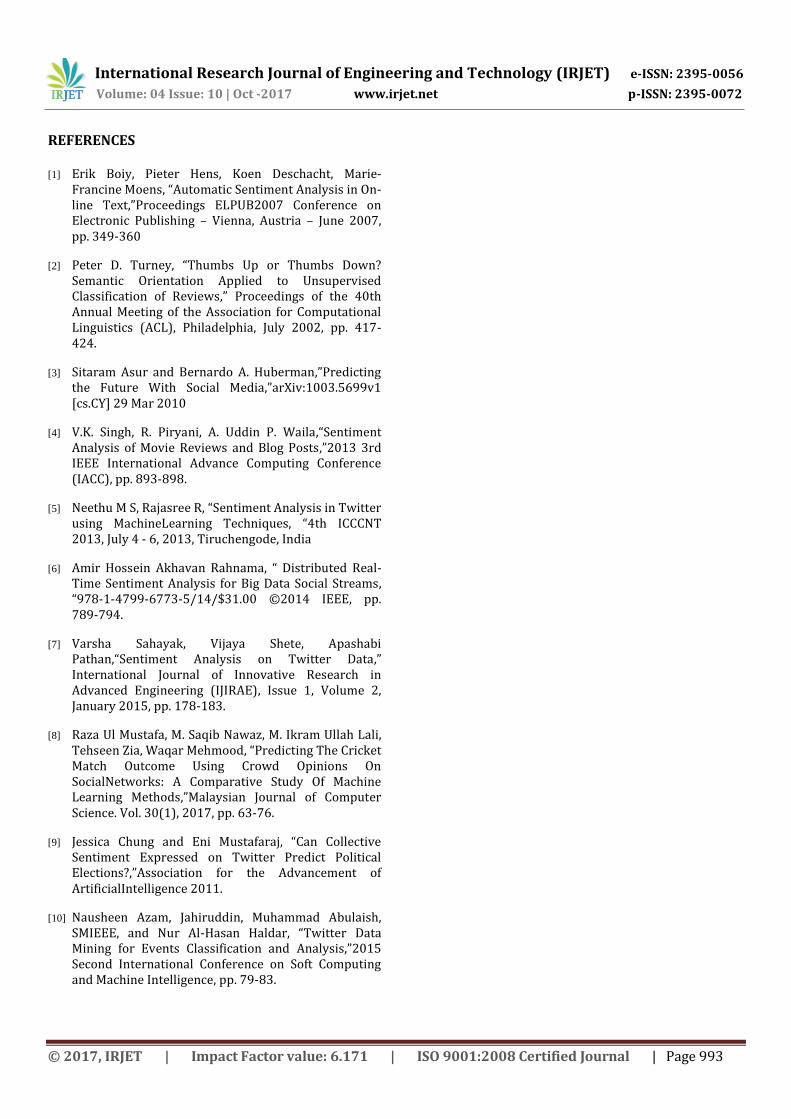
Figure 10 displays the number of positive tweets tweeted on winning team, its accuracy etc. whereas figure 11 displays the number of negative tweets tweeted on winning team, its accuracy, etc. and finally the time taken to by the system to analyze the tweets are displayed as shown in figure 12.
Fig -11: Displaying the No. of negative tweets and accuracy of winning team
Fig -12: Window displaying the time taken to analyze the tweets.
7. CONCLUSIONS With increasing technologies and inventions the data is also increasing tremendously in terms of volume with rapid velocity and variety. This term is applied to large volume of data that becomes difficult for traditional system to process within specified amount of time. In this paper we have proposed an unsupervised method to analyze a data collected from Twitter social media to predict the outcomes of the cricket match prior to beginning using Naïve Bayes algorithm and sentiment lexicons. The system is tested both offline and online using large number of tweets. According to the test result it is found that the proposed method performs pre-processing, classification and analysis accurately within a specified time. The only limitation of a proposed method is it doesn’t handle the tweets which contain negation keywords this can be considered as a future improvement.
International Research Journal of Engineering and Technology (IRJET) e-ISSN: 2395-0056
Volume: 04 Issue: 10 | Oct -2017 www.irjet.net p-ISSN: 2395-0072
© 2017, IRJET | Impact Factor value: 6.171 | ISO 9001:2008 Certified Journal | Page 993
REFERENCES [1] Erik Boiy, Pieter Hens, Koen Deschacht, Marie-
Francine Moens, “Automatic Sentiment Analysis in On-line Text,”Proceedings ELPUB2007 Conference on Electronic Publishing – Vienna, Austria – June 2007, pp. 349-360
[2] Peter D. Turney, “Thumbs Up or Thumbs Down? Semantic Orientation Applied to Unsupervised Classification of Reviews,” Proceedings of the 40th Annual Meeting of the Association for Computational Linguistics (ACL), Philadelphia, July 2002, pp. 417-424.
[3] Sitaram Asur and Bernardo A. Huberman,”Predicting the Future With Social Media,”arXiv:1003.5699v1 [cs.CY] 29 Mar 2010
[4] V.K. Singh, R. Piryani, A. Uddin P. Waila,“Sentiment Analysis of Movie Reviews and Blog Posts,”2013 3rd IEEE International Advance Computing Conference (IACC), pp. 893-898.
[5] Neethu M S, Rajasree R, “Sentiment Analysis in Twitter using MachineLearning Techniques, “4th ICCCNT 2013, July 4 - 6, 2013, Tiruchengode, India
[6] Amir Hossein Akhavan Rahnama, “ Distributed Real-Time Sentiment Analysis for Big Data Social Streams, “978-1-4799-6773-5/14/$31.00 ©2014 IEEE, pp. 789-794.
[7] Varsha Sahayak, Vijaya Shete, Apashabi Pathan,“Sentiment Analysis on Twitter Data,” International Journal of Innovative Research in Advanced Engineering (IJIRAE), Issue 1, Volume 2, January 2015, pp. 178-183.
[8] Raza Ul Mustafa, M. Saqib Nawaz, M. Ikram Ullah Lali, Tehseen Zia, Waqar Mehmood, “Predicting The Cricket Match Outcome Using Crowd Opinions On SocialNetworks: A Comparative Study Of Machine Learning Methods,”Malaysian Journal of Computer Science. Vol. 30(1), 2017, pp. 63-76.
[9] Jessica Chung and Eni Mustafaraj, “Can Collective Sentiment Expressed on Twitter Predict Political Elections?,”Association for the Advancement of ArtificialIntelligence 2011.
[10] Nausheen Azam, Jahiruddin, Muhammad Abulaish, SMIEEE, and Nur Al-Hasan Haldar, “Twitter Data Mining for Events Classification and Analysis,”2015 Second International Conference on Soft Computing and Machine Intelligence, pp. 79-83.