Embed Size (px)
Citation preview

Analysis and Representation of Miscellaneous Electric Loads in NEMS
May 2017
Independent Statistics & Analysis
www.eia.gov
U.S. Department of Energy
Washington, DC 20585

U.S. Energy Information Administration | Analysis and Representation of Miscellaneous Electric Loads in NEMS i
This report was prepared by the U.S. Energy Information Administration (EIA), the statistical and analytical agency within the U.S. Department of Energy. By law, EIA’s data, analyses, and forecasts are independent of approval by any other officer or employee of the United States Government. The views in this report therefore should not be construed as representing those of the U.S. Department of Energy or other Federal agencies.

May 2017
U.S. Energy Information Administration | Analysis and Representation of Miscellaneous Electric Loads in NEMS 1
Analysis and Representation of Miscellaneous Electric Loads in NEMS Miscellaneous Electric Loads (MELs) comprise a growing portion of delivered energy consumption in residential and commercial buildings. Recently, the growth of MELs has offset some of the efficiency gains made through technology improvements and standards in major end uses such as space conditioning, lighting, and water heating. Miscellaneous end uses—including televisions, personal computers, security systems, data center servers, and many other devices—have continued to penetrate into building-related market segments. Part of this proliferation of devices and equipment can be attributed to increased service demand for entertainment, computing, and convenience appliances.
Given the dispersed and increasingly varied nature of these equipment and appliances, stock, usage, and consumption data can be difficult to obtain. EIA conducts two surveys of the building sectors, the Residential Energy Consumption Survey (RECS) and Commercial Buildings Energy Consumption Survey (CBECS), which provide information on the equipment stock and energy consumption of major end-use equipment within existing buildings. While some devices and appliances are captured in this process, it is impossible to account for all MELs within buildings using these large-scale survey methods. These surveys also do not capture estimates of consumption for end uses outside of buildings, such as water treatment and distribution or telecommunications equipment.
The Residential Demand Module (RDM) and Commercial Demand Module (CDM) of the National Energy Modeling System (NEMS) generally project annual energy consumption of MELs by combining unit energy consumption (UEC) with total stock of equipment or devices by type.1 This differs from major end-use equipment, which is modeled using a technology menu accounting for equipment vintage, performance, and costs.
The contract reports in Appendix A and Appendix B characterize a number of residential and commercial MELs and provides the informational basis for modeling these projections with a consistent perspective on equipment stock and annual energy consumption across end uses. This enables more detailed and specific MEL projections and analysis. Appendix A was used in developing Reference case projections implemented during the AEO2014 cycle and Appendix B data are used to develop AEO2018 projections.
When referencing the contract report in Appendix A, it should be cited as a report by Navigant Consulting, Inc. and SAIC (now Leidos, Inc.) prepared for the U.S. Energy Information Administration. The contract report in Appendix B should be cited as a report by Navigant Consulting, Inc. and Leidos, Inc. prepared for the U.S. Energy Information Administration.
1 Additional information on the modeling of MELs can be found in the RDM and CDM model documentations, located at https://www.eia.gov/outlooks/aeo/nems/documentation/.

May 2017
U.S. Energy Information Administration | Analysis and Representation of Miscellaneous Electric Loads in NEMS 2
APPENDIX A

DI SPUT E S & I NVESTI GATI O N S • ECONOMI C S • F I NAN CI A L ADVI SO RY • MANAGEM E N T CONSULT I NG
©2013 Navigant Consulting, Inc.
Final Report: May 22, 2013 (Appendix A Amended Sept 2013)
Navigant Reference: 160750
Analysis and Representation of Miscellaneous Electric Loads in NEMS Prepared for: U.S. Energy Information Administration
Prepared By: Navigant Consulting, Inc. and SAIC

1 ©2013 Navigant Consulting, Inc. E N E R G Y
NOTICE
This report was prepared as an account of work sponsored by an agency of the United States
Government. Neither the United States Government, nor any agency thereof, nor any of their employees,
nor any of their contractors, subcontractors, or their employees, makes any warranty, express or implied,
or assumes any legal liability or responsibility for the accuracy, completeness, or usefulness of any
information, apparatus, product, or process disclosed, or represents that its use would not infringe
privately owned rights. Reference herein to any specific commercial product, process, or service by trade
name, trademark, manufacturer, or otherwise, does not necessarily constitute or imply its endorsement,
recommendation, or favoring by the United States Government or any agency, contractor or subcontractor
thereof. The views and opinions of authors expressed herein do not necessarily state or reflect those of
the United States Government or any agency thereof.
May 2013 ©2013 Navigant Consulting, Inc. All rights reserved. Navigant Consulting is not a certified public accounting firm and does not provide audit, attest, or public accounting services. See www.navigantconsulting.com/licensing for a complete listing of private investigator licenses. Investment banking, private placement, merger, acquisition and divestiture services offered through Navigant Capital Advisors, LLC., Member FINRA/SIPC.

2 ©2013 Navigant Consulting, Inc. E N E R G Y
Table of Contents
Table of Contents Page Page
Executive Summary 3 Residential MELs 67
Background 15 Dehumidifiers 69
Methodology 19 Set-top Boxes, All 71
Commercial MELs 27 Modems & Routers 73
Distribution Transformers 29 External Power Supplies 75
Data Center Servers 32 Non-Computer Rechargeable Electronics 77
IT Equipment (non-data center) 34 Ceiling Fans 79
Water Treatment/Distribution 38 Televisions 81
PC – Desktops 41 DVD 83
PC – Laptops 44 PCs, Laptop 85
PC – Monitors 47 PCs, Desktop 89
Kitchen Ventilation 50 Monitors (i.e. desktop PC monitors) 91
Lab Refrigerators/Freezers 53 Audio Equipment 93
Medical Imaging Equipment 56 Portable Electric Spas 95
Video Displays 59 Pools/Pool Pumps 97
Video Boards 62 Security Systems, Home 99
Security Systems 64 References/Appendices 101

3 ©2013 Navigant Consulting, Inc. E N E R G Y
Executive Summary
Executive Summary

4 ©2013 Navigant Consulting, Inc. E N E R G Y
Activity steps: 1. Select MELs for evaluation, including new
loads and previously analyzed loads 2. Estimate U.S. installed base in number of
units 3. Characterize usage to estimate unit energy
consumption (UEC) in kWh/yr: – Usage hours – Power consumption
4. Calculate total annual energy consumption (AEC) in TWh/yr in the United States
5. Characterize market, economic, demographic and technology trends
6. Develop Projections to 2040 based on typical operating parameters for:
– Usage hours – Power consumption – UEC – AEC – Installed base
We updated energy consumption data for 28 residential (R) & commercial (C) miscellaneous electric loads (MELs), including projections to 2040.
MEL Update » Executive Summary › Activity Description
Selected MELs Sector(s) TV, Set-Top-Boxes, DVD players R
Computers, Laptops, Monitors C & R
Ceiling Fans R
Audio Equipment R
Portable Electric Spas R
Modems & Routers R
Rechargeable Electronics and Power Supplies R
Pools/Pool Pumps R
Dehumidifiers R
Security Systems C & R
Medical Imaging Equipment C
Kitchen Ventilation (Exhaust Hoods) C
Laboratory Refrigerators and Freezers C
Water Distribution* C
Distribution Transformers C
IT Equip. & Data Center Servers C
Video Displays & Video Boards C
*See Appendix A for supplemental discussion of wastewater treatment trends

5 ©2013 Navigant Consulting, Inc. E N E R G Y
MEL Update » Executive Summary › The Need
MELs characterization research helps to define the numerous, poorly understood loads that, in aggregate, constitute substantial energy use.
Space Cool 22%
Lighting 14%
Electronics 11% Refrig
9%
H20 Heat 9%
Space Heat 9%
Adjust 8%
Wet Clean 7%
Other 4%
Cooking 4%
Computer 3%
Residential Primary Electricity Consumption (2010)
(15.3 total Quads)
Light 26%
Space Cool 19%
Other 15%
Vent 12%
Refrig 9%
Space Heat 6%
Electronics 6%
Computer 5%
H20 Heat 2%
Cooking 0%
Adjust 0%
Commercial Primary Electricity Consumption (2010)
(14.0 total Quads)
Buildings consume 29 quads of primary electric energy in the US; 15 in residential and 14 in commercial buildings. Source: EIA data from Buildings Energy Data Book: http://buildingsdatabook.eren.doe.gov/

6 ©2013 Navigant Consulting, Inc. E N E R G Y
MEL Update » Executive Summary › Results Summary
The largest analyzed MEL by AEC, Televisions, used 70 TWh/yr of site electricity in 2011.
Appendices B and C contain complete summaries for CMELs and RMELs, respectively, of Installed Base, UEC and AEC in 2011
Site-electricity use in 2011**: Commercial: 1,319 TWh Residential: 1,424 TWh Total: 2,743 TWh
**Site Electricity data from AEO 2013, Table A8, page 138
Sector MEL AEC (TWh/yr) Installed Base (000s)
R Televisions 70 355,000C Distribution Transformers 43 5,470C Kitchen Ventilation 41 790C DesktopPC 30 74,000C Data Center Servers 29 12,200R Pool Heaters & Pumps 26 10,400R Desktop PCs 22 102,000R Set Top Boxes 22 176,000R Ceiling Fans 20 263,000C MonitorsPC 18 93,000R Audio Equipment 16 193,000R Monitors 13 130,000C IT Equipment 12 487,000R Dehumidifiers 11 15,600R Laptop PCs 10 165,000R Portable Electric Spas 9 4,630C Security Systems 7 11,000R Modems & Routers 7 138,000R External Power Supplies 7 1,077,000C Water Distribution* 7 5,115,000R DVD Players 6 227,000C Lab R-Fs 5 1,000R Non PC Rechargeable Electronics 4 1,200,000C Medical Imaging Equipment 3 178C LaptopPC 2 63,000C Video Displays 2 1,600R Home Security Systems 1 28,000C Large Format Video Boards 0 1
Note: *Water distribution Installed base is in Million of Gallons per year (Mgal/yr), not thousands
7 ©2013 Navigant Consulting, Inc. E N E R G Y
» Set-Top-Boxes: New estimates are 13% lower than the Fraunhofer 2010 study, but are based on newly published data from the DOE standard rulemaking process.
» Ceiling Fans: New estimates are 13% higher than TIAX 2008 based on higher average household penetration of ceiling fans and a different methodology of calculating annual usage hours, which we believe to be more accurate.
» Pools: New estimates are 230% higher than TIAX 2008 based on significantly higher installed base from a different sources which we believe to be more accurate. Also, TIAX assumes a much shorter pool season of less than 6 months even in the warmest regions of the U.S. We assumed pools in the warmest regions are open year-round and about 4 months in cooler regions such as the northeast.
Our estimates build on the best available past research, but can, in some cases, differ substantially from other recent MELs studies.
MEL Update » Executive Summary › RMEL Comparison

8 ©2013 Navigant Consulting, Inc. E N E R G Y
» Distribution Transformers: TIAX 2010 included non-building transformers and assumed all building loads require a transformer; our estimates are based on the DOE rulemaking.
» Monitors: Prior installed base data vary by up to 50 million (110 M vs. 160 M); using underlying data, we developed new estimates based on the computer installed base.
» Medical Imaging: TIAX shows 3 times larger UEC and 2 times larger installed base for X-ray; we suspect TIAX included non-medical and/or portable x-rays in their estimates.
Differences from prior estimates in the commercial sector are more common, but due often to distinctions in MEL definitions.
MEL Update » Executive Summary › CMEL comparison

9 ©2013 Navigant Consulting, Inc. E N E R G Y
By 2040, the total AEC of selected MELs will not increase, due to a 26% increase in AEC for CMELs compared to an 22% drop in AEC for RMELs.**
The selected MELs consumed 437 TWh in 2011, 199 TWh in commercial buildings and 238 TWh in residential buildings.*
MEL Update » Executive Summary › Projections
*2011 data are a sum of the best historical estimates available for each MEL. **Data are projected to 2040 to match other projection timelines within the Annual Energy Outlook. Selected intervals for MEL projections were specified per EIA requirements..

10 ©2013 Navigant Consulting, Inc. E N E R G Y
MEL Update » Executive Summary › Residential MEL Projections
RMEL projections show decreases in AEC for all but five MELs – Set-Top-Boxes, Rechargeable Electronics, Security Systems, and Portable Electric Spas, and Audio Equipment.
Appendix D contains complete data tables for RMEL projections of Installed Base, UEC and AEC.

11 ©2013 Navigant Consulting, Inc. E N E R G Y
MEL Update » Executive Summary › Residential MEL Projections
Of the smaller RMELs, Portable Electric Spas exhibit the greatest growth due primarily to a large increase in the installed base, in addition to a slight increase in UEC (trend toward larger spas with more jets).

12 ©2013 Navigant Consulting, Inc. E N E R G Y
MEL Update » Executive Summary › Commercial MEL Projections
Unlike RMEL projections, the CMEL AEC projections exhibit greater upward trends, particularly for Data Center Servers and IT Equipment.
Appendix E contains complete data tables for CMEL projections of Installed Base, UEC and AEC.

13 ©2013 Navigant Consulting, Inc. E N E R G Y
MEL Update » Executive Summary › Commercial MEL Projections
IT equipment growth, in which we expect to see a doubling in AEC by 2040, supports the transition to cloud computing and reductions in AEC for all computers.
Of the CMELs with smaller AECs, video displays also show very rapid growth, increasing by 700% by 2040.

14 ©2013 Navigant Consulting, Inc. E N E R G Y
» In many MELs, decreasing energy consumption is offset in future years by growth in installed base – in many cases, in the near-term, this leads to decreasing AEC, but minimal additional gains in the longer term. – Population growth drives increases in most residential and many commercial MELs, even if per
capita energy consumption growth is tempered (such as seen in California in recent decades).
» Many electronics-related MELs exhibit downward AEC trends. However, some of this is countered by large increases in AEC for servers and other IT equipment. The trend shows a transfer of computer power away from individual devices and more towards cloud computing with major central data centers.
» This same centralization of computing power trend is also evident in televisions and set-top-boxes (STB), which are relying more and more on streaming internet content with less hardware in the customer’s home. New Over-the-Top (OTT) STBs stream internet content from services such as Netflix and Hulu directly to your TV, and most new TVs have this capability built in – this trend has rapidly progressed in only the last 3 to 5 years.
» DVD players and desktop computers (both residential and commercial) are the only loads which we expect to exhibit a drop in AEC due primarily to a drop in installed base. As new technologies stop the growth of desktops, and accelerate the disposal of DVD players, these MELs will have a slow, but steady decline.
Across all of the MELS analysis, we identified some key recurring findings.
MEL Update » Executive Summary › Key findings

15 ©2013 Navigant Consulting, Inc. E N E R G Y
2 Methodology
1 Background
Commercial MELs 3
Residential MELs 4
Table of Contents
References/Appendices 5

16 ©2013 Navigant Consulting, Inc. E N E R G Y
MEL Update » MEL Definition
*Source: Emily Rauch and Michael Baechler, Pacific Northwest National Laboratory, Sept 2011, “Assessing and Reducing Miscellaneous Electric Loads (MELs) in Banks” Available at: http://www.pnnl.gov/main/publications/external/technical_reports/PNNL-20973.pdf
Miscellaneous electric loads (MELs) are the loads outside of a building’s core functions of heating, ventilating, air conditioning, lighting, and water
heating.*

17 ©2013 Navigant Consulting, Inc. E N E R G Y
Task 2: Develop scenario-based projections through 2040 » Investigate market, economic, technology, and demographic trends
» Make projections for each priority MEL
» Consider technology trends in commercial MELs not included in the detailed analysis
Task 1: Identify MELs and update energy consumption estimates » Screen and identify priority MELS
» Recommend 15 residential and 10 commercial MELs for further analysis
» Confirm MEL selection with EIA
» Develop updated descriptions and revised energy-consumption estimates
MEL Update » Project Scope and Background Objective: Update MEL consumption data for use in NEMS. Evaluate current and projected energy consumption for select MELs.

18 ©2013 Navigant Consulting, Inc. E N E R G Y
MEL Update » MEL Building Types
We split CMEL estimates by building type, using the 11 NEMs definitions, which are closely correlated to the CBECS 2003 definitions.
Building Type Description Assembly Public assembly (stadium, gym, library), religious Education College, K-12 schools (elementary, middle, high) Food Sales Grocery stores and convenience stores Food Service Restaurant, fast food, cafeteria Healthcare Hospitals providing inpatient health services Lodging Hotel, motel, dormitory, nursing home Large Office Offices > 50k sq ft of floor space Small Office Offices < 50k sq ft, including outpatient healthcare Mercantile and Service Retail, service shops, strip malls, enclosed malls Warehouse Refrigerated and non-refrigerated storage Other Public order (police, fire), vacant, other
For buildings with multiple functions, the largest usage of floor area determines principal activity.

19 ©2013 Navigant Consulting, Inc. E N E R G Y
2 Methodology
1 Background
Commercial MELs 3
Residential MELs 4
Table of Contents
References/Appendices 5

20 ©2013 Navigant Consulting, Inc. E N E R G Y
EIA RFP – Commercial MELs Coffee Makers
Distribution Transformers
Non-Road Electric Vehicles
Elevators
Escalators
Water Distribution
Water Purification/Treatment
Arcades
Automated Teller Machines (ATMs)
Fitness Equipment
Fume Hoods
Laundry Equipment
Medical Imaging Equipment
Other Medical Equipment
Servers in Data Centers
Office Equipment
Navigant started with the EIA’s list of MELs from the SOW and added MELs from other resources to create a comprehensive list of 173 MELs.
MEL Update » Methodology › Proposal MELs
EIA RFP – Residential MELs Audio Equipment
Ceiling Fans
Coffee Machines
Microwave Ovens
Portable Electric Spas
Rechargeable Electronics
Security Systems
Set-Top Boxes
Televisions
DVD Players and VCRs
Video Game Consoles
Dehumidifiers
External Power Supplies
Room Air Cleaners & Purifiers
Pool Pumps
Appendix F includes a list of all candidate MELs.

21 ©2013 Navigant Consulting, Inc. E N E R G Y
MEL Update » Methodology › Identification Methodology
To identify key residential and commercial MELs, we employed two distinct screening phases.
Commercial MELs (13)
Initial Screen Secondary Screen
Initial Screen Criteria (based on Navigant judgment): • Inconsequential energy
consumptions • Already well-characterized
Secondary Screen Criteria: Evaluated based on the following characteristics: •Annual Energy Consumption for the entire
installed base in the U.S. (AEC - TWh/yr) •Installed base (number of units in the U.S.) •Unit Energy Consumption (UEC - kWh/yr) •Trend in installed base •Date of most recent analysis
Commercial MELs (38)
Comprehensive MELs list
(173)
Residential MELs (15)
Residential MELs (32)
Appendix G includes a list of all MELs removed during the secondary screening.

22 ©2013 Navigant Consulting, Inc. E N E R G Y
MEL Update » Methodology › Identification Methodology
Through discussions with EIA, we identified 15 residential and 13 commercial MEL categories for analysis.*
Selected Commercial MELs Distribution Transformers
Data Center Servers
IT Equipment (non-data center)
Video Displays
Large-Format Video Boards
PCs, Desktop
PCs, Laptop
Water Treatment/Distribution
Monitors (i.e. desktop PC monitors)
Kitchen Ventilation (Exhaust Hoods)
Lab Refrigerators/Freezers
Security Systems, Commercial
Medical Imaging Equipment
Selected Residential MELs Televisions
PCs, Desktop
PCs, Laptop
Set-top Boxes, All
Ceiling Fans
DVD/Media Players
Audio Equipment
Portable Electric Spas
Modems & Routers
Non-Computer Rechargeable Electronics
External Power Supplies
Pools/Pool Pumps
Monitors (i.e. desktop PC monitors)
Dehumidifiers
Security Systems, Home
* The Contractor’s work scope called for minimums of 10 commercial and 15 residential MELs. Some categories represent groupings of MELs, so the total number of categories included is subject to interpretation.

23 ©2013 Navigant Consulting, Inc. E N E R G Y
X =
X =
X =
X =
MEL Update » Methodology › Calculation approach
When sufficient data were available*, we followed a bottom-up methodology to calculate the UEC, Installed Base, and AEC for each MEL.
Hours (Active)
Power (Active)
UEC (Active)
+ Hours (Sleep)
Power (Sleep) UEC (Idle)
+ Hours (Off)
Power (Off) UEC (Off)
Total UEC Installed Base Total AEC
Unit Energy Consumption (kWh/yr) by
operating mode
Hours Watts kWh/yr Thousands TWh/yr * Based on the Contractor’s judgment of whether available data were sufficient to formulate credible, bottom-up estimates.

24 ©2013 Navigant Consulting, Inc. E N E R G Y
Example 1: Data Center Servers » Servers run continuously and are never in idle state, so the team assumed a single value
for active-mode wattage for the entire year.
» With additional data on usage profiles, it would be possible to more closely model the usage hours and wattage according to the actual throughput of the server.
Example 2: Commercial Kitchen Ventilation » Very little data were available on energy consumption, so we based UEC estimates on
select case studies for energy efficient upgrades (FisherNickel) – The team back-calculated the hours of use based on the approximate fan power and qualitatively validated the output.
When sufficient data were not available to do a complete bottom-up analysis*, we customized the approach to develop the best estimates.
MEL Update » Methodology › Exceptions and customization
X = 8760 Hrs (Active)
Power (Active) Total UEC
=
Daily UEC
Fan Power (kW)
Daily Usage Hours
* Based on the Contractor’s judgment of whether available data were insufficient to formulate credible, bottom-up estimates.

25 ©2013 Navigant Consulting, Inc. E N E R G Y
» We project two variables independently for each relevant mode of operation: – Primary modes: Active, Sleep, Off – Additional modes used for select
MELS included: Standby, Idle, Unplugged, Low/Med/High
» There are three primary outputs associated with each MEL: – Installed Base – projected
independently – UEC – calculated as a sum product
of hours and Watts (by mode) – AEC – calculated as product of
Installed Base and UEC
Where data are available, we based projections on individual growth rates for annual hours of use and power use (Watts) for each MEL.
MEL Update » Methodology › Projections
Hours (Active)
Power (Active)
Hours (Sleep)
Power (Sleep)
Hours (Off)
Power (Off)
Output 2: Total UEC
Output 1: Installed Base
Output 3: Total AEC
Projected Variables

26 ©2013 Navigant Consulting, Inc. E N E R G Y
» In general, we developed projections based on a composite unit for each MEL, which is defined by a weighted average of each projection variable (see previous slide), weighted by the installed base of each sub-product type. – Such a composite unit may not exist in the real world; it represents the average unit in the U.S. – E.g. the composite computer monitor, used for all projections, comprises both LCD and CRT
models of all sizes.
» Exceptions made where sub-product types have markedly different power & usage hours; for the following MELs, we projected each sub-product separately and calculated the weighted average at the end: – Medical Imaging – Commercial Kitchen Ventilation – External Power Supplies
» We developed a unique projection approach for each MEL, generally based on trends in: – Population – Building floor space or stock – Gross Domestic Product (GDP) – Past sales data and effective useful life – Number of households (HH) and size – Scheduled efficiency standard updates
» See Appendix H for Projection Resources
We customized the projection methodology as necessary based on the unique characteristics of each individual MEL.
MEL Update » Methodology › Projections

27 ©2013 Navigant Consulting, Inc. E N E R G Y
2 Methodology
1 Background
Commercial MELs 3
Residential MELs 4
Table of Contents
References/Appendices 5

28 ©2013 Navigant Consulting, Inc. E N E R G Y
MEL Update » CMEL Results › MEL List
The team analyzed 13 commercial MELs.
Commercial MELs Description/Examples Distribution Transformers Dry-Type distribution transformers directly serving buildings
Data Center Servers Servers which are used in data centers
IT Equipment (non-data center) Hubs, switches, routers, and security equipment
Water Treatment/Distribution Pumping and filtration systems to deliver water to buildings
PC – Laptops Laptop Computers, including netbooks
PC – Desktops Desktop Computers, including those with integral monitors
PC – Monitors Monitors, used with either desktops of laptops
Kitchen Ventilation Kitchen ventilation systems, including exhaust hoods
Lab Refrigerators/Freezers Lab-grade refrigerators, freezers, and ultra-low temp freezers
Medical Imaging Equipment MRI, CT scan, X-Ray, Ultrasound
Video Displays Large public displays, used for advertising/branding
Video Boards Large screens used in stadiums and arenas
Security Systems Commercial security systems
29 ©2013 Navigant Consulting, Inc. E N E R G Y
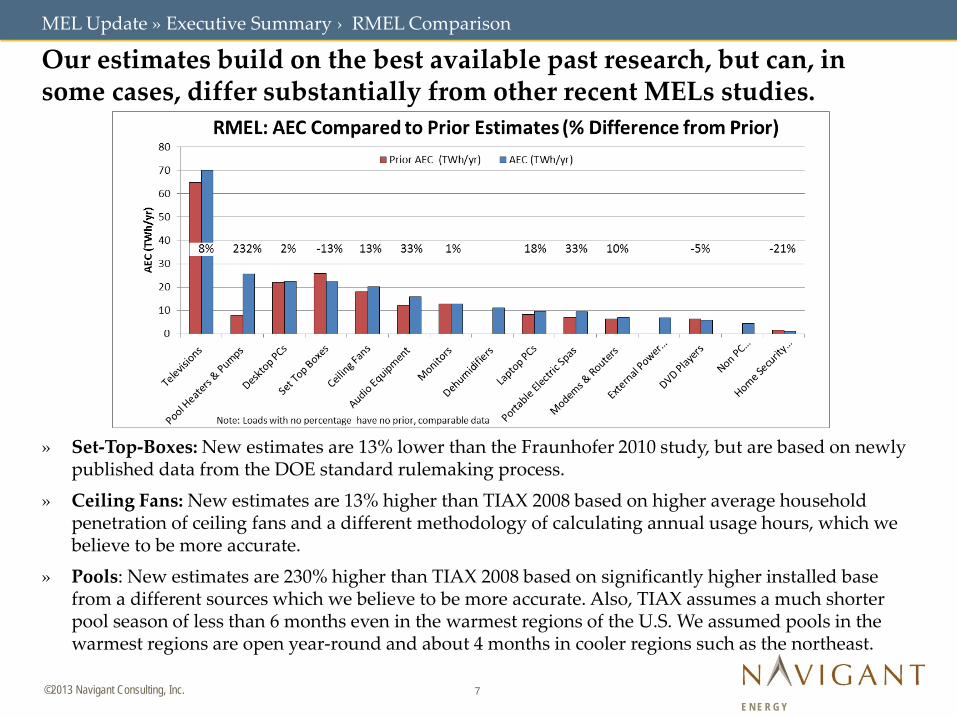
» Includes only dry-type, low voltage distribution transformers (LVDT) on the customer-side of the meter, i.e., where the customer pays for any electrical losses.
» Excludes utility distribution and transmission DTs.
» Medium voltage dry-type DTs are only applicable for industrial processes, and liquid filled DTs are all medium voltage with well over 90% of shipments serving utilities and the remainder serving industrial processes.
» Analysis is based primarily on DOE rulemaking engineering analysis for the energy efficiency codes and standards program, which uses three representative models:
Distribution transformers (DT) used 43 TWh of site electricity in 2011, but upcoming efficiency standards limit AEC growth.
MEL Update » CMEL Results › Distribution Transformers
2011 Base Year DataInstalled Base
(000s) UEC (kWh/yr) AEC (TWh/yr)
25kVA - 1 Phase 600 2,200 1.375kVA - 3 Phase 4,100 6,600 27300 kVA - 3 Phase 800 19,200 15
2011 2015 2020 2030 2040Installed Base (000s) 5,470 5,700 6,000 6,600 7,300UEC kWh/yr 7,900 7,900 7,500 6,800 6,100AEC TWh/yr 43 45 45 45 45

30 ©2013 Navigant Consulting, Inc. E N E R G Y
» Installed base calculated for each building based on the total electricity use (from CBECS) that DTs serve, i.e., all loads except HVAC and large refrigeration, and on the market share and losses for each of the three representative sizes. We determined: – Energy use by multiplying the total applicable electricity use by the weighted losses – Total DT installed base by dividing DT energy consumption by the weighted UEC – Installed base of each size by multiplying the total number by the distribution of each DL
» Some buildings receive low voltage power directly from the utility (similar to residential buildings) and do not need a Dry-LVDT. The analysis assumes the quantity of such buildings is offset by the quantity with a greater portion of Dry-LVDTs.
Distribution transformer usage is proportional to the energy consumption in each building type.
MEL Update » CMEL Results › Distribution Transformers
Photo source: http://www.southlandelectric.com/
2011 Base Year Data Installed Base (000s)
UEC (kWh/yr) AEC (TWh/yr)
Assembly 380 7,400 2.8Education 390 8,500 3.3Food Sales 440 6,400 2.8Food Service 460 6,100 2.8Healthcare 210 10,800 2.3Lodging 400 8,500 3.4Large Office 450 10,900 4.9Small Office 600 6,000 3.6Mercantile & Service 1,500 7,900 12Warehouse 360 8,800 3.2Other 280 8,900 2.5

31 ©2013 Navigant Consulting, Inc. E N E R G Y
Data Sources: » This analysis builds on two industry-accepted reports: DOE rulemaking engineering
analysis (DOE-TSD) and a study by the Cadmus Group.*
Projections: » UEC projections based on the proposed efficiency levels in the Feb 2012 DOE notice of
public rulemaking (NOPR). We expect approval of these levels based on the National Electrical Manufacturers Association (NEMA) letter of support from June 2012.** – Selected efficiency level reduces UEC by 24% (see DOE rulemaking summary table) – Annual shipments represent 4% of installed base, resulting in -1% annual UEC growth rate
» Installed base projections based on DOE-TSD growth of commercial building energy use.
Key Data Variability: » LVDT energy use is due entirely to losses, which are highly dependent on site-specific
sizing and site-specific loading profiles.
Distribution transformers (cont.)
MEL Update » CMEL Results › Distribution Transformers
Sources: *Cadmus Group, 1999, “Metered Load Factors for Low-Voltage, Dry-Type Transformers in Commercial, Industrial, and Public Buildings.” **NEMA 2012 (http://www.nema.org/Policy/Documents/EERE2010BTSTD0048%20NEMA%20comments%20DOE%20Transformer%20SuppAn%20June%202012.pdf) DOE NOPR 2012 (http://www1.eere.energy.gov/buildings/appliance_standards/pdfs/distribution_transformers_nopr_notice.pdf)
Design Line (DOE Rule) kVA Baseline
Efficiency Proposed
CSL Proposed Efficiency
UEC Reduction (Baseline to Proposed)
% of National
Shipments
Weighted UEC
Reduction 6 25 98.0% Base 98.00% 0% 8%
24% 7 75 98.0% 2 98.47% 24% 55% 8 300 98.6% 2 99.02% 30% 37%

32 ©2013 Navigant Consulting, Inc. E N E R G Y
» Data Center Servers are only installed in dedicated data centers, so there is no breakdown of this equipment by building type – all units are in the ‘other’ building type category.
» While businesses do use some servers within offices or other buildings, we exclude those products from this analysis.
» Analysis does NOT include the energy consumption associated with the extensive space cooling load imposed by this equipment.
» We divided data into volume servers, mid-range servers, and high-end servers.
Data center servers consumed 29 TWh in 2011.
MEL Update » CMEL Results › Data Center Servers
2011 Base Year Data Installed Base (000s)
UEC (kWh/yr)
AEC (TWh/yr)
Volume Servers 11,800 2,000 24Mid-range Servers 340 8,000 2.7High-end Servers 38 50,500 1.9
2011 2015 2020 2030 2040Installed Base (000s) 12,200 14,000 16,000 21,000 28,000
Active 269 282 300 339 382Idle/Standy/Off 0 0 0 0 0Active 8,760 8,760 8,760 8,760 8,760Idle/Standy/Off 0 0 0 0 0
UEC kWh/yr 2,400 2,500 2,600 3,000 3,400AEC TWh/yr 29 35 42 63 95
Annual Usage (hrs)
Power Draw (W)

33 ©2013 Navigant Consulting, Inc. E N E R G Y
Utilization Assumptions: » All servers assumed to be active 100% of the time; however, load is dynamically shared
evenly across servers to promote rapid throughput – typical utilization is >80% and increasing.*
» Data centers push for high utilization to minimize capital expenditures for “peaking” capacity. Data centers minimize the number of extra, idle machines held in reserve.
» Active-mode power is based on the average workload, which is proportional to power.
Projections: » Shipment growth reached >10% annually in the early 2000s, but slowed in the recession.*
» Demand for computing resources is not expected to saturate in the future; We assume 2.8% annual installed base growth (slightly above expected annual GDP growth).**
» Based on historical power draw trends, we expect consistent, 1.2% annual power draw growth in the future.* Due to faster increases in computing power, this represents an improvement in efficiency. – Performance per server increases each generation, the associated power consumption for which is
partially offset by Moore's law (i.e., greater performance increase than power increase). – Increased power also pressured by needs to cram more computing into smaller areas to take up
less floor space. (e.g. more cores, memory, and storage in a single server)
Data center servers (cont.)
MEL Update » CMEL Results › Data Center Servers
*Source: Koomey, Jonathan. 2011. Growth in data center electricity use 2005 to 2010. Oakland, CA: Analytics Press. July. **GDP growth is 2.5% annually in EIA’s AEO 2013 early release from 2011 to 2040.

34 ©2013 Navigant Consulting, Inc. E N E R G Y
This technology includes: » Routers and wireless LANs (WLAN) – manage traffic to
multiple networking devices
» Switches – provide point-to-point connection between networking devices
» Security Equipment – includes firewalls and website blockers that filter and protect traffic to the Internet
» Some offices may have servers and data storage in the building (not included here), but the trend is to locate this infrastructure in data centers
IT equipment consumed 12 TWh in 2011.
MEL Update » CMEL Results › IT Equipment
Photo Source: http://www.dlink.com
2011 2015 2020 2030 2040Installed Base (000s) 487,000 551,000 642,000 873,000 1,190,000
Active 3.0 2.9 2.8 2.7 2.6Idle/Ready 2.8 2.8 2.7 2.6 2.5Off/Standby 0.0 0.0 0.0 0.0 0.0Active 2190 2190 2190 2190 2190Idle/Ready 6570 6570 6570 6570 6570Off/Standby 0 0 0 0 0
UEC kWh/yr 25 25 24 23 22AEC (TWh/yr) 12 14 15 20 26
Power Draw (W)
Annual Usage (hrs)

35 ©2013 Navigant Consulting, Inc. E N E R G Y
» IT Equipment is dominated by network equipment infrastructure, and is used primarily in office spaces.
» The IT equipment split above is based on the total percentage of AEC associated with computers in each building type from CBECS 2003.
IT equipment is used in all buildings, but 70% of the installed base is concentrated in office and education buildings
MEL Update » CMEL Results › IT Equipment
2011 Base Year Data Installed Base (000s)
UEC (kWh/yr)
AEC (TWh/yr)
Assembly 12,200 25 0.3Education 101,000 25 2.5Food Sales 5,800 25 0.1Food Service 5,400 25 0.1Healthcare 21,400 25 0.5Lodging 19,000 25 0.5Large Office 148,000 25 3.7Small Office 94,000 25 2.4Mercantile & Service 45,300 25 1.1Warehouse 14,100 25 0.4Other 21,400 25 0.5

36 ©2013 Navigant Consulting, Inc. E N E R G Y
» For this study, we assume that network equipment spends 25% of the time with high traffic (active state) and 75% of the time with low traffic (idle state). This may be a conservative estimate compared to other studies which assume 100% idle time.*
» Traffic does not significantly impact power – we assume active power is 5% higher than idle power.
» Power used in network equipment has not changed significantly in the past.
» Growth in installed base drives most of the increase in energy consumption. – Switches/WLANs recently grew faster than routers/security due to growth in the number of
connected devices. – Routers and security appliances allow more users on a single device, so growth in this area is
expected to remain low.
» Installed base growth assumed to be equal to rate between 2008 and 2011
» Main growth driver is the number of devices connected, (not the amount of floors pace).
» There is nothing to suggest that there will be more device consolidation. Even if there is, the power needed per port or device will likely not change.
» The number of devices connected has probably been increasing faster than commercial floor space; however, at some point the market may reach saturation, but when that time will occur is highly unpredictable at the present.
IT equipment (cont.)
MEL Update » CMEL Results › IT Equipment
*Source: Lanzisera, S., B. Nordman, and R. E. Brown, 2011. ``Data Network Equipment Energy Use and Savings Potential in Buildings.''

37 ©2013 Navigant Consulting, Inc. E N E R G Y
» Substantial energy savings could be achieved through EEE (energy efficient Ethernet) – Most network equipment does not fully utilize all ports, e.g., switches on avg. utilize 50% of ports. – EEE shuts off power to ports that are not connected - savings is not in time spent in idle, but
idle/active power itself as it saves power on unused ports. Savings is approximately 50%. – Minimal adoption to date - partially due to the fact that it requires both the endpoint device and
the network equipment to support EEE.
» Many endpoint devices are powered by Ethernet (PoE) instead of AC wall power (e.g., VOIP phones). – Efficiency of power supplies in network equipment will be more relevant as more and more
devices are powered over Ethernet. – PoE energy is not included here so as to avoid double counting with the actual end use.
» Network equipment power itself has not been changing significantly, but shipments drive most of the changes in energy consumption.
New IT equipment technologies have the potential to achieve high levels of savings, but adoption of these technologies is not certain.
MEL Update » CMEL Results › IT Equipment

38 ©2013 Navigant Consulting, Inc. E N E R G Y
» Commercial water supply is generally served by public distribution systems (75% of all commercial supply).
» Surface-water supplies consume 22% less energy than ground-water supplies (both of which are included in these data).
» Wastewater treatment is not included in this analysis.
» Water distribution within buildings (e.g., hot water circulation pumps) is not considered here.
» We include estimates for private wells as “self supply”.
Water distribution (external to the building) consumed 6.5 TWh in 2011 to supply water to buildings.
MEL Update » CMEL Results › Water Distribution
Note: Bgal = Billions of gallons Photo Source: http://www.flowserve.com
All Commercial Supply 2011 2015 2020 2030 2040Installed Base Mgal/yr 5,115,000 5,250,000 5,514,000 5,956,000 6,402,000UEC kWh/Mgal 1,284 1,310 1,340 1,410 1,480AEC TWh/yr 6.6 6.9 7.4 8.4 9.5Commercial Self SupplyComm Self Supply Installed Mgal/yr 1,192,000 1,223,480 1,285,094 1,388,033 1,492,042Comm Self Supply UEC kWh/Mgal 430 439 450 473 497Comm Self Supply AEC TWh/yr 0.51 0.54 0.58 0.66 0.74All Public Supply (All sectors)All Public Installed Base Mgal/yr 16,582,000 17,019,921 17,877,032 19,309,035 20,755,906All Public UEC kWh/Mgal 1,544 1,575 1,615 1,698 1,784All Public AEC TWh/yr 25.6 26.8 28.9 32.8 37.0

39 ©2013 Navigant Consulting, Inc. E N E R G Y
» Unlike other commercial MELs, water distribution (except private wells for self-supply) is not typically associated with the building – it is usually considered a utility service.
» These data represent the nationwide energy consumption required to deliver the water to the stock of each building type; the actual pumps are located outside of the building, at central pumping stations and at various locations in the pumping distribution infrastructure.
The water distribution split by building type is based on an EPA study from 1995; we assume this trend has generally held over that time.*
MEL Update » CMEL Results › Water Distribution
*Source: http://www.epa.gov/WaterSense/docs/ci_whitepaper.pdf, figure 2 (secondary source).
2011 Base Year Data All Comm'l (Self & Public) - Mgal/yr
Avg UEC - kWh/MGal/yr
AEC TWh/yr
Assembly 256,000 1,284 0.3Education 512,000 1,284 0.7Food Sales 213,000 1,284 0.3Food Service 639,000 1,284 0.8Healthcare 597,000 1,284 0.8Lodging 639,000 1,284 0.8Large Office 384,000 1,284 0.5Small Office 384,000 1,284 0.5Mercantile & Service 213,000 1,284 0.3Warehouse 1,023,000 1,284 1.3Other 256,000 1,284 0.3

40 ©2013 Navigant Consulting, Inc. E N E R G Y
» According the USGS (2005), 67% of all commercial water is from surface sources - this is also true of all public water supply (including residential).*
» Commercial-use constitutes 24% of all public water supply.*
» On average, ground water requires 36% greater energy than surface water due to the additional pumping to extract water from deep wells.*
» 75% of commercial supply comes from the public supply system - self supply generally occurs in rural areas where public distribution is not available.*
» The installed base (Mgal/yr) will increase proportionally to the growth of commercial floor space, but the growth will slow over time as water-use becomes more efficient.
» Energy use is expected to grow due to heavily taxed water resources and the need to draw water from greater depths (ground water) or farther distances (surface water).
» Regionally, the data vary dramatically, mostly due to availability of water, which heavily impacts the UEC.
» Findings differ slightly from TIAX 2010 - one main driver is public supply UEC - TIAX shows greater energy use for surface supplies than for ground supplies (counter-intuitive), which no clear justification.
Water distribution (cont.)
MEL Update » CMEL Results › Water Distribution
Source: USGS, (2005) “Estimated Use of Water in the United States in 2005” http://pubs.usgs.gov/circ/1344/
Refer to Appendix A for supplemental discussion of wastewater treatment

41 ©2013 Navigant Consulting, Inc. E N E R G Y
» Desktops include only the actual computer itself, not the external monitor. However, the category does include all-in-one desktop computers in which the monitor is integrated with the CPU.
» There is conflicting information on desktop installed base with NCI (2009) listing 60,381,000 desktops and 47,619,000 laptops (108 million total PCs) and TIAX (2010) listing a 2008 installed base of 150,000,000 PCs.
Desktop computers consumed 30 TWh in 2011, but are slowly losing market share to laptops and tablets.
MEL Update » CMEL Results › Desktop Computers
Photo Source: www.askthecomputertech.com
2011 2015 2020 2030 2040Installed Base (000s) 74,000 69,000 61,000 47,000 36,000
Active 64 51 39 23 11Idle/Ready 0.0 0.0 0.0 0.0 0.0Sleep/Standby 3.4 2.8 2.1 1.3 0.5Off 1.8 1.6 1.2 0.6 0.3Active 6,060 5,751 5,387 4,727 4,147Idle/Ready 0 0 0 0 0Sleep/Standby 507 816 1,180 1,840 2,420Off 2,193 2,193 2,193 2,193 2,193
UEC kWh/yr 400 301 216 111 47AEC TWh/yr 30 21 13 5 2
Power Draw (W)
Annual Usage (hrs)
42 ©2013 Navigant Consulting, Inc. E N E R G Y
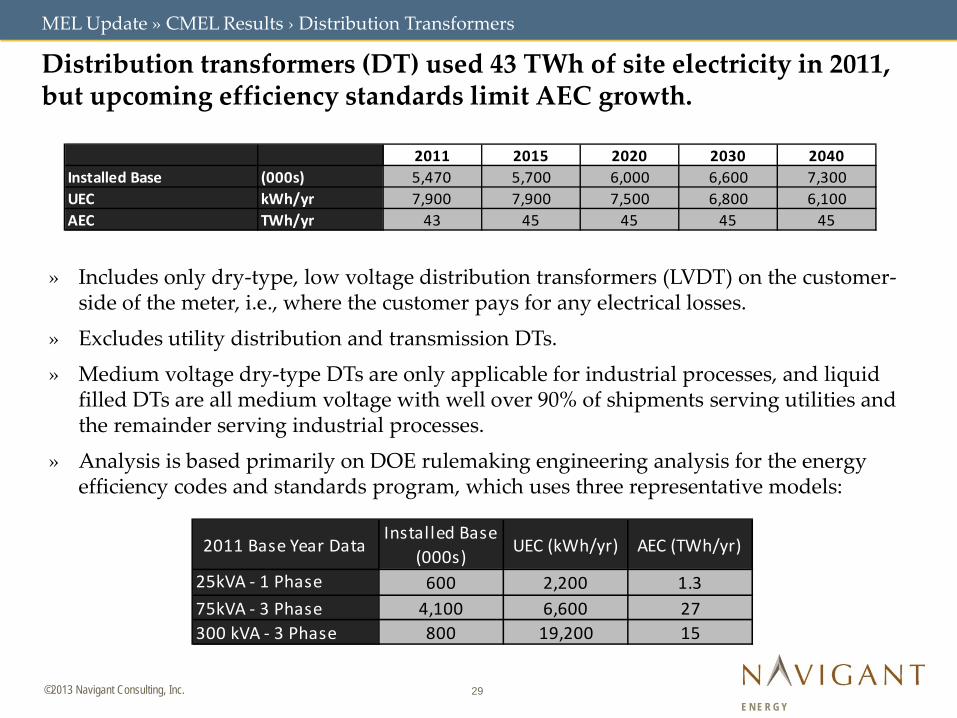
» The installed base of desktops will decrease as they are supplanted by laptops.
» Sleep Mode time will increase as power management (PM) becomes more widespread, particularly when pushed by corporate IT departments.
» The breakdown by building type is based on the energy consumption breakdown for computers in CBECS (2003).
As with other computing equipment, desktop computers are found in all building types, but are concentrated in offices and education.
MEL Update » CMEL Results › Desktop Computers
2011 Base Year Data Installed Base (000s)
UEC (kWh/yr) AEC (TWh/yr)
Assembly 2,000 402 0.8Education 16,000 402 6.4Food Sales 950 402 0.4Food Service 870 402 0.3Healthcare 3,500 402 1.4Lodging 3,100 402 1.2Large Office 24,000 402 9.6Small Office 15,000 402 6.0Mercantile & Service 7,300 402 2.9Warehouse 2,300 402 0.9Other 3,500 402 1.4
43 ©2013 Navigant Consulting, Inc. E N E R G Y
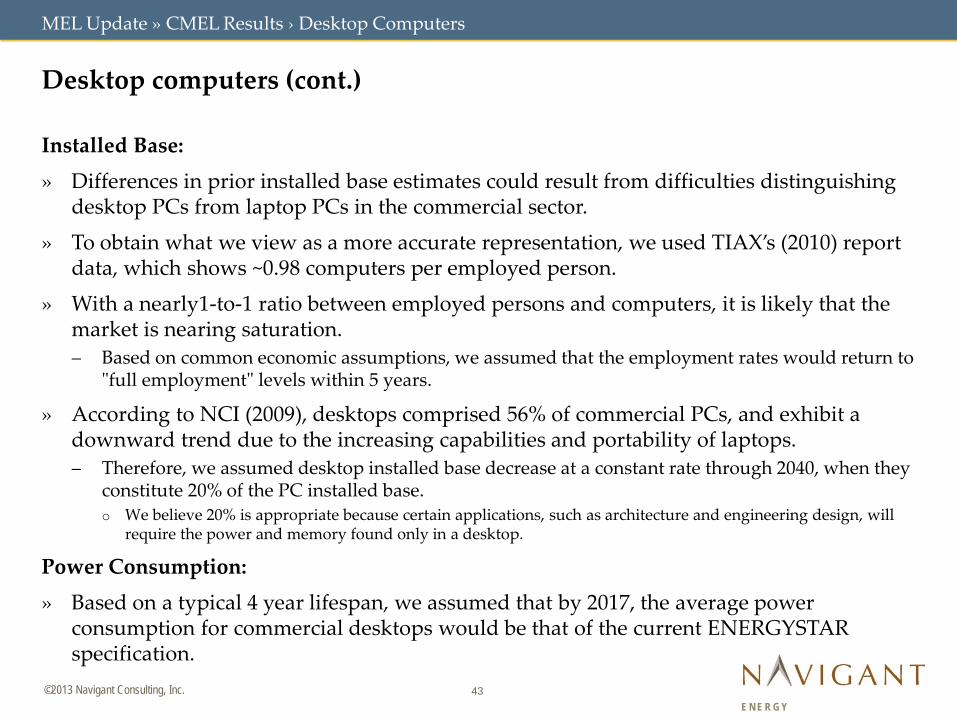
Installed Base: » Differences in prior installed base estimates could result from difficulties distinguishing
desktop PCs from laptop PCs in the commercial sector.
» To obtain what we view as a more accurate representation, we used TIAX’s (2010) report data, which shows ~0.98 computers per employed person.
» With a nearly1-to-1 ratio between employed persons and computers, it is likely that the market is nearing saturation. – Based on common economic assumptions, we assumed that the employment rates would return to
"full employment" levels within 5 years.
» According to NCI (2009), desktops comprised 56% of commercial PCs, and exhibit a downward trend due to the increasing capabilities and portability of laptops. – Therefore, we assumed desktop installed base decrease at a constant rate through 2040, when they
constitute 20% of the PC installed base. o We believe 20% is appropriate because certain applications, such as architecture and engineering design, will
require the power and memory found only in a desktop.
Power Consumption: » Based on a typical 4 year lifespan, we assumed that by 2017, the average power
consumption for commercial desktops would be that of the current ENERGYSTAR specification.
Desktop computers (cont.)
MEL Update » CMEL Results › Desktop Computers

44 ©2013 Navigant Consulting, Inc. E N E R G Y
» Commercial laptops includes laptops, but not any additional external monitors or other peripheral devices.
» Commercial and residential laptops show some similarities in power consumption. Specifically, they exhibit very similar Sleep and Off Mode power consumptions, but their usage patterns are dissimilar. We used NCI (2009) data for the usage pattern of commercial laptops, as it was the best available; however, it appears low relative to Fraunhofer estimates for residential computing usage.
Laptop computers consumed 2.1 TWh in 2011.
MEL Update » CMEL Results › Laptop Computers
Photo Source: www.cpsc.gov
2011 2015 2020 2030 2040Installed Base (000s) 63,000 77,000 92,000 120,000 150,000
Active 21 16 12 8.3 5.6Idle/Ready 0 0 0 0 0Sleep/Standby 1.8 1.4 1.2 0.7 0.4Off 1.5 0.8 0.7 0.5 0.3Active 1,078 1,078 1,078 1,078 1,078Idle/Ready 0 0 0 0 0Sleep/Standby 828 828 828 828 828Off 6,854 6,854 6,854 6,854 6,854
UEC kWh/yr 34 24 19 13 8AEC TWh/yr 2.1 1.8 1.8 1.5 1.3
Power Draw (W)
Annual Usage (hrs)
45 ©2013 Navigant Consulting, Inc. E N E R G Y
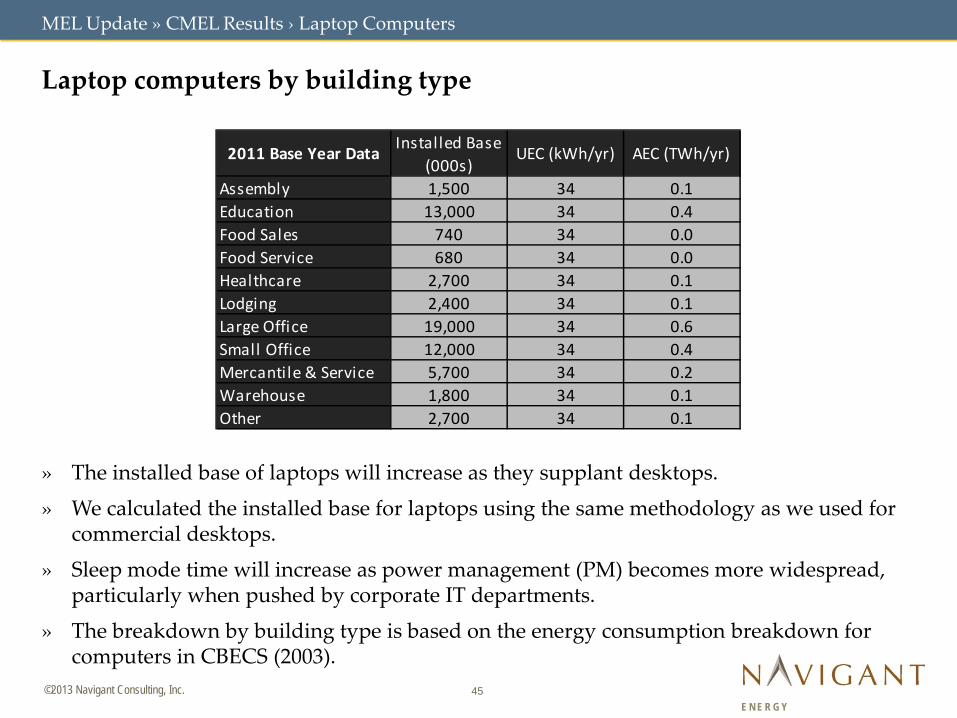
» The installed base of laptops will increase as they supplant desktops.
» We calculated the installed base for laptops using the same methodology as we used for commercial desktops.
» Sleep mode time will increase as power management (PM) becomes more widespread, particularly when pushed by corporate IT departments.
» The breakdown by building type is based on the energy consumption breakdown for computers in CBECS (2003).
Laptop computers by building type
MEL Update » CMEL Results › Laptop Computers
2011 Base Year Data Installed Base (000s)
UEC (kWh/yr) AEC (TWh/yr)
Assembly 1,500 34 0.1Education 13,000 34 0.4Food Sales 740 34 0.0Food Service 680 34 0.0Healthcare 2,700 34 0.1Lodging 2,400 34 0.1Large Office 19,000 34 0.6Small Office 12,000 34 0.4Mercantile & Service 5,700 34 0.2Warehouse 1,800 34 0.1Other 2,700 34 0.1

46 ©2013 Navigant Consulting, Inc. E N E R G Y
Installed Base: » The 2011 installed base for both commercial and residential laptops is in line with
shipment data from ENERGY STAR (75% of shipments are ENERGY STAR).*
» We expect the laptop installed base to increase relative to desktops at a constant rate through 2040, when they will constitute 80% of the PC installed base.
Power Consumption: » As the commercial sector’s analysis does not include tablets or netbooks like the
residential sector’s, commercial laptops exhibit a slightly higher Active Mode power consumption.
» Tablet use in commercial settings (excluded here) is in its early stages and is difficult to characterize; however, it is likely that UEC will be greater than in the residential sector due to more usage hours (e.g., doctor using tablet with patients steadily for a full day).
Hourly Usage: » As the usage patterns of commercial laptops will likely remain similar in the future, we
assumed they would stay the same through 2040.
Laptop computers (cont.)
MEL Update » CMEL Results › Laptop Computers
*Source: Energy Star Market Penetration Data: http://www.energystar.gov/index.cfm?c=partners.unit_shipment_data

47 ©2013 Navigant Consulting, Inc. E N E R G Y
» Computer monitors include only those that are independent of (i.e., not integral to) the computer’s CPU – this may include those connected to desktops and laptops
Computer monitors in commercial buildings consumed 18 TWh in 2011.
MEL Update » CMEL Results › Computer Monitors
Photo Source: www.publicdomainpictures.net
2011 2015 2020 2030 2040Installed Base (000s) 93,000 91,000 86,000 77,000 71,000
Active 38 34 25 25 25Idle/Ready 0 0 0 0 0Sleep/Standby 1.3 1.2 0.7 0.0 0.0Off 0.8 0.7 0.6 0.0 0.0Active 5,323 4,879 4,365 3,475 2,764Idle/Ready 0 0 0 0 0Sleep/Standby 554 818 1,096 1,493 1,702Off 2,883 3,063 3,298 3,792 4,293
UEC kWh/yr 198 168 112 87 69AEC TWh/yr 18 15 10 7 5
Power Draw (W)
Annual Usage (hrs)

48 ©2013 Navigant Consulting, Inc. E N E R G Y
» Hourly usage is based on the weighted average of commercial desktop and laptop usage.
» Active Mode power will likely taper to a plateau of 25 W (based on NCI expert opinion).
» The split building type is based on the representative split in CBECs (2003) for computer energy consumption.
Computer monitors are primarily located in office and education buildings, but are found in lesser numbers in all building types.
MEL Update » CMEL Results › Computer Monitors
2011 Base Year Data Installed Base (000s)
UEC (kWh/yr)
AEC (TWh/yr)
Assembly 2,400 200 0.5Education 20,000 200 4.0Food Sales 1,200 200 0.2Food Service 1,100 200 0.2Healthcare 4,300 200 0.9Lodging 3,800 200 0.8Large Office 30,000 200 6.0Small Office 19,000 200 3.8Mercantile & Service 9,100 200 1.8Warehouse 2,800 200 0.6Other 4,300 200 0.9

49 ©2013 Navigant Consulting, Inc. E N E R G Y
Installed Base: » As there was conflicting data between NCI (2009) that said the installed base of just
desktop-associated monitors was 110,000,000 and TIAX (2010) that said the 2008 total installed base of commercial monitors was 160,000,000, we determined the number of commercial monitors based on the number of desktops and laptops.
» According to NCI (2009), there are 1.073 monitors per desktop; and we assumed that 22% of laptops have one. – 22% accounts for 1/3 of office laptops having an external monitor as well as 5% of the remaining
commercial laptops.
» To break the installed base into CRT and LCD, we took the percentages given in NCI (2009) 21% and 79%, respectively. LCDs are increasing in market share, so we projected that within two 4-year lifecycles from 2009, CRTs will constitute 0% of the installed base.
Power Consumption and Usage: » Power consumption values are weighted averages of the number of CRTs and LCDs.
» We assumed that the power consumption of CRTs in each mode will remain the same through 2017.
» Hourly usage values are weighted averages of the amount of time commercial desktops and laptops are in each of the modes.
We encountered many challenges while analyzing computer monitor installed base and energy consumption.
MEL Update » CMEL Results › Computer Monitors

50 ©2013 Navigant Consulting, Inc. E N E R G Y
» Commercial Kitchen Ventilation systems are comprised of: – Exhaust hood(s) – Exhaust fan(s) – Make-up air (MUA) fan(s) – Space conditioning system to heat/cool MUA – Ducting
» Our analysis covers the energy consumption due to exhaust and MUA fans, but excludes the conditioning loads because very little primary data are available and NEMS data are based solely on fan power.
Commercial kitchen ventilation (CKV) consumed 41 TWh in 2011, but demand-based controls will reduce the AEC in future years.
MEL Update » CMEL Results › Kitchen Ventilation
2011 2015 2020 2030 2040Installed Base (000s) 790 810 860 950 1,050
On 8,071 7,911 7,335 6,306 5,153
Off 0 0 0 0 0
On 6,100 6,100 6,100 6,100 6,100
Off 2,660 2,660 2,660 2,660 2,660UEC kWh/yr 52,000 51,000 48,000 41,000 33,000AEC TWh/yr 41 41 41 39 35
Power Draw (W)
Annual Usage (hrs)

51 ©2013 Navigant Consulting, Inc. E N E R G Y
» We assume one CKV system per facility for: – Food Sales (grocery stores, other
food sales) – Food Service (fast food, restaurant,
other food service) – Public Assembly
(entertainment/culture) – Education (college/university,
elementary or middle school, high school)
– Healthcare (inpatient healthcare) – Lodging (hotel) – Retail (Malls)
Building codes require all commercial kitchens to install a CKV; however, little data is available on the installed base, so our assumptions are based on 7 targeted building types.
MEL Update » CMEL Results › Kitchen Ventilation
» Split by building type is based on CBECS (projected to 2011 using AEO floor space growth rates)
2011 Base Year Data Installed Base (000s)
UEC (kWh/yr) AEC (TWh/yr)
Assembly 30 109,000 3.3Education 300 51,500 16Food Sales 100 111,000 12Food Service 320 22,900 7.4Healthcare 9 105,000 0.9Lodging 21 112,000 2.4Large Office 0 0 0Small Office 0 0 0Mercantile & Service 4 119,000 0.5Warehouse 0 0 0Other 0 0 0

52 ©2013 Navigant Consulting, Inc. E N E R G Y
» There are currently no mandatory energy efficiency standards for CKV.
» We estimated UEC by taking the average from 14 different case studies.*
» To calculate the installed base of Commercial Kitchen Ventilation systems, we separated CKV system into 3 main subgroups by exhaust fan capacity:
» Data for the number of installed commercial kitchen ventilation unit are unavailable.
» We assumed that growth in the installed base would follow the growth trend in commercial floor space
» Multiple case studies show up to 65% savings in UEC by using a Demand Control Ventilation (DCV). DCV uses a Variable Frequency Drive (VFD) to modulate the speed of the exhaust and MUA fan motor based on outdoor temperature and kitchen demand.*
Commercial kitchen ventilation (cont.)
MEL Update » CMEL Results › Kitchen Ventilation
Installed Base (000s)
UEC (kWh/yr)
AEC (TWh/yr)
Size Category (Exhaust Fan CFM Capacity)
Small 320 23,000 7 <=9000
Medium 300 51,000 16 >9000 and <=20,000
Large 170 111,000 19 >20,000
Case study sources: http://www.etcc-ca.com/images/stories/et_07_10_dcv_com_kitch_hoods_final_report.pdf, http://partnershipdemonstrations.org/file_browser/db/Kitchen_DVC_Case_Study_CCCs_draft_D.pdf, http://www.fishnick.com/publications/appliancereports/hoods/mark_hopkins_melink_report.pdf, http://www.fishnick.com/publications/appliancereports/hoods/Supermarket_Melink_Report.pdf

53 ©2013 Navigant Consulting, Inc. E N E R G Y
Technology includes three sub groups: » Refrigerators: 4°C – Blood, some medications/vaccines, non-volatile reagents and
biological specimens (e.g., mice) » Freezers: -20°C – Volatile reagents, biological specimens, certain medications/vaccines » Ultra-low Freezers (ULF): -70 to -80°C – Long-term sample storage, proteins, cells &
small biological samples » Excluded: Cryogenic (-150 C) and liquid nitrogen freezers
Lab refrigerators and freezers consumed 4.5 TWh in 2011 with a slow decline expected in the future.
MEL Update » CMEL Results › Lab Refrigerators and Freezers
2011 2015 2020 2030 2040Installed Base (000s) 1,000 1,030 1,100 1,200 1,300
Compressor On Cycle 975 920 857 742 642Compressor Off Cycle 50 47 44 38 33Off 0 0 0 0 0Compressor On Cycle 4,380 4,380 4,380 4,380 4,380Compressor Off Cycle 4,380 4,380 4,380 4,380 4,380Off 0 0 0 0 0
UEC kWh/yr 4,500 4,200 3,900 3,400 3,000AEC TWh/yr 4.5 4.3 4.3 4.1 3.9
Power Draw (W)
Annual Usage (hrs)

54 ©2013 Navigant Consulting, Inc. E N E R G Y
» Three types of establishments dominate the market for lab-grade refrigeration and there are relatively few discrete entities. – Research universities – Pharmaceutical companies – Large government agencies (CDC, NIH)
Lab refrigerators and freezers are used in labs at universities, pharmaceutical companies and government agencies.
MEL Update » CMEL Results › Lab Refrigerators and Freezers
Installed Base (000s)
UEC (kWh/yr) AEC (TWh/yr)
Assembly 0 0 0Education 200 5,000 1.0Food Sales 0 0 0Food Service 0 0 0Healthcare 300 4,100 1.2Lodging 0 0 0Large Office 0 0 0Small Office 0 0 0Mercantile & Service 0 0 0Warehouse 0 0 0Other 400 5,700 2.3
Photo Source: http://www.labrepco.com

55 ©2013 Navigant Consulting, Inc. E N E R G Y
Growth Rates: » Growth in the installed base assumed to be the same as growth in commercial floor space.
» Increases in efficiency over time assume that after two turnovers of the installed base, annual equipment energy use decreases by approximately 25%.
» No efficiency standards currently exist, but efficiency is expected to increase due to: – Future ENERGY STAR specifications: ESTAR is currently developing a test procedure – Use of hydrocarbon refrigerants: not currently allowed in the US, but is in Europe, where it
contributes to higher efficiency of equipment (subject to EPA approval) – New technologies: most products use one or more (cascaded) vapor compression cycle(s). However,
one ULF manufacturer has introduced a Stirling-cycle freezer that shows dramatic energy savings.
Energy Use: » Average equipment size and energy use came from manufacturer-supplied data for the Lab
R/F ENERGY STAR test method development.
» No ENERGY STAR, DOE, industry, or other energy specification for these products exists.
» Our analysis broke out the three different temperatures of equipment:
Lab refrigerators and freezers (cont.)
MEL Update » CMEL Results › Lab Refrigerators and Freezers
Installed Base (000s)
UEC (kWh/yr)
AEC (TWh/yr)
Refrigerator 400 3,300 1.3 Freezer 350 4,400 1.5 Ultra-low Freezer 250 6,600 1.6

56 ©2013 Navigant Consulting, Inc. E N E R G Y
» Medical Imaging includes MRI, CT, X-ray, Ultrasound
» MRI constitutes 50% of the total AEC
Medical imaging equipment consumed 2.7 TWh in 2011, with slow growth expected; however ,this may be a rapidly evolving end use.
MEL Update » CMEL Results › Medical Imaging Equipment
Photo Source: www.teslasociety.com
Installed Base (000s)
UEC (kWh/yr) AEC (TWh/yr)
MRI 12 111,000 1.3CT Scan 13 42,000 0.56X-Ray 78 9,500 0.74Ultrasound 75 760 0.06
2011 2015 2020 2030 2040Installed Base (000s) 178 186 195 215 238
Active 27,774 27,774 27,774 26,416 25,124Idle/Ready 2,849 2,849 2,849 2,710 2,577Sleep/Standby 2,108 2,108 2,108 2,005 1,907Off 346 346 346 329 313Active 762 762 801 885 977Idle/Ready 292 292 307 339 375Sleep/Standby 2,512 2,512 2,610 2,822 3,055Off 5,193 5,193 5,041 4,714 4,352
UEC kWh/yr 15,000 15,000 15,500 15,400 15,400AEC TWh/yr 2.7 2.8 3.0 3.3 3.7
Power Draw (W)
Annual Usage (hrs)

57 ©2013 Navigant Consulting, Inc. E N E R G Y
» Medical imaging equipment is used in large, inpatient healthcare facilities as well as outpatient healthcare offices, which are classified as small offices.
» Some are used at universities, but the quantities are limited, particularly for MRI and CT.
» Does NOT include dental X-ray machines, which have a much higher installed base, but are powered off more than 75% of the time. Based on a population of 5700 dental X-rays in PA, we expect that the US has an entire population of approximately 140,000.
Medical imaging equipment is used in hospitals (healthcare category), and outpatient healthcare (small office category) buildings.
MEL Update » CMEL Results › Medical Imaging Equipment
2011 Base Year Data Installed Base (000s)
UEC (kWh/yr) AEC (TWh/yr)
Assembly 0 0 0Education 0 0 0Food Sales 0 0 0Food Service 0 0 0Healthcare 59 32,500 1.9Lodging 0 0 0Large Office 0 0 0Small Office 120 6,500 0.77Mercantile & Service 0 0 0Warehouse 0 0 0Other 0 0 0

58 ©2013 Navigant Consulting, Inc. E N E R G Y
Installed Base: » $2.5 Billion market for X-ray machines in 2015 (a slight increase from today) due mostly
to growth of more expensive, but much better digital equipment.
» TIAX estimates 48k mammography machines, 17k fluoroscopy machines, and 21k non-medical x-rays, all of which have smaller AECs and are not included here.*
» Markets contracted significantly during recession, and will rebound in the coming years, but are not expected to return to the growth seen in the mid 2000s (10-30% annually).
» Estimates of X-ray units in the US varies widely, but the total variation may only impact the AEC by up to approximately 0.2 TWh/yr.
Energy Use: » Unclear whether imaging is consistently used 7 days per week. In many locations, it may
only be used 5 days per week, which would reduce the UEC proportionately.
» TIAX (2006) reports an x-ray UEC that is more than double our estimate due to a 50% utilization rate, which we believe to be unrealistic; typical x-rays are off for 14 hrs/day, idle for 9 hours, and are only exposing for as little as a few minutes per day (“partial power” mode to move bed, rotate gantry, etc., for the remaining time).**
» Estimated MRI/CT building-type split is 90% in hospitals, 10% in outpatient healthcare
Medical imaging equipment (cont.)
MEL Update » CMEL Results › Medical Imaging Equipment
*Source: TIAX (2006) “Commercial and Residential Sector Miscellaneous Electricity consumption: Y2005 and Projections to 2030” **Calculated based on power by mode from From http://emse.mst.edu/media/academic/emse/documents/EMSEGraduateSeminar-DrJanetTwomey.pdf

59 ©2013 Navigant Consulting, Inc. E N E R G Y
» Includes electronic displays or screens (typically LCD or plasma) used to deliver entertainment, information and/or advertisement in public or private commercial spaces.
» Does not include displays less than 30 inches
» Does not include large arena/stadium displays (see “Large-Format Video Displays” on page 62)
» The market for commercial video displays is relatively new and very dynamic with a recent compound annual growth rate of 20-25%.
Commercial video displays consumed 2 TWh in 2011, with dynamic growth expected.
MEL Update » CMEL Results › Video Displays

60 ©2013 Navigant Consulting, Inc. E N E R G Y
» Retail stores represent about 40% of commercial video display AEC.
» Current high growth markets include; university campuses where they are being used to convey news, public safety information, coming events, and general way-finding; fast food restaurant for dynamic menus and nutrition information; and food sales such as grocery stores and gas stations primarily for advertising.
» As consumer TVs reach market saturation, manufacturer focus may shift to commercial video displays.
Commercial video displays are most commonly found in retail environments where they are primarily use for advertising and branding.
MEL Update » CMEL Results › Video Displays

61 ©2013 Navigant Consulting, Inc. E N E R G Y
Installed Base: » Professional displays and signage is a new and dynamic market with extremely high
uncertainty.
» Recent dramatic growth is expected to be sustained beyond 2016 according to worldwide shipping forecasts.
» This analysis assumes the current U.S. installation rate of about 400,000 displays per year will continue through 2040.
Power Consumption: » Power consumption is similar to commercial TVs and is largely a function of screen size which
increase from 41.3 inches in 2011 to 46.5 inches in 2013 and is expected to continue to grow toward 60 inches on average.
» Organic LED (OLED) and Laser Phosphor Display (LPD) technologies have the potential to reduce energy consumption by 40-75% but will be prohibitively expensive for several more years.
Hourly Usage: » Hours of operation are assumed to coincide with typical retail store hours of about 12 hours per
day
» As the usage patterns of commercial video displays will likely remain similar in the future, we assumed they would stay the same through 2040.
Commercial video displays (cont.)
MEL Update » CMEL Results › Video Displays

62 ©2013 Navigant Consulting, Inc. E N E R G Y
» Includes large-format video screens (typically LED) used to deliver live feed and video replay, game and player stats, advertisements, and other information and entertainment directed at sports fans in stadiums and arenas.
» Does not include digital billboards.
» Does not include standard television-sized displays at arenas, such as those for spectator viewing in concession areas (see “Video Displays” on page 59)
Large Format Video Displays, i.e., stadium video boards, consumed 0.15 TWh in 2011; we expect this to decrease gradually in the future.
MEL Update » CMEL Results › Large Format Video Displays
2011 2015 2020 2030 2040Installed Base (000s)* 1.0 1.0 1.0 1.0 1.0
Active 190,000 180,000 171,000 161,000 152,000Off 0 0 0 0 0Active 800 800 800 800 800Off 7,960 7,960 7,960 7,960 7,960
UEC kWh/yr 152,000 144,000 137,000 129,000 121,000AEC TWh/yr 0.15 0.14 0.14 0.13 0.12* Note that installed base is the number of venues with installed video boards, not the number of individual video boards.
Power Draw (W)
Annual Usage (hrs)

63 ©2013 Navigant Consulting, Inc. E N E R G Y
Installed Base: » The number of sporting venues in the
U.S. is fairly static, however, the quantity and average size of individual video boards per venues is increasing.
Unit Power Consumption: » Power consumption per unit of display
area is expected to decrease through 2040 as a result of efficiency gains, which will be partially offset by increasing average screen size.
Hourly Usage: » Hours of operation based on 100 events
per year and 8 hours of operation per event
» As the usage patterns of commercial video boards will likely remain similar in the future, we assumed they would stay the same through 2040.
For the purposes of this analysis, we considered only video boards installed at sporting venues such as stadiums and arenas.
MEL Update » CMEL Results › Large Format Video Displays

64 ©2013 Navigant Consulting, Inc. E N E R G Y
» Includes video surveillance, physical access control, intruder and fire detection, and electronic article surveillance (EAS) systems.
» Does not include IT equipment captured under other categories such as Ethernet switches and some computers and monitors.
» Video surveillance and intrusion/fire detection account for the majority of AEC.
» Strong growth expected due to security concerns, increased networking capabilities and integration with building energy management and controls systems, and increased cloud-hosted security as a service (Saas) offerings.
Commercial security systems consumed 7 TWh in 2011 with strong growth expected, especially for video surveillance.
MEL Update » CMEL Results › Security Systems
2011 2015 2020 2030 2040Installed Base (000s) 11,000 12,000 14,000 18,000 22,000
Active 290 270 260 240 230Off/Standby 0.0 0.0 0.0 0.0 0.0Active 8760 8760 8760 8760 8760Off/Standby 0 0 0 0 0
UEC kWh/yr 2,500 2,400 2,300 2,100 2,000AEC (TWh/yr) 7 8 9 11 13
Power Draw (W)
Annual Usage (hrs)

65 ©2013 Navigant Consulting, Inc. E N E R G Y
» Security systems are found at all types of commercial buildings with the exception of EAS systems which are typically only found at retail and some food sales stores
» UEC is largely a function of floor space and as a result is dominated by hospitals and large office buildings.
» AEC is fairly evenly distributed across building types except for healthcare which has a small installed base and food sales and service locations which have a small to moderate installed base and small UEC (due to small average floorspace)
Commercial security system components and setups vary significantly between buildings.
MEL Update » CMEL Results › Security Systems

66 ©2013 Navigant Consulting, Inc. E N E R G Y
Installed Base: » Installed base is primarily a function of building quantity and market saturation for each system type. » The market saturation rate is about 52% for video surveillance, 45% for access controls, 75% for
intrusion/fire detection, and 19% for EAS. » Very little projection data available. Power Consumption: » Power consumption varies significantly by system type, building type, and building size. » Power consumption for video surveillance, access control, and EAS systems determined by assuming
a typical set of system components for a typically sized building and determining the power consumption of each component base on a sample of manufacturer specification sheets (subsequently, UEC was weighted by relative floor space of each building type).
» Little data was available to determine a “typical” set of components comprising an intrusion/fire detection system so the energy intensity (including power supplies) of residential security systems (about 7 watts per 1,700 sqft) was applied to average floor space by building type.
Hourly Usage: » Commercial security systems are assumed to operate 24/7/365. » As the usage patterns of commercial security systems will likely remain similar in the future, we
assumed they would stay the same through 2040.
We encountered many challenges while analyzing commercial security systems, primarily a lack of available data.
MEL Update » CMEL Results › Security Systems

67 ©2013 Navigant Consulting, Inc. E N E R G Y
2 Methodology
1 Background
Commercial MELs 3
Residential MELs 4
Table of Contents
References/Appendices 5

68 ©2013 Navigant Consulting, Inc. E N E R G Y
MEL Update » RMEL Results › MEL List
The team analyzed 15 residential MELS.
Residential MELs Description, examples Dehumidifiers Residential-size, standalone dehumidifiers Set-top Boxes, All Cable, Satellite, Fiber, IPTV, and Over-The-Top (OTT) Modems & Routers Equipment for home broadband internet and networking External Power Supplies Power chargers that are not integral to the product Non-Computer Rechargeable Electronics Mobile phones, digital cameras, handheld vacuums, etc. Ceiling Fans Ceiling Fans, not including lighting power consumption Televisions LCD and CRT televisions DVD DVD players and recorders and DVD-VCR combos PCs, Laptop Laptop computers, including tablet computers PCs, Desktop Desktop computers Monitors (i.e. desktop PC monitors) Monitors (used with both laptops and desktops) Audio Equipment Home theater, amplifiers, speakers, etc. Portable Electric Spas Electrically-heated hot tubs Pools/Pool Pumps Pools, in-ground and above-ground Security Systems, Home Residential security systems including pinpads, sensors, etc.

69 ©2013 Navigant Consulting, Inc. E N E R G Y
» DOE separates dehumidifiers into product classes by capacity (pints/day).
» Dehumidifiers are covered in the DOE codes and standards program, but anecdotal field data suggest that actual performance is highly variable and UEC/AEC are poorly understood in real world circumstances.
» This analysis includes only portable units, and excludes whole-home dehumidifiers that are built into the ductwork.
Dehumidifiers consumed 11 TWh in 2011, with minimal expected future growth.
MEL Update » RMEL Results › Dehumidifiers
Photo Source: http://www.dehumidifierssale.com
2011 2015 2020 2030 2040Installed Base (000s) 15,600 16,400 17,400 19,500 21,600
Active Power 644 637 627 609 591Full/Removed 1.6 1.6 1.6 1.5 1.5
Off-Cycle/Inactive/Off 0.5 0.5 0.5 0.5 0.5Unplugged 0 0 0 0 0
Active Hours 1,096 970 833 833 833Full/Removed 658 658 658 658 658
Off-Cycle/Inactive/Off 3,004 3,126 3,263 3,263 3,263Unplugged 4,017 4,017 4,017 4,017 4,017
UEC kWh/yr 710 620 530 510 490
AEC TWh/yr 11.1 10.2 9.2 9.9 10.6
Annual Usage (hrs)
Power Draw (W)

70 ©2013 Navigant Consulting, Inc. E N E R G Y
Energy Efficiency: » Conventional vapor-compression technology is approaching the end of cost-effective
improvements, so the potential for technological advancement is unclear.
» EF is expected to improve by 33% over the next 10 years as some product classes are eliminated. We expect improvement in EF will be achieved through a 33% reduction in active mode hours needed to achieve the same level of water removal.
» Hours for standby, bucket full, and unplugged were taken from the dehumidifier 2010 test procedure notice of public rulemaking (NOPR).
Installed Base: » Projections are based on the average of:
– AHAM historical shipment data and the average lifetime of a dehumidifier – RECs estimate that 12% of homes have dehumidifiers in the US
» The installed base is expected to grow at a slow but consistent pace, which is consistent with the typical characteristics of homes that contain dehumidifiers.
» Market Share by capacity is from the dehumidifier TSD.
» Although the installed base is increasing slowly, the reduction in active mode hours will likely lower dehumidifier energy consumption in the US over time.
Dehumidifiers (cont.)
MEL Update » RMEL Results › Dehumidifier

71 ©2013 Navigant Consulting, Inc. E N E R G Y
STBs include four sub categories of products for delivering TV content:
Set-Top-Boxes (STB) consumed 22.4 TWh in 2011 and will increase in coming years due in part to development of the OTT market.
MEL Update » RMEL Results › Set-Top-Boxes
Photo Source: http://www.digitaltrends.com
2011 2015 2020 2030 2040Installed Base (000s) 176,000 233,000 352,000 400,000 442,000
Watch 17.1 15.0 13.5 10.3 10.1Sleep 16.3 13.4 11.4 8.7 8.5AutoPowerDown 6.6 6.0 5.9 8.3 8.5Multistream 8.0 8.4 8.8 7.5 7.3Watch 3173 2845 2543 1894 1850Sleep 3650 3650 3650 3650 3650AutoPowerDown 1322 1608 1863 2509 2555Multistream 615 657 703 707 705
UEC kWh/yr 127.2 106.8 92.9 77.3 76.3AEC TWh/yr 22.4 24.9 32.7 30.9 33.7
Power Draw (W)
Annual Usage (hrs)
Cable Satellite IPTV OTT2011 AEC 14.0 7.3 1.1 0.1
» IPTV STBs (newer technology) use internet protocol to deliver traditional TV content
» Over-The-Top (OTT) STBs, including Roku, Boxee, Apple TV, which stream internet content to the TV - newest market entrant, with high growth potential as available online content increases

72 ©2013 Navigant Consulting, Inc. E N E R G Y
» Originally OTT STB were included with DVD players; products were re-categorized as STBs, based on content delivery method and customer/service provider relationship.
» Analysis is based on DOE standards rulemaking analysis*
Energy Efficiency: » A trend of increasing per unit energy efficiency is tied to voluntary efforts of the National
Cable and Telecommunications Association.** The forecasted efficiency levels show average energy use declining despite boxes providing greater functionality.
Installed Base: » Near-term: Cable is losing market share to IPTV (Satellite is stable); due in part to new
providers and infrastructure changeover by existing cable providers.
» The installed base jump through 2020 is due to a brief transition to a client server architecture (e.g. Dish’s Hopper/Joey offering). The deployment of thin clients temporarily leads to an increase in shipments; but upon saturation, shipments will return to match replacements and nominal growth in subscribership.
» TIAX installed base data suggested a contraction tied to point-of-deployment slot functionality. Recent shipment growth indicates little advancement on this front.
Set-Top-Boxes (cont.)
MEL Update » RMEL Results › Set-Top-Boxes
*DOE STB notice of data availability: http://www1.eere.energy.gov/buildings/appliance_standards/rulemaking.aspx/ruleid/33 **CEA/NCTA voluntary agreement: http://www.ncta.com/news-and-events/media-room/article/2453

73 ©2013 Navigant Consulting, Inc. E N E R G Y
This category includes: » Broadband modems – including cable, DSL, fiber, satellite
» Routers, Hubs, Switches – equipment that provides networking capabilities for multi-computer access. Hubs and switches are the least common, and constitute a very small portion of the market share.
» Integrated Access Devices (IAD) – devices which include functionality of both a broadband modem and a router; these will become increasing common as many internet service provides move to use these exclusively
Modems and routers consumed 7 TWh in 2011, but due to consolidation of devices, this will decrease in coming years.
MEL Update » RMEL Results › Modems and Routers
Photo Source: http://www.digitallanding.com
2011 2015 2020 2030 2040Installed Base (000s) 138,000 120,000 120,000 120,000 130,000
Active 5.6 5.0 4.3 3.2 2.3Idle/Ready/Off 0 0 0 0 0Active 8760 8760 8760 8760 8760Idle/Ready/Off 0 0 0 0 0
UEC kWh/yr 51 44 38 28 20AEC TWh/yr 7.0 5.2 4.5 3.3 2.6
Power Draw (W)
Annual Usage (hrs)

74 ©2013 Navigant Consulting, Inc. E N E R G Y
Operating Modes: » Fraunhofer (2011) reported that modems/routers spends some portion of time in "Off"
Mode because in a small survey, a small percentage of responded that they unplugged their modems/routers when not in use.
» This is inconsistent with other reports, and is believed to be an insignificant portion of the market currently. These estimates assume zero time Off Mode.
Installed Base: » Installed base data varies between sources, potentially due to rapid changes in the
penetration of the equipment, and the transition to IADs (Power consumption estimates are consistent between a variety of sources).
» The market is reaching saturation; growth in the future will be due to household growth.
» As the replacement of modem + router combinations with IADs continues, the total installed base will actually decrease; this process will be more rapid than the growth of the number of households.
» There will still exist some applications where an additional hub or switch may be necessary; the Routers & Other Devices category may never totally disappear.
Modems and routers (cont.)
MEL Update » RMEL Results › Modems and Routers

75 ©2013 Navigant Consulting, Inc. E N E R G Y
» EPS category is based on the DOE-standard definition: power supplies and battery chargers that drive electronics, but are not an integral part of the product.
» Product classes are defined by the type of power they output (DC/AC) and the power. » Computers and other electronics products require EPS for power, so we double count
their energy consumption in each category (>95% of this MEL is counted elsewhere)
External power supplies (EPS) consumed 7 TWh in 2011.
MEL Update » RMEL Results › External Power Supplies
Photo source: http://www.computershop.uk.com
2011 2015 2020 2030 2040Installed Base (000s) 1,077,000 1,210,000 1,400,000 1,880,000 2,530,000
Active 0.9 0.8 0.7 0.4 0.3No Attached Load/Standby 0.04 0.03 0.03 0.02 0.01Unplugged/Off 0 0 0 0 0Active 6,389 6,389 6,389 6,389 6,389No Attached Load/Standby 521 521 521 521 521Unplugged/Off 1,853 1,853 1,853 1,853 1,853
UEC kWh/yr 6.5 5.6 4.9 3.2 2.2AEC TWh/yr 7.0 6.8 6.8 6.0 5.7
Annual Usage (hrs)
Power Draw (W)
2011 AEC ExamplesProduct Class B: 2.5W 0.28 Mobile Phones, Answering Machines, Cordless PhonesProduct Class B: 18W 0.84 LAN Equipment, Media Tablets, MP3 Speaker DocksProduct Class B: 60W 4.33 Laptop Computers, Video Game ConsolesProduct Class B: 120W 1.16 Laptop ComputersProduct Class C: AC-DC Low 0.16 Mobile Phones, Smartphones, Digital CamerasProduct Class D: AC-AC Basic 0.17 Home Security Systems, Aquarium Accessories, Water SoftenersProduct Class E: AC-AC Low 0.01 Aquarium Accessories

76 ©2013 Navigant Consulting, Inc. E N E R G Y
» DOE, by statute, is required to revisit EPS efficiency standards every 5 years and where appropriate, increase standards.
» This analysis, in parallel with DOE definitions, includes EPS that are used in both residential and commercial buildings, and are often carried in between regularly.
Power Consumption: » EPS use power in Active Mode (when powering the device) as well as in Standby Mode,
when the EPS is plugged in, but the device is not connected.
» Growth rates based on average efficiency gains from one Candidate Standard Level (CSL) to the next in the DOE rulemaking analysis – Assumes that DOE standards will slowly work through the efficiency levels as technology progresses.
Double Counting: » The double-coverage of EPS in other product categories, including rechargeable
electronics, in DOE standards is a known issue.
» For some products, it is possible to avoid double counting of energy consumption, but for many product classes, it is not possible since the EPS works directly with the product and is tested that way.
External power supplies (cont.)
MEL Update » RMEL Results › External Power Supplies

77 ©2013 Navigant Consulting, Inc. E N E R G Y
» Includes all products that require charging, except computers, making this a very complex analysis, the results of which obscure the nuances of each product (this occurs in many MELs, but is extreme in this case due to the vast number of included products).
Non-computer rechargeable electronics consumed 4.4 TWh in 2011, some of which overlaps (i.e., double counted) with EPS.
MEL Update » RMEL Results › Non-Computer Rechargeable Electronics
2011 AEC ExamplesSmall Rechargeables (<100Wh, <4V) 2.90 Mobile Phones, Smartphones, Digital CamerasMedium Rechargables (<100Wh, 4-10V) 0.28 Camcorders, Toy Ride on Vehicles, Portable DVD PlayersLarge Rechargeables (<100Wh, >10V) 0.47 Cordless Vacuums (Handheld, Stick, Robotic)Small Inductive Wet Environment 0.60 Rechargeable ToothbrushesSmall DC-DC Chargers (<9V) 0.14 MP3 Players, Mobile Phones, Digital Cameras (USB charged)Large DC-DC Chargers (≥9V) 0.01 In Vehicle GPSs
2011 2015 2020 2030 2040Installed Base (000s) 1,200,000 1,350,000 1,570,000 2,110,000 2,840,000
Active Mode 1.18 1.04 0.89 0.59 0.44Maintenance 0.93 0.82 0.71 0.47 0.47No Attached Load/Standby 0.28 0.25 0.21 0.14 0.14Off 0 0 0 0 0Active Mode 796 504 504 504 504Maintenance 2,510 2,781 2,781 2,781 2,781No Attached Load/Standby 1,605 1,605 1,605 1,605 1,605Off 3,855 3,855 3,855 3,855 3,855
UEC kWh/yr 3.7 3.2 2.8 1.8 1.8AEC TWh/yr 4.4 4.3 4.3 3.9 5.0
Power Draw (W)
Annual Usage (hrs)

78 ©2013 Navigant Consulting, Inc. E N E R G Y
» Analysis based primarily on engineering analysis for DOE rulemaking activity
Power Consumption: » We derived Active Mode power use projections from the efficiency gains seen in external
power supplies. This approach assumes that efficiencies will continue to increase at the same rate.
» Usage rates based on consumer habits; assumed to not change, with one exception: – New energy efficiency standards issued by the CA Energy Commission (and closely followed by
the US DOE) will shift hours away from active mode into maintenance mode – a change that is not related to consumer behavior
– As a result, subject matter experts from the DOE rulemaking process indicated manufacturers will have to introduce improved charging circuitry to cause the battery charger to enter maintenance mode (a lower power mode) earlier in the charge cycle
– Once products meet the initial standards, older circuit designs with will be eliminated; energy use reductions beyond 2015 will not be coupled with changes in hours in each mode
Installed Base: » Mobile phone growth is estimated at 3% annually; they make up the majority of non-
computer rechargeable shipments (~63%). » Projected to be the largest category of MELs investigated in this project in terms of
installed base with approximately 2 billion products in use in 2040.
Non-computer rechargeable electronics (cont.)
MEL Update » RMEL Results › Non-Computer Rechargeable Electronics

79 ©2013 Navigant Consulting, Inc. E N E R G Y
» This category includes all household style ceiling fans that are permanently installed. » Excludes attic and whole-house fans and energy consumption of attached light fixtures. » More than 40% of all fans are in the southern US (based on Census Region). » Installed base grows in parallel to housing starts. » We base the hourly usage on assumptions from TIAX (2008) which are split by census
division. This underestimates usage in cooling season, but overestimates usage in shoulder months and in heating season, which puts us as close to an actual estimate as we can make.* TIAX (2008) and FSEC (2010) both includes suggestions on calculation hours of use based on cooling-season weather; these approaches ignore heating-season usage entirely.
Ceiling fans consumed 20 TWh in 2011.
MEL Update » RMEL Results › Ceiling Fans
*Source: Roth Et. Al. TIAX 2008, “Residential Miscellaneous Electric Loads: Energy Consumption Characterization and Savings Potential in 2006 and Scenario-based Projections for 2020.” and Florida Solar Energy Center. "Updated Miscellaneous Electricity Loads and Appliance Energy Usage Profiles for Use in Home Energy Ratings, the Building America Benchmark Procedures and Related Calculations.” Revised 10 June 2011.
2011 2015 2020 2030 2040Installed Base (000s) 263,000 283,000 300,000 325,000 325,000
High Speed 83 78 71 59 49Med Speed 35 33 31 28 25Low Speed 14 12 9 6 4Off 0 0 0 0 0High Speed 425 428 432 438 444Med Speed 849 856 864 876 888Low Speed 849 856 864 876 888Off 6,637 6,621 6,601 6,571 6,541
UEC kWh/yr 77 71 65 55 47AEC TWh/yr 20 20 20 18 15
Power Draw (W)
Annual Usage (hrs)

80 ©2013 Navigant Consulting, Inc. E N E R G Y
» The number and usage of fans in the home varies by Census Region (based on FSEC 2010)*
» Reductions in UEC in the future may be from lower usage or lower power; this analysis assumes the gains are due to lower power consumption: – Because ceiling fans during cooling season only benefit nearby occupants, fan usage could
optimally be controlled via occupancy sensor, thereby reducing the UEC; however, at this time this trend has not yet picked up and we exclude it from this analysis. (During heating season, reverse operation reduces air stratification and would provide benefit even for those not in the room. )
– Instead, power consumption decreases corresponding to ENERGY STAR guidelines, using higher efficacy blades and more efficient motors.
» The trend of hourly usage will project along the same lines as the TIAX 2006 report
Ceiling fans (cont.)
MEL Update » RMEL Results › Ceiling Fans
Census Region # Fans/House
Northeast 2.6
Midwest 2.8
South 3.2
West 2.4
*Source: Parker, et. al., FSEC (2010) “Updated Miscellaneous Electricity Loads and Appliance Energy Usage Profiles for Use in Home Energy Ratings, the Building America Benchmark Procedures and Related Calculations “

81 ©2013 Navigant Consulting, Inc. E N E R G Y
This category includes: » Cathode Ray Tubes (CRT) – 47% of installed base
» Liquid Crystal Displays (LCD) – 42% of installed base
» Plasma – 11% of installed base
Televisions consumed 70 TWh in 2011, but efficiency is improving with the changeover to LCDs; however increases in typical size counter some efficiency gains.
MEL Update » RMEL Results › Televisions
2011 2015 2020 2030 2040Installed Base (000s) 355,000 364,000 388,000 444,000 501,000
Active 127 95 83 69 62Off/Standby 1.62 1.13 0.49 0.40 0.4Active 1,460 1460 1460 1460 1460
Off/Standby 7300 7300 7300 7300 7300UEC kWh/yr 197 150 130 100 94AEC TWh/yr 70.0 54.6 50.4 44.4 47.1
Power Draw (W)
Annual Usage (hrs)

82 ©2013 Navigant Consulting, Inc. E N E R G Y
Installed Base: » 353 million in 2010 - represents ~65 TWh per year in energy use. We anticipate a slight
rise in the AEC in 2011 due to the continued growth of the installed base.
» On average 3 TVs per household in the US (Fraunhofer 2011).*
» Transition to digital broadcasting (2009) accelerated CRT retirement (complete by 2030).
» To calculate the install base growth, the team assumed that the quantity will grow proportional to the growth of households (assuming constant number per household).
Energy Usage: » To date, DOE has not established efficiency standards, but they are included in ENERGY
STAR; in 2011, 97% of all new TVs were ENERGY STAR qualified.
» Active Mode power depends on the screen area. The majority of TVs sold are 40 to 44“.
» We assumed that in 2015, most TVs will still meet the new ENERGY STAR V 5.0 specification. While many TV's will be MORE efficient, insufficient data are available to determine to project to what extent.
» Projections to 2040 based on 10% reduction in power consumption for the current best-in-class, 42in ENERGY STAR qualified TV.
Televisions (cont.)
MEL Update » RMEL Results › Televisions
*Source: Fraunhofer (2010) “Energy Consumption of Consumer Electronics in U.S. Homes in 2010”

83 ©2013 Navigant Consulting, Inc. E N E R G Y
This category includes: » Standalone DVD players
» DVD Recorders
» DVD-VCR Combos
» Excluded: Standalone VCRs because of a rapidly decreasing installed base, and blu-ray because Fraunhofer (2010) estimates 0.2 TWh/yr AEC*
DVDs consumed 6 TWh in 2011, but rapid penetration of streaming media will reduce energy consumption in the near future.
MEL Update » RMEL Results › DVD
Type Active (W) Idle (W) Sleep
(W)
Standalone DVD 9.0 5.0 1.5
DVD Recorder 18.0 14.0 3
DVD-VCR Combo 12.0 8.0 3
*Source: Fraunhofer (2010) “Energy Consumption of Consumer Electronics in U.S. Homes in 2010”
2011 2015 2020 2030 2040Installed Base (000s) 227,000 218,000 189,000 128,000 86,000
Active 11.8 10.6 9.3 7.2 5.5Idle/Ready 8 7.0 6.1 4.6 3.5Sleep/Standby 2 1.8 1.4 0.9 0.6Off 0 0 0 0 0Active 284 284 284 284 284Idle/Ready 804 804 804 804 804Sleep/Standby 7672 7672 7672 7672 7672Off 0 0 0 0 0
UEC kWh/yr 27 23 19 13 9AEC TWh/yr 6.0 4.9 3.5 1.6 0.8
Power Draw (W)
Annual Usage (hrs)

84 ©2013 Navigant Consulting, Inc. E N E R G Y
» DVDs are not covered by DOE efficiency standards; but they are included in ENERGY STAR; in 2011, 66% of all DVDs sold were ENERGY STAR qualified.
» There were on average 2.1 DVD's per household in the United States (Fraunhofer 2011).
» Fraunhofer 2011 reported 93% household penetration.
» The sale and installed base of DVDs is in decline as more consumers are moving away from DVDs and blu-ray discs, towards streaming online content.
» We estimate a drop in installed base of more than 60% between now and 2040.
» To forecast energy consumption, we assumed that calculated the energy improvement over the next 30yrs using the average power consumption of the best in class listed E* products today.
DVD (cont.)
MEL Update » RMEL Results › DVD

85 ©2013 Navigant Consulting, Inc. E N E R G Y
» Category includes laptops, netbooks, and tablet computers.
» TIAX estimated 75% fewer laptops in 2008, and while this estimate may have been low, growth has clearly exploded due to our inclusion of tablets.
Laptops consumed 9.8 TWh in 2011 and rapid growth in installed base in tablets will increase energy consumption in the near term.
MEL Update » RMEL Results › Laptops
Photo Source: www.cpsc.gov, http://today.lbl.gov
2011 2015 2020 2030 2040Installed Base (000s) 165,000 240,000 390,000 430,000 470,000
Active 18 13 10 5 2Idle/Ready 0 0 0 0 0Sleep/Standby 1.9 1.5 1.1 0.6 0.4Off 1.0 0.8 0.6 0.4 0.3Active 2,915 2,915 2,915 2,915 2,915Idle/Ready 0 0 0 0 0Sleep/Standby 2,232 2,323 2,441 2,697 2,979Off 3,613 3,522 3,404 3,148 2,866
UEC kWh/yr 60 45 33 17 9AEC TWh/yr 9.8 10.9 12.7 7.2 4.2
Power Draw (W)
Annual Usage (hrs)

86 ©2013 Navigant Consulting, Inc. E N E R G Y
Installed Base: » Although approaching household computer saturation, the installed base continues to
increase as more families get multiple computers, and more people acquire multiple "laptop" devices, e.g., a laptop and a tablet.
» Between 2010 and 2012, 74 million tablets were sold in the United States.*
» Some analysts expect to see Apple ship 100 Million iPads in 2013 (worldwide).*
Power Consumption: » The Active Mode power draw has decreased and will continue to do so because tablets
are an increasing percentage of the installed base and they use less Active Power.
Hourly Usage: » The number of hours spent in Sleep Mode will continue to increase (and off-mode hours
to decrease) because tablets are rarely turned off.
Laptops (cont.)
MEL Update » RMEL Results › Laptops
*Source: http://www.statista.com/statistics/180656/sales-of-tablets-and-ipads-in-the-us-until-2012/, http://bgr.com/2012/12/14/ipad-shipments-2013-100-million/
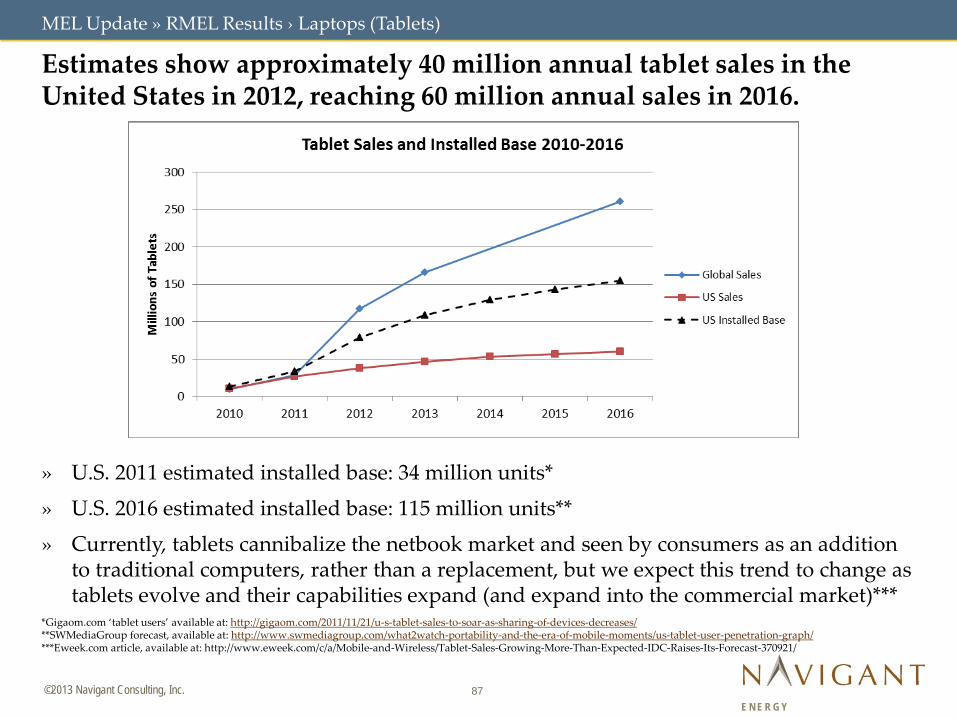
87 ©2013 Navigant Consulting, Inc. E N E R G Y
» U.S. 2011 estimated installed base: 34 million units*
» U.S. 2016 estimated installed base: 115 million units**
» Currently, tablets cannibalize the netbook market and seen by consumers as an addition to traditional computers, rather than a replacement, but we expect this trend to change as tablets evolve and their capabilities expand (and expand into the commercial market)***
Estimates show approximately 40 million annual tablet sales in the United States in 2012, reaching 60 million annual sales in 2016.
MEL Update » RMEL Results › Laptops (Tablets)
*Gigaom.com ‘tablet users’ available at: http://gigaom.com/2011/11/21/u-s-tablet-sales-to-soar-as-sharing-of-devices-decreases/ **SWMediaGroup forecast, available at: http://www.swmediagroup.com/what2watch-portability-and-the-era-of-mobile-moments/us-tablet-user-penetration-graph/ ***Eweek.com article, available at: http://www.eweek.com/c/a/Mobile-and-Wireless/Tablet-Sales-Growing-More-Than-Expected-IDC-Raises-Its-Forecast-370921/

88 ©2013 Navigant Consulting, Inc. E N E R G Y
Unit Energy Consumption » Tested two generations of iPads*:
– Gen 1: 25 Watt-hr capacity battery – Estimated UEC: 7.2 kWh/yr – Gen 2: 42.5 Watt-hr capacity battery – Estimated UEC: 11.9 kWh/yr – larger battery primarily
servers to accommodate higher resolution screen
Usage Patterns » Usage during testing based on assumed every-other-day charging, which we believe to
represent very heavy usage patterns
» Anecodotal evidence suggest that casual users (excluding professionals using tablets in commercial settings), may charge tablets once per week or less in some cases
» Some tablet usage represents new electronic functionality for consumers, e.g., reading a newspaper on a tablet vs. print; however, a most usage replaces laptop/desktop usage
Annual Energy Consumption » Despite rapid growth in installed base, the low UEC does not substantially increase the
AEC of the laptop category; as tablet-use continues to grow and replaces laptop/desktop usage, total AEC will ultimately decrease.
EPRI conducted testing on iPad tablets and estimated the UEC at less than 12 kWh/yr based on heavy usage.
MEL Update » RMEL Results › Laptops (Tablets)
* EPRI Study on Ipad Energy Use, Available at: www.epri.com/Our-Work/Documents/Energy%20Efficiency/iPadEnergyConsumeExecSummary6-2012Final.pdf

89 ©2013 Navigant Consulting, Inc. E N E R G Y
This category includes: » All desktop computers, including those with monitors integrated into the products (e.g.,
iMac).
» Monitors are excluded, except when integrated.
Desktop computers consumed 22.5 TWh in 2011.
MEL Update » RMEL Results › Desktops
2011 2015 2020 2030 2040Installed Base (000s) 102,000 106,000 106,000 105,000 104,000
Active 57 45 34 20 11Sleep/Standby 3.8 3.1 2.4 1.5 0.9Off 1.9 1.6 1.2 0.7 0.5Active 3,420 3,420 3,420 3,420 3,420Sleep/Standby 2,150 2,150 2,150 2,150 2,150Off 3,190 3,190 3,190 3,190 3,190
UEC kWh/yr 220 170 130 70 40AEC TWh/yr 22.5 18.0 13.8 7.4 4.2
Annual Usage (hrs)
Power Draw (W)

90 ©2013 Navigant Consulting, Inc. E N E R G Y
Installed Base: » The installed base will decrease relative to the population as laptops and tablets increase
their market shares.
» Two categories of residential users will continue to use desktops, both of which require greater processing power than is typically available on a laptop. – PC Gamers – driven by the need for high-power graphics processing – Video/photography editing capabilities
» Although desktops will maintain a constant presence, but lower saturation level, the recent rate of evolution in computers may indicate that the desktop market could re-invent itself in yet unknown ways.
Power Consumption: » Power consumption will decrease, but eventually plateau.
Hourly Usage: » Hourly usage will likely not change dramatically between now and 2040.
Desktop computers (cont.)
MEL Update » RMEL Results › Desktops

91 ©2013 Navigant Consulting, Inc. E N E R G Y
» Includes monitors connected to desktop computers or to laptop computers.
» Excludes monitors that are integrated with a desktop computer (e.g., iMac) or to a laptop (all).
» According to Fraunhofer (2011), approximately 73% of residential monitors are used with desktops and 27% are used with laptops.
Computer Monitors consumed 12.8 TWh in 2011.
MEL Update » RMEL Results › Monitors
2011 2015 2020 2030 2040Installed Base (000s) 130,000 125,000 119,000 109,000 99,000
Active 34 28 21 21 21Idle/Ready 0.0 0.0 0.0 0.0 0.0Sleep/Standby 1.1 0.8 0.5 0.5 0.5Off 0.8 0.5 0.3 0.3 0.3Active 2,573 2,573 2,573 2,573 2,573Idle/Ready 0 0 0 0 0Sleep/Standby 3,505 3,505 3,505 3,505 3,505Off 2,682 2,682 2,682 2,682 2,682
UEC kWh/yr 99 75 56 57 57AEC TWh/yr 12.8 9.4 6.7 6.2 5.6
Power Draw (W)
Annual Usage (hrs)

92 ©2013 Navigant Consulting, Inc. E N E R G Y
Installed Base: » We based the installed base of residential monitors on Fraunhofer’s (2011) sales data.
» It should also decrease as the number of residential desktops is also decreasing.
Type of Monitor: » Screen size will continue to increase at a modest rate, similar to the historical rate.
» CRT monitors will reach insignificantly small levels by 2018, which is one lifecycle after 2008, when according to Fraunhofer (2011), “they disappeared from the market” (pg. 66).
Power Consumption: » Although monitor size continues to increase, efficiency measures will too; therefore, the
Active Mode power consumption will remain less than it was in 2011.
Usage Hours: » Hourly usage is based on the Fraunhofer’s (2011) usage hours for monitors associated
with desktops and laptops.
Computer Monitors (cont.)
MEL Update » RMEL Results › Monitors

93 ©2013 Navigant Consulting, Inc. E N E R G Y
This category includes: » Component Audio – systems consisting of separate components, including stereo and
multi-channel receivers, speakers, amplifiers, and other equipment that are typically mixed and matched to meet the user requirements.
» Compact Audio – smaller systems that frequently have an integrated multi-function hub (receiver/amplifier/CD player/iPod dock, etc.) and two or more matched speakers.
» Home Theater in a Box (HTIB) – a packaged set of audio equipment (receivers, speakers, etc.) designed to work with televisions to provide a “theater-like” audio experience.
Home Audio consumed 16 TWh in 2011 and is expected to grow slowly in the coming years.
MEL Update » RMEL Results › Home Audio
Photo Source: http://www.digitallanding.com
2011 2015 2020 2030 2040Installed Base (000s) 193,000 198,000 204,000 219,000 233,000
Active 42.7 42.8 43.0 43.1 42.7Idle 0 0 0 0 0Sleep 2.7 2.2 1.8 1.4 0.9Off 0.5 0.5 0.4 0.3 0.3Active 1,679 1,679 1,679 1,679 1,679Idle 0 0 0 0 0Sleep 6,980 6,980 6,980 6,980 6,980Off 102 102 102 102 102
UEC kWh/yr 83 88 85 82 78AEC TWh/yr 16.0 17.3 17.3 18.0 18.2
Power Draw (W)
Annual Usage (hrs)

94 ©2013 Navigant Consulting, Inc. E N E R G Y
Installed Base: » The installed base was largely based on Fraunhofer (2011) (component audio – 57 million
multi-channel/42 million stereo systems; HTIB – 30 million; compact audio – 66 million)
» The projections assume the number of units per home will stay the same, although the penetration rates will vary by type of system.
» Within the component audio category the share of multi-channel (surround sound) systems is expected to increase at the expense of stereo systems.
» HTIB market shares will continue to decrease, per recent trends (CEA data).
» Compact audio market share is also projected to decline.
Power Consumption » Active mode power consumption may see some modest efficiency gains in the
component audio category, however, the move to multi-channel systems with increased power and reductions in stereo systems’ market share, will result in a fairly small change in unit energy consumption
» Reductions in non-active power modes (e.g., sleep) are expected due to the effects of Energy Star and possible audio equipment standards.
Usage Hours: » Usage hours are assumed to remain the same in future years.
Audio Equipment (cont.) MEL Update » RMEL Results › Home Audio
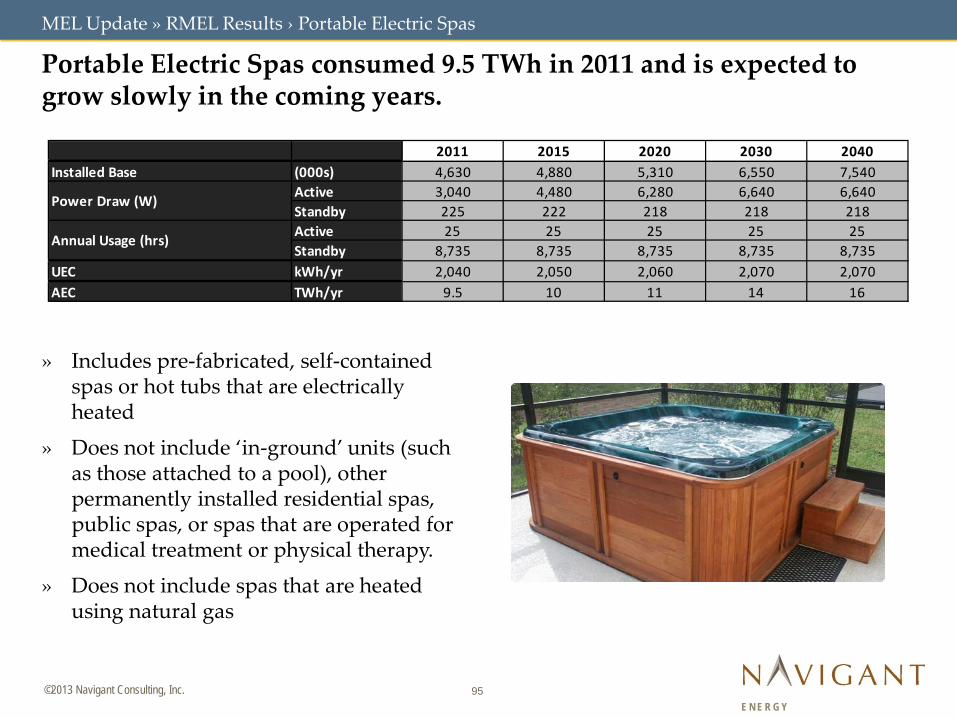
95 ©2013 Navigant Consulting, Inc. E N E R G Y
» Includes pre-fabricated, self-contained spas or hot tubs that are electrically heated
» Does not include ‘in-ground’ units (such as those attached to a pool), other permanently installed residential spas, public spas, or spas that are operated for medical treatment or physical therapy.
» Does not include spas that are heated using natural gas
Portable Electric Spas consumed 9.5 TWh in 2011 and is expected to grow slowly in the coming years.
MEL Update » RMEL Results › Portable Electric Spas
2011 2015 2020 2030 2040Installed Base (000s) 4,630 4,880 5,310 6,550 7,540
Active 3,040 4,480 6,280 6,640 6,640Standby 225 222 218 218 218Active 25 25 25 25 25Standby 8,735 8,735 8,735 8,735 8,735
UEC kWh/yr 2,040 2,050 2,060 2,070 2,070AEC TWh/yr 9.5 10 11 14 16
Power Draw (W)
Annual Usage (hrs)

96 ©2013 Navigant Consulting, Inc. E N E R G Y
Installed Base: » The installed base was determined by performing a trend analysis of household penetration rates from
1993 to 2009 using RECS data. » The penetration rate trajectory was adjusted slightly downward to account for the recent economic
recession as evidenced by a decline in spa sales data of over 50% between 2006 and 2012 (TIAX 2006 and APSP/PK Data 2012).
Power Consumption: » Portable electric spas have two primary operating states: in-use and standby. While in use, the spa
pump provides jet, filtering, and circulation function, while the spa maintains a temperature set point. In standby mode, the spa maintains a temperature set point and periodically runs the pump at low speed for filtering.
» Standby mode accounts for the majority of energy consumption (despite lower power consumption) due to much higher relative usage hours than in-use mode.
» Power consumption may see modest efficiency gains in standby mode largely driven by state-level regulations.
» Power consumption will increase while spas are in-use as a result of larger spas with more jets and larger pumps.
» Overall power consumption is expected to increase very slightly over time. Usage Hours: » Spas are use approximately 6.25 times per month for 20 min per use (TIAX 2007) » Usage hours are assumed to remain the same in future years.
Portable Electric Spas (cont)
MEL Update » RMEL Results › Portable Electric Spas

97 ©2013 Navigant Consulting, Inc. E N E R G Y
» The most energy intensive aspects of residential swimming pools are related to water circulation, filtration, and water heating.
» The primary equipment used to provide these amenities are swimming pool pumps and pool heaters.
» Includes pool pumps and electric heaters
» Does not include natural gas fueled heating equipment
Pool Heaters/Pool Pumps consumed 26 TWh in 2011 and is expected to decrease modestly in the coming years.
MEL Update » RMEL Results › Pool Heaters and Pool Pumps

98 ©2013 Navigant Consulting, Inc. E N E R G Y
Installed Base: » The installed base for 2011 was estimated using data from the Association of Pool and Spa
Professionals (APSP/PK Data 2011). » The growth rate observed between 2001 and 2009 of approximately 175,000 pools per year is expected
to continue, slightly outpacing housing growth (RECS 2001 & 2009) » Only about 5% of pools are heated electrically resulting in a small relative installed base compared to
pool pumps (RECS 2009). Power Consumption: » Power consumption is predominantly from pool pumps and a very small amount of electric heating
(pool heating is predominantly natural gas). » UEC was estimated directly from based on various studies and surveys however typical single-speed
pump power consumption is about 2,000 watts and a new variable speed pump is about 500 – 1,000 watts.
» Power consumption is expected to decrease somewhat dramatically as variable speed pumps phase out single-speed models.
Usage Hours: » Pool pumps typically run at least five to six hours per day, if not around the clock, consuming energy
during the pool season (NREL 2012). » The length of the pool season ranges from about 4 months in cooler climates to year-round in hot
climates.
Pool Heaters/Pool Pumps (cont.)
MEL Update » RMEL Results › Pool Heaters and Pool Pumps

99 ©2013 Navigant Consulting, Inc. E N E R G Y
» Includes primarily a control unit with keypad and a network of sensors that activate audible and visual alarms when an intrusion is detected.
» Does not include external power supplies (captured separately, see External Power Supplies; note that external power supplies were not captured separately in TIAX 2006)
» Does not include video surveillance equipment
Home Security Systems consumed 1.3 TWh in 2011 and is expected to increase dramatically in the coming years.
MEL Update » RMEL Results › Home Security Systems
2011 2015 2020 2030 2040Installed Base (000s) 28,000 35,000 49,000 57,000 64,000
Active Standby 5.1 5.1 5.0 5.0 5.0Passive Standby 5.1 5.1 5.0 5.0 5.0Off 0 0 0 0 0Active Standby 4,990 4,990 4,990 4,990 4,990Passive Standby 3,770 3,770 3,770 3,770 3,770Off 0 0 0 0 0
UEC kWh/yr 45 44 44 44 44AEC TWh/yr 1.3 1.6 2.2 2.5 2.8
Power Draw (W)
Annual Usage (hrs)
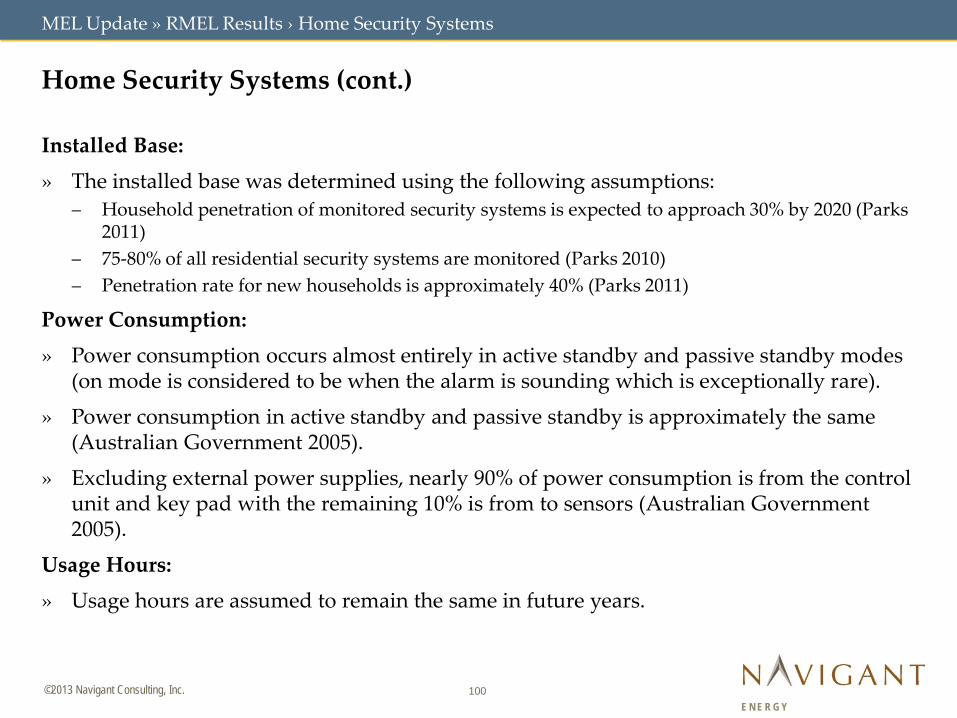
100 ©2013 Navigant Consulting, Inc. E N E R G Y
Installed Base: » The installed base was determined using the following assumptions:
– Household penetration of monitored security systems is expected to approach 30% by 2020 (Parks 2011)
– 75-80% of all residential security systems are monitored (Parks 2010) – Penetration rate for new households is approximately 40% (Parks 2011)
Power Consumption: » Power consumption occurs almost entirely in active standby and passive standby modes
(on mode is considered to be when the alarm is sounding which is exceptionally rare).
» Power consumption in active standby and passive standby is approximately the same (Australian Government 2005).
» Excluding external power supplies, nearly 90% of power consumption is from the control unit and key pad with the remaining 10% is from to sensors (Australian Government 2005).
Usage Hours: » Usage hours are assumed to remain the same in future years.
Home Security Systems (cont.)
MEL Update » RMEL Results › Home Security Systems

101 ©2013 Navigant Consulting, Inc. E N E R G Y
2 Methodology
1 Background
Commercial MELs 3
Residential MELs 4
Table of Contents
References/Appendices 5

102 ©2013 Navigant Consulting, Inc. E N E R G Y
» Dehumidifiers – DOE Home Appliance-1 TSD Nov 2007 – AHAM-1 TP rulemaking
» Set-Top-Boxes – IMS Research report from 2010. ("2010 Set-top Box World Report") – Fraunhofer Center for Sustainable Energy Systems - Energy Consumption of Consumer
Electronics in U.S. Homes in 2010 (December 2011) – appleinsider.com – screendigest.com – businessinsider.com
» DVD – Fraunhofer. "Energy Consumption of Consumer Electronics in U.S. Homes in 2010." December
2011. <http://www.ce.org/CorporateSite/media/Government-Media/Green/Energy-Consumption-of-CE-in-U-S-Homes-in-2010.pdf>
– Nielson (http://blog.nielsen.com/nielsenwire/media_entertainment/more-than-half-the-homes-in-us-have-three-or-more-tvs)
– Appliance Magazine Shipments data – E.I.A Annual Energy Outlook 2012, page 169
References
MEL Update » References

103 ©2013 Navigant Consulting, Inc. E N E R G Y
» TVs – Fraunhofer. "Energy Consumption of Consumer Electronics in U.S. Homes in 2010." December
2011. <http://www.ce.org/CorporateSite/media/Government-Media/Green/Energy-Consumption-of-CE-in-U-S-Homes-in-2010.pdf>
– DisplaySearch, Quarterly Advance Global TV, Shipment and Forecast Report (Frame Rate + LED) – ENERGY STAR specifications – E.I.A Annual Energy Outlook 2012
» Modems and Routers – TIAX LLC. "Residential Miscellaneous Electric Loads: Energy Consumption Characterization and
Savings Potential." July 2007. – TIAX LLC. "U.S. Residential Miscellaneous Electric Loads Electricity Consumption." 2008. – Fraunhofer. "Energy Consumption of Consumer Electronics in U.S. Homes in 2010." December
2011. <http://www.ce.org/CorporateSite/media/Government-Media/Green/Energy-Consumption-of-CE-in-U-S-Homes-in-2010.pdf>
» Residential Desktop Computers – Fraunhofer. "Energy Consumption of Consumer Electronics in U.S. Homes in 2010." December
2011. <http://www.ce.org/CorporateSite/media/Government-Media/Green/Energy-Consumption-of-CE-in-U-S-Homes-in-2010.pdf>
– TIAX LLC. "Residential Miscellaneous Electric Loads: Energy Consumption Characterization and Savings Potential." Final Report. July 2007.
– TIAX LLC. "U.S. Residential Miscellaneous Electric Loads Electricity Consumption." 2008. – 2009 RECS Survey data
References cont.
MEL Update » References

104 ©2013 Navigant Consulting, Inc. E N E R G Y
» Computer Monitors – Fraunhofer. "Energy Consumption of Consumer Electronics in U.S. Homes in 2010." December
2011. <http://www.ce.org/CorporateSite/media/Government-Media/Green/Energy-Consumption-of-CE-in-U-S-Homes-in-2010.pdf>
– ENERGY STAR specifications: 'http://www.energystar.gov/index.cfm?fuseaction=find_a_product.showProductGroup&pgw_code=MO
» Residential Laptop Computers – Fraunhofer. "Energy Consumption of Consumer Electronics in U.S. Homes in 2010." December
2011. <http://www.ce.org/CorporateSite/media/Government-Media/Green/Energy-Consumption-of-CE-in-U-S-Homes-in-2010.pdf>
– DisplaySearch Quarterly Mobile PC Shipment and Forecast Report http://www.displaysearch.com/cps/rde/xchg/displaysearch/hs.xsl/130107_tablet_pc_market_forecast_to_surpass_notebooks_in_2013.asp
» Non-Computer Rechargeable Electronics – DOE Rulemaking Reference for External Power Supplies
» External Power Supplies – DOE Rulemaking Reference for External Power Supplies
References cont.
MEL Update » References

105 ©2013 Navigant Consulting, Inc. E N E R G Y
» Ceiling Fans – TIAX LLC. "Commercial and Residential Sector Miscellaneous Electricity Consumption: Y2005
and Projections for 2030." 22 September 2006. – Florida Solar Energy Center. "Updated Miscellaneous Electricity Loads and Appliance Energy
Usage Profiles for Use in Home Energy Ratings, the Building America Benchmark Procedures and Related Calculations."Revised 10 June 2011.
– U.S. 2010 Census – U.S. 2010 Census Housing Data: http://www.census.gov/prod/cen2010/briefs/c2010br-14.pdf – CA Energy Commission Case Study:
http://www.energy.ca.gov/appliances/2003rulemaking/documents/case_studies/CASE_Ceiling_Fan.pdf
– RECS data: http://www.eia.gov/emeu/recs/ceilingfans/ceiling_fan.html – TIAX LLC, “Residential Miscellaneous Electric Loads: Energy Consumption Characterization and
Savings Potential in 2006 and Scenario-based Projections for 2020” April 2008.
» Distribution Transformers – CBECS 2003 survey data – U.S. Department of Energy, Distribution Transformers Preliminary Technical Support Document
http://www1.eere.energy.gov/buildings/appliance_standards/commercial/distribution_transformers_prelim_tsd.html
– NEMA TP-1 specifications: http://www.nema.org/Standards/Pages/Guide-for-Determining-Energy-Efficiency-for-Distribution-Transformers.aspx
– Cadmus Group “Metered Load Factors for Low-Voltage, Dry-Type Transformers in Commercial, Industrial, and Public Buildings”
References cont.
MEL Update » References

106 ©2013 Navigant Consulting, Inc. E N E R G Y
» Water Distribution – EPRI 2002, " Water & Sustainability (Volume 4): U.S. Electricity Consumption for Water Supply &
Treatment - The Next Half Century." Same data used in TIAX CMELS study – EPA WaterSense Whitepaper. http://www.epa.gov/WaterSense/docs/ci_whitepaper.pdf – USGS, 2005, Estimated use of water in the United States in 2005: http://pubs.usgs.gov/circ/1344/
» Data Center Servers – Koomey, Johnathan. 2011. Growth in data center electricity use 2005 to 2010. Oakland, CA:
Analytics Press. July. – Koomey, Jonathan. 2007b. Estimating total power consumption by servers in the U.S. and the
world. Oakland, CA: Analytics Press. February 15.
» IT Equipment – Lanzisera, S., B. Nordman, and R. E. Brown, 2011. ``Data Network Equipment Energy Use and
Savings Potential in Buildings.'' – Request for Information (RFI) Regarding Miscellaneous Residential and Commercial Electrical
Equipment, 77 Fed. Reg. 3461-3468 (Tuesday, January 24, 2012) – CBECS 2003 Survey data on computer end-use energy consumption
» Monitors – Navigant Consulting, Inc. "Energy Savings Potential and RD&D Opportunities for Commercial
Building Appliances." Final Report. 21 December, 2009. – TIAX LLC. "Commercial Miscellaneous Electric Loads: Energy Consumption Characterization and
Savings Potential in 2008 by Building Type." Final Report. May 2010.
References cont.
MEL Update » References

107 ©2013 Navigant Consulting, Inc. E N E R G Y
» Laboratory Refrigerators/Freezers – US Census: http://www2.census.gov/econ/susb/data/2010/us_6digitnaics_2010.xls – International Institute of Sustainable Labs 2012 Annual Conference Presentations – Doyle, Allen. University of California at Davis. Presentation: “Laboratory Cold Storage: Are You
Cool Enough?” November 2011 – ENERGY STAR Lab-Grade Refrigerators and Freezers Test Method Development - Manufacturer-
submitted data: http://www.energystar.gov/products/specs/system/files/ManufacturerDataSubmitted.xls
– Manufacturer Spec sheets: o http://www.eppendorf.com/int/index.php?sitemap=2.1&pb=27e502ec597ffa52&action=products&contentid=1&c
atalognode=76013&page=15 o http://us.sanyo.com/Biomedical-Preservation o http://www.thermoscientific.com/ecomm/servlet/productscatalog_11152_L11188_80523_-1_4 o http://stirlingultracold.com/ultralow_freezers o http://bakerco.com/freezers-UF.pdf
– Groover, K; Drew, K; and Franke, J. “The Use of Compressor Cycle Patterns: The Ability to Predict Freezer Failure.” Cell Preservation Technology, Volume 5, Number 4, 2007.
References cont.
MEL Update » References

108 ©2013 Navigant Consulting, Inc. E N E R G Y
» Kitchen Ventilation – Case Studies:
o Southern California Edison, (2009) “Demand Control Ventilation for Commercial Kitchen Hoods” http://www.etcc-ca.com/images/stories/et_07_10_dcv_com_kitch_hoods_final_report.pdf
o CA PIER Research Project, (2006) “ Demand Ventilation Control in Commercial Buildings” http://partnershipdemonstrations.org/file_browser/db/Kitchen_DVC_Case_Study_CCCs_draft_D.pdf
o Fisher-Nickel, Food Services Technology Center at PG&E, (2004) “Demand Ventilation in Commercial Kitchens: An Emerging Technology Case Study” http://www.fishnick.com/publications/appliancereports/hoods/mark_hopkins_melink_report.pdf
o Fisher-Nickel, Food Services Technology Center at PG&E, (2006) “Demand Ventilation in Commercial Kitchens: An Emerging Technology Case Study” http://www.fishnick.com/publications/appliancereports/hoods/Supermarket_Melink_Report.pdf
» Medical Imaging Equipment – Magnetica, “Today’s MRI Market” http://www.magnetica.com/page/innovation/todays-mri-
market/ – Neiman Report, “Medical Imaging: is the Growth Boom Over?”
http://www.acr.org/~/media/ACR/Documents/PDF/Research/Briefs/PolicyBriefHPI092012.pdf – CDC Statistics data on MRI: http://www.cdc.gov/nchs/hus/contents2011.htm – http://www.ewh.ieee.org/tc/csc/europe/newsforum/pdf/2010-ASC/ST196.pdf – Cosmus et. al. “Advances in Whole Body Magnets”
http://www.ewh.ieee.org/tc/csc/europe/newsforum/pdf/2010-ASC/ST196.pdf – NCDHHS (2012) “Review Criteria for Medical Health Services”
http://www.ncdhhs.gov/dhsr/coneed/decisions/2012/apr/0510_cmcmercy_find.pdf
References cont.
MEL Update » References

109 ©2013 Navigant Consulting, Inc. E N E R G Y
» Medical Imaging cont. – IMV Press release:
http://www.imvinfo.com/user/documents/content_documents/nws_rad/MS_UltSnd_Press_Release.pdf
– Diagnostic Imaging “Battle of the detectors defines future of DR market” http://www.diagnosticimaging.com/dimag/legacy/DR/battle.html
– IMV Press Release: http://www.prweb.com/releases/2011/2/prweb8127064.htm – “Hospitals strongly prefer DR over CR for new x-ray purchases”
http://www.auntminnie.com/index.aspx?sec=sup_n&sub=imc&pag=dis&ItemID=94166 – Active Xray Machine Registrations (PA)
http://www.dep.state.pa.us/brp/Radiation_Control_Division/X-Ray/ActiveX-RayFacilities.htm – US CDC “Sources of population exposure to xray” http://www.atsdr.cdc.gov/ToxProfiles/tp149-
c6.pdf – Northwestern University Effective Useful Life Inventory:
http://www.northwestern.edu/equipment-inventory/propertycodes.html) – “Ecodesign Target for Magnetic Resonance Equipment” (2012)
http://www.eceee.org/Eco_design/products/medical_imaging_equipment/Ecodesign%20Target%20for%20Magnetic%20Resonance%20Equipment%20-%20draft%20for%20discussion%20-%202012_03_009.pdf
– GE Spec Sheets: o http://www.gehealthcare.com/euen/radiography/products/brivo_drf/brivo_dr_index.html o http://www.gereports.com/picturing-the-benefits-of-digital-x-rays/
References cont.
MEL Update » References

110 ©2013 Navigant Consulting, Inc. E N E R G Y
» Medical Imaging cont. – Esmaeilli et al. “Environment Impacts of Healthcare Services”, Wichita State University – Twomey, Witchita State University Presentation Poster:
http://wiea2012.auburn.edu/docs/Posters/71.pdf – Twomey, “Lifecycle for Engineering the Healthcare Service Delivery of Imaging” From
http://emse.mst.edu/media/academic/emse/documents/EMSEGraduateSeminar-DrJanetTwomey.pdf
– “Self-Regulatory Initiative: Ecodesign of Energy Using products for Medical Imaging Equipment” (2009) http://www.eup-network.de/fileadmin/user_upload/Produktgruppen/Lots/Working_Documents/Lot_ENTRxx_medical_imaging_equipment/draft_self_regulation_medical_imaging_equipment_2009-10.pdf
» Commercial Laptop Computers – Navigant Consulting, Inc. "Energy Savings Potential and RD&D Opportunities for Commercial
Building Appliances." Final Report. 21 December, 2009. – TIAX LLC. "Commercial Miscellaneous Electric Loads: Energy Consumption Characterization and
Savings Potential in 2008 by Building Type." Final Report. May 2010. – Census Data: http://www.census.gov/popest/data/historical/2000s/vintage_2008/index.html – TIAX LLC. "Commercial Miscellaneous Electric Loads: Energy Consumption Characterization and
Savings Potential in 2008 by Building Type." Final Report. May 2010. – Bureau of Labor Statistics Database: http://www.bls.gov/data/
References cont.
MEL Update » References

111 ©2013 Navigant Consulting, Inc. E N E R G Y
» Commercial Desktop Computers – Navigant Consulting, Inc. "Energy Savings Potential and RD&D Opportunities for Commercial
Building Appliances." Final Report. 21 December, 2009. – TIAX LLC. "Commercial Miscellaneous Electric Loads: Energy Consumption Characterization and
Savings Potential in 2008 by Building Type." Final Report. May 2010. – Census Data: http://www.census.gov/popest/data/historical/2000s/vintage_2008/index.html – TIAX LLC. "Commercial Miscellaneous Electric Loads: Energy Consumption Characterization and
Savings Potential in 2008 by Building Type." Final Report. May 2010. – Bureau of Labor Statistics Database: http://www.bls.gov/data/ – ENERGY STAR specifications:
http://www.energystar.gov/ia/partners/downloads/unit_shipment_data/2011_USD_Summary_Report.pdf?5115-b0d9
– Bureau of Labor Statistics Press Release: http://bls.gov/news.release/ecopro.nr0.htm
References cont.
MEL Update » References

112 ©2013 Navigant Consulting, Inc. E N E R G Y
» Commercial Video Displays – http://www.dailydooh.com/archives/16881 – Bunn, Lyle. "The Content of Dynamic Place-based Media: The rise of the ‘Content is King’ Monarchy Whitepaper."
February 2011. pg 2. – Bunn, Lyle. "Digital Place-based Media ROI Analysis - Defining Value, ROI or Die: Analytics Whitepaper." February
2012. pg 1. – http://www.digitalscreenmedia.org/lyle-bunn/view/26906/dynamic-signage---2012-year-in-review – http://www.displaysearch.com/cps/rde/xchg/displaysearch/hs.xsl/121016_flat_panel_display_industry_poised_for_re
covery_and_long_term_growth.asp – http://energystar.gov/products/specs/sites/products/files/Final_Version_6%200_Displays_Program_Requirements.pd
f?d52f-116f – http://www.imagesurge.com/wp-
content/uploads/2012/11/lib19.swf?lightbox%5Bwidth%5D=612&lightbox%5Bheight%5D=792, pg 10, accessed 2/8/2013
– Arbitron Inc., "Arbiton Out-of-Home Digital Video Display Study 2009." 2009. pg 3. – Arbitron Inc., "Arbiton Digital Place-Based Video Study 2010." 2010. pg 11-47. – iSuppli Corp., "Abstract: Worldwide Signage and Professional Display Market Tracker." 2012. pg 1.
» Large Format Video Boards – Young, Gregory. "Illuminating the Issues: Digital Signage and Philadelphia’s Green Future." 2010. – http://www.usatoday.com/story/news/nation/2013/01/31/fights-digital-signs-billboards/1880121/ – http://www.daktronics.com/ProductsServices/Products/Digital-Billboards/Sizes-Specifications/Pages/default.aspx – Muret, Don. "Big is in: Video boards keep growing at stadiums and arenas, delivering the wow factor to fans, but is
this super-sized technology a good investment?" Sports Business Journal. 2013 – http://www.diamond-vision.com/images/uploads/documents/Arena_Stadium_Specifications.pdf
References cont.
MEL Update » References

113 ©2013 Navigant Consulting, Inc. E N E R G Y
» Commercial Security Systems – CBECS 2003 – 2013 Annual Energy Outlook (Early Release) – Security Industry Association. "United States Security Market Report." July 2008. – Security Sales & Integration. "The Gold Book 2013." December 2012. – Axis Communications. "Total cost comparison study of analog and IP-based video surveillance
whitepaper." 2010. – Moog Videolarm. "PoE Power: The Secrets You Really Need to Know." 2011. – Ecos/EPRI. "High Performance Buildings: Data Centers: Uninterruptible Power Supplies (UPS)."
December 2005. – Sample Manufacturer Specification Sheet:
o http://www.utcfssecurityproducts.com/ProductsAndServices/Site%20Assets/60390_dvr30_ds_fin.pdf accessed 2/11/13
o http://www.sdcsecurity.com/products.htm o http://www.alibaba.com/product-gs/228085719/EAS_Label_Deactivator_with_2_pad.html o http://www.alibaba.com/product-gs/435116964/checkpoint_systems_FF7000.html?s=p
– http://www.videosurveillance.com/blog/products/axis/axis_network_camera_global_market_share_at_335_percent_accor.asp accessed 2/13/13
– Elliot, David. "Analog vs. IP: The True TCO." Security Magazine. February 2011. – TIAX LLC. "Residential Miscellaneous Electric Loads: Energy Consumption Characterization and
Savings Potential." July 2007
References cont.
MEL Update » References

114 ©2013 Navigant Consulting, Inc. E N E R G Y
» Home Audio Equipment – Fraunhofer. "Energy Consumption of Consumer Electronics in U.S. Homes in 2010." December
2011. <http://www.ce.org/CorporateSite/media/Government-Media/Green/Energy-Consumption-of-CE-in-U-S-Homes-in-2010.pdf
– Palenchar, Joseph, CEA:Component Audio Leads Turnaround, February 7, 2011. http://www.twice.com/retailing/retailing/cea-component-audio-leads-home-audio-turnaround/23342 2015 - CEA Sales and Forecasts, July 2012. http://content.ce.org/PDF/2K13_5tech_proof.pdf
– TIAX LLC. "Residential Miscellaneous Electric Loads: Energy Consumption Characterization and Savings Potential." July 2007.
– TIAX LLC. "U.S. Residential Miscellaneous Electric Loads Electricity Consumption." 2008. – TIAX LLC. "Commercial and Residential Sector Miscellaneous Electricity Consumption: Y2005
and Projections for 2030." 22 September 2006.
References cont.
MEL Update » References

115 ©2013 Navigant Consulting, Inc. E N E R G Y
» Portable Electric Spas – RECS 1993, 1997, 2001, 2005, and 2009 – 2013 Annual Energy Outlook (Early Release) – Sample Manufacturer Spec Sheets:
o http://www.spadepot.com/shop/4-HP-Spa-Pump-2-inout-Side-Discharge-56-Frame-240V-P706C690.aspx o http://www.spadepot.com/shop/Belize-e480L-Lounger-Spa-P9755C849.aspx
– TIAX LLC. "Residential Miscellaneous Electric Loads: Energy Consumption Characterization and Savings Potential." July 2007.
References cont.
MEL Update » References

116 ©2013 Navigant Consulting, Inc. E N E R G Y
» Pool Heaters/Pool Pumps – RECS 1993, 1997, 2001, 2005, 2009 – 2013 Annual Energy Outlook (Early Release) – Opinion Dynamics Corp. "Massachusetts Residential Appliance Saturation Survey (Rass) Volume
1: Summary Results And Analysis." April 2009. – Vermont Energy Investment Corporation. "Mid-Atlantic Technical Reference Manual Version 2.0."
July 2011. – Association of Pool and Spa Professionals and PK Data. "US Swimming Pool and Hot Tub Market
2011." 2011. – California Energy Commission. "2009 Residential Appliance Saturation Study: Volume 2 Study
Results. 2009. – Davis Energy Group. "Proposal Information Template for: Residential Pool Pump Measure
Revisions." 2008. – Davis Energy Group. "Proposal Information Template for: Residential Swimming Pool & Portable
Spa Equipment Update." 2011. – Consortium for Energy Efficiency. "CEE Efficient Residential Swimming Pool Initiative." June
2012. – National Renewable Energy Lab. "Measure Guideline: Replacing Single-Speed Pool Pumps with
Variable Speed Pumps for Energy Savings." 2012. – http://energy.gov/energysaver/articles/swimming-pool-covers
References cont.
MEL Update » References
117 ©2013 Navigant Consulting, Inc. E N E R G Y
» Home Security Systems – Parks, Tricia. Residential Ready to Rally Around New Services." Security Sales & Integration
Magazine. November 2011. pg 42-47. – Parks, Tricia. "Why Residential Is Ready to Rebound." November 2010. <http://www.securitysales.com/channel/vertical-markets/articles/2010/11/why-residential-is-ready-
to-rebound/page/2.aspx> – 2013 Annual Energy Outlook (Early Release) – Austalian Government. "Burglar Alarms: Australia's Standby Power Strategy 2002-2012." Updated
2005. – McAllister and Farrell. "Power in a Portable World: Usage patterns and Efficiency Opportunities
for Consumer Battery Chargers." ACEEE Summer Study on Energy Efficiency in Buildings. 2004. pg 113.
– TIAX LLC. "Residential Miscellaneous Electric Loads: Energy Consumption Characterization and Savings Potential." July 2007.
– Energy Efficient Strategies. "2005 Intrusive Residential Standby Survey Report." March 2006. pg 23.
References cont.
MEL Update » References

118 ©2013 Navigant Consulting, Inc. E N E R G Y
» As of 2008, the U.S. had more than 21,500 publically owned wastewater treatment plants (WWTPs); privately (investor) owned WWTPs exist but account for a minority of the total population.1
» Public supply water consumption data available from the USGS indicate growth in potable water use is slower than growth in population (from 2000 to 2005)
» We expect that the amount of wastewater produced and treated in the US grows 2% every 5 years (for an average annual growth of 0.4%), based on the assumption that: – The trend in potable water consumption continues – The ratio of potable water consumption to wastewater production remains unchanged
Appendix A: The amount of wastewater produced in the United States has been growing slower than the population in recent years.
MEL Update » Appendix A › Wastewater Treatment
Nationwide Estimates Public Supply Water US Population
Year (Billion gallons /Day)
Average Annual Growth rate (Millions) Average Annual
Growth rate 1995 40.2 N/A 266.3 N/A 2000 43.3 1.5% 282.2 1.2% 2005 44.2 0.4% 295.5 0.9% 2013 45.6 0.4% 315.6 0.8%
Source: Public Supply Water for 1995-2005 obtained from USGS (http://water.usgs.gov/watuse/), 2013 value is a Navigant Projection. Population data obtained from US Census
1: Source: http://css.snre.umich.edu/css_doc/CSS04-14.pdf

119 ©2013 Navigant Consulting, Inc. E N E R G Y
» Treatment processes are consecutive; therefore a WWTP that uses advanced treatment necessarily includes both primary and secondary treatment.
» Based on EPA data, approximately 98% (by capacity) of surveyed WWTPs contain secondary treatment and 57% of surveyed WWTPs also use greater than secondary treatment (advanced treatment); EPA is expected to update these data in early 2014.
Almost all WWTP capacity treats to secondary treatment levels or greater; more than half exceed secondary standards.
MEL Update » Appendix A › Wastewater Treatment
Primary Treatment
Secondary Treatment
Advanced Treatment Raw Sewage
Surveyed Treatment Facilities in Operation in 2008
Maximum Treatment Level
Number of WWTPs*
Average Existing Flow
(MGD)*
Rated Capacity Flow (MGD)*
Percent of U.S. Population Served*
Total Rated Capacity (MGD)**
Percent of Total Rated
Capacity Partial Treatment 115 190 287 0% 44,865 100% Less than Secondary 30 422 546 1.2% 44,578 99% Secondary 7,302 13,142 17,765 30.2% 44,032 98% Greater than Secondary 5,071 16,776 23,710 36.8% 26,267 57% No Discharge 2,251 1,815 2,557 5.5% 2,557 6% N/A 11 0 0 0% 0 0% Total 14,780 32,345 44,865 74% - -
Source: Navigant analysis based on: U.S. EPA. Clean Watersheds Needs Survey 2008 - Report to Congress. 2008. Table I-3. * Based on the distinction of a WWTP’s maximum treatment level ** Navigant calculation assuming all capacity listed as a higher level of treatment necessarily has the lower level of treatment. Calculated by summing Rated Capacity Flow (MGD) rows below and including the current row
Incr
easi
ng
Trea
tmen
t Le
vels
New Slide Sept 2013

120 ©2013 Navigant Consulting, Inc. E N E R G Y
» Higher levels of treatment (better effluent quality) requires more energy
» Economies of scale allow larger wastewater treatment plants to have lower energy intensities (kWh/million gallons treated) than smaller plants
» Majority of energy use in plants is for secondary treatment systems (e.g., aeration systems), pumping, and anaerobic digestion (if applicable)
Energy use in Wastewater Treatment Plants (WWTPs) depends on plant size and treatment requirements.
MEL Update » Appendix A › Wastewater Treatment
Source: (SAIC). Water and Wastewater Energy Best Practice Guidebook. Focus on Energy. 2006.
Aeration, 54%
Pumping, 14%
Building Energy Use,
8%
Belt press, 4%
Clarifiers, 3%
Grit removal, 1%
Other, 2% Anaerobic digestion,
14%
Illustrative Energy Use For an Activated Sludge WWTP
Energy Intensity (kWh/Million Gallons Treated)
Secondary Treatment Greater than Secondary Treatment
WWTP Size
(Million Gal/Day)
Trickling Filter
Activated Sludge
Advanced Treatment
Advanced Treatment
Nitrification
1 1,811 2,236 2,596 2,951
5 979 1,369 1,573 1,926
10 852 1,203 1,408 1,791
20 750 1,114 1,303 1,676
50 687 1,051 1,216 1,588
100 673 1,028 1,188 1,558 Source: EPRI. Water and Wastewater Industries: Characteristics and Energy Management Opportunities: A Report That Describes How Electricity is Used and Can Be Managed Efficiently in Water. 1996.
Increasing Treatment Levels

121 ©2013 Navigant Consulting, Inc. E N E R G Y
» A study commissioned by the California Public Utilities Commission (CPUC) collected 2008 vintage data from 14 wastewater utilities across California*
– Goal: Calculate range of average energy intensity – Results were not disaggregated by treatment plant size
Key Findings: » WWTPs with both primary and secondary treatment consumed 488-1,622 kWh/Mgal
» WWTPs with primary, secondary, and tertiary treatment consumed 1,086-4,531 kWh/Mgal
» Although the relation of energy intensity and plant size are not explicitly plotted in the study, reviewing some of the detailed data indicates the upper bounds of energy intensity are represented by smaller plants (less than 10 Mgal/day)
» Data on the Orange County Ground water replenishment system (an advanced 70 Mgal/Day plant using microfiltration, reverse osmosis and UV light) was found to use 3,161 - 3,771 kWh/Mgal, this is incremental to secondary treatment energy use.
More recent energy intensity data for some California WWTPs are available, though large ranges exist in the data.
MEL Update » Appendix A › Wastewater Treatment
1: GEI Consultants and Navigant Consulting. Embedded Energy in Water Studies Study 2: Water Agency and Function Component Study and Embedded Energy-Water Load Profiles. 2010

122 ©2013 Navigant Consulting, Inc. E N E R G Y
» Almost all WWTPs use secondary treatment, which uses aeration systems to provide dissolved oxygen to wastewater. Air compressors (aeration blowers) typically supply air through bubble aerators and account for 40-60% of WWTP energy use. Aeration energy reductions of up to 40% are possible with the following technologies:1 – Fine bubble aerators – High efficiency blowers with variable speed drives – Automatic dissolved oxygen controls
» Pumping energy can be reduced through use of high efficiency pumps and motors and variable speed drives.
» Refurbishment and repair of existing pumps can offer a lower cost alternative that can reduce pumping energy use by 5-30% depending on the current condition of pumps.2
» Medium and large sized WWTPs have an opportunity to make beneficial use of biogas to self-generate electricity or for combined heat and power (CHP); heat is used to maintain optimal digester temperature.
Targeting aeration systems and pumps offers the most opportunity for energy efficiency in WWTPs.
MEL Update » Appendix A › Wastewater Treatment
1: Additional details and case studies are available at: http://sustainca.org/programs/water_energy/measures/aeration_system_improvement 2: Additional details and case studies are available at: http://sustainca.org/programs/water_energy/measures/select_best_practices_pumps
Wastewater Aeration in Secondary Treatment
Pumps pre- (left) and post- (right) refurbishment
Amended Sept 2013

123 ©2013 Navigant Consulting, Inc. E N E R G Y
» The National Pollutant Discharge Elimination System (NPDES) permit system regulates point sources that discharge pollutants into waters of the United States. Permits are generally issued by each state; requirements can vary by state and region.
» The EPA requires a minimum of secondary treatment by Publicly Owned Treatment Works and sets minimum treatment guidelines regarding effluent concentrations. Approximately 2% of WWTP capacity does not meet secondary levels and must ultimately comply with this requirement, doing so would increase energy use. These plants are concentrated in CA, HI, MA, and Puerto Rico.1
» Emerging contaminants (such as pharmaceuticals and personal care products) are showing up in higher concentrations in wastewater systems and treated wastewater effluent. WWTPs may be required to add treatment equipment or processes in the future to meet NPDES requirements and ensure that emerging contaminants are removed.
» There are multiple examples of WWTPs installing more advanced treatment technologies in response to local water quality concerns – Sacramento Regional County Sanitation District adds tertiary treatment
(http://www.sustainabledelta.com/SacRegionalFeature.html) – Orange County Sanitation District expands secondary treatment capacity to match primary
treatment capacity (http://www.ocsd.com/modules/showdocument.aspx?documentid=14200)
Future, more aggressive treatment requirements may increase WWTP energy consumption.
MEL Update » Appendix A › Wastewater Treatment
1: U.S. EPA. Clean Watersheds Needs Survey 2008 - Report to Congress. 2008. Appendix I
Amended Sept 2013

124 ©2013 Navigant Consulting, Inc. E N E R G Y
» Water planners in certain regions of the U.S. (e.g., CA and TX) are encouraging increased development and use of recycled water as a method to mitigate drought impacts. – California has a goal to produce and use 1 Million Acre-feet of recycled water by 2020; 2 Million by
2030.1 Anecdotal information shows a strong interest in developing recycled water in Texas in response to extreme drought conditions.2
– Recycled water requires advanced treatment (usually tertiary treatment) and disinfection. This could increase energy consumption in WWTPs as additional treatment processes are installed; however. overall national energy use could remain the same or decrease as other energy intensive supplies such as groundwater and imported water are used less.
– Example: Orange County’s Ground Water Replenishment system recycles wastewater to beyond drinking water standards, though at a relatively high energy use compared to typical WWTPs
» Wastewater utilities face challenges in securing approval and funding capital projects. – Spending is prioritized on critical projects such as expanding capacity, maintaining
infrastructure), and compliance with new water quality standards and projects with short payback periods. Some energy efficiency and self generation investments take too long to payback, decreasing the likelihood of their adoption.
– Approval from board of directors’ may be required for projects above a certain dollar threshold. (e.g., $100,000). Boards comprised of elected officials may have to answer to the demands of customers to keep rates low (thus minimizing capital costs passed on to customers)3
Increased use of recycled water may increase energy use; difficulty in funding non-essential projects may delay investment in efficiency.
MEL Update » Appendix A › Wastewater Treatment
1: http://www.waterboards.ca.gov/water_issues/programs/water_recycling_policy/docs/recycledwaterpolicy_approved.pdf 2: http://www.cnn.com/2011/US/08/10/texas.desperate.to.drink/index.html 3: KEMA. Industrial Sectors Market Characterization: Water and Wastewater Industry. 2012

125 ©2013 Navigant Consulting, Inc. E N E R G Y
MEL Update » Appendix B › CMEL 2011 Summary
Appendix B: Commercial MELs 2011 Base Year summary – Installed Base by building type.
Installed Base (000s) Assembly Education Food Sales Food Service
Healthcare Lodging Large Office
Small Office
Mercantile & Service
WareHouse
Other Total
Water Distribution* 256,000 512,000 213,000 639,000 597,000 639,000 384,000 384,000 213,000 1,023,000 256,000 5,115,000
IT Equipment 12,200 101,000 5,800 5,400 21,400 19,000 148,000 94,000 45,300 14,100 21,400 487,000
MonitorsPC 2,300 19,000 1,100 1,000 4,100 3,600 28,000 18,000 8,700 2,700 4,100 93,000
DesktopPC 1,900 15,000 890 820 3,300 2,900 22,000 14,000 6,900 2,200 3,300 74,000
LaptopPC 1,600 13,000 750 690 2,800 2,500 19,000 12,000 5,800 1,800 2,800 63,000
Data Center Servers 0 0 0 0 0 0 0 0 0 0 12,200 12,200
Security Systems 1,000 970 540 500 20 330 110 2,600 2,400 1,100 1,000 11,000
Distribution Transformers 380 390 440 460 210 400 450 600 1,500 360 280 5,470
Video Displays 32 160 240 160 32 32 112 112 640 0 80 1,600
Lab R-Fs 0 215 0 0 340 0 0 0 0 0 445 1,000
Kitchen Ventilation 30 302 104 322 9 21 0 0 4 0 0 790
Medical Imaging Equipment 0 0 0 0 59 0 0 120 0 0 0 178
Large Format Video Boards 1 0 0 0 0 0 0 0 0 0 0 1
Note: Rows do not sum due to rounding
*Water Distribution is in Millions of Gallons per year (Mgal/yr)

126 ©2013 Navigant Consulting, Inc. E N E R G Y
MEL Update » Appendix B › CMEL 2011 Summary
Appendix B: Commercial MELs 2011 Base Year summary – Unit Energy Consumption by building type.
UEC (kWh/yr) Assembly Education Food Sales Food Service
Healthcare Lodging Large Office
Small Office
Mercantile & Service
WareHouse
Other Wtd Avg
Large Format Video Boards 152,000 152,000 152,000 152,000 152,000 152,000 152,000 152,000 152,000 152,000 152,000 152,000
Kitchen Ventilation 109,000 51,500 111,000 22,900 105,000 112,000 0 0 119,000 0 0 52,000
Medical Imaging Equipment 0 0 0 0 32,500 0 0 6,500 0 0 0 15,000
Distribution Transformers 7,400 8,500 6,400 6,100 10,800 8,500 10,900 6,000 7,900 8,800 8,900 7,900
Lab R-Fs 0 4,700 0 0 3,600 0 0 0 0 0 5,100 4,500
Security Systems 742 1,121 307 329 10,440 1,672 7,495 311 498 945 626 2,500
Data Center Servers 0 0 0 0 0 0 0 0 0 0 2,400 2,400
Water Distribution* 1,284 1,284 1,284 1,284 1,284 1,284 1,284 1,284 1,284 1,284 1,284 1,284
Video Displays 1,084 1,084 1,084 1,084 1,084 1,084 1,084 1,084 1,084 1,084 1,084 1,084
DesktopPC 402 402 402 402 402 402 402 402 402 402 402 400
MonitorsPC 198 198 198 198 198 198 198 198 198 198 198 198
LaptopPC 34 34 34 34 34 34 34 34 34 34 34 34
IT Equipment 25 25 25 25 25 25 25 25 25 25 25 25
Note: Rows do not sum due to rounding
*Water Distribution is in kWh/Mgal/yr or kWh per million gallons per year

127 ©2013 Navigant Consulting, Inc. E N E R G Y
MEL Update » Appendix B › CMEL 2011 Summary
Appendix B: Commercial MELs 2011 Base Year summary – Annual Energy Consumption by building type
AEC (TWh/yr) Assembly Education Food Sales Food Service
Healthcare Lodging Large Office
Small Office
Mercantile & Service
WareHouse
Other Total
Distribution Transformers 2.8 3.3 2.8 2.8 2.3 3.4 4.9 3.6 12 3.2 2.5 43
Kitchen Ventilation 3.3 15.6 11.5 7.4 0.9 2.4 0.0 0.0 0.5 0.0 0.0 41
DesktopPC 0.8 6.0 0.4 0.3 1.3 1.2 8.8 5.6 2.8 0.9 1.3 30
Data Center Servers 0 0 0 0 0 0 0 0 0 0 29 29
MonitorsPC 0.5 3.8 0.2 0.2 0.8 0.7 5.5 3.6 1.7 0.5 0.8 18
IT Equipment 0.3 2.5 0.1 0.1 0.5 0.5 3.7 2.4 1.1 0.4 0.5 12
Security Systems 0.8 1.1 0.2 0.2 0.2 0.5 0.9 0.8 1.2 1.0 0.6 7.4
Water Distribution 0.3 0.7 0.3 0.8 0.8 0.8 0.5 0.5 0.3 1.3 0.3 6.6
Lab R-Fs 0.0 1.0 0.0 0.0 1.2 0.0 0.0 0.0 0.0 0.0 2.3 4.5
Medical Imaging Equipment 0.0 0.0 0.0 0.0 1.9 0.0 0.0 0.8 0.0 0.0 0.0 2.7
LaptopPC 0.1 0.4 0.0 0.0 0.1 0.1 0.6 0.4 0.2 0.1 0.1 2.1
Video Displays 0.0 0.2 0.3 0.2 0.0 0.0 0.1 0.1 0.7 0.0 0.1 1.7
Large Format Video Boards 0.2 0.0 0.0 0.0 0.0 0.0 0.0 0.0 0.0 0.0 0.0 0.2
Note: Rows do not sum due to rounding

128 ©2013 Navigant Consulting, Inc. E N E R G Y
MEL Update » Appendix C › RMEL 2011 Summary
Appendix C: Residential MELs 2011 Base Year summary
Installed Base (000s)
UEC (kWh/yr)
AEC (TWh/yr)
Televisions 355,000 197 70.0Pool Heaters & Pumps 10,400 2,460 25.5Desktop PCs 102,000 220 22.5Set Top Boxes 176,000 127 22.4Ceil ing Fans 263,000 77 20.2Audio Equipment 193,000 83 16.0Monitors 130,000 99 12.8Dehumidifiers 15,600 710 11.1Laptop PCs 165,000 60 9.8Portable Electric Spas 4,630 2,040 9.5Modems & Routers 138,000 51 7.0External Power Supplies 1,077,000 6 7.0DVD Players 227,000 27 6.0Non PC Rechargeable Electronics 1,200,000 4 4.4Home Security Systems 28,000 45 1.3

129 ©2013 Navigant Consulting, Inc. E N E R G Y
MEL Update » Appendix D › RMEL Projection Summary
Appendix D: Residential MELs Installed Base Projections
2011 2015 2020 2030 2040 TrendlineNon PC Rechargeable Electronics 1,200,000 1,350,000 1,570,000 2,110,000 2,840,000External Power Supplies 1,077,000 1,210,000 1,400,000 1,880,000 2,530,000Televisions 355,000 364,000 388,000 444,000 501,000Ceiling Fans 263,000 283,000 300,000 325,000 325,000DVD Players 227,000 218,000 189,000 128,000 86,000Audio Equipment 193,000 198,000 204,000 219,000 233,000Set Top Boxes 176,000 233,000 352,000 400,000 442,000Laptop PCs 165,000 240,000 390,000 430,000 470,000Modems & Routers 138,000 120,000 120,000 120,000 130,000Monitors 130,000 125,000 119,000 109,000 99,000Desktop PCs 102,000 106,000 106,000 105,000 104,000Home Security Systems 28,000 35,000 49,000 57,000 64,000Dehumidifiers 15,600 16,400 17,400 19,500 21,600Pool Heaters & Pumps 10,400 11,100 11,900 13,700 15,400Portable Electric Spas 4,630 4,880 5,310 6,550 7,540
Installed Base (000s)

130 ©2013 Navigant Consulting, Inc. E N E R G Y
MEL Update » Appendix D › RMEL Projection Summary
Appendix D: Residential MELs UEC Projections
2011 2015 2020 2030 2040 TrendlinePool Heaters & Pumps 2,460 2,060 1,640 1,380 1,350Portable Electric Spas 2,040 2,050 2,060 2,070 2,070Dehumidifiers 710 620 530 510 490Desktop PCs 220 170 130 70 40Televisions 197 150 130 100 94Set Top Boxes 127 107 93 77 76Monitors 99 75 56 57 57Audio Equipment 83 88 85 82 78Ceiling Fans 77 71 65 55 47Laptop PCs 60 45 33 17 9Modems & Routers 51 44 38 28 20Home Security Systems 45 44 44 44 44DVD Players 27 23 19 13 9External Power Supplies 6.5 5.6 4.9 3.2 2.2Non PC Rechargeable Electronics 3.7 3.2 2.8 1.8 1.8
UEC (kWh/yr)

131 ©2013 Navigant Consulting, Inc. E N E R G Y
MEL Update » Appendix D › RMEL Projection Summary
Appendix D: Residential MELs AEC Projections
2011 2015 2020 2030 2040 TrendlineTelevisions 70 55 50 44 47Pool Heaters & Pumps 26 23 20 19 21Desktop PCs 22 18 14 7.4 4.2Set Top Boxes 22 25 33 31 34Ceiling Fans 20 20 20 18 15Audio Equipment 16 17 17 18 18Monitors 13 9.4 6.7 6.2 5.6Dehumidifiers 11 10 9.2 9.9 11Laptop PCs 9.8 11 13 7.2 4.2Portable Electric Spas 9.5 10 11 14 16Modems & Routers 7.0 5.2 4.5 3.3 2.6External Power Supplies 7.0 6.8 6.8 6.0 5.7DVD Players 6.0 4.9 3.5 1.6 0.8Non PC Rechargeable Electronics 4.4 4.3 4.3 3.9 5.0Home Security Systems 1.3 1.6 2.2 2.5 2.8
AEC (TWh/yr)

132 ©2013 Navigant Consulting, Inc. E N E R G Y
MEL Update » Appendix E › CMEL Projection Summary
Appendix E: Commercial MELs Installed Base and UEC Projections
2011 2015 2020 2030 2040 TrendlineWater Distribution* 5,115,000 5,250,000 5,514,000 5,956,000 6,402,000IT Equipment 487,000 551,000 642,000 873,000 1,190,000MonitorsPC 93,000 91,000 86,000 77,000 71,000DesktopPC 74,000 69,000 61,000 47,000 36,000LaptopPC 63,000 77,000 92,000 120,000 150,000Data Center Servers 12,200 14,000 16,000 21,000 28,000Security Systems 11,000 12,000 14,000 18,000 22,000Distribution Transformers 5,470 5,700 6,000 6,600 7,300Video Displays 1,600 3,200 5,200 9,200 13,200Lab R-Fs 1,000 1,030 1,100 1,200 1,300Kitchen Ventilation 790 810 860 950 1,050Medical Imaging Equipment 178 186 195 215 238Large Format Video Boards 1.0 1.0 1.0 1.0 1.0Note: *Water Distribution is in Mgal/yr
2011 2015 2020 2030 2040 TrendlineLarge Format Video Boards 152,000 144,000 137,000 129,000 121,000Kitchen Ventilation 52,000 51,000 48,000 41,000 33,000Medical Imaging Equipment 15,000 15,000 15,500 15,400 15,400Distribution Transformers 7,900 7,900 7,500 6,800 6,100Lab R-Fs 4,500 4,200 3,900 3,400 3,000Security Systems 2,500 2,400 2,300 2,100 2,000Data Center Servers 2,400 2,500 2,600 3,000 3,400Water Distribution* 1,284 1,310 1,340 1,410 1,480Video Displays 1,084 1,252 1,311 1,216 929DesktopPC 400 301 216 111 47MonitorsPC 198 168 112 87 69LaptopPC 34 24 19 13 8IT Equipment 25 25 24 23 22Note: *Water Distribution is in kWh/Mgal/yr
Installed Base (000s)
UEC (kWh/yr)

133 ©2013 Navigant Consulting, Inc. E N E R G Y
MEL Update » Appendix E › CMEL Projection Summary
Appendix E: Commercial MELs AEC projections.
2011 2015 2020 2030 2040 TrendlineDistribution Transformers 43 45 45 45 45Kitchen Ventilation 41 41 41 39 35DesktopPC 30 21 13 5.2 1.7Data Center Servers 29 35 42 63 95MonitorsPC 18 15 10 6.7 4.9IT Equipment 12 14 15 20 26Security Systems 7.4 8.2 9.2 11 13Water Distribution 6.6 6.9 7.4 8.4 9.5Lab R-Fs 4.5 4.3 4.3 4.1 3.9Medical Imaging Equipment 2.7 2.8 3.0 3.3 3.7LaptopPC 2.1 1.8 1.8 1.5 1.3Video Displays 1.7 4.0 6.8 11 12Large Format Video Boards 0.15 0.14 0.14 0.13 0.12
Annual Energy Consumption (TWh/yr)

134 ©2013 Navigant Consulting, Inc. E N E R G Y
Class Technology Food Cuisinarts Microwave Ovens Ranges Ovens Broilers Griddles Fryers Steamers Toasters Toaster Ovens Preparation Tables Blenders Immersion Blenders Hand Mixers Waffle Makers George Foreman Grills Disposals Trash Compactors Ice Makers/Machines Dishwashers Hot Pots Electric Kettles Mixers Slicers Meat Grinders Food Processors Coffee Machines
Kitchen Exhaust Hoods Cleaning Washing Machines Clothes Dryers Irons Vacuum Cleaners, Full Size Hand Vacuums Floor Washers
Class Technology Medical X-Rays MRIs CT-Scanners Ophthalmoscope EKGs Ultrasounds Heating Pads Defibrillators IV carts Heart Rate Monitors Hospital Beds Exam Tables Exam Lights Sterilizers Endoscopes Electronic Doors Speaker Systems Agricultural Irrigation Systems Communications Cordless Phones Cellular Phones Bluetooth Headsets Computer Devices PCs, Desktop PCs, Laptop PCs, Netbook PCs, Tablet Monitors Routers Modems, Broadband Computer Docks Scanners Inkjet Printers Laser Printers Impact Printers MFDs External Hard Drives Electronic Books
Class Technology Home Entertainment Televisions, Analog Televisions, Digital DVD Players VCRs
Streaming Media Players Video Game Consoles Set-Top Boxes, Cable Set-Top Boxes, Satellite Set-Top Boxes, DVR Set-Top Boxes, DTA Compact Audio Systems Component Stereos Home Theater in a Box Audio Equipment Personal Electronics MP3 Players Digital Cameras GPS units, Watches GPS units, Car-Mounted Tools Drills Saws Sanders Personal Hygiene Hair Dryers Hair Straighteners Razors, Electric Toothbrushes, Electric Refrigeration Residential Refrigerators and R/F
Residential Freezers Walk-in refrigerators Open display cases Closed display case/merchandiser Unit coolers and freezers Refrigerated prep tables Supermarket Refrigeration Refrigerated Vending Machines
MEL Update » Appendix F
Appendix F: List of all candidate MELs.

135 ©2013 Navigant Consulting, Inc. E N E R G Y
Class Technology Residential misc. Portable Electric Spas Dehumidifiers Ceiling Fans Whole House Fans Pools/Pool Pumps Water Bed Heaters Portable Lighting Outdoor Lighting Security Systems, Home Aquariums Garage Door Openers Space Heaters Fireplaces, Electric Disposals Hand Appliances Invisible Pet Fences Water Coolers Clocks Nightlights Air Purifiers
Commercial misc. Non-Refrigerated Vending Machines
Elevators Escalators Computer Servers Other Office Equipment
Automated Teller Machines (ATMs)
Coffee Brewers Shredders Copiers Security Cameras Electric Door Locks Electric Doors Fax Machines
Class Technology Public Works Well Pumps/Water Distribution Systems Water Purification Systems Water Treatment Systems Entertainment Arcades Slot Machines Fitness Treadmills Ellipticals Stair Masters Stationary Bikes
Rowing Machines Arc Trainers Laboratory Lab Fume Hoods Oscilloscopes Power Supply Multi-meter Furnaces Centrifuges Pumps Electronic Scales Microscopes Turbines Incubators Refractory Autoclaves Lab Refrigerators/Freezers Non-Road Vehicles Forklifts, Electric Burden carriers Utility Vehicles Sweeper-Scrubbers Burnishers Golf Carts Other Uninterruptible Power Supplies (UPSs) Point-of-Service Equipment Distribution Transformers Parking meters Street Lamps Mobile Phone Towers
MEL Update » Appendix F cont.

136 ©2013 Navigant Consulting, Inc. E N E R G Y
Item Installed Base AEC (TWh/yr) Data Year Washing Machines 83,443,800 75.18 2011 Refrigerators 107,768,400 69.08 2004 Clothes Dryers 59,108,400 31.35 Freezers 22,172,700 9.02 2005 Dishwashers 54,707,000 8.26 2012 Monitors Ovens, Electric 9,177,600 2011 Power Tools Ranges, Electric 54,785,600 2011 Space Heaters Whole House Fans
Appendix G: Other residential MELs removed during secondary screening.
MEL Update » Appendix G

137 ©2013 Navigant Consulting, Inc. E N E R G Y
Appendix G: Other commercial MELs removed during secondary screening.
MEL Update » Appendix G
Item Installed Base AEC (TWh/yr) Data Year Ovens 1,122,000 14.40 2008 Ice Makers/Machines 2,600,000 11.00 2008 Printers 34,000,000 11.00 2008 Vending Machines 6,600,000 11.00 2008 Steamers 1,156,000 9.80 2008 Griddles 786,000 5.30 2008 Fryers 935,000 4.80 2008 Televisions 16,000 3.80 2008 Irrigation Systems 3.60 2008 Copiers 3,700,000 2.70 2008 Broilers 87,370 2.50 2008 Ranges 187,000 2.30 2008 Exam Lights 2012 Speaker Systems

138 ©2013 Navigant Consulting, Inc. E N E R G Y
» 2009 data from AEO 2012
» 2010-2040 data from AEO2013 Early Release
Appendix H: Projection Resources
MEL Update » Appendix H
= Directly from sources (see above) =Calculated
2009 2010 2011 2015 2020 2030 2040U.S. Population 307,840,000 310,064,270 312,375,977 324,594,543 340,450,043 372,414,948 404,386,292Number of Households 113,780,000 115,230,000 116,170,000 120,780,000 127,520,000 140,630,000 153,320,000Household to Population Ratio 0.370 0.372 0.372 0.372 0.375 0.378 0.379New Housing Starts 600,000 640,000 660,000 1,640,000 1,890,000 1,890,000 1,890,000Avg Household square footage (ft2) 1,646 1,653 1,659 1,682 1,704 1,740 1,767Commercial Building Floorspace (MM ft2) 80,300 81,100 81,700 84,100 89,100 98,100 108,800Bldg Floorspace Growth Rate (%) 0.996% 0.740% 0.726% 1.162% 0.967% 0.967%U.S. Gross Domestic Product (MM USD) 12,703,000 13,063,000 13,299,000 14,679,000 16,859,000 21,355,000 27,277,000Annual Residential Elec Use (TWh) 1,366 1,445 1,424 1,366 1,418 1,571 1,767

May 2017
U.S. Energy Information Administration | Analysis and Representation of Miscellaneous Electric Loads in NEMS 3
APPENDIX B

/ ©2017 LEIDOS INC. AND NAVIGANT CONSULTING, INC. 1
ANALYSIS OF COMMERCIAL MISCELLANEOUS ELECTRIC LOADS – 2017 UPDATEPREPARED FOR: U.S. ENERGY INFORMATION ADMINISTRATION
Leidos, Inc.Jay Ratafia-BrownPeter KobylarekMatt Cleaver
Prepared by: Navigant Consulting, Inc.Ed BarbourMatt GuernseyEmmanuel AnifowosheSeth Schober
April 28, 2017
FINAL

/ ©2017 LEIDOS INC. AND NAVIGANT CONSULTING, INC. 2
TABLE OF CONTENTS
SECTION 1: EXECUTIVE SUMMARYSECTION 2: BACKGROUND AND METHODOLOGYSECTION 3: RESULTS DETAILS – TELECOMMUNICATIONS EQUIPMENT
• Traditional PBX• Voice-over-IP• Cellular and PCS Networks• Information and Communication Technology (ICT) Networks
- Includes ICT Long Haul networks and ICT Access networksSECTION 4: RESULTS DETAILS – OFFICE EQUIPMENT
• Copier• Scanner• Multifunction Device• Fax Machine• Shredder• Uninterruptible Power Supply
SECTION 5: REFERENCES

/ ©2017 LEIDOS INC. AND NAVIGANT CONSULTING, INC. 3
Executive Summary

/ ©2017 LEIDOS INC. AND NAVIGANT CONSULTING, INC. 4
Summary: We characterized energy consumption and installed base for four commercial miscellaneous electric loads (MELs) associated with telecommunication networks and seven MELs associated with commercial office equipment. The evaluation includes projections through 2050.
Objective: Develop an updated and expanded list of the estimated unit and national energy consumption for selected MELs.
MELs covered: • Telecommunications: Traditional PBX, voice-over-IP (VoIP), cellular and PCS
networks, ICT Long Haul networks, ICT Access Networks.• Office Equipment: Copiers, scanners, multifunction devices (MFDs), fax machines,
printers, shredders, and uninterruptible power supplies (UPS’s).
Goals:• Define each MEL and determine the scope of the technology to be analyzed.• Characterize the 2012 installed base and unit energy consumption.• Develop scenario-based projections through 2050.
EXECUTIVE SUMMARY » OBJECTIVE, SCOPE, AND GOALS

/ ©2017 LEIDOS INC. AND NAVIGANT CONSULTING, INC. 5
The evaluation used the following procedure:1. Define the scope of each selected MEL (listed in table below).2. Estimate the U.S. installed base in number of units or users.3. Approximate the unit energy consumption (UEC) by determining typical:
• Usage hours• Power consumption (per unit or per user, as appropriate)
4. Characterize relevant market, economic, demographic, and technology trends.5. Develop projections up to the year 2050 based
on expected changes in:• Usage hours• Power consumption• UEC• AEC• Installed base
EXECUTIVE SUMMARY » PROCESS DESCRIPTION
Telecommunications Office Equipment
• Traditional PBX• Voice-over-IP (VoIP)• Cellular and PCS networks• ICT long-haul networks• ICT access networks
• Copier• Scanner• Multifunction device• Fax machine• Printer• Shredder• Uninterruptible power supply (UPS)

/ ©2017 LEIDOS INC. AND NAVIGANT CONSULTING, INC. 6
EXECUTIVE SUMMARY » TELECOMMUNICATIONS EQUIPMENT
This analysis covered five separate types of telecommunications equipment.
MEL DefinitionTraditional PBX Standalone on-premise equipment used to route calls over telephone lines (a.k.a. legacy PBX).
VoIP (IP PBX) Standalone on-premise equipment used to route calls over the Internet (a.k.a. IP PBX and Media Gateway).
Cellular and PCS Networks
Central radio transmitter/receiver, including base station equipment.
ICT Long-haul Networks System of routers and Ethernet switches interconnected by an optical transport network (OTN) of optical transceivers and amplifiers/repeaters used to transmit data packets over long distances (e.g., between regions or metropolitan areas).
ICT Access Networks “The last mile" of telecom operator networks. Connect carrier/service provider central offices to end consumers, providing telephone and internet services.

/ ©2017 LEIDOS INC. AND NAVIGANT CONSULTING, INC. 7
This analysis covers seven types of office equipment.
EXECUTIVE SUMMARY » OFFICE EQUIPMENT
MEL DefinitionCopiers A photocopier, or copier, is an office machine that duplicates physical documents on paper in a two
dimensional format. It is used for reproducing text, images, charts, and graphs.
Scanners A scanner converts physical documents into two-dimensional digital representations that can be either stored electronically, transmitted to a computer, or both.
Multifunction Devices (MFDs)
An MFD incorporates several, or all, of the operational capabilities of a copier, scanner, fax machine, printer, and the ability to send emails.
Fax Machines A fax machine is a device that copies documents and transmits this copy via telephonic transmission to a telephone number connected to a printer or an output device.
Printers A printer transcribes digital documents to two-dimensional representations on paper or an equivalent physical medium.
Shredders A shredder uses a power source to mechanically cut paper into either strips or fine particles, typically with the aim of destroying documents containing sensitive information.
Uninterruptible Power Supplies (UPS’s)
UPS’s consists of a combination of convertors, switches and energy storage devices, constituting a power system for maintaining continuity of load power in case of input power failure.

/ ©2017 LEIDOS INC. AND NAVIGANT CONSULTING, INC. 8
• The largest change in the telephone and telecommunications industry over the past ten years is the surfacing and widespread use of converged networks and Unified Communications (UC) – that is, a single network for all data, voice, and video.
• Due to UC, the same network equipment is often used to provide video, voice, and data services, and some parts of telephone networks are no longer separately distinguishable.
• A current trend indicates moving away from even these recent topologies to a cloud-services based concept, where the telephony head-end equipment is located off the private network and managed independently of the actual Local Area Network.
• Energy efficiency will likely improve in the “cloud” model; however, any savings realized through the efficient location and “sharing” of hardware will most likely be offset by an effort to increase available bandwidth and network speeds.
• Wired technologies offer higher bandwidths and energy efficiency per bit of data transfer; however, wireless technologies are growing faster due to consumer demand for mobility.
EXECUTIVE SUMMARY » TELECOM TECH TRENDS

/ ©2017 LEIDOS INC. AND NAVIGANT CONSULTING, INC. 9
• The most significant trend in office-related commercial MELs is the replacement of single-function devices with MFDs.
• Because of combined functionalities, the total installed base of commercial imaging equipment MELs is expected to decrease by 9% from 2012 to 2050, even though commercial building floorspace will grow by 45%. Spaces that previously required a separate copier, scanner, fax, and printer will simply require one MFD.
• Fax machines are seeing dramatic decreases in installed base. By 2050, these devices are expected to be generally obsolete. This change is the result of the transition from paper to digital document storage, the MFD takeover, and the diminishing use of fax technology as other methods for secure transmission have become available.
• In data centers and other commercial spaces, reliable power supplies are essential to business operations. Growth in data center space will increase quicker than general commercial space because of increased demand for data storage and computing requirements. The installed base of UPS’s will grow by 260%. Despite projected efficiency improvements, the AEC will grow by 230%.
EXECUTIVE SUMMARY » OFFICE EQUIPMENT TRENDS

/ ©2017 LEIDOS INC. AND NAVIGANT CONSULTING, INC. 10
• The selected telecommunications MELs consumed an estimated 13 TWh in 2012. • The selected office equipment MELs consumed 11 TWh in 2012. • The MEL with the most significant AEC in 2012 was printers at 4.8 TWh.
EXECUTIVE SUMMARY » RESULTS SUMMARY
Annual Energy Consumption by Building Type (TWh/yr)
AEC (TWh/yr) Assembly Education Food Sales Food Service
Healthcare Lodging Large Office
Small Office
Mercantile & Service
Warehouse Other Total
Office MELs
Copiers <0.01 <0.01 <0.01 <0.01 <0.01 <0.01 <0.01 0.02 <0.01 <0.01 <0.01 0.05
Scanners <0.01 0.01 <0.01 <0.01 <0.01 <0.01 0.02 0.02 0.01 <0.01 <0.01 0.09
Multifunction Devices 0.10 0.11 0.02 0.03 0.06 0.03 0.17 0.34 0.19 0.09 0.05 1.20
Faxes <0.01 <0.01 <0.01 <0.01 <0.01 <0.01 <0.01 <0.01 <0.01 <0.01 <0.01 0.01
Printers 0.27 0.73 0.05 0.10 0.24 0.17 0.80 1.22 0.68 0.34 0.17 4.80
Shredders <0.01 0.03 <0.01 <0.01 0.02 <0.01 0.06 0.04 0.02 0.02 <0.01 0.23
Uninterruptible Power Supplies 0.30 0.80 0.10 0.10 0.20 0.10 4.50 1.40 0.60 0.40 0.50 4.60
Telephone MELs
Private Branch Exchange 0.02 0.05 0.00 0.01 0.02 0.01 0.07 0.08 0.05 0.03 0.02 0.4
Voice over IP 0.01 0.03 0.00 0.01 0.01 0.01 0.05 0.05 0.03 0.02 0.01 0.2
Cellular-Personal Comm Service 0.0 0.0 0.0 0.0 0.0 0.0 0.0 0.0 0.0 0.0 3.1 3.1
ICT-Long Haul Networks 0.0 0.0 0.0 0.0 0.0 0.0 0.0 0.0 0.0 0.0 4.5 4.5
ICT-Access Networks 0.0 0.0 0.0 0.0 0.0 0.0 0.0 0.0 0.0 0.0 4.5 4.5

/ ©2017 LEIDOS INC. AND NAVIGANT CONSULTING, INC. 11
• Traditional PBX are quickly being replaced by IP PBX used for VoIP systems. • Cellular and PCS network AEC shows steady growth after 2016 as subscribership
and demand for wireless data increases.
EXECUTIVE SUMMARY » PROJECTIONS
* Does not include ICT Long Haul Networks

/ ©2017 LEIDOS INC. AND NAVIGANT CONSULTING, INC. 12
• ICT long-haul network AEC expected to grow at a CAGR of 9% through 2050 due to increasing data traffic volume
EXECUTIVE SUMMARY » PROJECTIONS CONT.

/ ©2017 LEIDOS INC. AND NAVIGANT CONSULTING, INC. 13
• The total AEC of the office-related MELs is expected to grow by 30% over the forecast period.
• MFDs will see the largest device-specific AEC growth—an increase of 290% between 2012 and 2050.
EXECUTIVE SUMMARY » PROJECTIONS CONT.

/ ©2017 LEIDOS INC. AND NAVIGANT CONSULTING, INC. 14
Background & Methodology

/ ©2017 LEIDOS INC. AND NAVIGANT CONSULTING, INC. 15
• Miscellaneous electric loads (MELs) are the loads outside of a building’s core functions of heating, ventilating, air-cooling, lighting, and water heating.*
• This study focuses on a subset of MELs for:- Telecommunication networks.- Office equipment.
• Wherever workable, we followed the same methodology, reporting framework, and outputs as we provided in the past to ensure consistency. The primary model leveraged was from “Analysis and Representation of Miscellaneous Electric Loads in NEMS,” Dec, 2013.**
BACKGROUND » MEL DEFINITION
*Source: Emily Rauch and Michael Baechler, Pacific Northwest National Laboratory, Sept 2011, “Assessing and Reducing Miscellaneous Electric Loads (MELs) in Banks” Available at: http://www.pnnl.gov/main/publications/external/technical_reports/PNNL-20973.pdf**Available: https://www.eia.gov/analysis/studies/demand/miscelectric/pdf/miscelectric.pdf

/ ©2017 LEIDOS INC. AND NAVIGANT CONSULTING, INC. 16
When sufficient data were available*, we followed a bottom-up methodology to calculate the three primary outputs for each MEL: unit energy consumption (UEC), installed base, and annual energy consumption (AEC).
X =X =
METHODOLOGY » OVERVIEW
X =X =
Time(Active)
Power(Active)
UEC (Active)
+Time
(Sleep)Power (Sleep)
UEC (Sleep)
+Time (Off)
Power (Off)
UEC (Off)
Total UEC Installed Base Total AEC
UEC (kWh/yr) by operating mode
Hours Watts kWh/yr Thousands TWh/yr* Based on the Contractor’s judgment of whether available data were sufficient to formulate credible, bottom-up estimates.

/ ©2017 LEIDOS INC. AND NAVIGANT CONSULTING, INC. 17
METHODOLOGY » ENERGY USE
When sufficient data were not available for a complete bottom-up analysis of energy consumption*, we customized the approach to develop the best estimates possible.
Example: Fax Machines• Very little data were available on hours of operation and energy consumption in
individual modes. Accordingly, we based UEC estimates directly on a study by the California Energy Commission.
* Based on the Contractor’s judgment of whether available data were insufficient to formulate credible, bottom-up estimates.
xUEC Installed Base AEC=

/ ©2017 LEIDOS INC. AND NAVIGANT CONSULTING, INC. 18
Installed base estimates were developed using one or more of the following available resources:• Field surveys (e.g., Commercial Building Energy Consumption Survey [CBECS])• Useful life and annual sales data• Other recent studies that developed estimates
Unique case: MFDs• While the installed base of copiers, scanners, and printers was gathered from CBECS 2012,
the installed base for MFDs was not available. • CBECS questions did not necessarily elicit distinctions from respondents regarding whether a
device serves multiple functions, thus introducing a challenge to distinguish between single-function devices and MFDs. To overcome this challenge, we:
1. Determined if multiple imaging devices were in each building.2. Assumed that the MEL with the smallest number of units represented the MFD count
for each building.3. Subtracted the MFD count from the CBECS counts, with the remainder representing
the numbers of copiers, printers, and scanners. E.g., if CBECS data indicated 3 copiers, 5 scanners, and 7 printers in a building, then our count was 3 MFDs, 2 scanners, and 4 printers.
METHODOLOGY » INSTALLED BASE

/ ©2017 LEIDOS INC. AND NAVIGANT CONSULTING, INC. 19
METHODOLOGY » PRODUCT TYPES
Consideration was made for varying product sizes/capacities and product subtypes.• In general, we developed projections based on a “typical” unit for each MEL, in
terms of size/capacity and usage.- Such a composite unit may not exist in the real world; it represents the average unit in the
U.S.
• Exceptions were made where product subtypes have markedly different power and usage hours.- For Cellular and PCS Networks, we projected each subtype separately and calculated the
weighted average at the end.
• We developed a unique projection approach for each MEL, generally based on observed trends in:- Past sales data and effective useful life.- Reported installed base data.- Product specifications from manufacturer datasheets.

/ ©2017 LEIDOS INC. AND NAVIGANT CONSULTING, INC. 20
We projected UEC, installed base, and AEC for each MEL out to 2050. • Where data were available, we based energy projections on individual growth rates
for annual hours of use and power consumption for each MEL. • For MELs that did not have use and power data available, we projected UEC
directly.• In general, we developed projections based on a composite unit for each MEL,
which is defined by an average that is weighted by the installed base of each product subtype.- E.g., the composite shredder, used for all shredder projections, comprises models of all
sizes.
• We based projections for each MEL on unique trends in:- Population- Building floor space or stock- Gross Domestic Product (GDP)- Past sales data and effective useful life- Other market trends, such as the decline in paper use in the U.S.
METHODOLOGY » PROJECTIONS

/ ©2017 LEIDOS INC. AND NAVIGANT CONSULTING, INC. 21
We split MEL estimates by building type, using the National Energy Modeling System (NEMS) definitions, which are closely correlated to the CBECS 2012 definitions.
METHODOLOGY » BREAKDOWN BY BUILDING TYPE
Building Type DescriptionAssembly Public assembly (stadium, gym, library), religious
Education College, K-12 schools (elementary, middle, high)
Food Sales Grocery stores and convenience stores
Food Service Restaurant, fast food, cafeteria
Healthcare Hospitals providing inpatient health services
Lodging Hotel, motel, dormitory, nursing home
Large Office Offices > 50k sq ft of floor space
Small Office Offices < 50k sq ft, including outpatient healthcare
Mercantile and Service Retail, service shops, strip malls, enclosed malls
Warehouse Refrigerated and non-refrigerated storage
Other Public order (police, fire), vacant, other
For buildings with multiple functions, the largest usage of floor area determines principal activity.

/ ©2017 LEIDOS INC. AND NAVIGANT CONSULTING, INC. 22
Results – Telecommunications Equipment

/ ©2017 LEIDOS INC. AND NAVIGANT CONSULTING, INC. 23
• Traditional PBX systems are rapidly being upgraded or replaced with Voice over Internet Protocol (VoIP) and unified communications (UC) technologies such as IP PBX systems and hosted/cloud-based services.
• Traditional PBX units come in a variety of user capacities from tens of users to thousands of users.
• Market data indicate that sales of new PBX units virtually stopped by 2012.
• Installed base data were only available in terms of PBX-connected phone lines (i.e., end users).*
TELECOM MELS » TRADITIONAL PBX
Scope: Traditional or legacy Private Branch Exchanges (PBX) used by commercial enterprises to route and switch calls in a building over Plain Old Telephone Service (POTS) lines. Does not include IP PBX systems used to support VoIP networks.
2012 2016 2020 2030 2040 2050Installed Base (000s) 21,400 13,100 7,900 2,200 0 0Average Power Draw watts 1.96 1.96 1.96 1.96 1.96 1.96Annual Usage hours 8,760 8,760 8,760 8,760 8,760 8,760UEC kWh/yr 17 17 17 17 17 17AEC TWh/yr 0.4 0.2 0.1 0.04 0.0 0.0
* The terms lines and end users refer to individual people, rather than buildings

/ ©2017 LEIDOS INC. AND NAVIGANT CONSULTING, INC. 24
• This analysis allocates the installed base across building types based on total workers by building type from CBECS 2012.
• Power draw varies little by operating mode or call activity.• This analysis assumes 24x7x365 operation with an average power draw of
1.96 watts per user.• Efficiency is constant through 2050 since new units are not being installed
after 2012.
TELECOM MELS » TRADITIONAL PBX CONT.
2012 Base Year DataInstalled Base
(000s)UEC (kWh/yr) AEC (TWh/yr)
Assembly 1,225 17 0.02Education 2,642 17 0.05Food Sales 284 17 0.00Food Service 833 17 0.01Healthcare 1,039 17 0.02Lodging 744 17 0.01Large Office 4,326 17 0.07Small Office 4,675 17 0.08Mercantile & Service 3,191 17 0.05Warehouse 1,544 17 0.03Other 898 17 0.02

/ ©2017 LEIDOS INC. AND NAVIGANT CONSULTING, INC. 25
TELECOM MELS » VoIP
Scope: Onsite equipment used to route voice calls on a VoIP network, often referred to as an IP PBX. Does not include connected communication devices (e.g., VoIP phones), analog gateways, computers, servers, or other networking or IT equipment, or hosted VoIP networks where the equipment resides on the host IT servers.
• VoIP technology for business applications began in the mid 1990’s and is currently growing rapidly.
• While on-premise VoIP systems continue to grow, businesses are increasingly moving to hosted VoIP solutions to cut costs and increase flexibility.
• Installed base data for on-premise systems was only available in terms of IP PBX-connected lines (i.e., end users).*
2012 2016 2020 2030 2040 2050Installed Base (000s) 89,200 112,700 123,600 130,400 131,000 131,100Average Power Draw watts 0.29 0.28 0.28 0.26 0.23 0.19Annual Usage hours 8,760 8,760 8,760 8,760 8,760 8,760UEC kWh/yr 2.5 2.5 2.4 2.3 2.0 1.7AEC TWh/yr 0.2 0.3 0.3 0.3 0.3 0.2
* The terms lines and end users refer to individual people, rather than buildings

/ ©2017 LEIDOS INC. AND NAVIGANT CONSULTING, INC. 26
• Average power draw per line determined by dividing total power draw by the number of connected users at 75% of user capacity for a representative sample of equipment.
• Rate of energy efficiency improvement assumed to match that of IT Equipment from.
TELECOM MELS » VoIP CONT.
2012 Base Year DataInstalled Base
(000s)UEC (kWh/yr) AEC (TWh/yr)
Assembly 5,106 2.5 0.01Education 11,011 2.5 0.03Food Sales 1,186 2.5 0.00Food Service 3,471 2.5 0.01Healthcare 4,330 2.5 0.01Lodging 3,101 2.5 0.01Large Office 18,032 2.5 0.05Small Office 19,485 2.5 0.05Mercantile & Service 13,300 2.5 0.03Warehouse 6,435 2.5 0.02Other 3,744 2.5 0.01

/ ©2017 LEIDOS INC. AND NAVIGANT CONSULTING, INC. 27
• Base stations typically include several pieces of equipment that consume power, such as amplifiers, transceivers, power conversion modules, equipment air conditioning units, and signal processors. For the purpose of this analysis the entire base station is considered a single piece of end-use equipment.
• This analysis includes both large and small base stations. Large, or macro, base stations typically include large towers and have a range of 10 miles or more. Small, or micro, base stations are often located on top of buildings and a range of about 1 mile.
• Very small (Femto) cells are not included as they are typically behind the meter
TELECOM MELS » CELLULAR AND PCS NETWORKSScope: Equipment associated with the central radio transmitter/receiver and associated equipment, together known as a base station, that communicates with mobile telephones and other devices in order to provide wireless service in a geographic area. Both macro and micro/small base stations are included. Does not include connected communication devices (phones, tablets, computers, etc.), mobile switching, core transmission, data centers.
2012 2016 2020 2030 2040 2050Installed Base (000s) 360 420 520 780 1,040 1,300Average Power Draw watts 980 720 580 510 470 450Annual Usage hours 8,760 8,760 8,760 8,760 8,760 8,760UEC kWh/yr 8,600 6,300 5,100 4,500 4,200 4,000AEC TWh/yr 3.1 2.6 2.7 3.5 4.4 5.2

/ ©2017 LEIDOS INC. AND NAVIGANT CONSULTING, INC. 28
• The Wireless Industry Association (CTIA) tracks the number of macro base stations in service.
• Micro base station installed base data was not available, however, an estimate was obtained through personal communication with cell tower leasing company Steel in the Air.
• Although power draw varies depending on data traffic, the traffic often comes in bursts and varies widely among cell sites.
• This analysis assumes “always on” operation and uses an average power draw for macro and micro base stations.
TELECOM MELS » CELLULAR AND PCS NETWORKS CONT.

/ ©2017 LEIDOS INC. AND NAVIGANT CONSULTING, INC. 29
TELECOM MELS » ICT LONG-HAUL NETWORKS
Scope: This analysis includes equipment in 3 network segments: (1) backbone, (2) aggregation, and (3) optical transport. The backbone segment includes layer 3 (L3) internet protocol/multiprotocol label switching (IP/MPLS) routers interconnected via an Optical Transport Network (OTN) platform. The aggregation segment includes layer 2 (L2) carrier-grade Ethernet switches interconnected via metro/regional OTN rings (Lange, 2011). OTNs are composed mainly of optical transceivers and amplifiers. Data centers, mobile radio networks, and access networks are not included. Overhead energy user for equipment cooling and power conditioning is also not included.
• Due to network complexity and data availability, this analysis utilizes an alternative, top-down estimation method. As a result, installed base, power draw, usage, and UEC data were not quantified.
• The consumption in network segments with aggregated traffic (aggregation and core networks) is proportional to the traffic volume. (Lange, 2011)
Optical Transport Network(Transceivers, Amplifiers)
Aggregation(L2 Switches)
Backbone(L3 Routers)
2012 2016 2020 2030 2040 2050AEC - Backbone TWh/yr 1.3 5.1 6.7 13 27 53AEC - Optical Transport TWh/yr 0.8 1.2 1.6 3.1 6 12AEC - Aggregation TWh/yr 2.4 4.5 5.9 12 23 47AEC - Total TWh/yr 4.5 11 14 28 56 112

/ ©2017 LEIDOS INC. AND NAVIGANT CONSULTING, INC. 30
TELECOM MELS » ICT LONG-HAUL NETWORKS CONT.
• Annual Energy Consumption (AEC) was calculated for each network segment by multiplying worldwide telecom operator network energy consumption by the relative share of each network segment and by the U.S. share of worldwide broadband subscriptions, then dividing by an overhead factor.
• The backbone, aggregation, and optical transport network segments accounted for about 6%, 11%, and 3.5% of energy consumption in telecom operator networks in 2012 (Lange, 2011).
• The U.S. share of worldwide fixed telephone and broadband subscriptions was about 12.7% in 2012 and 11.8% in 2016 (ITU, 2016).*
• To avoid double-counting, overhead energy consumption for supplemental cooling and power conditioning requirements of long-haul network equipment was removed by dividing by an overhead factor of 1.5 per (Baliga, 2011).
• Projections for 2016-2050 assume equipment efficiency will improve 10% per year (Baliga, 2011 and Ishii, 2015) and internet traffic volume will increase 19% per year (Cisco, 2016).
* Note that a single subscription is often shared by multiple or many individual end users, especially in commercial spaces.

/ ©2017 LEIDOS INC. AND NAVIGANT CONSULTING, INC. 31
TELECOM MELS » ICT ACCESS NETWORKS
Scope: This end-use includes terminal units in central offices and equipment in remote nodes (manholes, curbside pedestals, etc.). Customer premise equipment such as modems, routers, and network terminals located behind-the-meter are not included in this analysis to avoid double-counting. Overhead energy for equipment cooling and power conditioning in central offices is also not included.
• Common types of access networks include cable, DSL, fiber-to-the-node (FTTN), and fiber-to-the-premise (FTTP).
• Depending on the connection type, signals may be sent over optical fiber, copper wires, or a combination of both.
• For many connection types, a remote node (e.g., manhole, curbside pedestal) located between the consumer and central office to split, aggregate, and/or amplify signals.
2012 2016 2020 2030 2040 2050Installed Base (000s) 93,000 102,000 110,000 123,000 133,000 141,000Average Power Draw watts 5.5 5.7 5.4 3.5 2.0 1.7Annual Usage hours 8,760 8,760 8,760 8,760 8,760 8,760UEC kWh/yr 48.5 49.9 47.2 30.5 17.7 14.6AEC TWh/yr 4.5 5.1 5.2 3.8 2.4 2.1
Central Office (terminal unit)
Remote Note (manhole, curb-side pedestal,
etc.)
Customer Premises A
(network terminal)
Customer Premises B
(network terminal)
Customer Premises C
(network terminal)

/ ©2017 LEIDOS INC. AND NAVIGANT CONSULTING, INC. 32
TELECOM MELS » ICT ACCESS NETWORKS CONT.
• In 2012, cable, DSL (including FTTN), and FTTP accounted for 56%, 34%, and 7% of broadband subscriptions in the U.S.*
• FTTP subscribership is increasing faster than any other access network type due to higher available access rates (i.e., internet speeds). The eventual replacement of DSL and cable with FTTP will also yield energy savings due to higher efficiency of FTTP networks.
• Terminal units and equipment at remote nodes are assumed to be loaded to 80% of max capacity per (Baliga, 2011). Since power does not scale with utilization, this results in a 25% increase in power draw per user compared to fully loaded conditions.
• Data was not available on the share of DSL connections supported by fiber-to-the-node (FTTN). The analysis assume a 50/50 split of all copper DSL and FTTN DSL.
• This analysis does not distinguish between residential and commercial subscribers due to a lack of available data on commercial access networks. All subscribers are treated as residential in terms of power draw and subscriber capacity of equipment. This may underestimate UEC and AEC since commercial subscribers are likely more energy intensive than residential subscribers due to higher access rates and connected users/devices per subscription. Commercial subscriptions represent about 9% of subscriptions.
• This analysis assumes increasing power demands from increasing access rates are approximately equivalent to power reductions from energy efficiency improvements on a watts per user basis.
* Note that a single subscription is often shared by multiple or many individual end users, especially in commercial spaces.

/ ©2017 LEIDOS INC. AND NAVIGANT CONSULTING, INC. 33
Results –Office Equipment

/ ©2017 LEIDOS INC. AND NAVIGANT CONSULTING, INC. 34
OFFICE MELS » COPIER
Scope: This end-use includes single-function copiers only, i.e., those with the single function of copying and not those built into multifunction devices or having multiple functions, (e.g., copying and scanning).
Photo Source: http://www.amazon.com
• Copiers have the lowest installed base of all imaging equipment in this study. • Formerly commonplace in every office, standalone copiers are becoming less
common as: - Multifunction devices often take their place.- Paper-based documents are increasingly being used only in electronic formats.

/ ©2017 LEIDOS INC. AND NAVIGANT CONSULTING, INC. 35
• Most standalone copiers utilize analog copying methods, which are correlated with a high UEC.
• Digital copiers are typically more efficient than their analog counterparts. • However, since digital copiers use scanning technology, they often incorporate
the functionality of a stand-alone scanner, and those that do are thus classified as MFDs.
OFFICE MELS » COPIER CONT.

/ ©2017 LEIDOS INC. AND NAVIGANT CONSULTING, INC. 36
• Stand-alone scanners are most common in small offices (as well as in homes, which are outside the scope of this study).
• Large offices are more likely to use MFDs for all document imaging and printing needs due to higher volume requirements, which help justify the purchase of larger, more robust equipment.
OFFICE MELS » SCANNER
Scope: This end-use includes document scanners used to convert physical documents into digital form. Excluded are film scanners, hand-held scanners for 3-D printing, and large-scale industrial drum scanners used in publishing.
Photo Source: http://pngimg.com/

/ ©2017 LEIDOS INC. AND NAVIGANT CONSULTING, INC. 37
• Scanners have the lowest UEC of the characterized MELs.• 87% of scanners sold in 2008 were ENERGY STAR qualified. This number
reached 99% in 2010.• After 2010, ENERGY STAR stopped releasing data for standalone scanners, which
is believed to be a result of scanners commonly being incorporated into MFDs.• ENERGY STAR imaging products are roughly 30% more efficient than non-
ENERGY STAR products, according to the EPA.
OFFICE MELS » SCANNER CONT.

/ ©2017 LEIDOS INC. AND NAVIGANT CONSULTING, INC. 38
OFFICE MELS » MFD
Scope: This end-use includes all-in-one small desktop units; multifunction devices for small office/home office use (i.e., desktop products); and full-size office multifunction devices (i.e., floor-standing products).
Photo Source: https://www.energystar.gov/
• MFDs combine multiple imaging equipment functions into one package, including printing, scanning, copying, and faxing.
• The MFD market has been growing steadily as improved imaging technology makes it possible for devices to perform multiple functions.
• Laser MFDs constitute the majority of the market. These units have high energy use due to the heat intensive process of fusing ink to paper.

/ ©2017 LEIDOS INC. AND NAVIGANT CONSULTING, INC. 39
OFFICE MELS » MFD CONT.
• In 2010, 99% of MFD shipments were ENERGY STAR qualified.
• After 2010, ENERGY STAR reports combined MFD and printing shipments, highlighting the takeover of printer market by MFDs.
• Power consumption is expected to decrease by 30% over the forecast period. This change is primarily because of changes in idle-state power consumption.

/ ©2017 LEIDOS INC. AND NAVIGANT CONSULTING, INC. 40
• The use of stand-alone fax machines is on the decline due to:- Proliferation of electronic document transmission as pdf files via email
and, to a smaller extent, by fax-over-IP (FoIP).- Documents are being increasingly used in only electronic formats.- Multifunction devices are taking their place.- The acceptance of electronic signatures for sensitive documents- Multiple advances in secure data transmission reduce the value of faxes
• By 2050, only very few units will still be in use in niche applications;but will be obsolete for most intents and purposes.
OFFICE MELS » FAX MACHINE
Scope: This includes all standalone fax machines, including inkjet, laser, and thermal technologies.
Photo Source: https://www.cpsc.gov/
2012 2016 2020 2030 2040 2050Installed Base (000s) 90 61 31 6 2 1UEC kWh/yr 57 52 47 40 34 31AEC TWh/yr 0.0051 0.0032 0.0015 0.0002 0.00007 0.00003

/ ©2017 LEIDOS INC. AND NAVIGANT CONSULTING, INC. 41
OFFICE MELS » FAX MACHINE CONT.
• As of 2008 only 4% of fax shipments were Energy Star certified.
• This number rose to just 7% in 2013, when EPA stopped tracking shipments volumes.
• ENERGY STAR imaging products are about 30% more efficient than non-certified products.
• Due to decreasing demand for faxes, there is little incentive for the development and introduction of new, power-saving idle modes.
2012 Base Year Data Installed Base (000s)
UEC (kWh/yr) AEC (TWh/yr)
Assembly 8.9 57 0.00051Education 6.2 57 0.00035Food Sales 3.0 57 0.00017Food Service 5.2 57 0.00030Healthcare 0.2 57 0.00001Lodging 2.4 57 0.00014Large Office 1.5 57 0.00009Small Office 27 57 0.0015Mercantile & Service 23 57 0.0013Warehouse 9.3 57 0.00053Other 3.6 57 0.00021

/ ©2017 LEIDOS INC. AND NAVIGANT CONSULTING, INC. 42
• Printers currently have the largest installed base of all the imaging equipment MELs in this study.
• However, the growth of the MFD market will continue to erode the printer market as manufacturers are able to cheaply introduce other functionalities into single-function devices.
• Between the years 2020 and 2030, the total MFD installed base will surpass that of printers.
OFFICE MELS » PRINTER
Scope: This includes standalone ink-jet printers and standalone laser printers. Not covered are 3-D printers, plotters, thermal printers (e.g., cash registers), dye-sublimation printers, dot-matrix printers, line printers, liquid ink electrostatic printers, and photo printers.
Photo Source: https://www.cpsc.gov/

/ ©2017 LEIDOS INC. AND NAVIGANT CONSULTING, INC. 43
OFFICE MELS » PRINTER CONT.
• Like MFDs, laser printers consume significantly more power than similar inkjet models.
• The technologies used for decreased idle-state power consumption in printers are identical to those used in MFDs. Together, the large installed bases and industry size will drive improvements in technology, including idle-state power.
2012 Base Year DataInstalled Base
(000s) UEC (kWh/yr) AEC (TWh/yr)
Assembly 1,100 243 0.3Education 3,000 243 0.7Food Sales 200 243 0.05Food Service 400 243 0.1Healthcare 1,000 243 0.2Lodging 700 243 0.2Large Office 3,300 243 0.8Small Office 5,000 243 1.2Mercantile & Service 2,800 243 0.7Warehouse 1,400 243 0.3Other 700 243 0.2

/ ©2017 LEIDOS INC. AND NAVIGANT CONSULTING, INC. 44
OFFICE MELS » SHREDDER
Scope: This end-use includes paper shredders connected to an electric power source in a commercial space. Excluded are mobile paper-shredding box trucks.
Photo Sources: http://www.abe-online.com/, http://rilane.com/
• Paper shredders preserve confidentiality by destroying sensitive documents.• Approximately 60% of total power consumption occurs in idle mode since
shredders are estimated to operate an average of only five minutes per day.
• With the emerging trend of power-saving idle modes, the idle power consumption will decrease significantly by 2050.

/ ©2017 LEIDOS INC. AND NAVIGANT CONSULTING, INC. 45
OFFICE MELS » SHREDDER CONT.
• With the continued transition from physical to digital information sharing, the decrease in paper use will diminish the need for shredders in commercial spaces.
• In the last decade, the market for outsourced shredding has grown significantly, further eroding the market for in-office shredders. Third-party outsourcing companies pick up documents from the client and shred them securely with their own equipment, typically built into a truck.
2012 Base Year DataInstalled Base
(000s) UEC (kWh/yr) AEC (TWh/yr)
Assembly 220 40 0.009Education 770 40 0.031Food Sales 80 40 0.003Food Service 240 40 0.010Healthcare 540 40 0.021Lodging 220 40 0.009Large Office 1,200 50 0.060Small Office 1,200 33 0.039Mercantile & Service 570 40 0.023Warehouse 450 40 0.018Other 250 40 0.010

/ ©2017 LEIDOS INC. AND NAVIGANT CONSULTING, INC. 46
• There are 3 kinds of UPS: - Voltage and Frequency Dependent (VFD) - lower power ratings; used
for equipment not sensitive to voltage and frequency fluctuations.- Voltage Independent(VI) - low to medium power ratings and can be a
cheap alternative to VFIs for sensitive equipment.- Voltage and Frequency Independent(VFI) – medium to high power
ratings and are used for sensitive equipment, like data center servers.
OFFICE MELS » UPS
Scope: This end-use includes those that support electronic equipment in an office, including in server closets and server rooms, and data centers.
Photo Source: https://www.energystar.gov/
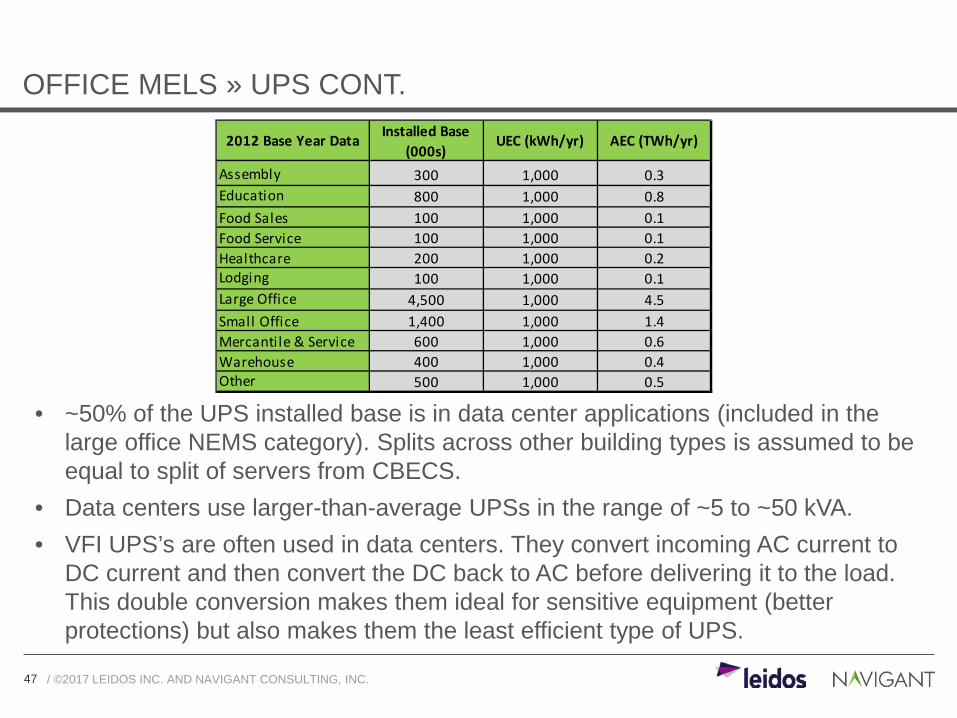
/ ©2017 LEIDOS INC. AND NAVIGANT CONSULTING, INC. 47
OFFICE MELS » UPS CONT.
• ~50% of the UPS installed base is in data center applications (included in the large office NEMS category). Splits across other building types is assumed to be equal to split of servers from CBECS.
• Data centers use larger-than-average UPSs in the range of ~5 to ~50 kVA.• VFI UPS’s are often used in data centers. They convert incoming AC current to
DC current and then convert the DC back to AC before delivering it to the load. This double conversion makes them ideal for sensitive equipment (better protections) but also makes them the least efficient type of UPS.
2012 Base Year Data Installed Base (000s)
UEC (kWh/yr) AEC (TWh/yr)
Assembly 300 1,000 0.3Education 800 1,000 0.8Food Sales 100 1,000 0.1Food Service 100 1,000 0.1Healthcare 200 1,000 0.2Lodging 100 1,000 0.1Large Office 4,500 1,000 4.5Small Office 1,400 1,000 1.4Mercantile & Service 600 1,000 0.6Warehouse 400 1,000 0.4Other 500 1,000 0.5

/ ©2017 LEIDOS INC. AND NAVIGANT CONSULTING, INC. 48
ED BARBOURManaging [email protected]
MATT GUERNSEYAssociate [email protected]
EMMANUEL ANIFOWOSHE Senior [email protected]
SETH [email protected]
NAVIGANT CONTACTS LEIDOS CONTACTSJAY RATAFIA-BROWNProgram [email protected]
PETER KOBYLAREKEnergy [email protected]

/ ©2017 LEIDOS INC. AND NAVIGANT CONSULTING, INC. 49
References

/ ©2017 LEIDOS INC. AND NAVIGANT CONSULTING, INC. 50
• Roth et al. 2002. Energy Consumption by Office and Telecommunications Equipment in Commercial Buildings, Volume I: Energy Consumption Baseline.
• Telecommunications Industry Association (TIA). 2009. ICT Market Review and Forecast, Chapter 3 - The Enterprise and Consumer Market.
• CBECS 2012 survey data on total workers by building type
REFERENCES » TRADITIONAL PBX

/ ©2017 LEIDOS INC. AND NAVIGANT CONSULTING, INC. 51
• Various manufacturer datasheets:- XR3000 Asterisk -
https://www.voipsupply.com/downloads/dl/file/id/15061/xorcom_xr3000_datasheet.pdf- QuadroM32x - https://www.abptech.com/sites/abptech/files/downloads/quadro_m32x.pdf- Talkaphone IP PBX - http://talkaphone.com/wp-content/uploads/2014/07/PBX-
IP_Cutsheet_Rev_1_1_07212014.pdf- Yeastar S-Series VoIP PBX -
http://www.yeastar.com/download/Yeastar_S_Series_VoIP_PBX_Datasheet_en.pdf- Cisco MCS 7835-I1 Unified Call Manager -
http://www.cisco.com/c/en/us/products/collateral/unified-communications/7800-series-media-convergence-servers/product_data_sheet0900aecd8057a6cc.html
• EIA. 2013. Analysis and Representation of Miscellaneous Electric Loads in NEMS.• Telecommunications Industry Association (TIA). 2009. ICT Market Review and
Forecast, Chapter 3 - The Enterprise and Consumer Market.• CBECS 2012 survey data on total workers by building type
REFERENCES » VOICE-OVER-IP

/ ©2017 LEIDOS INC. AND NAVIGANT CONSULTING, INC. 52
• CTIA Wireless Survey 2015. http://ctia.org/docs/default-source/default-document-library/ctia_survey_ye_2015_graphics.pdf?sfvrsn=0
• Deruyck, et al. Reducing the Power Consumption in Wireless Access Networks Overview and Recommendations. Progress In Electromagnetics Research, Vol. 132, 255–274, 2012. http://www.jpier.org/PIER/pier132/14.12061301.pdf
• Personal communication with Ken Schmidt from cell tower leasing company Steel in the Air. http://www.steelintheair.com/
• Imec Power Model for Wireless Base Stations. http://www.imec-int.com/en/powermodel
REFERENCES » CELLULAR AND PCS NETWORKS

/ ©2017 LEIDOS INC. AND NAVIGANT CONSULTING, INC. 53
• Baliga et al. 2011. Energy Consumption in Wired and Wireless Access Networks.• Cisco. 2016. The Zettabyte Era - Trends and Analysis.
http://www.cisco.com/c/en/us/solutions/collateral/service-provider/visual-networking-index-vni/vni-hyperconnectivity-wp.html.
• International Telecommunication Union (ITU). 2016. Global ICT Developments: Statistics. http://www.itu.int/en/ITU-D/Statistics/Pages/stat/default.aspx.
• Ishii et al. 2015. Unifying Top-Down and Bottom-Up Approaches to Evaluate Network Energy Consumption.
• Lange et al. 2011. Energy Consumption of Telecommunication Networks and Related Improvement Options.
• Van Heddeghem et al. 2014. ICT electricity consumption 2007-2012.
REFERENCES » ICT LONG-HAUL NETWORKS

/ ©2017 LEIDOS INC. AND NAVIGANT CONSULTING, INC. 54
• Baliga et al. 2011. Energy Consumption in Wired and Wireless Access Networks.• Federal Communications Commission (FCC). 2010. Internet Access Services,
Table 7.• Federal Communications Commission (FCC). 2016. Internet Access Services,
Figure 11.• Ishii et al. 2015. Unifying Top-Down and Bottom-Up Approaches to Evaluate
Network Energy Consumption.
REFERENCES » ICT ACCESS NETWORKS

/ ©2017 LEIDOS INC. AND NAVIGANT CONSULTING, INC. 55
• CBECS Microdata (see "CBECS Analysis" sheet for complete set of calculations)• Ecos April 2011 "Office Plug Load Field Monitoring Report" prepared for California
Energy Commission (CEC) • Energy Star Imaging Equipment Database• Arthur D. Little, Inc. “Energy Consumption by Office and• Telecommunications Equipment in Commercial Buildings,” January 2002
REFERENCES » COPIERS

/ ©2017 LEIDOS INC. AND NAVIGANT CONSULTING, INC. 56
• CBECS Microdata (see "CBECS Analysis" sheet for complete set of calculations)• Ecos April 2011 "Office Plug Load Field Monitoring Report" prepared for California
Energy Commission(CEC) • Energy Star Imaging Equipment Database• Energy Star Product Information
<https://www.energystar.gov/products/office_equipment/imaging_equipment>• Stanford Research Paper, "Inventory Plug Load Equipment and Assessing Plug
Load Reduction Solutions on a University Campus," October 2015 < http://sustainable.stanford.edu/sites/default/files/resource-attachments/Plug%20Load%20White%20Paper%20FINAL.pdf>
REFERENCES » SCANNERS

/ ©2017 LEIDOS INC. AND NAVIGANT CONSULTING, INC. 57
• CBECS Microdata (see "CBECS Analysis" sheet for complete set of calculations)• Ecos April 2011 "Office Plug Load Field Monitoring Report" prepared for California
Energy Commission(CEC) • Energy Star Imaging Equipment Database• Energy Star Product Information
<https://www.energystar.gov/products/office_equipment/imaging_equipment>• Stanford Research Paper, "Inventory Plug Load Equipment and Assessing Plug
Load Reduction Solutions on a University Campus," October 2015 < http://sustainable.stanford.edu/sites/default/files/resource-attachments/Plug%20Load%20White%20Paper%20FINAL.pdf>
REFERENCES » MFDs

/ ©2017 LEIDOS INC. AND NAVIGANT CONSULTING, INC. 58
• CBECS Microdata (see "CBECS Analysis" sheet for complete set of calculations)• Ecos April 2011 "Office Plug Load Field Monitoring Report" prepared for California
Energy Commission(CEC) • Energy Star Imaging Equipment Database• Energy Star Product Information
<https://www.energystar.gov/products/office_equipment/imaging_equipment>• Stanford Research Paper, "Inventory Plug Load Equipment and Assessing Plug
Load Reduction Solutions on a University Campus," October 2015 < http://sustainable.stanford.edu/sites/default/files/resource-attachments/Plug%20Load%20White%20Paper%20FINAL.pdf>
REFERENCES » FAX MACHINES

/ ©2017 LEIDOS INC. AND NAVIGANT CONSULTING, INC. 59
• CBECS Microdata (see "CBECS Analysis" sheet for complete set of calculations)• Ecos April 2011 "Office Plug Load Field Monitoring Report" prepared for California
Energy Commission(CEC) • Energy Star Imaging Equipment Database• Energy Star Product Information
<https://www.energystar.gov/products/office_equipment/imaging_equipment>• Stanford Research Paper, "Inventory Plug Load Equipment and Assessing Plug
Load Reduction Solutions on a University Campus," October 2015 < http://sustainable.stanford.edu/sites/default/files/resource-attachments/Plug%20Load%20White%20Paper%20FINAL.pdf>
REFERENCES » PRINTERS

/ ©2017 LEIDOS INC. AND NAVIGANT CONSULTING, INC. 60
• Global Institute of Sustainability: Energy Efficiency on an Urban Scale < http://www.hollisnh.org/reports/AuditReport_DPW_FINAL.pdf>
• CBECS Microdata (see "CBECS Analysis" sheet for complete set of calculations)• Commercial Energy Use Survey by Aspen Systems Corporation• Hollis Department of Public Works• NREL < http://www.nrel.gov/docs/fy14osti/60668.pdf>• Umwelt Bundesamt
<ttp://www.umweltbundesamt.de/sites/default/files/medien/379/dokumente/leitfaden_data_shredders_31032014.pdf>
REFERENCES » SHREDDERS

/ ©2017 LEIDOS INC. AND NAVIGANT CONSULTING, INC. 61
• Energy Star Database and Test Procedure Information • Frost and Sullivan's report for LBNL “Analysis of the US Power Quality Equipment
Market."• IBIS UPS Revenue and Demand Data; and UPS Growth Calculations• CBECS Commercial Data; And Building Type Split Calculation• CBECS Microdata (see "CBECS Analysis" sheet for complete set of calculations)• Tripp.Lite, “Tough Decision: On-Line or Line-Interactive UPS?”
REFERENCES » UPS