Embed Size (px)
Citation preview

Analysis and Testing of the 275 Dincel Wall
System for Stiffness, Shear & Flexural Capacities
By: A/Professor Shami Nejadi and Dr Harry Far of University of Technology
(UTS) Structural Engineering, School of Civil and Environmental Engineering Specialist Consultants
January 2021

Table of Contents
Acknowledgment ............................................................................................................................. 2
Executive Summary ......................................................................................................................... 3
Stiffness Report ................................................................................................................................ 8
Shear Report................................................................................................................................... 49
Flexural Report .............................................................................................................................. 70

2 | P a g e
Acknowledgement
The authors wish to acknowledge the valuable assistance of the following people in conducting
Finite element and structural analyses, designing test procedures and support systems, fabrication
and testing of specimens and reporting:
• Dr Mehdi Aghayarzadeh for structural analyses and reporting
• Mr Mehdi Habibaghahi and Mr Sepehr Faridmarandi for Finite Element Analyses and
design of supporting structures
• Mr Peter Brown and Mr Rami Haddad for overseeing and conducting the tests
• Tech Lab and the Structures Laboratory for the fabrication of test specimens and supporting
structures

3 | P a g e
Executive Summary The Dincel Structural Walling system comprises of permanent polymer formwork that uniquely
snaps together to build all types of structural walling in an efficient manner. When filled with ready
mix concrete, the polymer shell provides a strong and durable protective barrier for the concrete
infill of residential, commercial and civil walling applications. Dincel walling, which is offered in
varying thicknesses, has been used in Australia since the year 2000. The 200 Dincel Wall has been
tested during the years 2009-2011 at UTS, where it was demonstrated that the concrete filled
polymer encapsulation provides additional flexural capacity and confinement when compared with
conventional reinforced concrete walls.
The purpose of the below outlined tests is to demonstrate how 275 Dincel walls when filled with
concrete works as a composite structural wall member rather than only being considered as a
sacrificial permanent formwork for structural design purposes.
The composite action provided by 275 Dincel Wall as tested and verified by UTS in 2020 offers
significant improvements for concrete walls. Namely, some benefits include higher flexural
capacity, confinement of concrete, a high degree of ductility, ideal curing conditions (ongoing
hydration by permanent encapsulation resulting higher tensile and compressive strength of
concrete infill), longevity, reduction or elimination in steel bars usage leading to reduced carbon
foot print.
In a separate study, the University of New South Wales (UNSW) originally certified that the
concrete and steel reinforcement inside Dincel Walls comply with AS3600 (Concrete Structures
Code) and that the polymer encapsulation can be considered as formwork for reinforced concrete.
However, AS3600 has been established for reinforced concrete and is not directly intended for
composite members. The Australian National Construction Code (NCC) allows for design
engineers to adopt innovative approaches such as composite walling behaviour and can be
considered as a “Deemed to Satisfy” approach, provided that NCC clause A2.3 (2) (a) and/or (b)
are satisfied.
At the request of Dincel Pty Ltd and BarChip Pty Ltd, A/Prof Shami Nejadi and Dr Harry Far from
University of Technology (UTS) were engaged to test the 275 Dincel Wall in accordance with

4 | P a g e
AS3600 (2018) Appendix B, in order to provide design engineers with verified and tested
capacities for use as design input for the composite behaviour of 275 Dincel Wall.
The testing and analytical program was carried out from February 2020 to November 2020. The
testing is prepared and executed in accordance with the requirements of AS3600 (2018) Appendix
B consisting of the following:
1. Stiffness Testing (Part A)
Determination of ductility factors (μ) and flexural rigidity (EI) of 275 Dincel Wall. The
determined values can be utilised when designing 275 Dincel shear walls for high rise
buildings which are required to resist lateral loads such as earthquake and wind loads. The
test specimens consisted of:
• 3 x 275 Dincel specimens filled with plain concrete (fc’ = 40 MPa at 28 days)
• 3 x 275 Dincel specimens filled with plain concrete incorporating 5 kg/m3 of BarChip
48 macro-synthetics fibres (fc’ = 40 MPa at 28 days)
• 3 x 275 Dincel specimens filled with plain concrete (fc’ = 40 MPa at 28 days)
incorporating horizontal and vertical steel reinforcement bars at each face
2. Shear Testing (Part B);
Determination of the interface shear capacity of the walling system by testing the interface
between two 275 Dincel Wall profiles (panels). The test specimens consisted of:
• 3 x 275 Dincel specimens filled with plain concrete (fc’ = 40 MPa at 28 days)
• 3 x 275 Dincel specimens filled with plain concrete incorporating 5 kg/m3 of BarChip
48 macro-synthetics fibres (fc’ = 40 MPa at 28 days)
• 3 x 275 Dincel specimens filled with plain concrete (fc’ = 40 MPa at 28 days) with
horizontal steel reinforcement bars to provide dowel action

5 | P a g e
3. Flexural Testing (Part C);
Determination of the flexural capacity of 275 Dincel wall. The test specimens consisted of:
• 3 x 275 Dincel specimens filled with plain concrete, tested at 24 hours when
compressive strength was approximately 5 MPa (fc’ = 32 MPa at 28 days)
• 3 x 275 Dincel specimens filled with plain concrete incorporating 5 kg/m3 of BarChip
48 macro-synthetics fibres, tested at 24 hours when compressive strength was
approximately 5 MPa (fc’ = 32 MPa at 28 days)
• 3 x 275 Dincel specimens filled with plain concrete, tested at 28 days (fc’ = 32 MPa
at 28 days)
• 3 x 275 Dincel specimens filled with plain concrete incorporating 5 kg/m3 of BarChip
48 macro-synthetics fibres, tested at 28 days (fc’ = 32 MPa at 28 days)
• 3 x 275 Dincel specimens filled with plain concrete (fc’ = 32 MPa at 28 days)
incorporating vertical steel reinforcement bars, tested at 28 days.
Testing was completed in accordance with AS3600 (2018) Appendix B and the results
provided can be utilised by design engineers as the equivalent of a ‘deemed-to-satisfy’
solution of AS3600. AS3600 Appendix B requires a minimum of 2 samples to be tested
per condition, this testing regime adopted 3 tested samples per condition in order to
determine the mean average values.
• Stiffness Test (Part A):
o Results demonstrate a ductility factor ranging from 4-6 which is significantly above
the capabilities of conventional reinforced concrete. Such a system will prevent the
deterioration of stiffness and possible collapse by not allowing the concrete to spall
after several loading cycles even if fully cracked.
o The presence of 275 Dincel does not reduce the lateral stiffness in comparison to a
conventional concrete wall.
o The requirement to provide steel reinforcing bars to each face for a concrete wall
was primarily introduced in AS3600 (2018). Clause 14.6.1 requires such
reinforcement for ductility purposes during an earthquake (for limited ductile walls

6 | P a g e
which have a ductility factor of 2). Clause 11.5.2 requires such reinforcement when
compressive stresses in the wall exceeds 3 MPa, which is provided to keep
conventional brittle and non-ductile concrete walls under a low stress level. For
Dincel Walls, the designer may choose to reinforce an adequate length for shear
wall purposes only and the remaining walls can be left unreinforced (or reinforced
with synthetic fibres) due to the high ductility factors achieved. This way, a
progressive collapse during an earthquake is prevented due to the polymer
encapsulation of the unreinforced concrete wall subject to positive connections
(steel “L “bars at each face connecting to the slab) being provided at the top and
bottom of the walls.
• Shear Test (Part B)
o Within the investigation, it was found that the shear interface failure plane between
two Dincel panels/profiles is not flat, but rather consists of a series of dome/conical
shaped protrusions at web hole locations. The array of domes provides a keying
action throughout the section and subsequently this aids in achieving a higher shear
capacity to what is possible by calculation to AS3600 (2018) for the concrete bound
within the web holes alone.
• Flexural Testing (Part C) o Concrete Cured for 24 hours
275 Dincel formwork itself due to its unique webbing and perforated internal ring
provides significant bending capacity. It was determined within the tests that 275
Dincel walls can be backfilled 24 hours after concrete placement. The system due
to its lightweight, snap connections enables the product to be fast and
straightforward to install whilst also reducing skilled labour use. Backfilling
basement walls 24 hours after concrete infill will allow for early installation of
scaffolding for the construction of the super structure.

7 | P a g e
o Concrete Cured for 28 days
The polymer shell of 275 Dincel increases the flexural capacity in comparison to
what can be achieved with a conventional concrete wall of equivalent thickness.
This enables propped cantilever 275 Dincel basement walls spanning in a one-way
direction to be designed without the use of steel reinforcement bars, consisting of
either a mass concrete infill or mass concrete reinforced with macro synthetic
fibres, provided there are suitable steel bars connection at the top and bottom of the
walls.
• Other important conclusions include:
o For a typical building, most walls (i.e. 90%) are designed as non-shear walls which
only carry gravity loads. Such walls can include basement walls or super structure
walls. Where these walls are constructed from 275 Dincel they can be left
unreinforced or reinforced with 5 kg/m3 of BarChip macro synthetic fibres. The use
of steel reinforcement within construction:
Represents one of the most significant contributions of carbon emissions
amongst standard construction materials, requiring an increase in embodied
energy.
Imposes increased safety concerns during installation.
Requires increased time for installation.
Can lead to concrete cancer (concrete spalling due to steel corrosion) if
cracks are not prevented, if adequate concrete cover is not achieved or if
adequate compaction is not achieved which can ultimately lead to a
premature structural life. The panel joints of Dincel profiles, as tested by
CSIRO under 6m of water head pressure and confirmed by CSIRO as
waterproof, provides protection to such a failure. Furthermore, Dincel walls
which are unreinforced or reinforced with synthetic fibres eliminates the
potential for concrete cancer all together.

8 | P a g e
Technical Report
Evaluation of In-Plane Lateral Stiffness and Degree of Ductility 275
Dincel Structural Walling
Prepared by:
Dr Shami Nejadi Associate Professor in Structural Engineering, School of Civil and Environmental Engineering, Faculty of Engineering and Information Technology, University of Technology Sydney (UTS)
Dr Harry Far Senior Lecturer in Structural Engineering, School of Civil and Environmental Engineering, Faculty of Engineering and Information Technology, University of Technology Sydney (UTS)
Rev 03
14/01/2021

9 | P a g e
1.1 Introduction This study experimentally investigates the in-plane lateral stiffness and ductility of 275 Dincel
structural walling panels (composite Dincel Polymer encased concrete walls) subject to lateral loads
using pushover tests to determine lateral strength and ductility characteristics of the panels filled with
plain concrete, macro-synthetic fibre reinforced concrete, and steel reinforced concrete. Dincel
Polymer is re-engineered rigid PVC consisting of heavy metal free stabilisers, free of phthalates, with
test results demonstrating superior fire, smoke, toxicity and chemical resistance in comparison to
common PVC.
The procedure of evaluating the available ductility of walls is of importance to enable designers to
ensure that structures have adequate available ductility to satisfy the requirements. In addition,
Australian Standards including AS1170.4 (2007) and AS 3600 (2018) do not explicitly prescribe the
ductility factors for composite 275 Dincel structural walling panels. Therefore, in order to enable
structural designers to design 275 Dincel structural walling panels adequately, ductility factors for these
types of walls have been extracted from the test results, satisfying the requirements of AS3600 (2018)
– Appendix B for the three mentioned cases and proposed in Table 1 and Table 2 of this study for
practical applications.
1.2 Experimental Testing Program The experimental testing program has been carried out at the structural laboratory at University of
Technology Sydney (UTS). It involved the construction and testing of eighteen 275 Dincel structural
walling panel walls prepared as cantilever beams clamped at their end supports and subjected to a
concentrated lateral load at the top of the beams. In fact, for each concrete type, six wall specimens
(two specimens for each test) were tested for statistical analysis purposes. The base of each sample was
also restrained to provide fixed boundary conditions as close as practicable. The experimental tests
were conducted on specimens of 4000 mm long, 825 mm wide with 275 mm thickness. The test setup
is displayed in Figures 1-3. The specimens were composed of Dincel Polymer panels anchored at their
end and base supports and subjected to concentrated lateral loads by a hydraulic jack. As shown in
Figure 1, hydraulic jack (Enerpak 2MN) for applying the lateral load, was mounted 2.5 m away from
the end supports and the supports (i.e. base supports and end supports) were located 1 m apart from
each other (edge to edge). For each test, ten displacement sensors (five sensors for each wall specimen)

10 | P a g e
were used along the length of the walls (Figure 3) to capture the lateral deflection of each sample and
subsequently to determine the stiffness of individual specimens. The test setup and loading rates of the
tests were derived in a way that satisfy the requirements of AS3600 (2018) – Appendix B.
Sample 2 Sample 1
S1.1
S1.2
S1.3
S1.4
S1.5
S2.1
Base Support
0.82
m0.
82 m
0.82
m0.825 m 0.825 m
2.5
m
Hydraulic Jack
4 m
End Support
Steel Plate
S2.2
S2.3
S2.4
S2.5
1 m
Figure 1: Schematic diagram of pushover test setup (S illustrates sensors)
Figure 2: Non-linear static pushover test setup in experimental study
Hydraulic Jack (Enerpack 2 MN)
End Support
Sample 1 Sample 2

11 | P a g e
Figure 3: Base and end supports in 275 Dincel structural walling panels
1.3 Employed Materials
All eighteen 275 Dincel structural walling panels were prepared and poured with concrete having
compressive strength of 40 MPa at 28 days with 200mm slump and cured on site at UTS Tech Lab.
Cylinder testing for both tensile and compressive capacities were carried out by qualified UTS
staff for each specimen at the age of 28 days when the testing on the specimens was carried out.
The stay-in-place Dincel Polymer formwork system used in this study is known commercially as
275 Dincel structural walling panels. All Dincel panels were filled with three different concrete
specimens including plain concrete, BarChip 48 fibre reinforced concrete, and steel reinforced
concrete.
Figure 4 illustrates one Dincel Polymer encased wall with steel reinforcements made of three
275mm Dincel panels with overall dimensions of 825mm wide × 275 mm thickness. Three-
dimensional views of 275 mm Dincel structural walling panels are shown in Figure 5.
End SupportBase Support
Sensors

12 | P a g e
Figure 4: Front view of a Dincel Polymer encased wall with steel reinforcements
In addition, BarChip 48 synthetic fibre reinforcement (as shown in Figure 6) which is a high-
performance polypropylene fibre used as structural reinforcement in concrete was added to some
specimens. It works by distributing hundreds of thousands of high tensile strength fibres
throughout the entire concrete mix. BarChip 48 reinforces every part of the concrete structure,
front to back and top to bottom, leaving no vulnerable unreinforced concrete part.
Figure 5: Three-dimensional views of 275 mm Dincel structural walling panels

13 | P a g e
Figure 6. BarChip 48 macro-synthetic fibre concrete reinforcement
The Dincel panels were orientated horizontally when filled with concrete (due to lifting and
handling constraints). Even though a vertical orientation is preferred, adequate internal vibration
and a high concrete slump ensured that the concrete compaction within the formwork was
sufficient.
Figure 7. Placement and vibration of concrete within Dincel panels orientated horizontally
14 | P a g e
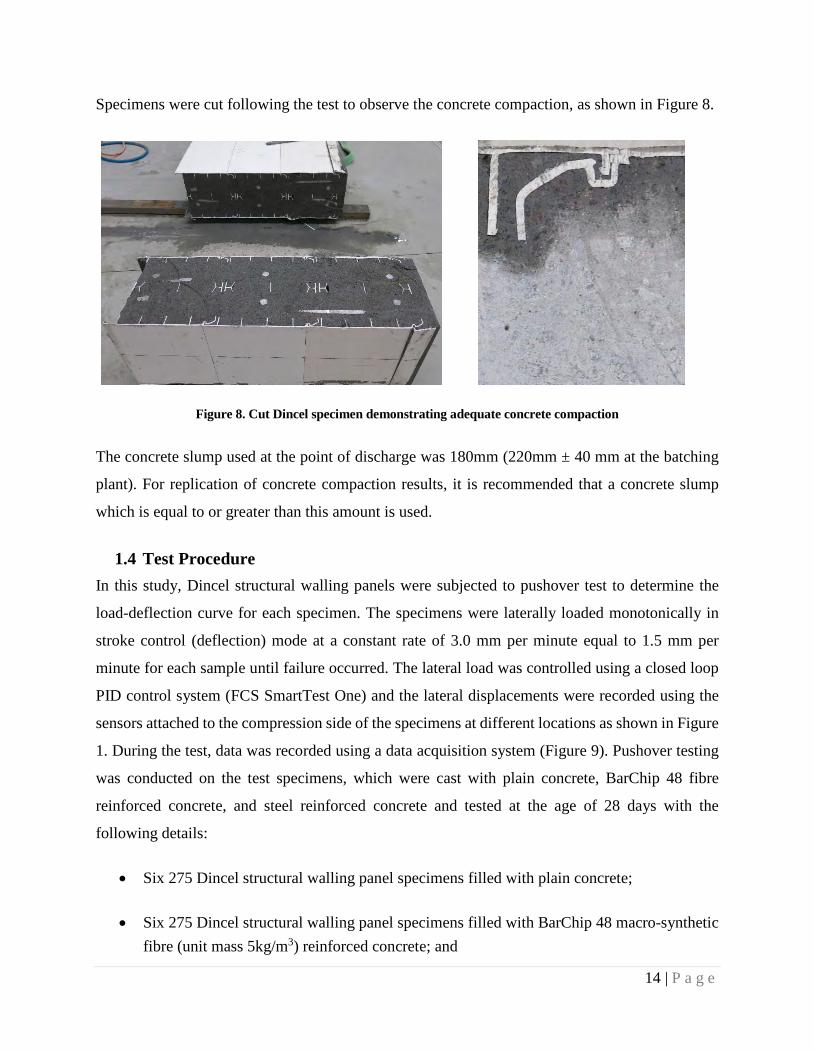
Specimens were cut following the test to observe the concrete compaction, as shown in Figure 8.
Figure 8. Cut Dincel specimen demonstrating adequate concrete compaction
The concrete slump used at the point of discharge was 180mm (220mm ± 40 mm at the batching
plant). For replication of concrete compaction results, it is recommended that a concrete slump
which is equal to or greater than this amount is used.
1.4 Test Procedure
In this study, Dincel structural walling panels were subjected to pushover test to determine the
load-deflection curve for each specimen. The specimens were laterally loaded monotonically in
stroke control (deflection) mode at a constant rate of 3.0 mm per minute equal to 1.5 mm per
minute for each sample until failure occurred. The lateral load was controlled using a closed loop
PID control system (FCS SmartTest One) and the lateral displacements were recorded using the
sensors attached to the compression side of the specimens at different locations as shown in Figure
1. During the test, data was recorded using a data acquisition system (Figure 9). Pushover testing
was conducted on the test specimens, which were cast with plain concrete, BarChip 48 fibre
reinforced concrete, and steel reinforced concrete and tested at the age of 28 days with the
following details:
• Six 275 Dincel structural walling panel specimens filled with plain concrete;
• Six 275 Dincel structural walling panel specimens filled with BarChip 48 macro-synthetic fibre (unit mass 5kg/m3) reinforced concrete; and

15 | P a g e
• Six 275 Dincel structural walling panel specimens filled with steel reinforced concrete (N20@275mm normal ductility class deformed reinforcing bars grade D500N according to AS3600-2018)
Figure 9: Data acquisition system used in the experimental study
Although the faces touching the base support had a slight curvature due to the fabrication of the
specimens, the faces at the load point were reasonably flat. To apply the load laterally on the wall,
a system was used at the load point consisting of a steel plate and a hydraulic jack. The steel plate
was 10 mm thick by 300 mm wide by 300 mm long. During loading, Sample 2 indicated less
movement at the end support compared to Sample 1 and consequently it led to less rotation. In
order to prevent rotation in some samples, they were reasonably packed tight at the end support
with packing plates to minimise looseness in the system during the test procedure. The quasi-static
test was stopped when the specimen was completely cracked at the base of the wall. The crack
pattern characterising the bending failure mode of sample 1 is illustrated in Figure 10 at maximum
top displacement.
During the test, bending cracks developed at the tensile side of the wall, then horizontally
propagated towards the centre line of the wall, and finally passed the centre line of the wall,
towards the compressive side. Crack lengths continued to increase with the imposed top
displacement. Prior to the bending failure of the wall, the bottom face of the wall was heavily
cracked, emphasising the strong penetration of the bending crack in the core wall.

16 | P a g e
Figure 10: Failure mode of the walls consisting of plain concrete infill under compressive lateral loads
Figure 11: Section of specimen consisting of plain concrete infill at failure plane

17 | P a g e
1.5 Results and Discussion The main focus of this study is the non-linear static (pushover) testing of composite Dincel
Polymer encased concrete walls (Dincel structural walling panels) based on the provisions for
seismic design of buildings to AS 1170.4 (2007). The average results of pushover tests for the
structural walls subjected to lateral loads, which capture the material non-linearity of the structures,
are presented in the form of load-deformation curves in Figures 12-14. As it can be seen in Figures
12-14, in all the conducted tests, Sample 2 exhibits less movement under the lateral load compared
to Sample 1. A more careful look at the results reveals that although all walls show similar response
patterns, Dincel Polymer encased concrete walls with steel reinforcements exhibit a considerable
increase in strength during the test. The ultimate strength of Sample 1 is improved by nearly three
times, from 72 kN and 75 kN for the plain and BarChip concrete specimens respectively to 228
kN for the steel reinforced concrete specimens. The enhancement in terms of ductility is also
clearly noticeable, with a shear failure at 100 mm and 80 mm (measured by top laser), for steel
reinforced and other specimens (plain and BarChip concrete), respectively. As a result, using steel
reinforcements appears to be effective for delaying the shear failure.

18 | P a g e
(a)
(b)
Figure 12: Average load-displacement curves measured by different sensors in composite Dincel Polymer encased walls filled with plain concrete for (a) Sample 1 (b) Sample 2

19 | P a g e
(a)
(b)
Figure 13: Average load-displacement curves measured by different sensors in composite Dincel Polymer encased walls filled with BarChip 48 concrete for (a) Sample 1 (b) Sample 2

20 | P a g e
(a)
(b)
Figure 14: Average load-displacement curves measured by different sensors in composite Dincel Polymer encased walls filled with steel reinforced concrete for (a) Sample 1 (b) Sample 2
Average results of non-linear static tests, measured by top sensors, on Dincel structural walling
systems filled with three different types of concrete are shown in Figure 15.

21 | P a g e
Figure 15: Average load-displacement curves measured by top sensors in Samples 1 and 2 for all specimens
As illustrated in Figure 15, the first stage of the load–displacement curve is very similar for both
steel and BarChip 48 reinforced concrete specimens up to the displacement equal to 4 mm. Indeed,
the initial stiffness remains almost unchanged by using reinforced concrete specimens. Using
BarChip 48 macro-synthetic fibre reinforced concrete turns out to be very efficient by improving
both strength and ductility compared to unreinforced concrete specimens. In addition, for BarChip
48 specimens, the failure becomes more ductile than plain concrete specimens for which
displacement increases at the constant load of 70 kN. For BarChip 48 specimens, it can be
remarked that the strength decrease is very progressive highlighting the ductility of the failure and
it can be understood that the Dincel Polymer encased walls filled with BarChip 48 could be pushed
to a higher level of displacement. However, filling Dincel panels with BarChip 48 concrete does
not provide a significant gain of ultimate strength in comparison to the plain concrete specimens.
From the capacity curves, the yield displacement and the maximum expected displacement (target
displacement) can be determined. In dynamic analysis of structures responding to a major
earthquake in the inelastic range, it is usual to express the maximum deformations or displacements
in terms of ductility factors, where the ductility factor (𝜇𝜇) is defined as the maximum deformation
(∆𝑢𝑢) divided by the corresponding deformation present when yielding occurs (∆𝑦𝑦). In fact, the use
of ductility factors permits the maximum deformations to be expressed in non-dimensional terms

22 | P a g e
as indices of inelastic deformation for seismic design and analysis. Various methods have been
presented by different studies to estimate the maximum and yield displacements based on the
pushover test results. The most commonly known methodology for the determination of ductility
values for reinforced concrete (not for composite materials) was introduced by “Park, R. 1988,
'Ductility evaluation from laboratory and analytical testing', Proceedings of the 9th world
Conference on Earthquake Engineering, Tokyo-Kyoto, Japan, pp. 605–16.” Within this study, the
recommendation proposed in Fig. 2d has been adopted as the basis of the ‘AS1170.4 Commentary
method’ for the calculation of ductility factors. The latest work (Refer to Appendix 1 of this report)
by J. C. Vielma, M. M. Mulder (16th World Conference on Earthquake Engineering, 16WCEE
2017, Santiago Chile, January 2017) demonstrates that the Park (1988) method is conservative for
Dincel Polymer Composite.
In this study, the tangent stiffness method (refer above references) has been adopted which
demonstrates very close agreement with the studies by J. C. Vielma, M. M. Mulder (Refer
Appendix 1). In the Tangent Stiffness Method, yield displacement is determined based on the
equivalent elasto-plastic curve with the same elastic stiffness and ultimate load as the real structure.
In addition, the maximum deformation is defined as the displacement corresponding to the peak
of the load-displacement curves. Average load-displacement curves, measured at the top laser, for
both Samples 1 and 2 are shown in Figures 16-18. As illustrated in Figures 16-18, the maximum
deformation (∆𝑢𝑢) measured for steel reinforced concrete specimens (120 mm) is three times the
deformations measured for plain and BarChip 48 specimens.

23 | P a g e
Figure 16: Finding yield and target displacements for 275 Dincel polymer encased reinforced concrete specimens
(Average of Samples 1 and 2)
Figure 17: Finding yield and target displacements for 275 Dincel polymer encased plain concrete specimens (average of Samples 1 and 2)
Sp = Fy / Fu Sp = 158 / 228 Sp = 0.69
μ = ∆𝑢𝑢 / ∆𝑦𝑦
μ = 120 / 20
μ = 6

24 | P a g e
Figure 18: Finding yield and target displacements for 275 Dincel polymer encased BarChip 48 concrete specimens (average of Samples 1 and 2)
According to Figures 16-18, ductility factor (𝜇𝜇) calculated for plain concrete walls is 4 (𝜇𝜇 = 4),
while this factor increases to 6 for BarChip 48 and steel reinforced concrete specimens. The
ductility factor required by AS 1170.4 (2007) may vary between 1 for elastically responding
structures to as high as 4 for fully ductile structures. In this way, all the 275 Dincel Polymer encased
plain concrete walls evaluated in this study can be categorised as fully ductile structures according
to Table 14.3 of AS3600 (2018), although 275 Dincel Polymer encased BarChip 48 specimens
exhibit more ductility which indicates a higher performance from BarChip synthetic fibre
reinforcements during lateral loading. In addition, structural performance factor (Sp) as an
additional ability of the total structure, including Dincel Polymer panels and concrete specimens,
for resisting earthquake motion can be determined based on AS 1170.4 (2007) and AS 3600 (2018).
According to Table 14.3 of AS 3600 (2018) for all concrete walls with fully ductile behaviour,
structural performance factor (Sp) can be considered equal to 0.67. Ductility factors (μ), structural
performance factors (Sp) and effective flexural rigidity (EI) of composite Dincel Polymer encased
concrete walls calculated in this study are summarised in Table 1 and Table 2.

25 | P a g e
Table 1: Ductility and stiffness parameters of composite 275 Dincel Polymer encased concrete walls
Specimen Ductility Factor
(𝜇𝜇)
Performance
Factor (𝑆𝑆𝑝𝑝)
Initial in-plane
lateral Stiffness
(𝐾𝐾𝑖𝑖)
(N/mm)
Effective in-
plane lateral
Stiffness (𝐾𝐾𝑒𝑒)
(N/mm)
Post-Yield
Stiffness (𝛼𝛼𝐾𝐾𝑒𝑒)
(N/mm)
275Dincel +
Steel
Reinforced
6 0.67 11000 6400 1100
275Dincel +
BarChip
Concrete
6 0.67 10000 5300 300
275Dincel +
Plain Concrete 4 0.67 8000 4800 120

26 | P a g e
Note: The following equations have been used in calculation of the parameters shown in
Table 1:
EI: Flexural Rigidity
𝑎𝑎 = 1000 𝑚𝑚𝑚𝑚
𝑏𝑏 = 2500 𝑚𝑚𝑚𝑚
𝑥𝑥 = 0.0 𝑡𝑡𝑡𝑡 3500 𝑚𝑚𝑚𝑚
Initial Stiffness:
𝑘𝑘𝑖𝑖 =𝑃𝑃∆
= (𝐸𝐸𝐸𝐸)𝑖𝑖
[(𝑎𝑎 + 𝑏𝑏) �𝑥𝑥2
2 � −𝑥𝑥36 − 3𝑎𝑎3 + 4𝑏𝑏𝑎𝑎2
6 + 𝑎𝑎36 − 7
6 𝑏𝑏𝑎𝑎2]
Effective Stiffness:
𝑘𝑘𝑒𝑒 =𝑃𝑃∆
= (𝐸𝐸𝐸𝐸)𝑒𝑒𝑒𝑒𝑒𝑒
[(𝑎𝑎 + 𝑏𝑏) �𝑥𝑥2
2 � −𝑥𝑥36 − 3𝑎𝑎3 + 4𝑏𝑏𝑎𝑎2
6 + 𝑎𝑎36 − 7
6 𝑏𝑏𝑎𝑎2]
The Effective Flexural Rigidity (EI) values for plain concrete, BarChip concrete and steel
reinforced concrete have been determined in accordance with AS3600 Appendix B, using the test
results and are shown in Table 2. The rigidity values for a 270mm conventionally reinforced
concrete wall (with the same concrete grade, width and steel reinforcement as the test specimen)
have also been provided for comparison purposes.
a b
𝑥𝑥
P
27 | P a g e
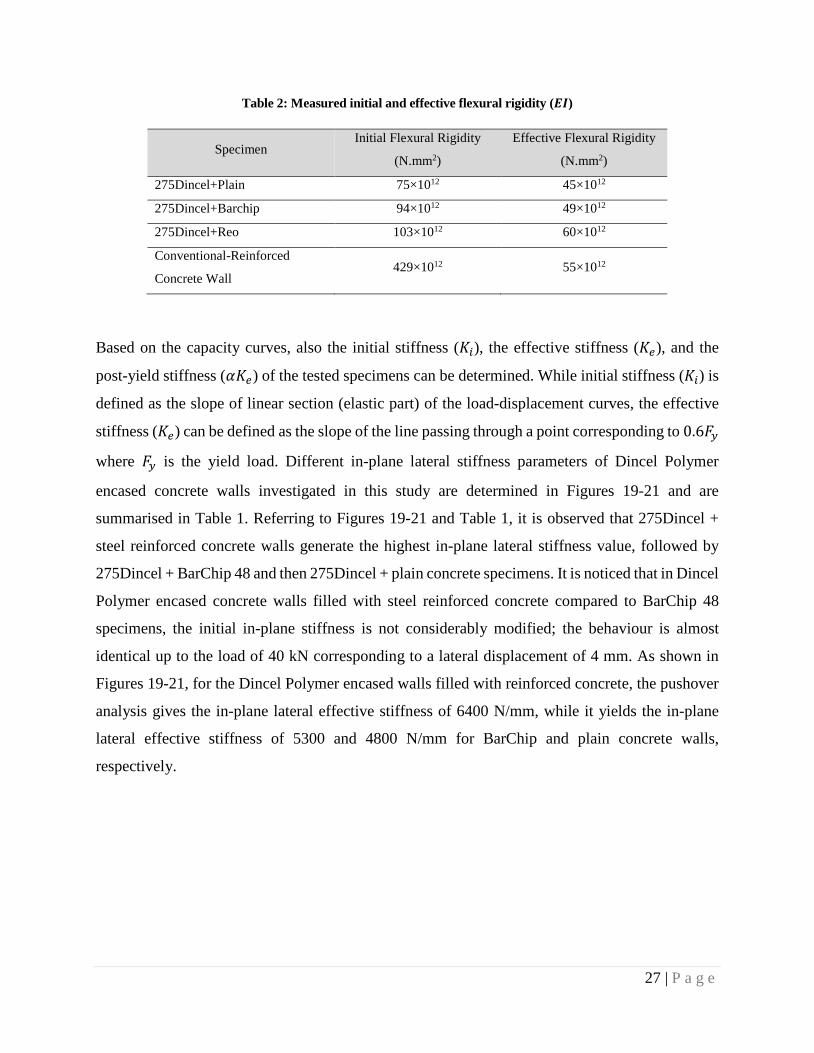
Table 2: Measured initial and effective flexural rigidity (𝑬𝑬𝑬𝑬)
Specimen Initial Flexural Rigidity
(N.mm2)
Effective Flexural Rigidity
(N.mm2)
275Dincel+Plain 75×1012 45×1012
275Dincel+Barchip 94×1012 49×1012
275Dincel+Reo 103×1012 60×1012
Conventional-Reinforced
Concrete Wall 429×1012 55×1012
Based on the capacity curves, also the initial stiffness (𝐾𝐾𝑖𝑖), the effective stiffness (𝐾𝐾𝑒𝑒), and the
post-yield stiffness (𝛼𝛼𝐾𝐾𝑒𝑒) of the tested specimens can be determined. While initial stiffness (𝐾𝐾𝑖𝑖) is
defined as the slope of linear section (elastic part) of the load-displacement curves, the effective
stiffness (𝐾𝐾𝑒𝑒) can be defined as the slope of the line passing through a point corresponding to 0.6𝐹𝐹𝑦𝑦
where 𝐹𝐹𝑦𝑦 is the yield load. Different in-plane lateral stiffness parameters of Dincel Polymer
encased concrete walls investigated in this study are determined in Figures 19-21 and are
summarised in Table 1. Referring to Figures 19-21 and Table 1, it is observed that 275Dincel +
steel reinforced concrete walls generate the highest in-plane lateral stiffness value, followed by
275Dincel + BarChip 48 and then 275Dincel + plain concrete specimens. It is noticed that in Dincel
Polymer encased concrete walls filled with steel reinforced concrete compared to BarChip 48
specimens, the initial in-plane stiffness is not considerably modified; the behaviour is almost
identical up to the load of 40 kN corresponding to a lateral displacement of 4 mm. As shown in
Figures 19-21, for the Dincel Polymer encased walls filled with reinforced concrete, the pushover
analysis gives the in-plane lateral effective stiffness of 6400 N/mm, while it yields the in-plane
lateral effective stiffness of 5300 and 4800 N/mm for BarChip and plain concrete walls,
respectively.

28 | P a g e
Figure 19: Finding lateral stiffness values for 275 Dincel encased reinforced concrete specimens (average of Samples 1 and 2)
Figure 20. Finding lateral stiffness values for 275 Dincel encased BarChip 48 concrete specimens (average of Samples 1 and 2)

29 | P a g e
Figure 21: Finding lateral stiffness values for 275 Dincel encased plain concrete specimens (average of Samples 1 and 2)
1.6 Numerical Analysis and Verification of the Results
In order to verify and prove consistency of the calculated values with measured test results, we
have conducted a nonlinear static analysis of composite Dincel polymer encased concrete wall
based on the experimental tests. A finite element software (ATENA-GiD) has been used to
determine the behaviour of structure under lateral load at the University of Technology Sydney
(UTS).
This analysis simulated the structural behaviour of Dincel Wall under lateral load. For this
modelling program, two cantilever beams subjected to concentrated lateral load at the top of the
beams. The base of the beams was also restrained, so the boundary conditions are considered fixed.
The fracture-plastic model combines constitutive models for tensile (fracturing) and compressive
(plastic) behaviour. The fracture model is based on the classical orthotropic smeared crack
formulation and crack band model. It employs Rankine failure criterion, exponential softening,
and it can be used as rotated or fixed crack model.

30 | P a g e
• Geometry
The geometry is created by using the ATENA-GiD graphical tools from elementary objects
sequentially, starting from points, lines and finally surfaces and volumes. By means of lines,
surfaces can be made, and using surfaces, volumes can be formed (solid objects). Details of this
input shall be skipped since it belongs to standard GiD functions. In GiD, it is also possible to
create volumes directly from step file format from other FEM software such as ABAQUS, as
shown in Figure 22, which indicates the complex geometry of Dincel formwork which created by
using SolidWorks mechanical software. The final geometrical models in GiD are shown in Figures
23 and 24 containing two types of objects: 3D volumes for concrete, plate, Dincel formwork, and
1D lines for discrete reinforcement bars respectively.
Figure 22: The geometry of Dincel 275 mm walling panel in GiD environment
• Material
The materials can be defined and assigned to the geometry. Since we intend to model the Dincel
polymer formwork, we defined them in separate sections.
• Concept of Material Model for Concrete
The material model for concrete includes the following effects of concrete behaviour:
• Nonlinear behaviour in compression including hardening and softening,

31 | P a g e
• Fracture of concrete in tension based on the nonlinear fracture mechanics,
• Biaxial strength failure criterion,
• Reduction of compressive strength after cracking,
• Tension stiffening effect,
• Reduction of the shear stiffness after cracking (variable shear retention),
• Two crack models: fixed crack direction and rotated crack direction.
A perfect bond between concrete and reinforcement is assumed within the smeared concept. No
bond-slip can be directly modelled except for the one included inherently in the tension stiffening.
The reinforcement in both forms, smeared and discrete, is in the uniaxial stress state and its
constitutive law is a multi-linear stress-strain diagram.
• Reinforcement
Reinforcement can be modelled in two distinct forms; discrete and smeared. In this case, discrete
reinforcement is in the form of reinforcing bars is modelled by truss elements.
The longitudinal reinforcement is by bars 2N20 at 275 mm, and by stirrups N12 with spacing 150
mm in beams. Since there are different possibilities to model reinforced concrete, firstly a decision
was made about the modelling approach. Concrete was modelled as 3D brick elements. For this,
we chose the hexahedra elements. The longitudinal reinforcement was modelled as discrete bars.
The stirrups were modelled as a smeared reinforcement within the reinforced concrete composite
material. This is a simplified method, in which we avoid the input of detail geometry of stirrups.
In the smeared model, individual stirrups' exact position is not captured, and only their average
effect is taken into account.
• BarChip 48
Table 3 shows the characteristics of Barchip 48 fibre reinforcement used in the analysis. For
modelling the FRC BarChips, the issue is to find the appropriate input material parameters to
successfully model FRC. In particular, the tensile parameters that are important for FRC must be
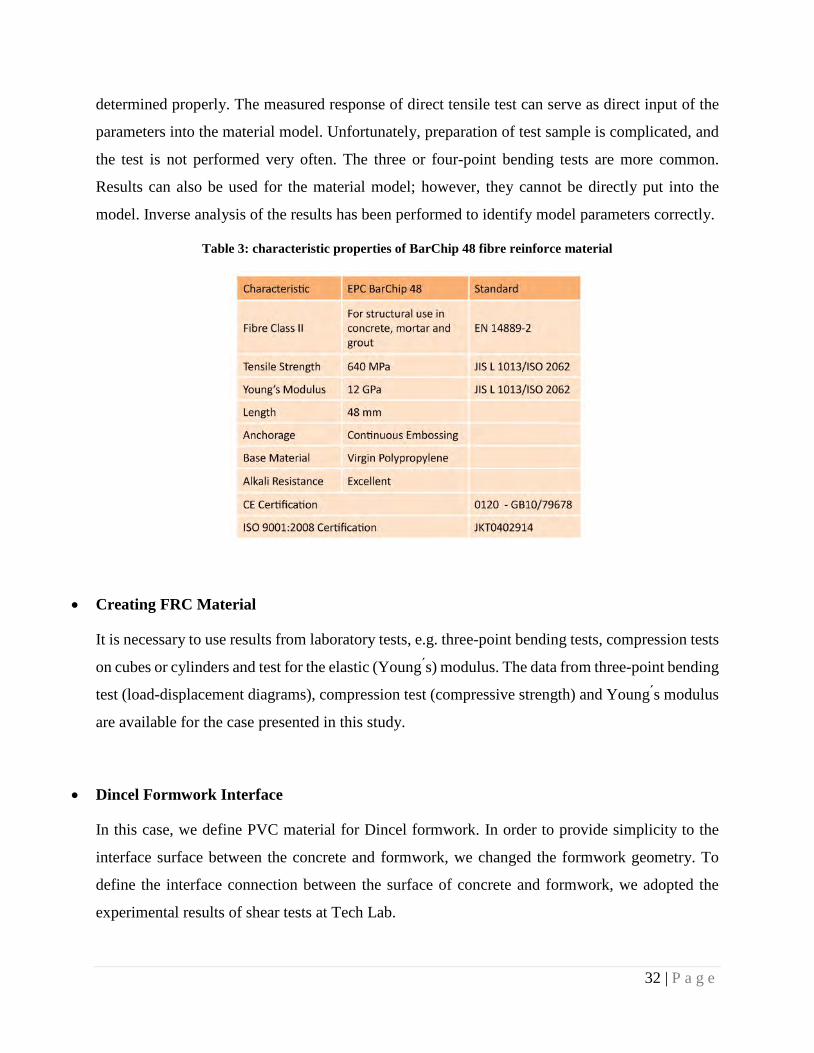
32 | P a g e
determined properly. The measured response of direct tensile test can serve as direct input of the
parameters into the material model. Unfortunately, preparation of test sample is complicated, and
the test is not performed very often. The three or four-point bending tests are more common.
Results can also be used for the material model; however, they cannot be directly put into the
model. Inverse analysis of the results has been performed to identify model parameters correctly.
Table 3: characteristic properties of BarChip 48 fibre reinforce material
• Creating FRC Material
It is necessary to use results from laboratory tests, e.g. three-point bending tests, compression tests
on cubes or cylinders and test for the elastic (Young ́s) modulus. The data from three-point bending
test (load-displacement diagrams), compression test (compressive strength) and Young ́s modulus
are available for the case presented in this study.
• Dincel Formwork Interface
In this case, we define PVC material for Dincel formwork. In order to provide simplicity to the
interface surface between the concrete and formwork, we changed the formwork geometry. To
define the interface connection between the surface of concrete and formwork, we adopted the
experimental results of shear tests at Tech Lab.

33 | P a g e
Besides, the interface effects between concrete materials and Dincel Polymer are applied as
interface surfaces in GiD.
Figure 23: Defining different materials for specimens
Figure 24: Defining different materials and reinforcement bars positions
• Supports and Loading
The supports and loading can be specified using three elastic plates. We define the fixed nodes by
checking X, Y, Z Constrains. Also, we assigned the Point-displacement at the node of the load
application. The load is applied as a vertical imposed displacement. Consequently, the force value
is a reaction at this node.

34 | P a g e
Figure 25: Assigning load point and support boundary conditions
• Meshing
In the preceding description, the geometry was defined, and all properties (material, supports,
loading) were assigned to the geometry. In this case, we use a simple method, in which divisions
on all lines are defined. If opposite lines have the same division, we can create a regular mesh.
Figure 26: Mesh settings for specimens in pre-processing software
• Results and Discussion
The objective of this simulation is the nonlinear static analysis of composite Dincel polymer
encased concrete wall based on the experimental tests conducted at UTS Tech Lab. The numerical
results of this modelling are presented in the form of load-deformation curves in the following
figures. Comparing the results by 3D FEM structural analysis and three different experimental
tests, a good correlation was found.
35 | P a g e
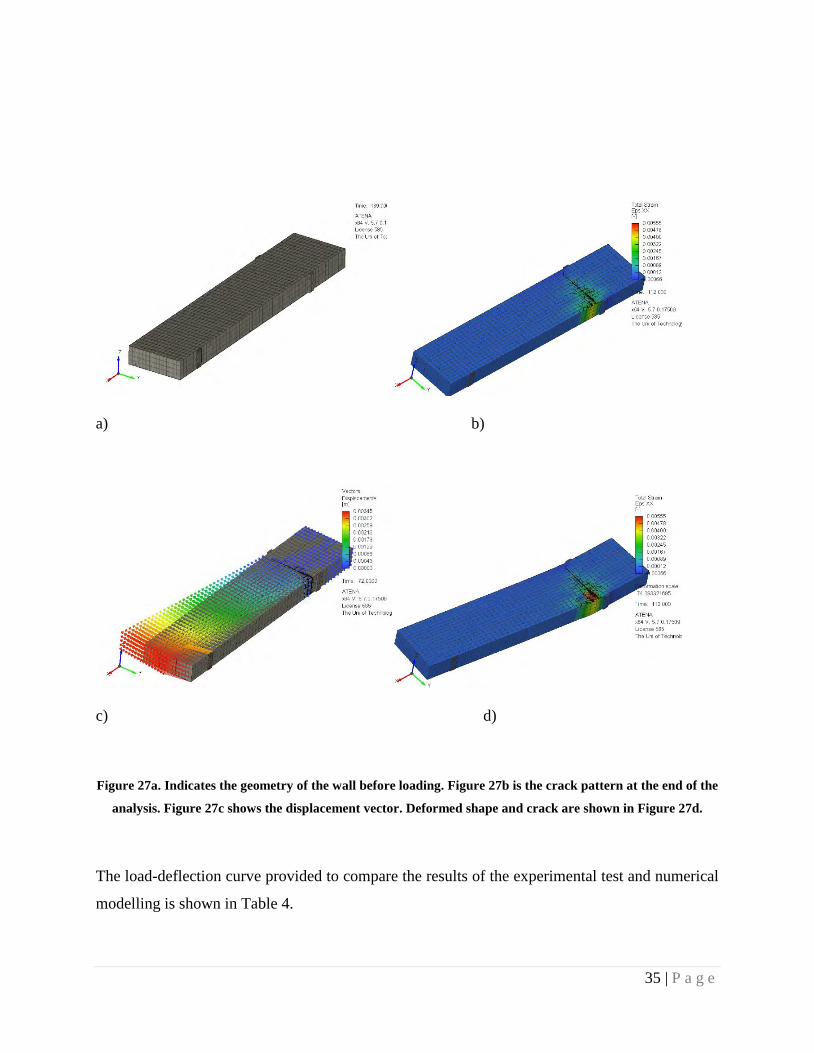
a) b)
c) d)
Figure 27a. Indicates the geometry of the wall before loading. Figure 27b is the crack pattern at the end of the
analysis. Figure 27c shows the displacement vector. Deformed shape and crack are shown in Figure 27d.
The load-deflection curve provided to compare the results of the experimental test and numerical
modelling is shown in Table 4.

36 | P a g e
Table 4: Comparison of the experimental values and calculated values using numerical modelling of initial
and effective flexural rigidity (EI)
Specimen Initial Flexural Rigidity
Initial Flexural Rigidity
Calculated
Effective Flexural Rigidity
Effective Flexural Rigidity
Calculated
275Dincel + Plain Concrete
75 x 10^12 70 x 10^12 45 x 10^12 48 x 10^12
275Dincel + BarChip
Concrete 94 x 10^12 90 x 10^12 49 x 10^12 52 x 10^12
275Dincel + Steel Reinforced
103 x 10^12 98 x 10^12 60 x 10^12 63 x 10^12
Conventional Concrete Wall
429 x 10^12 426 x 10^12 55 x 10^12 53 x 10^12
Figure 28: Load-deflection curve to compare the lateral stiffness values for 275 Dincel Polymer encased plain
concrete specimens by both experiment and FEM analysis

37 | P a g e
Figure 29: Load-deflection curve to compare the lateral stiffness values for 275 Dincel encased BarChip
concrete specimens by both experiment and FEM analysis
Figure 30: Load-deflection curve to compare the lateral stiffness values for 275 Dincel encased reinforced
concrete specimens by both experiment and FEM analysis

38 | P a g e
Figure 31: Load-deflection curve for conventional 270 mm thick reinforced wall (without 275 Dincel)
subjected to lateral load by FEM analysis.
In this section, the in-plane lateral stiffness and ductility of composite Dincel Polymer encased
concrete walls subjected to the lateral loads for composite Dincel Polymer encased wall filled
with conventional plain concrete, macro-synthetic fibre reinforced concrete, and steel-reinforced
concrete have been investigated and compared for both experimental and numerical analysis.
From the results of this investigation, it has become apparent that the FE model fairly well
captured the tendency of the experimental load-displacement curve.
1.7 Conclusions In this study, the in-plane lateral stiffness and ductility of composite Dincel Polymer encased
concrete walls subjected to the lateral loads for composite Dincel Polymer encased walls filled
with conventional plain concrete, BarChip macro-synthetic fibre reinforced concrete, and steel
reinforced concrete have been investigated. The conclusion that can be drawn from the obtained
results is that all composite Dincel Polymer encased walls can be designed as fully ductile
structures (𝜇𝜇 = 4) in accordance with Table 14.3 of AS3600 (2018), although higher performance
of reinforced concrete and BarChip 48 fibre reinforcements increased the ductility factors of the

39 | P a g e
walls to 6.0. For 275 Dincel + steel reinforced concrete walls, the pushover analysis indicated a
target displacement of 120 mm, while it yields the maximum displacement of 40 and 42 mm for
the 275Dincel + plain concrete and 275Dincel+BarChip 48 concrete, respectively. In addition, in
case of using 275Dincel + BarChip 48 macro-synthetic fibre reinforced concrete, the initial and
effective in-plane lateral stiffness values of the walls were clearly enhanced by 25% and 10%,
respectively, compared to 275 Dincel + plain concrete.
The procedure of evaluating the available ductility of walls is of importance to enable designers to
ensure that structures have adequate available ductility to satisfy the required ductility. Therefore,
in order to enable structural designers to design composite Dincel Polymer encased concrete walls
adequately, ductility factors for this type of walls have been extracted from the test results
The structural engineer can adopt the following for the three mentioned cases;
• Design parameters as shown in Table 1 and Table 2.
• For seismic and wind analysis, engineers can adopt that a 275 Dincel Wall is the equivalent
of a 270mm thick concrete wall, incorporating the Effective Flexural Rigidity (EI) provided
in Table 2.
• The effective flexural rigidity (EI) value for 275Dincel + steel reinforced concrete as per
Table 2 is: 60 × 1012 N.mm2 as determined by the tests and in accordance with AS3600
Appendix B. For comparison purposes, the effective flexural rigidity (EI) value of 270 mm
thick conventional concrete with equivalent steel reinforcement is 55 × 1012 N.mm2, which
is calculated by FEM as illustrated in Figure 31. A comparison between the effective
flexural rigidity (EI) of 275 Dincel + steel reinforced concrete (EI= 𝟔𝟔𝟔𝟔 × 𝟏𝟏𝟔𝟔𝟏𝟏𝟏𝟏 N.mm2)
and 270 mm thick conventional reinforced concrete (EI= 𝟓𝟓𝟓𝟓 × 𝟏𝟏𝟔𝟔𝟏𝟏𝟏𝟏 N.mm2)
demonstrates that polymer encapsulation provided by Dincel permanent formwork
does not reduce lateral stiffness of the conventional reinforced concrete wall with
equivalent width, concrete thickness, concrete grade and steel reinforcement use. In
fact, the confinement by 275 Dincel provides a slight increase in the effective flexural
rigidity (EI). The design engineer may also consider that Dincel polymer encapsulation,
unlike conventional removable formwork, prevents rapid evaporation of the water from the
wet concrete. The availability of moisture trapped by Dincel polymer encapsulation
40 | P a g e
promotes an ongoing hydration process of concrete which results in air and water voids
available in the wet concrete being filled with a by-product of cement hydration. This
autogenous healing process ensures a denser concrete and in turn provides a higher concrete
compressive and tensile strength. In time the concrete strength, and associated effective
flexural rigidity (EI), will be higher than the test results which is only based upon 28-day
strength.
The findings from this report also correlate with previous earthquake testing carried out by UTS
for 200 Dincel. Readers are encouraged to read the report “Analyses and Testing of Dincel Wall
System Subjected to Severe Earthquake Loads” by UTS for 200 Dincel which can be accessed
here – download. 275 Dincel is significantly upgraded from 200 Dincel as it incorporates a
perforated inner tube which provides extra tensile capacity and robustness in comparison to 200
Dincel. The UTS report dated 2011 concluded that “both plain concrete and Dincel Wall have
similar lateral stiffness and that the polymer encapsulation of Dincel Wall does not reduce the
lateral stiffness of the system”.
1.8 Design Certification in Accordance with AS3600 – 2018 275 Dincel Walls when designed by a structural engineer using the information provided in this
report will satisfy the deemed-to-satisfy provisions of the National Construction Code for
structural design. In accordance with test results shown in this report as per Appendix B of AS3600
– 2018, A/Professor Shami Nejadi as the Chief Investigator on behalf of UTS (in his capacity)
confirms that 275 Dincel Structural Walling panels filled with mass concrete (with or without steel
reinforcement) or filled with concrete containing BarChip 48 macro-synthetic fibres (with or
without steel reinforcement), complies with AS3600–2018. A structural engineer may adopt the
values shown in Table 1 and Table 2 of this report for design purposes.
A/Professor Shami Nejadi: Date: 14/01/2021

41 | P a g e
Appendix 1 – Calculation and Comparison of the Ductility Factor with other Methods
To verify the validity of the calculated ductility factors using the Elastic Stiffness, implemented
the proposed method by J. C. Vielma, M. M. Mulder (16th World Conference on Earthquake
Engineering, 16WCEE 2017, Santiago Chile, January 2017), the AS1170.4 Commentary Method
is implemented and the results are compared.
1.1 Method by J. C. Vielma, M. M. Mulder
This method is based on non-linear analysis by determining of the shear for which ultimate
rotation capacity in the extremes of the beams and the inferior extremes of the columns of any
level are achieved as shown in Figure A1.1.The Maximum Rotation (θv), corresponding
Displacement, Maximum Shear (Vmax) and Pivot Point which are referred in the Fig.3 of the J.
C. Vielma, M. M. Mulder method from raw test data and has compared the outcome with the
previously released values based on the Tangent Stiffness Method (which is Park 1988-Fig.2b).
It was determined that for this type of composite material they are practically the same,
as shown in below load-displacement diagrams.
.
Figure A1.1 Ultimate Rotation and Pivot Point defined in the Proposed Model

42 | P a g e
One of the advantages of this method is that the values of displacement ductility are regardless of
the structural type, failure mode or even the structural irregularities.
According to the test setup shown in Figure A1.2, the base shear for which ultimate rotation
capacity and the corresponding maximum shear for each sample of the different types of concrete
have been determined and presented in Table A1.1.
Figure A1.2 Test setup and idealized structure
Table A1.1 Ultimate rotation capacity and the corresponding shear
Note: In the below figures, the red line represents the tangent stiffness method and the green line represents the method proposed by J. C. Vielma, M. M. Mulder.
Θmax Vmax (KN) Θmax Vmax (KN) Θmax Vmax (KN) Θmax Vmax (KN)Average
Plain Concrete 1.09 66.68 1.52 71.52 1.32 67.71.36 64.98
Sample - 1 Sample - 2 Sample - 3
2.2 76.68
2.81 225.101
2.42 73.12 1.02 65.5
2.05 2.7 224.15
1.88 71.8BarChip Concrete
Reinforced Concrete 226.12 3.15 221.22
Specimen

43 | P a g e
Finding the Yield and Ultimate Displacements for the Reinforced Concrete specimens:
Finding the Yield and Ultimate Displacements for the BarChip Concrete specimens:
Δy = 19.5 mm Δu = 122 mm
Fu=224.2 KN

44 | P a g e
Finding the Yield and Ultimate Displacements for the Plain Concrete specimens:
1.2 AS1170.4 Commentary Method for 275 Dincel Reinforced with Steel Bars
The AS1170.4 Commentary Method is a generic method for calculating the ductility factor by
assuming that the yield point occurs at Sp x Fu, where Sp is as per Table 6.5 (A) of AS1170.4.
This table refers to a Sp value of 0.77 for limited ductile shear walls or 0.67 for moderately/fully
ductile shear walls. For Dincel 275 walls, the Sp value has been determined as 0.69 as extracted
from the test data. Sp is equal to Fu / Fy = 228 / 158 = 0.69.

45 | P a g e
The calculated values by means of different methods are presented in Table A1.2 for comparison purpose.
Table A1.2 Comparison of the ductility factor calculated different methods
Obviously, recommendation of the AS1170.4 commentary method, naturally does not take into
account the above-mentioned topics such as composite behaviour, confinement effect and most
importantly the presence of axial compression on the cross sections. These all influence the crack
formation function, so to use Park (1988) and/or the AS1170.4 commentary method is not
appropriate for determining the ductility factors of the reinforced Dincel composite section. On
this basis it can therefore be stated that method of Park (1988) is not considered appropriate to
apply to reinforced Dincel composite section. The confinement is provided by the presence of
Dincel polymer encapsulation, it is therefore only logical to assume that Dincel 275 as a reinforced
composite member will naturally display better ductility than the equivalent reinforced concrete
section. This behaviour already proven in the 2011 Earthquake tests carried out for 200 Dincel.
Fu (KN) Fy (KN) Δu / Δy Θmax Vmax (KN) Δu / Δy Fu (KN) Fy (KN) Δu / ΔySpecimen
Reinforced Concrete
BarChip Concrete
Plain Concrete
Tangent Stiffness Method
75 45 6
Method of AS1170.4 Commentary
228 158 6 2.7 224.2 6.2 228 158 2.4
Method by J. Vielma & M. Mulder
2.3
72 4 1.3 67.7
1.9 71.8 6.3 75 45
4.3 72 2.3

46 | P a g e
Remarks
The test has demonstrated that methods which are applicable to Reinforced Concrete structures are
not entirely compatible with the structures that are made by Composite Materials.
The UTS flexural tests has illustrated that 275 Dincel encapsulated reinforced concrete
demonstrates a superior composite section behaviour and implementing of Park (1988) Method
will yield over conservative results. The difference (compared to conventional concrete) is addition
of 275 profile.
This study reveals that because of the dissipation of large amounts of energy by Composite
Polymer Encapsulated Concrete, the Elastic Stiffness Method and the Proposed Method by J. C.
Vielma, M. M. Mulder are capable to simulate the real behaviour of these particular type of
composite structure.
In addition, the Confinement Effect on the compressed zone of the cross section and absence of
Axial Loads which delay the cracking, should be taken into account.
All methodologies as analysed above confirm that Dincel 275 walls will qualify as at least ‘limited
ductile’, which demonstrates that Dincel 275 walls can be used safely within existing design
practices.
47 | P a g e
Appendix 2 - Testing and Analyses of Dincel Wall System Subjected to Severe Earthquake Loads
UTS has previously conducted comprehensive earthquake testing in 2011 with 200 Dincel,
consisting of a shake table test and full-scale push over test.
Readers are encouraged to read the report “Analyses and Testing of Dincel Wall System Subjected
to Severe Earthquake Loads” by UTS for 200 Dincel which can be accessed here – download.
275 Dincel is an improved version of 200 Dincel which is 75 mm thicker in the out of plane
direction and incorporates a perforated internal ring, which supports the external faces against wet
concrete pressure during concrete placement. 275 Dincel has been designed to handle the potential
damages that can occur during transportation and installation, can accommodate a high concrete
slump within a single concrete pour up to 4.5m height (without concrete aggregate segregation),
is capable in handling the concrete pressures from vigorous vibrator use, and provides a much
higher bending capacity in comparison to 200 Dincel.
For the shake table tests, the significant ground motion records of the 1995 Kobe earthquake and
the 1940 El Centro, California earthquake were used as inputs in order to represent large magnitude
near field and far field earthquakes, respectively. The shake table tests clearly demonstrated the
strength of the unreinforced 200 Dincel wall specimen withstanding typical large magnitude
earthquakes. However, due to the much larger relative stiffness of these wall specimens compared
to those used in multi-storey buildings as part of the shear wall system, the resulting inter-storey
drifts were well below those demanded by large earthquakes and hence it was decided to subject
these walls to push over tests to confirm their adequacy in providing the required displacement
demand of 5.3 mm arrived at by Finite element analysis of a typical 7 storey concrete building
with shear walls as its lateral load resisting system.
An advantage of the Dincel Wall system is the provision of sound confinement to the concrete by
the cellular polymer encapsulation which incorporates the outer skin as well as the integral internal
webs. Such a system will prevent the deterioration of stiffness and possible collapse by not
allowing the concrete to spall after several loading cycles even if fully cracked.

48 | P a g e
The findings of this UTS report dated 2011 conclusions include:
• The comparisons of the results conclude that “both plain concrete and Dincel Wall have
similar lateral stiffness and that the polymer encapsulation of Dincel Wall does not reduce
the lateral stiffness of the system”
• “Conventional concrete structures are considered to be in the collapse range when
displacement levels exceed 2.5%. The tests demonstrated that Dincel sample safely
withstood 4.4% displacement level. This performance level will be particularly important
to strengthen existing buildings and building structures which require post disaster
functioning. This performance is not achievable with conventional materials when
displacement levels exceed 2.5%.
• When an adequate length of Dincel Wall, reinforced as a shear wall, the Dincel Wall is
capable of addressing the structural safety required to protect human life in damaging
earthquakes with magnitude up to 9.0 on the Richter scale.”
“These tests proved to be very conclusive in demonstrating the capacity of unreinforced Dincel
system in sustaining larger deformations caused by major earthquakes.” (Quoted from page 7
of 2011 report).
Based on the flexural strength, shear strength and stiffness test results included in this report
for 275 Dincel, it appears that 275 Dincel could potentially exhibit more resistance against
earthquake/wind loadings in comparison to 200 Dincel.
Remarks
It is understood that designing buildings as fully ductile walls require special detailing and the
design may be too onerous as many Australian engineers may not be familiar with NZ and
other international codes. In these cases, limited ductile wall design can simply be adopted by
Australian design engineers for Dincel 275 walls.

49 | P a g e
Technical Report
Evaluation of Interface Shear Strength of 275 Dincel Structural Walling
Prepared by:
Dr Shami Nejadi Associate Professor in Structural Engineering, School of Civil and Environmental Engineering, Faculty of Engineering and Information Technology, University of Technology Sydney (UTS)
Dr Harry Far Senior Lecturer in Structural Engineering, School of Civil and Environmental Engineering, Faculty of Engineering and Information Technology, University of Technology Sydney (UTS)
Rev 02
23/10/2020

50 | P a g e
2.1 Introduction This technical report experimentally evaluates the effects of using BarChip fibre reinforced concrete
on interface shear strength of 275 Dincel structural walling panels in comparison with 275 Dincel
structural walling panels filled with conventional plain concrete and reinforced concrete. In addition,
since AS 3600 (2018) does not prescribe the shear plane surface coefficients for determining the
interface shear strength of 275 Dincel structural walling panels, in order to enable structural design
engineers to calculate the interface shear strength for those panels using Australian Standards, the
friction and cohesion coefficients for the studied composite Dincel Polymer encased walls have been
extracted from the test results and proposed for practical applications in this study.
2.2 Experimental Testing Program
Nine 275 Dincel structural walling panel specimens were cast and tested at the UTS Tech Lab. The
first of its type in Australia, UTS Tech Lab is a new-generation 9000 m2 facility that is designed to
bring the university and industry together to innovate and disrupt traditional university approaches to
research. As illustrated in Figure 1, each specimen consists of two 275 mm Dincel structural walling
panels filled with concrete known as top panel and bottom panel. The panels were 1200 mm long with
275 mm thickness and filled with concrete having 200 mm slump and compressive strength 40 MPa
at 28 days.
Figure 1: Overall test setup and dimensions of the test specimens

51 | P a g e
All nine composite Dincel Polymer encased concrete wall specimens were prepared, poured with
concrete, and cured on site at UTS Tech Lab by Dincel technicians. The entire process has been
overseen and reviewed by UTS scholars, during and post pour. All reinforcement details, mix
designs and mix properties were reviewed and approved by suitably qualified UTS Tech Lab staff.
Concrete compression cylinders were taken from the fresh concrete mix and tested to measure the
concrete strength at various stages of curing to determine the concrete properties throughout curing
strength predictions and validation of the concrete mechanical properties (Figure 2).
(a) (b)
Figure 2: Concrete compression cylinder tests; a) Samples taken from the fresh concrete mix, b) Concrete compression test in process at UTS Tech Lab
2.3 Mechanical Properties of 275 Dincel Panels In order to determine mechanical properties of the employed Dincel Polymer materials in this study,
five dog-bone coupon specimens from the Dincel panels were prepared according to ASTM D638
specifications as illustrated in Figure 3.
Figure 3: Dog-bone coupon specimens prepared for tensile tests according to ASTM D638
Tensile tests were conducted by applying a constant rate of 0.083 mm/s in accordance with ASTM
D638 and the resulted average ultimate tensile strength, Young’s modulus of elasticity, and
Poison’s ratio were determined and presented in Table 1.

52 | P a g e
Table 1: Mechanical properties of tested Dincel Polymer material
Young’s Modulus E (MPa)
Tensile Strength σu (MPa)
Poisson’s Ratio υ
2609 37.20 0.39
Figure 4: An overview of the tensile Dincel Polymer testing at the UTS Tech Lab
2.4 Test Specimens The experimental testing program has aimed to investigate the effects of using macro-synthetic
fibre reinforced concrete (BarChip 48 macro-synthetic reinforcement system), instead of
conventional concrete, on shear capacity at the shear interface of composite Dincel Polymer encased
275 mm Dincel structural walling panels. In addition, the contribution of friction and cohesion to
the interface shear strength of each specimen was aimed to be investigated. To achieve these goals,
direct shear testing was conducted on the test specimens, which were cast with plain concrete,
reinforced concrete and BarChip fibre reinforced concrete, and tested at the age of 28 days with
the following details:
• Three composite Dincel Polymer encased concrete wall specimens, named Shear-BarChip, with 5kg/m3 BarChip 48 macro-synthetic fibre reinforced concrete;
• Three composite Dincel Polymer encased concrete wall specimens, named Shear-Plain, with plain concrete; and

53 | P a g e
• Three composite Dincel Polymer encased concrete wall specimens, named Shear-Reo, with reinforced concrete.
In Shear-Reo specimens, the Dincel panels contained 2N12-300 steel reinforcement bars with
hooks at both ends, placed in the centre of the circular formwork holes (see Figure 5 below).
Figure 5: Dincel panels with shear steel reinforcements (before pouring concrete)
2.5 Test Setup and Procedure Composite members are generally designed to act monolithically. In concrete-to-concrete bonds, the
horizontal shear stress between the two concrete surfaces is resisted by the shear capacity at the
interface. To ensure whether this bond fails or not under constant normal and horizontal force, an
experimental testing program was conducted using direct shear test method. This method has been
used by several researchers to study the composite action between the two members in order to
determine the interface shear strength. Figure 6 shows an overview of the direct shear test configuration
at UTS Tech Lab.

54 | P a g e
Figure 6: An overview of the direct shear test configuration at the Tech Lab
The base panels in the test setup were fixed to the test frames and the top panels were pushed by the
load cell. The jack shown in Figure 6 has a maximum capacity of 200 Tones. The steel reinforcing
provided within the specimen (2N12-300) was selected as it was the maximum in which the jack could
provide a failure to the walling system. A much greater jack capacity is required to achieve failure for
steel bar sizes such as 2N16-150, 2N20-150, etc. The load was applied using a hydraulic cylinder
(Figure 7) and controlled using a closed loop PID control system called FCS SmartTest One (Figure
8).
Figure 7: Hydraulic cylinder used in experimental study to apply horizontal load

55 | P a g e
Figure 8: Closed loop PID Control system (FCS SmartTest One) used for recording and post processing
During the test, the horizontal load applied to the top specimen was increased steadily until the
maximum shear capacity of the specimen was achieved and the bond failure happened (Figure 9).
Figure 9: Failure of one of the test specimen after reaching the maximum shear capacity at the interface of composite Dincel Polymer encased 275 mm Dincel structural walling panels
The bond failure load then was defined as the load at which the interface bond was broken. The samples
were restrained from lifting with a setup that offered minimal friction through the use of high load
capacity skates (Figure 6). Boundary conditions were created so any stresses from moments and

56 | P a g e
compression were negligible, to encourage the samples to fail in pure shear. The corresponding slip
was measured through laser displacement sensors and the relative movement between the top panel
(panel above the shear plane) and the bottom panel (panel below the shear plane) was defined as shear
deflection or interface slip.
2.6 Results and Discussion The load-deflection curves for all the test specimens have been obtained from the direct shear test
results. In order to compare and interpret the results properly, the average load-deflection curves
obtained from direct shear tests have been developed and presented in Figure 10.
Figure 10: Average load-shear deflection curves obtained from direct shear tests
As it can be seen in Figure 10, for all the test specimens, the applied horizontal load keeps
increasing until the bond between the two panels is broken. Then, if horizontal load is further
applied, it will drop, since not much force is needed to cause sliding of the top panel. The interface

57 | P a g e
shear strength was then calculated by determining the shear load before interface slip occurred.
This is mainly attributed to the fact that once interface slip occurs, full composite action is lost and
therefore interface shear strength does not exist anymore. In this study, the interface shear strength
is determined by dividing the maximum horizontal load over the interface (shear plane) area
according to the several researchers’ recommendation. Table 2 summarises the measured shear
deflection and shear strength parameters in test specimen interfaces.
Table 2: Summary of test results for different specimens
Specimen Average peak shear load
(kN) Shear deflection at
peak shear load (mm) Unit interface shear
strength (MPa)
Plain Concrete 304 0.10 1.11
BarChip 48 Fibre Reinforced Concrete
589 2 2.14
Steel Reinforced Concrete
988 5 3.60
Comparing the curves in Figure 10 and the determined values in Table 2, it is noted that the
maximum shear load and the interface shear strength of Shear-BarChip specimens have increased
by 93.5% compared to the corresponding values determined from the Shear-Plain specimens.
Therefore, it has become apparent that using BarChip 48 macro-synthetic fibre reinforced concrete
instead of plain concrete in the tested composite Dincel Polymer encased walls leads to 93.5%
interface shear capacity enhancement for the studied composite Dincel Polymer encased concrete
wall specimens. In addition, comparison between the results in Figure 10 and Table 2 has revealed
that the shear capacity at the interface of Shear-Plain specimens (specimens filled with plain
concrete) is 31% of the interface shear capacity of Shear-Reo specimens (specimens filled with
reinforced concrete) while Shear-BarChip specimens (specimens filled with BarChip 48) have
achieved almost 60% of the interface shear capacity of Shear-Reo specimens. It is an important
observation that shows employing BarChip 48 macro-synthetic fibre reinforcement in composite
Dincel Polymer encased walls can produce more than half of the interface shear capacity achieved
by a fully reinforced composite Dincel Polymer encased walls while only one third of this capacity
can be reached by using conventional plain concrete. These findings correlate very well with the
fact that the shear strength of non-reinforced construction joints is resisted only by the concrete

58 | P a g e
cohesion and friction along the interfacial failure plane. In other words, for the steel reinforced
concrete construction joints, an increased shear strength is accepted under the assumption that the
shear force is primarily resisted by the dowel action of the transverse steel reinforcement.
The average peak shear load above will need to be divided by 1.2m to convert to a capacity per
metre length, and then multiplied by a reduction factor of 0.7 in accordance to AS3600 Table 2.2.2.
Table 3: Reduced peak shear loads
Specimen: 275 Dincel (f’c = 40MPa) Peak Interface Shear Capacity with 0.7 Reduction Factor
Shear-Plain Concrete 304/1.2 × 0.7 = 177.3 kN/m
Shear-BarChip 589/1.2 × 0.7 = 343.6 kN/m
Shear-Reo 988/1.2 × 0.7 = 575.3 kN/m
2.7 Analysis and Comparison to AS3600 (2018) The overall interface between Dincel panels can be seen in Figure 11 below.
Figure 11: Dincel panel interface (left), cut test specimen showing interface (right)
There are two components of the concrete interface between 275 Dincel profiles:
Interface
between
panels
Concrete-to-
concrete
interface at
web holes
Polymer-to-
concrete
interface
surrounding
web holes

59 | P a g e
1. Concrete-to-concrete interface – provided through 2 x 95mm diameter web holes at 150mm pitch. This provides a shear surface area of:
𝐴𝐴 = 2 × 𝜋𝜋 × �954�2
× �1000150
� = 94510 𝑚𝑚𝑚𝑚2
𝑚𝑚
2. Concrete-to-polymer interface - In addition to direct concrete to concrete connection at the web holes as per above, the concrete between Dincel polymer surfaces surrounding the web holes also provides frictional resistance. This provides a shear surface area of:
𝐴𝐴 = [(275𝑚𝑚𝑚𝑚 − 2 × 2.5𝑚𝑚𝑚𝑚) × 1000𝑚𝑚𝑚𝑚] − 94510 = 174490 𝑚𝑚𝑚𝑚2
𝑚𝑚
As the frictional resistance between a polymer surface and a concrete surface is relatively low, it
can be stated that the primary interface shear capacity is provided by direct concrete-to-concrete
connection at the web hole locations.
When calculating the interface shear capacity to AS3600 (2018), a shear plane width (𝑏𝑏𝑒𝑒) is
required. For this assessment, the area from the concrete-to-polymer interface is considered
negligible, therefore leaving only the area from the concrete-to-concrete interface to provide the
shear resistance, equating to a shear plane width of 94.5mm. Table 4 provides a comparison
between the test results and the calculated capacity to AS3600 (2018) using this shear plane width.
Table 4: Comparison to AS3600 (2018) – Factored Capacities
Specimen Dincel 275 Wall test result Interface shear capacity calculated from AS3600 (2018) 8.4.3
(𝑏𝑏𝑒𝑒 = 94.5𝑚𝑚𝑚𝑚)
Plain Concrete (f’c = 40 MPa) 177.3 kN/m 75.3 kN/m
The results achieved within the test are 102kN higher than method of calculation to AS3600
(2018). Clearly, there are further mechanisms/behaviours which increase the interface shear
capacity within a Dincel wall.

60 | P a g e
To investigate this, following failure of the test specimen, the panels where separated and the
failure plane was observed. Figure 12 below demonstrates that the shear plane was not completely
straight but rather consisted of dome or conical shaped protrusions at the web hole locations.
Figure 12: Dome/conical failure plane observed at web hole locations of Dincel 275 profile
For a conventional concrete wall, shear failure is primarily a flat plane rather than a series of
concrete cones/domes. It was observed that the concrete encapsulated by the 275 Dincel polymer
formwork provided ‘confinement’ to the concrete which led to the unique failure plane. The array
of domes provided a keying action throughout the section and subsequently this aided in achieving
a higher shear capacity.
The direct concrete-to-concrete interface, which provides the primary shear resistance, is a surface
area of 94510mm2/m as identified previously. However, this is assuming a flat failure plane rather
than a series of domes which provides a greater surface area due to the curvatures, as illustrated in
Figure 13.

61 | P a g e
Figure 13: Illustration of dome shaped failure planes at web holes
Depending on the radius of the dome, the surface area provided could potentially be up to double
the surface area of the flat plane. This type of failure most likely justifies why the test results are
higher than what is capable through method of calculation to AS3600 (2018) for a conventional
concrete member. The ‘flat’ shear plane area of 94,510mm2/m is increased due to the curved
concrete surfaces.
When steel reinforcement is added to the walling system, the results achieved are even more
favourable. A comparison with the results and AS3600 (2018) has been provided in Table 5.
Table 5: Comparison to AS3600 (2018) – Factored Capacities
Specimen Dincel 275 Wall test result
Interface shear capacity calculated from AS3600
(2018) 8.4.3 (𝑏𝑏𝑒𝑒 = 94.5𝑚𝑚𝑚𝑚)
Interface shear capacity calculated from AS3600
(2018) 8.4.3 (𝑏𝑏𝑒𝑒 = 275𝑚𝑚𝑚𝑚)
Reinforced Concrete (2N12-300, f’c = 40
MPa)
575.3 kN/m 306.1 kN/m 429.99 kN/m

62 | P a g e
As can be shown, by providing steel reinforcement the tested capacity is 269kN higher than the
calculated capacity where a shear plane width of 94.5mm is used, and 145kN higher when a shear
plane width of 275mm is used. These results are much greater than the 102kN difference observed
with plain concrete only, and even demonstrate that the interface shear capacity for a Dincel wall
is higher than the calculated capacity of a conventional concrete wall of equivalent thickness. It is
hypothesised the reason for this is an increase in the ‘dome’ effect as illustrated in Figure 14 due
to increased cohesion surrounding the steel reinforcement bars.
Figure 14: Illustration of dome shaped failure planes at web holes with steel reinforcement
It is not possible to derive a definitive surface area for these domes due to the complex behaviour,
so instead of modifying the width of the shear plane, cohesion and friction parameters have been
determined in Section 5 in order to be used within formula 8.4.3 of AS3600 (2018).
The effect of concrete confinement within Dincel polymer formwork was first observed from the
UTS earthquake tests with 200 Dincel in the year 2011. For reference purposes, the earthquake
report can be downloaded through the following link - download. It is important to note that 275
Dincel is significantly upgraded from 200 Dincel due to the perforated inner tube which provides
additional tensile capacity as demonstrated within flexural testing by UTS.

63 | P a g e
It is therefore appropriate to state that 275 Dincel offers improved confinement behaviour and
provides additional tensile or bending capacity in comparison to 200 Dincel.
2.8 Proposed Cohesion and Friction Parameters for the Studied Specimens AS 3600 (2018) prescribes the shear plane surface coefficients, for concrete-to-concrete interfaces.
The interface shear strength can be calculated by using those coefficients in Clause 8.4.3 AS 3600
(2018) equation for concrete surfaces. However, AS 3600 (2018) does not prescribe the shear plane
surface coefficients for determining the interface shear strength of composite Dincel Polymer
encased structural walling panels. Therefore, to enable structural designers to use Clause 8.4.3 AS
3600 (2018) and the presented equation in order to determine the interface shear strength for those
panels, similar friction and cohesion coefficients need to be proposed. These modified coefficients
also take into account the dome type failure as explained in Part 4 of this report.
According to AS 3600 (2018), the interface shear strength can be determined from Clause 8.4.3
AS 3600 (2018) equation in which:
𝜎𝜎𝑛𝑛 =𝑔𝑔𝑝𝑝𝑏𝑏𝑒𝑒
(1)
The presented equation in Clause 8.4.3 AS 3600 (2018) can be simplified and rewritten as follows:
𝜏𝜏𝑢𝑢 = 𝜇𝜇 �𝐴𝐴𝑠𝑠𝑒𝑒𝑓𝑓𝑠𝑠𝑦𝑦𝑠𝑠𝑏𝑏𝑒𝑒
+ 𝜎𝜎𝑛𝑛� + 𝑘𝑘𝑐𝑐𝑐𝑐𝑓𝑓𝑐𝑐𝑐𝑐′ (2)
The coefficient μ in Eqn. 2 is related to dowel action effects which is considered 0 in the case of
using plain concrete or BarChip 48 macro-synthetic reinforcement and can be assumed as a
constant value in the case of using steel reinforced concrete. According to AS 3600 (2018), Table
8.4.3 and other international codes such as Eurocode, μ = 0.9 for monolithic reinforced concrete.
This coefficient is for dowel action effects only and unchanged between a Dincel wall and a
conventional concrete wall, so it is also taken as μ = 0.9 for Dincel walls. 𝜎𝜎𝑛𝑛 is taken as 0 unless
there is external loading applied to the wall normal to the shear plane.
As the shear resistance provided by the concrete-to-polymer surface (174990mm2/m) is relatively
low, the shear plane width (𝑏𝑏𝑓𝑓) has been taken as the concrete area bound within the web holes

64 | P a g e
only, being 94.5mm. The coefficient 𝑘𝑘𝑐𝑐𝑡𝑡 was derived by method of back-calculation as
demonstrated below.
1. Calculation of 𝑘𝑘𝑐𝑐𝑡𝑡 for 275 Dincel filled with Plain Concrete
Width of the shear plane 𝑏𝑏𝑒𝑒 = 94.51 𝑚𝑚𝑚𝑚 Shear plane area ⟹ 94.51 × 1000 = 94510 𝑚𝑚𝑚𝑚2 Measured maximum load = 304000 𝑁𝑁 (for specimen with 1.2 m length) For finding unit shear strength, load is adjusted per metre length: Unit shear strength ⟹ 304000
1.2= 253333 = 253333
94510 ≈ 2.68 𝑀𝑀𝑃𝑃𝑎𝑎
According to Clause 3.1.1.3 ⟹ 𝑓𝑓𝑐𝑐𝑡𝑡
′ = 0.36√40 = 2.28 𝑀𝑀𝑃𝑃𝑎𝑎 2.68 = 𝜇𝜇 (0) + 𝑘𝑘𝑐𝑐𝑐𝑐 × 2.28 ⟹ 2.68 = 2.28 𝑘𝑘𝑐𝑐𝑐𝑐 → 𝑘𝑘𝑐𝑐𝑡𝑡 = 1.18 This 𝑘𝑘𝑐𝑐𝑡𝑡 value accounts for the dome shape failure. 2. Calculation of 𝑘𝑘𝑐𝑐𝑡𝑡 for 275 Dincel filled with BarChip reinforced Concrete
Width of the shear plane 𝑏𝑏𝑒𝑒 = 94.51 𝑚𝑚𝑚𝑚 Shear plane area ⟹ 94.51 × 1000 = 94510 𝑚𝑚𝑚𝑚2 Measured maximum load = 589000 𝑁𝑁 (for specimen with 1.2 m length) For finding unit shear strength, load is adjusted per metre length: Unit shear strength ⟹ 589000
1.2= 490833 = 490833
94510 ≈ 5.2 𝑀𝑀𝑃𝑃𝑎𝑎 According to Clause 3.1.1.3 ⟹ 𝑓𝑓𝑐𝑐𝑡𝑡
′ = 0.36√40 = 2.28 𝑀𝑀𝑃𝑃𝑎𝑎 5.2 = 𝜇𝜇 (0) + 𝑘𝑘𝑐𝑐𝑐𝑐 × 2.28 ⟹ 5.2 = 2.28 𝑘𝑘𝑐𝑐𝑐𝑐 → 𝑘𝑘𝑐𝑐𝑡𝑡 = 2.28
The significant increase in 𝑘𝑘𝑐𝑐𝑡𝑡 between plain concrete and BarChip reinforced concrete is
attributed to the synthetic fibres providing an array of small dowels which
leads to an increased cohesion effect. Note that the above 𝑘𝑘𝑐𝑐𝑐𝑐 coefficient can also be used
where BarChip reinforced concrete is used in conjunction with steel reinforcement. This is

65 | P a g e
because 𝑘𝑘𝑐𝑐𝑐𝑐 is for concrete cohesion only and not steel dowel effects. This provides a
conservative approach, as if tested and separately derived, 𝑘𝑘𝑐𝑐𝑐𝑐 will be greater for a specimen
with both BarChip reinforced concrete and steel reinforcement due to a larger shear plane
surface area as illustrated in Figure 14. Another indication it is a conservative approach is the
𝑘𝑘𝑐𝑐𝑐𝑐 value closely matches that of plain concrete with steel reinforcement as derived below.
3. Calculation of 𝑘𝑘𝑐𝑐𝑡𝑡 for 275 Dincel with plain concrete and steel reinforcement
Shear plane area ⟹ 94.51 × 1000 = 94510 𝑚𝑚𝑚𝑚2 Measured maximum load = 988000 𝑁𝑁 (for specimen with 1.2 m length) For finding unit shear strength, load is adjusted per metre length: Unit shear strength ⟹ 988000
1.2= 823333 = 823333
94510 ≈ 8.71 𝑀𝑀𝑃𝑃𝑎𝑎
According to Clause 3.2.1 ⟹ 𝑓𝑓𝑠𝑠𝑠𝑠 = 500 𝑀𝑀𝑃𝑃𝑎𝑎 According to Clause 3.1.1.3 ⟹ 𝑓𝑓𝑐𝑐𝑡𝑡
′ = 0.36√40 = 2.28 𝑀𝑀𝑃𝑃𝑎𝑎 Shear reinforcement area ⟹ 𝐴𝐴𝑠𝑠𝑓𝑓 = 2 × 113.04 = 226 𝑚𝑚𝑚𝑚2 According to Table 8.4.3 ⟹ 𝜇𝜇 = 0.9 8.71 = 0.9 �226×500
300×94.5�+ 𝑘𝑘𝑐𝑐𝑐𝑐 × 2.28 ⟹ 𝑘𝑘𝑐𝑐𝑐𝑐 = 2.25
Although a 𝑘𝑘𝑐𝑐𝑐𝑐 value of 2.25 would apply where the exact steel reinforcement arrangement in the
test is used in practice (2N12-300), it cannot be assumed that an identical 𝑘𝑘𝑐𝑐𝑐𝑐 will be attained using
different steel reinforcement arrangements. This is because the increased dome effect as illustrated
in Figure 14 is a complex behavior which requires further investigation. Therefore, as a
conservative approach, it is safe to assume and recommended that for all other steel reinforcement
arrangements a 𝑘𝑘𝑐𝑐𝑐𝑐 value of 1.18 is used, to replicate the concrete cohesion value derived for plain
concrete.

66 | P a g e
2.9 Conclusions and Recommendations In this study, the effects of using BarChip fibre reinforced concrete on interface shear strength of
275 Dincel structural walling panels in comparison with 275 Dincel structural walling panels filled
with conventional plain concrete and reinforced concrete have been experimentally investigated.
Nine composite Dincel Polymer encased concrete wall specimens were cast and tested using direct
shear test at UTS Tech Lab. Based on the load-deflection curves obtained from the direct shear
test, the maximum shear loads and the interface shear strength values were determined for three
different cases including i) test specimens filled with plain concrete, ii) test specimens filled with
macro-synthetic fibre reinforced concrete, and iii) test specimens filled with reinforced concrete.
Within the investigation, it was found that the shear failure plane is not flat, but rather consists of
a series of dome/conical shaped protrusions at web hole locations. The array of domes provides a
keying action throughout the section and subsequently this aids in achieving a higher shear
capacity to what is possible by calculation to AS3600 (2018).
AS 3600 (2018) does not prescribe the shear plane surface coefficients for determining the
interface shear strength of composite Dincel Polymer encased 275 mm Dincel structural walling
panels. Therefore, in order to enable structural design engineers to use the equation found in Clause
8.4.3 of AS 3600 (2018) for determining the in-plane vertical shear strength, the friction and
cohesion coefficients have been extracted from the test results in this study and proposed in Table
6 for practical applications.
Table 6: Recommended friction and cohesion coefficients for 275 Dincel based on experimental study results, for 𝒃𝒃𝒇𝒇 = 𝟗𝟗𝟗𝟗.𝟓𝟓 𝒎𝒎𝒎𝒎
275 Dincel Specimen Infill
Friction coefficient (𝜇𝜇)
Cohesion coefficient (𝑘𝑘𝑐𝑐𝑐𝑐)
Plain Concrete 0 1.18
BarChip Fibre Reinforced Concrete
0 2.28
Steel Reinforced Concrete with plain concrete infill
0.90 1.18
Steel Reinforced Concrete with BarChip Fibre
reinforced concrete infill
0.90 2.28

67 | P a g e
2.10 Design Certification in accordance with AS3600-2018 275 Dincel walls, when designed by a structural engineer using the information provided in this
report, will satisfy the deemed-to-satisfy provisions of the National Construction Code for
structural design.
In accordance with test results shown in this report as per Appendix B of AS3600-2018,
A/Professor Shami Nejadi as the chief investigator on behalf of UTS (in his capacity) confirms
that 275 Dincel structural walling panels filled with mass concrete (with or without steel
reinforcement), or filled with concrete containing BarChip 48 macro-synthetic fibres, complies
with AS3600-2018. A structural engineer may calculate the interface shear capacity of any 275
Dincel wall using the method shown in Section 5 of this report or using the proposed values in
Table 6.
Table A1 of Appendix 1 provides examples of capacities calculated using the determined coefficients, and can be used by a structural engineer in lieu of appropriate calculation.
A/Professor Shami Nejadi: Date: 23/10/2020

68 | P a g e
Appendix 2.1 – Design Process To aid with the design process for engineers, the interface shear capacities for various Dincel 275
walling arrangements has been shown in Table A1.
Table A1: Interface shear capacity for various Dincel 275 walling arrangements
Material Calculation to AS3600 (2018)
(𝒃𝒃𝒇𝒇 = 𝟗𝟗𝟗𝟗.𝟓𝟓 𝒎𝒎𝒎𝒎 f’c = 40 𝑴𝑴𝑴𝑴𝑴𝑴, φ = 0.7)
Test Results (f’c = 40MPa, φ = 0.7)
Plain Concrete only (𝑘𝑘𝑐𝑐𝑡𝑡 = 1.18) 177.7 kN/m 304/1.2 × 0.7 =
177.3 kN/m
BarChip reinforced concrete only (𝑘𝑘𝑐𝑐𝑡𝑡 = 2.28)
343.4 kN/m 589/1.2 × 0.7 = 343.6 kN/m
Plain Concrete + 2N12 @ 300 (𝑘𝑘𝑐𝑐𝑡𝑡 = 1.18, 𝜇𝜇 =0.9)
408.5 kN/m 988/1.2 x 0.7 = 575.3 kN/m
Plain Concrete + 2N16 @ 150 (𝑘𝑘𝑐𝑐𝑡𝑡 = 1.18, 𝜇𝜇 =0.9) 1018.2 kN/m N/A
Plain Concrete + 2N20 @ 150 (𝑘𝑘𝑐𝑐𝑡𝑡 = 1.18, 𝜇𝜇 =0.9)
1480.4 kN/m N/A
BarChip reinforced concrete + 2N12 @ 300
(𝑘𝑘𝑐𝑐𝑡𝑡 = 2.28, 𝜇𝜇 =0.9) 574.2 kN/m N/A
BarChip reinforced concrete + 2N16 @ 150
(𝑘𝑘𝑐𝑐𝑡𝑡 = 2.28, 𝜇𝜇 =0.9) 1183.9 kN/m N/A
BarChip reinforced concrete + 2N20 @ 150
(𝑘𝑘𝑐𝑐𝑡𝑡 = 2.28, 𝜇𝜇 =0.9) 1646.1 kN/m N/A
As can be seen from Table A1, the calculated capacity for a Dincel wall with 2N12-300 steel
reinforcement is 29% less than the tested capacity. As explained in Section 5, this is due to a
conservative adoption of the cohesion factor 𝑘𝑘𝑐𝑐𝑐𝑐 which is taken to be the same as the derived
coefficient for plain concrete within 275 Dincel, in order to be appropriate for all proposed steel
reinforcement arrangement. Regardless, it should be noted that the

69 | P a g e
values calculated by AS3600 (2018) for Dincel 275 with steel reinforced concrete closely trails the
calculated capacity for a conventional 275mm thick steel reinforced concrete wall.
Before physical testing, the conventional method of determining the interface shear capacity for
Dincel walls was by using the coefficients prescribed in AS3600 (2018) Table 8.4.3 and a shear
plane width (𝑏𝑏𝑒𝑒) equivalent to the area bound within the web holes. This study has concluded that
this method is an overly conservative approach, and instead the coefficients and capacities
provided in Tables 6 and A1 can be used in conjunction with the reduced shear plane width.

70 | P a g e
Technical Report
Evaluation of Flexural
Performance of 275 Dincel
Structural Walling
Prepared by: Dr Shami Nejadi Associate Professor in Structural Engineering, School of Civil and Environmental Engineering, Faculty of Engineering and Information Technology, University of Technology Sydney (UTS)
Dr Harry Far Senior Lecturer in Structural Engineering, School of Civil and Environmental Engineering, Faculty of Engineering and Information Technology, University of Technology Sydney (UTS)
Rev 03 30/09/2020
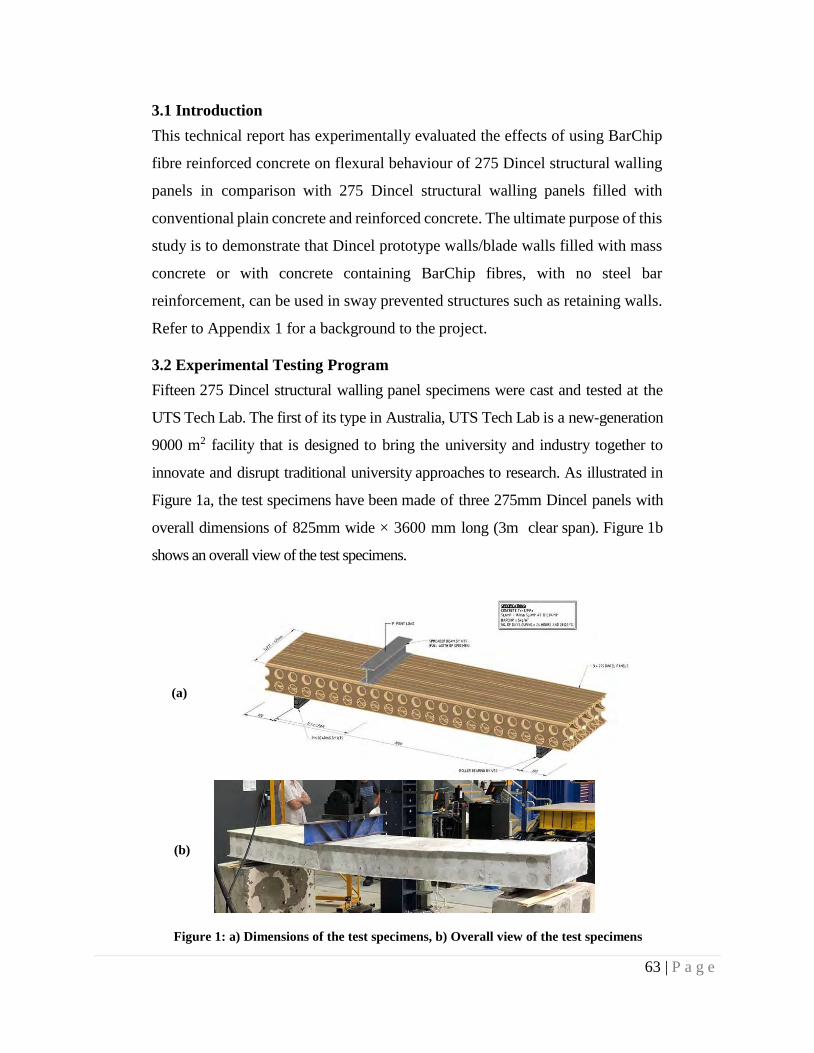
63 | P a g e
3.1 Introduction This technical report has experimentally evaluated the effects of using BarChip
fibre reinforced concrete on flexural behaviour of 275 Dincel structural walling
panels in comparison with 275 Dincel structural walling panels filled with
conventional plain concrete and reinforced concrete. The ultimate purpose of this
study is to demonstrate that Dincel prototype walls/blade walls filled with mass
concrete or with concrete containing BarChip fibres, with no steel bar
reinforcement, can be used in sway prevented structures such as retaining walls.
Refer to Appendix 1 for a background to the project.
3.2 Experimental Testing Program Fifteen 275 Dincel structural walling panel specimens were cast and tested at the
UTS Tech Lab. The first of its type in Australia, UTS Tech Lab is a new-generation
9000 m2 facility that is designed to bring the university and industry together to
innovate and disrupt traditional university approaches to research. As illustrated in
Figure 1a, the test specimens have been made of three 275mm Dincel panels with
overall dimensions of 825mm wide × 3600 mm long (3m clear span). Figure 1b
shows an overall view of the test specimens.
Figure 1: a) Dimensions of the test specimens, b) Overall view of the test specimens
(a)
(b)

64 | P a g e
All fifteen 275 Dincel structural walling panel specimens were prepared, poured with
concrete (which possesses compressive strength of 32 MPa at 28 days and min.
180mm slump at the pump), and cured on site at UTS Tech Lab by Dincel
technicians. The entire process has been overseen and reviewed by UTS staff prior,
during and post pour. All reinforcement details, mix designs and mix properties were
reviewed and approved by suitably qualified UTS staff. Concrete compression
cylinders were taken from the fresh concrete mix and tested to measure the concrete
strength at various stages of curing to determine the concrete properties throughout
curing strength predictions and validation of the concrete mechanical properties
(Figure 2).
(a) (b) Figure 2: Concrete compression cylinder tests; a) Samples taken from the fresh concrete
mix, b) Concrete compression test in process at UTS Tech Lab
3.3 Mechanical Properties of 275 Dincel Panels In order to determine mechanical properties of the employed PVC materials in
this study, five dog-bone coupon specimens from the Dincel panels were
prepared according to ASTM D638 specifications as illustrated in Figure 3.
Figure 3: Dog-bone coupon specimens prepared for tensile tests according to
ASTM D638

65 | P a g e
As illustrated in Figure 4, tensile tests were conducted by applying a constant rate of
0.083mm/s in accordance with ASTM D638 and the resulted average ultimate tensile
strength, Young’s modulus of elasticity, and Poison’s ratio were determined and
presented in Table 1.
Table 1: Mechanical properties of tested PVC material
Young’s Modulus E (MPa)
Tensile Strength σu (MPa)
Poisson’s Ratio υ
2609 37.20 0.39
Figure 4: An overview of the tensile PVC testing at the UTS Tech Lab
3.4 Test Procedure The experimental testing program has aimed to investigate the effects of using
BarChip fibre reinforced concrete on flexural behaviour of 275 Dincel structural
walling panels in comparison with 275 Dincel structural walling panels filled
with conventional plain concrete and reinforced concrete. To achieve this goal,
flexural testing was conducted on the test specimens, which were cast with plain
concrete, reinforced concrete and BarChip fibre reinforced concrete,
respectively, and tested at the age of 28 days with the following details:
• Three 275 Dincel panel specimens, named Flex-BarChip, with concrete reinforced with 5kg/m3 of BarChip 48 macro-synthetic fibres;

66 | P a g e
• Three 275 Dincel panel specimens, named Flex-Plain, with plain concrete; and
• Three 275 Dincel panel specimens, named Flex-Reo, with reinforced concrete (N16@275mm normal ductility class deformed reinforcing bars grade D500N according to AS3600-2018).
It should be noted that three samples were tested for each different test detail for
statistical analysis purposes. In order to investigate the flexural behaviour of
Dincel panels filled with concrete containing BarChip 48 at the early age of 24
hours, when the backfilling of the retaining walls may potentially start, six test
specimens (three samples for each test detail) were cast and tested 24 hours after
pouring the concrete with the following details:
• Three 275 Dincel panel specimens, named Flex-BarChip, with concrete reinforced with 5kg/m3 of BarChip 48 macro-synthetic fibres; and
• Three 275 Dincel panel specimens, named Flex-Plain, with plain concrete.
For flexural testing, three-point bending test on a three-metre span was chosen,
with the load point at 3rd span (Figure 1) in order to apply a load that
conservatively resembled the pressure applied by soil or ground water
(hydrostatic pressure) to a propped cantilever such as basement retaining walls.
As illustrated in Figure 5, the supports and the load point used in the test
configuration represented a simply supported beam to provide the maximum
bending moment and shear force at one-third of the span.
Figure 5: Three-point bending test configuration

67 | P a g e
The load was applied using a hydraulic actuator (MTS 201.35 fatigue rated
actuator) and controlled using a PID controller (MTS Flex Test 60) in stroke
control. The test load was applied with a suitably stiff spreader beam to distribute
the load across the full width of the three modules. Laser displacement sensors
were positioned at one-third and half of the span length on the underside of the
test specimens to monitor displacement throughout the whole tests (Figure 6),
with all the sensors and actuator properties (force and stroke) recorded for post
processing purposes using the computerised controller system shown in Figure7.
Figure 6: One of the laser displacement sensors under its protective stand
(a) (b) Figure 7: Controller system used for recording and post processing purposes; a) Front view,
b) Rear view

68 | P a g e
Loading was applied until the maximum bending moment capacity of the
specimens had been reached. Figure 8 shows one of the BarChip 48 fibre
reinforced concrete failed samples from both sides after reaching the maximum
bending moment capacity.
(a) (b) Figure 8: Failure of one of the BarChip 48 fibre reinforced concrete specimens after reaching the maximum bending moment capacity; a) Front side cracks, b) Underside
cracks The test setup and loading rates of the tests were derived in a way that satisfies
the requirements of AS3600-2018 Appendix B ‘Testing of members and
structures’.
3.5 Results and Discussion
The load-deflection curves for all the test specimens have been obtained and plotted
in Figures 9 to 13. Figures 9 and 10 show the load-deflection curves for Flex-Plain
specimens (specimens filled with plain concrete) and Flex-BarChip specimens
(specimens filled with BarChip 48 macro-synthetic fibre reinforced concrete) at the
age of 24 hours, respectively, when the backfilling of the retaining walls may
potentially start. Figures 11 to 13 illustrate the load- deflections curves for Flex-Plain
specimens (specimens filled with plain concrete), Flex-BarChip specimens
(specimens filled with BarChip 48 macro-synthetic fibre reinforced concrete) and
Flex-Reo specimens (specimens filled with reinforced concrete with N16@275mm
normal ductility class deformed reinforcing bars) at the age of 28 days when the
concrete has reached the intended strength of 32 MPa. In order to compare and
interpret the results properly, the average load-deflection curves for Figures 9 to 13
have been developed and presented in Figures 14 and 15. Figure 14 compares Flex-

69 | P a g e
BarChip and Flex-Plain average load-deflection curves at the age of 24 hours while
Figure 15 presents a comparison between Flex-BarChip, Flex-Plain and Flex-Reo
average load-deflection curves at the age of 28 days.
Figure 9: Load-deflection curves for Flex-Plain specimens at the age of 24 hours
Figure 10: Load-deflection curves for Flex-BarChip specimens at the age of 24 hours

70 | P a g e
Figure 11: Load-deflection curves for Flex-Plain specimens at the age of
28 days
Figure 12: Load-deflection curves for Flex-BarChip specimens at the age
of 28 days

71 | P a g e
Figure 13: Load-deflection curves for Flex-Reo specimens at the
age of 28 days
3.6 Flexural Strength
3.6.1 Flexural Strength at the Age of 24 Hours
Since Dincel Construction commences backfilling retaining walls with
compacted material after 24 hours, it is important to understand the flexural
behaviour and strength of the retaining walls at this early age, in particular the
ones without the steel reinforcement. Therefore, this study has only tested the two
cases of Flex-BarChip and Flex-Plain specimens at the age of 24 hours. Based the
average results presented in Figure 14, the average ultimate loads, Pu, (the
maximum load that the specimens can tolerate before breaking) and the average
modulus of rupture values (ultimate flexural strength), Mu, have been determined
and tabulated in Table 2.
Table 2: Ultimate loads and module of rupture values for tested specimens at the age of 24 hours
Flex-Plain Flex-BarChip
Ultimate Load Pu
(kN) 51 63
Modulus of Rupture Mu (kN.M)
34 42

72 | P a g e
Comparing the curves in Figure 14 and the results in Table 2, it can be seen that
the ultimate load and the modulus of rupture value of Flex-BarChip specimens
are 23.5% larger than the corresponding values obtained from the Flex-Plain
specimens. Therefore, it is understood that using BarChip 48 fibre reinforced
concrete instead of plain concrete in the tested specimens can increase the
flexural strength by 23.5% at the early age of 24 hours.
Figure 14: Comparison between Flex-BarChip and Flex-Plain average load-deflection curves at the
age of 24 hours
3.6.2 Flexural Strength at the Age of 28 Days
In order to investigate the flexural strength of the test specimens at the age of 28
days, the average ultimate loads and the average modulus of rupture values
(ultimate flexural strength) have been extracted from Figure 15 and summarised
in Table 3.
Table 3: Ultimate loads and module of rupture values for tested specimens at the age of
28 days as well as the empty cell
Flex-Plain Flex-BarChip Flex-Reo
Ultimate Load Pu
(kN) 62 89 186
Modulus of Rupture Mu (kN.M)
41.3 59.3 123

73 | P a g e
Figure 15: Comparison between Flex-BarChip, Flex-Plain and Flex-Reo
average load-deflection curves at the age of 28 days
Comparing the average curves in Figure 15 and the determined values in Table
3, it is noted that the ultimate load and the modulus of rupture value of Flex-
BarChip specimens have increased by 43.5% compared to the corresponding
values determined from the Flex-Plain specimens after 28 days. Therefore, it has
become apparent that using BarChip 48 macro- synthetic fibre reinforced
concrete instead of plain concrete in the studied specimens leads to 43.5%
flexural strength enhancement at the age of 28 days. It should be noted that this
increase is 20% more than what has been observed at the age of 24 hours showing
that the flexural strength improves over time. In addition, comparison between
the three groups of the tested specimens in Figure 15 and Table 3 has revealed
that the flexural strength of Flex- Plain specimens (specimens filled with plain
concrete) is 33% of the flexural strength of Flex- Reo specimens (specimens filled
with reinforced concrete) while Flex-BarChip specimens (specimens filled with
BarChip 48) have achieved almost 50% of the flexural strength of the Flex-Reo
specimens. It is an important observation that shows employing BarChip 48 fibre
reinforcement in 275 Dincel structural walling panels can produce half of the

74 | P a g e
flexural strength achieved by a fully reinforced panels while only one third of
this capacity can be reached by using conventional plain concrete.
3.6.3. Stiffness and Flexural Rigidity at the Age of 28 Days
In order to develop a better understanding of the flexural performance of the tested
specimens at the age of 28 days, in addition to flexural strength, flexural rigidity
(EI) and stiffness (K) values for cracked and un-cracked conditions considering
tension stiffening effect have been determined based on the load-deflection
curves presented in Figure 15. As shown in Figures 16 to 18, when the applied
force P is plotted against the displacement δ, straight lines can be fitted in both
elastic and cracking stages. The gradient of these lines can estimate the stiffness
values for the specimens in un-cracked, effective and fully cracked conditions.
In Figures 16 and 17, where BarChip48 and steel reinforcement were used in the
concrete to provide resistance against tensile stresses, tension stiffening effects
are generated due to the bond between the reinforcement and concrete. Those
effects have been taken into account in determining the stiffness of Flex-BarChip
and Flex-Reo specimens and the corresponding un-cracked, effective and fully
cracked stiffness values have been estimated and tabulated in Table 4.
Figure 16: Stiffness calculation for Flex-BarChip specimens

75 | P a g e
Figure 17: Stiffness calculation for Flex-Reo specimens
For Flex-Plain specimens shown in Figure 18, the stiffness values were only
determined in un- cracked and fully cracked phases (Table 4) since there is no
tension stiffening effects observed.
Figure 18: Stiffness calculation for Flex-Plain specimens

76 | P a g e
Table 4: Un-cracked, effective, and cracked stiffness values for the tested specimens
Flex-Plain Flex-BarChip Flex-Reo
Uncracked Stiffness (N/mm)
21500 21500 21500
Effective Stiffness (N/mm)
N/A 1780 4200
Fully Cracked Stiffness (N/mm)
1400 1750 4000
As reflected in Figures 16 to 18, in all the tested specimens, a sudden drop occurs
in section stiffness when the first crack appears that correlates very well with
previous studies in this area. According to well-established methods used by
other researchers, using the estimated stiffness values, flexural rigidity values in
un-cracked, effective and fully cracked conditions for the tested specimens have
been calculated and summarised in Table 5.
Table 5: Un-cracked, effective, and cracked flexural rigidity values for the tested specimens
Flex-Plain Flex-BarChip Flex-Reo
Uncracked Flexural Rigidity (N/mm2)
9555×109 9555×109 9555×109
Effective Flexural Rigidity (N/mm2)
N/A 791×109 1866×109
Fully Cracked Flexural Rigidity (N/mm2)
622×109 777×109 1777×109
As the results in Tables 4 and 5 indicate, Flex-Plain, Flex-Reo and Flex-BarChip
specimens have similar stiffness and flexural rigidity values in elastic (un-
cracked) stage which corresponds well with the previous studies. However, the
fully cracked stiffness and flexural rigidity values of Flex-BarChip specimens
are 25% higher than the corresponding values determined from Flex-Plain
specimens after 28 days. Thus, it can be understood that using BarChip 48 fibre
reinforced concrete instead of plain concrete in 275 Dincel structural walling
panels can result in noticeable improvement in stiffness and flexural rigidity at
the age of 28 days. In addition, it has been observed that Flex-BarChip specimens
have achieved 44% of the stiffness and flexural rigidity of Flex-Reo specimens
while Flex-Plain specimens obtained 34% of those. It clearly indicates that using
BarChip 48 macro-synthetic fibre reinforcement in 275 Dincel structural walling

77 | P a g e
panels can produce nearly half of the flexural rigidity and stiffness achieved by a
fully reinforced 275 Dincel structural walling panels while only about one third of
those values can be reached by using conventional unreinforced concrete.
Furthermore, it is noted in Tables 4 and 5 that the cracked and effective stiffness
and flexural rigidity values are slightly different. Those minor differences
observed between the effective and fully cracked stiffness and flexural rigidity
values are attributed to the tension stiffening effects caused by the bond between
the reinforcement and concrete.
3.7 Suitability of Using 275 Dincel Structural Walling Panels as Sway- prevented Structures
One of the main factors concerning durability and service life of retaining walls
is corrosion of steel bars especially when exposed to harsh environment. The use
of fibre-reinforced concrete, as non-corrosive material, in 275 Dincel structural
walling panels with no steel reinforcement can potentially solve the corrosion
related problems. This can reduce the maintenance cost and increase the service
life of the retaining walls. Several researchers have pointed out that PVC encased
concrete walls can function as retaining walls and foundation walls with no need
for steel reinforcement, except for steel dowels, which are conventionally used to
anchor the wall to the concrete foundation. Therefore, in this study, the suitability
of the tested 275 Dincel structural walling panels (Flex-Plain and Flex-BarChip
specimens) for being used without steel reinforcement in sway-prevented
structures such as retaining walls has been examined (refer to Appendix 2 for
typical loading scenarios). To achieve this goal, a conventional reinforced
concrete retaining wall with the height of 3m that has been designed according
to AS3600-2018 to safely function as a retaining wall has been selected as the
base for assessing suitability of the tested specimens. The selected retaining wall
has 275 mm thickness, the same thickness as the tested specimens, and is poured
with concrete with the compressive strength of 32 MPa at 28 days. The minimum
reinforcement of 0.25 % normal ductility class deformed reinforcing bars grade
D500N, prescribed in Clause 11.7.1 of AS3600-2018 for concrete walls, has been

78 | P a g e
adopted for this concrete retaining wall and the ultimate flexural strength of this
wall has been calculated.
The ultimate flexural strength (Mu) of the tested Flex-Plain specimens (specimens
filled with plain concrete) and Flex-BarChip specimens (specimens filled with
BarChip 48 macro- synthetic fibre reinforced concrete) have been compared with
the ultimate flexural strength of the described conventional reinforce concrete
retaining wall at the age of 28 days. The calculated ultimate flexural strength of
the conventional reinforced retaining wall as well as the measured ultimate
flexural strength values for Flex-Plain and Flex-BarChip specimens from Table
3 are presented in Table 6 for comparison purposes.
Table 6: Comparison between the ultimate flexural strength values (at 28 days) for 825mm wide specimens
Tested Specimens Filled
with Plain Concrete Conventional
Reinforced Wall (with p=0.25%
reinforcement as per AS3600
11.7.1.a)
Tested Specimens filled with BarChip 48 Fibre
Reinforcement
Ultimate Flexural Strength Mu
(kN.M)
41.3 57.9 59.3
Comparison between the results in Table 6 shows that the flexural strength (Mu)
of the tested Flex-Plain specimens is 28.7 % lower than the flexural strength of
the conventional reinforced concrete retaining wall while the flexural strength of
the tested Flex-BarChip specimens is 2.4 % more than the flexural strength of
the conventional reinforced wall.
The relatively higher flexural capacity of 275 Dincel structural walling panels
filled with BarChip 48 fibre reinforced concrete without steel reinforcement bars
compared to the base reinforced concrete walls makes this type of PVC encased
walls also a suitable option to be used as retaining walls. As a result, it can be
concluded that since 275 Dincel structural walling panels filled with BarChip 48
fibre reinforcement without steel bar reinforcement exhibit more flexural
capacity of conventional reinforced concrete retaining walls (that can safely
function as a retaining wall), this type of wall can be deemed suitable for being
used as sway-prevented structures such as retaining walls.

79 | P a g e
3.8 Capacity Table from Test Results The Dincel prototype walls/blade walls provided to UTS were tested in
accordance with AS3600-2018, Appendix B at UTS Tech Lab. The test
procedure and results are complying with the requirements of Clause 2.2 with
respect to strength and Clause 2.3 with respect to serviceability. Summary of the
test results for a simply supported 3m long beam are presented in Table 7. For the
capacities which can be used by design engineers for design in accordance to AS
3600 – 2018, refer to Appendix 3.
Table 7 - Summary of tested loads and modulus of rupture values for a simply
supported 3m long beam
Capacity at 24 hours old concrete
Capacity at 28 days old concrete
WALL TYPE Pu (kN per
0.825m width) Mu (kN.m per 0.825m width)
Pu (kN per 0.825m width)
Mu (kN.m per 0.825m width)
Flex-Plain (275 Dincel + plain concrete)
51 34 62 41.3
Flex-BarChip (275 Dincel + fibre reinforced concrete)
63 42 89 59.3
Flex-Reo (275 Dincel + concrete reinforced with N16 steel bars @ 275mm centres)
N/A
N/A
186
123
3.9 Conclusions and Recommendations Based on the outcomes of this experimental investigation, it has been observed
that using BarChip 48 fibre reinforced concrete in 275 Dincel structural walling
panels instead of plain concrete can lead to 43.5% flexural strength improvement
and 25% stiffness enhancement at the age of 28 days. As a result, it can be
concluded that 275 Dincel structural walling panels filled with fibre reinforced
concrete can noticeably exhibit higher flexural strength, flexural rigidity and
stiffness compared to the walls filled with plain concrete. It is also understood
that using BarChip 48 fibre reinforcement in 275 Dincel structural walling panels

80 | P a g e
can produce nearly half of the flexural strength, flexural rigidity and stiffness
achieved by fully reinforced 275 Dincel structural walling panels while only
about one third of those values can be reached by using conventional plain
concrete in 275 Dincel structural walling-panels.
Based on the experimental measurements and theoretical comparison in this
study, it has become apparent that 275 Dincel structural walling panels filled
with BarChip 48 without steel reinforcement bars exhibit more flexural capacity
of conventional reinforced concrete walls, designed in accordance with AS3600-
2018 to function safely as retaining wall.
3.10 Design Certification in accordance with AS3600-2018
Dincel walls, when designed by a structural engineer using the information
provided in this report, will satisfy the deemed-to-satisfy provisions of the
National Construction Code for structural design.
In accordance with test results shown in this report as per Appendix B of
AS3600-2018, A/Professor Shami Nejadi as the chief investigator on behalf of
UTS (in his capacity) confirm that 275 Dincel structural walling panels filled with
mass concrete (with or without steel reinforcement), or filled with concrete
containing BarChip 48 macro-synthetic fibres, complies with AS3600-2018 for
being used as sway-prevented structures for flexural members such as retaining
walls. The capacities found in Table C of Appendix-3, can be used by a structural
engineer in lieu of appropriate calculation.
A/Professor Shami Nejadi: Date: 24/07/2020

81 | P a g e
APPENDICES
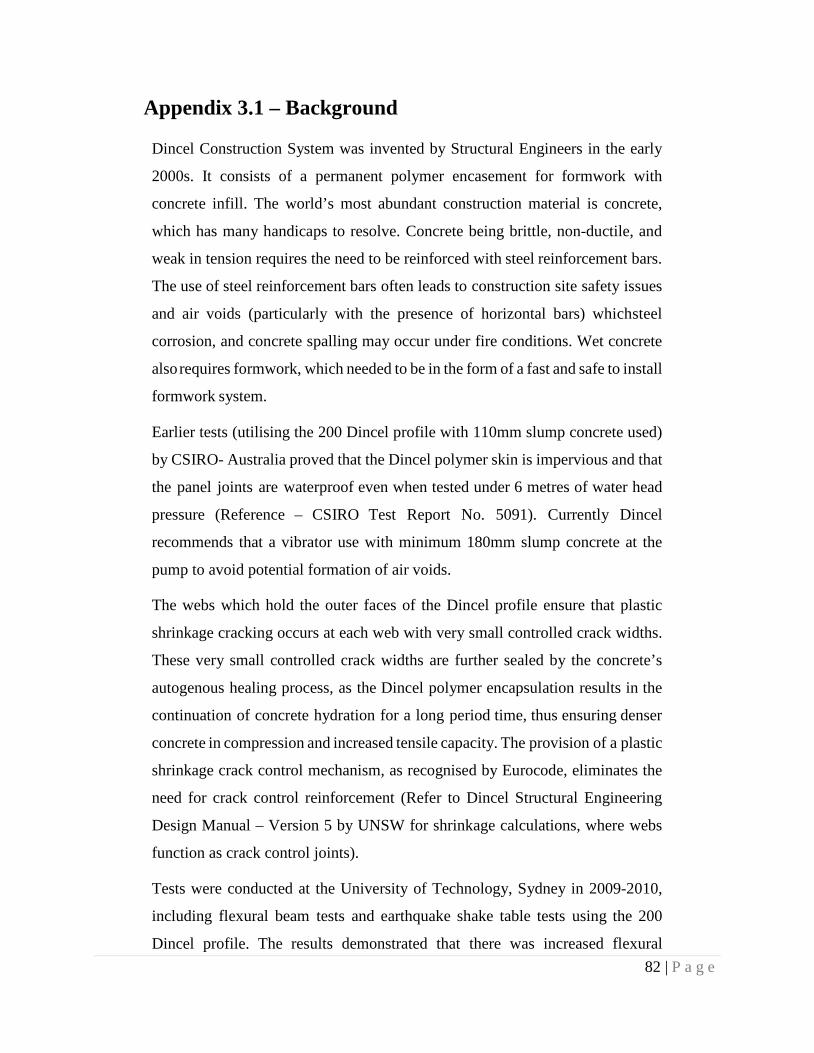
82 | P a g e
Appendix 3.1 – Background
Dincel Construction System was invented by Structural Engineers in the early
2000s. It consists of a permanent polymer encasement for formwork with
concrete infill. The world’s most abundant construction material is concrete,
which has many handicaps to resolve. Concrete being brittle, non-ductile, and
weak in tension requires the need to be reinforced with steel reinforcement bars.
The use of steel reinforcement bars often leads to construction site safety issues
and air voids (particularly with the presence of horizontal bars) whichsteel
corrosion, and concrete spalling may occur under fire conditions. Wet concrete
also requires formwork, which needed to be in the form of a fast and safe to install
formwork system.
Earlier tests (utilising the 200 Dincel profile with 110mm slump concrete used)
by CSIRO- Australia proved that the Dincel polymer skin is impervious and that
the panel joints are waterproof even when tested under 6 metres of water head
pressure (Reference – CSIRO Test Report No. 5091). Currently Dincel
recommends that a vibrator use with minimum 180mm slump concrete at the
pump to avoid potential formation of air voids.
The webs which hold the outer faces of the Dincel profile ensure that plastic
shrinkage cracking occurs at each web with very small controlled crack widths.
These very small controlled crack widths are further sealed by the concrete’s
autogenous healing process, as the Dincel polymer encapsulation results in the
continuation of concrete hydration for a long period time, thus ensuring denser
concrete in compression and increased tensile capacity. The provision of a plastic
shrinkage crack control mechanism, as recognised by Eurocode, eliminates the
need for crack control reinforcement (Refer to Dincel Structural Engineering
Design Manual – Version 5 by UNSW for shrinkage calculations, where webs
function as crack control joints).
Tests were conducted at the University of Technology, Sydney in 2009-2010,
including flexural beam tests and earthquake shake table tests using the 200
Dincel profile. The results demonstrated that there was increased flexural

83 | P a g e
capacity, ductility and resilience in comparison to conventional reinforced
concrete due to the concrete being encapsulated within the Dincel polymer
formwork.
Following the conclusion of the tests, Dincel developed the 275 Dincel profile.
A visual comparison of 275 Dincel profiles to a 200 Dincel profile can be sighted
within the below drawings and images.

84 | P a g e
The 275 Dincel profile achieves the following:
1) The internal ring structure allows the 275 Dincel profile to withstand significantly more wet concrete pressure, with pour heights of up to 6.5 metres in a single day being possible.
2) The perforated internal ring prevents the free fall of concrete aggregates; thus, segregation is prevented. Where required the concrete pump hose can be lowered as well.
3) The perforated internal ring provides a form of anchor, where with conventional formwork the wet concrete normally lifts the conventional formwork. Therefore, the elaborate anchoring typically required for conventional formwork is eliminated.
4) It is significantly more robust when compared to the 200 Dincel profile, thus can handle foot traffic, and resist product failure due to damage to the webs (i.e. due to transportation, carnage, incorrect lifting of product packs, and construction abuse issues).
5) Capability of a single pour height in excess of 4.5 metres with high slump wet concrete. This together with the patented barbed joint connection at the snapped panel locations, and a 6mm gap between interconnecting panels, ensure that concrete slurry without aggregates fully invades the panel joints to add further waterproofing assurance at the panel joints. Refer to Detail ‘A’ within the above drawing.

85 | P a g e
Appendix 3.2 – Load Tables
The test specimens were subject to a span of 3 metres and are supported by a
roller and a pin at UTS Tech Lab. Such a support case does not exist in real life
based on the typical concrete wall to footing connection, and concrete wall to the
slab-over connection in a propped cantilever such as a basement wall. If these
partial restraints which are present in real-life are considered, the test results
become very conservative.
In real-life, the following are more realistic to adopt:
i) For a wall supported by buttresses. Adopt the wall spanning horizontally between buttresses where at one end there will be a pin support (i.e. moment = zero), and the other end the element will be continuous (i.e. moment at support point is not zero).
ii) For a wall which is designed as a propped cantilever. Assume that the support condition at the base/footing can be pin support (i.e. moment = zero), or a fixed support (i.e. moment ≠ 0) and at the top the wall is supported by a floor concrete slab (i.e. moment at support point is not zero).
Load Combination; All structures must be designed to support their own weight
along with any superimposed forces, such as the dead loads from other materials,
live loads, wind pressures, seismic forces, snow and ice loads, and earth
pressures. These vertical and lateral loads may be of short duration such as those
from earthquakes, or they may be of longer duration, such as the dead loads of
machinery and equipment. Because various loads may act on a structure
simultaneously, load combinations should be evaluated to determine the most
severe conditions for design. These load combinations vary from one document
to another, depending upon the jurisdiction. The goal of strength design is to
proportion the structures that it can resist rarely occurring loads without reaching
a limit or failure state. “Rarely occurring” is understood to be a load that has about
a 10% chance of occurring within the 50- year life of a typical structure. Since
most of the loads prescribed by the building code are expected to occur during
86 | P a g e
the life of the structure, these actual or specified code loads are increased by
prescribed load factors to determine the rarely occurring, ultimate load for which
failure is to be avoided. The load factors used in the strength design load
combinations have been determined to account for the following:
• Deviations of the actual loads from the prescribed loads.
• Uncertainties in the analysis and distribution of forces that create the load effects.
• The probability that more than one extreme load effect will occur simultaneously.
In accordance to AS/NZS 1170.0:2002, Clause 4.2.3 (page-17), the standard clearly
mentions
1. For earth pressure Clause 4.2.3 (f) that the load factor is 1.5 if the load
has not been determined by an ultimate limit states method. The design
engineer need to be aware that many Geotechnical Engineering Reports
currently provides the loads according to ultimate limit states method.
The example shown below adopts the load factor of 1.5 in case such
Geotechnical Engineering input not available to the design engineer.
For water pressure Clause 4.2.3 (e) states for a given (i.e. known)
ground water level (e.g. water level confirmed by geotechnical report)
the load factor nominated is 1.2. Design engineer can make a decision on
the water load factor when the water level is known and not subject to
fluctuation. Naturally water level cannot be higher than the total wall
height hence the factor of 1.2 can be adopted when water load is
considered for the full height of the wall. The following example adopts
the load factor of 1.5 for the full wall height as the object of this exercise
that the proposal presented in this appendix conservatively addresses the
design intent.

87 | P a g e
Assumptions:
• Ka = 0.33, Earth/Soil density = 20 kN/m3 • Water density = 9.8 kN/m3 • Surcharge loading = 5 kPa • Safety factors used for calculation of M* (factored bending moment):
Surcharge loading = 1.5 Earth loading = 1.5 Water loading = 1.5

88 | P a g e
Earth + Compaction/Surcharge loading (for example – a retaining wall) - Case 1 Support Conditions
• Base support = Pin connection • Top support = Pin connection

89 | P a g e
Table A1 – Design/Factored positive bending moments (Case 1 Support Conditions - pin support at base, pin support at top) for wall heights 3, 3.5, 4 ,4.5 or 5 m respectively
Wall Height (H)
+M* (kN.m per metre run)
3.0 metres 19.6
3.5 metres 30.5
4.0 metres 44.9
4.5 metres 63.1
5.0 metres 88.2
Earth + Compaction/Surcharge loading (for example – a retaining wall) - Case 2 Support Conditions
• Base support = Pin connection • Top support = Fixed connection

90 | P a g e
Table A2 – Design/Factored positive bending moments (Case 2 Support Conditions - pin support at base, fixed support at top) for wall heights 3, 3.5, 4, 4.5 or 5 m respectively
Wall Height (H)
+M* (kN.m per metre run)
3.0 metres 12.7
3.5 metres 19.8
4.0 metres 29.1
4.5 metres 41.1
5.0 metres 57.4

91 | P a g e
Earth + Compaction/Surcharge loading (for example – a retaining wall) - Case 3 Support Conditions
• Base support = Fixed connection • Top support = Fixed connection

92 | P a g e
Negative bending moments are not tabulated in below Table B2. Design
engineers to use steel bars for the negative bending moments.
Table A3 – Design/Factored positive bending moments (Case 3 Support Conditions - fixed support at base, fixed support at top) for wall heights 3, 3.5, 4 ,4.5 or 5 m respectively
Wall Height (H)
+M* (kN.m per metre run)
3.0 metres 6.5
3.5 metres 10.1
4.0 metres 14.9
4.5 metres 20.9
5.0 metres 29.1

93 | P a g e
Water pressure loading (for example – a water retention tank wall) - Case 1 Support Conditions
• Base support = Pin connection • Top support = Pin connection

94 | P a g e
Table B1 – Design/Factored positive bending moments (Case 1 Support Conditions - pin support at base, pin support at top) for wall heights 3, 3.5, 4 ,4.5 or 5 m respectively
Wall Height (H)
+M* (kN.m per metre run)
3.0 metres 25.7
3.5 metres 40.8
4.0 metres 60.9
4.5 metres 86.8
5.0 metres 119
Water pressure loading (for example – a water retention tank wall) - Case 2 Support Conditions
• Base support = Pin connection • Top support = Fixed connection
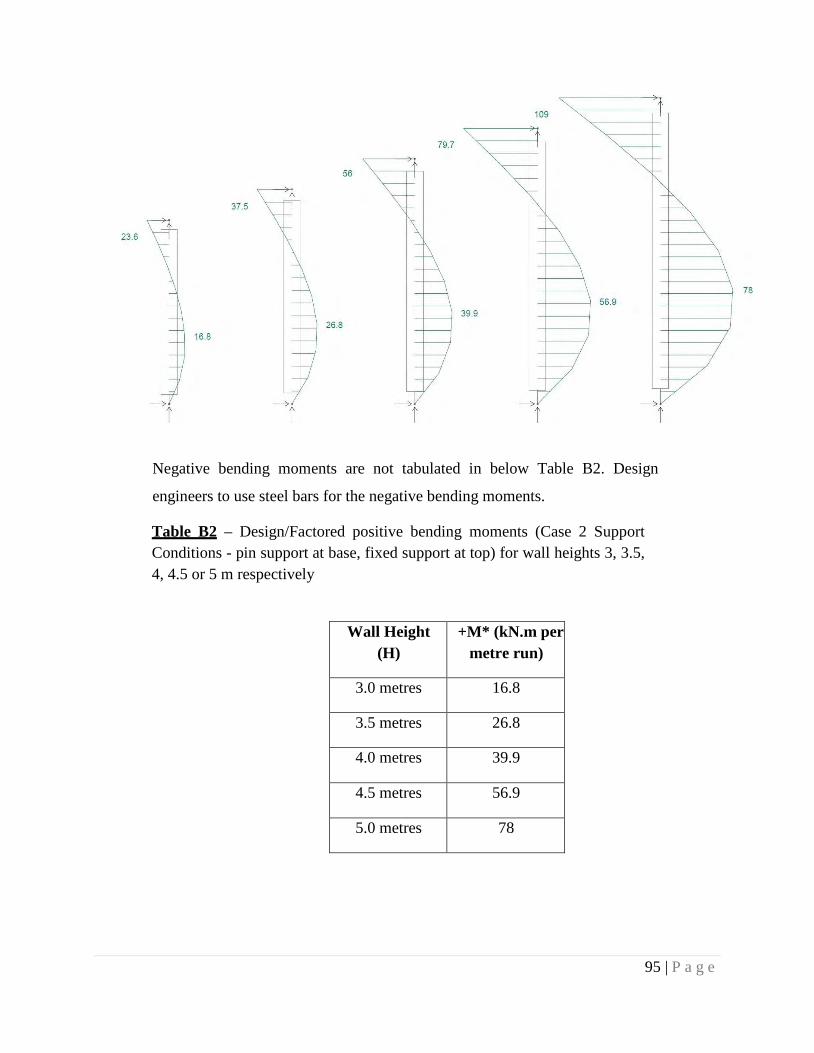
95 | P a g e
Negative bending moments are not tabulated in below Table B2. Design
engineers to use steel bars for the negative bending moments.
Table B2 – Design/Factored positive bending moments (Case 2 Support Conditions - pin support at base, fixed support at top) for wall heights 3, 3.5, 4, 4.5 or 5 m respectively
Wall Height (H)
+M* (kN.m per metre run)
3.0 metres 16.8
3.5 metres 26.8
4.0 metres 39.9
4.5 metres 56.9
5.0 metres 78

96 | P a g e
Water pressure loading (for example – a water retention tank wall) - Case 3 Support Conditions
• Base support = Fixed connection • Top support = Fixed connection

97 | P a g e
Negative bending moments are not tabulated in below Table B3. Design
engineers to use steel bars for the negative bending moments.
Table B3 – Design/Factored positive bending moments (Case 3 Support Conditions - fixed support at base, fixed support at top) for wall heights 3, 3.5, 4 ,4.5 or 5 m respectively
Wall Height (H)
+M* (kN.m per metre run)
3.0 metres 8.4
3.5 metres 13.4
4.0 metres 20.0
4.5 metres 28.5
5.0 metres 39.1

98 | P a g e
Summary of Loadings , Relevant Positive Bending Moments and Support Conditions
Negative bending moments are not shown on the below table. Refer each load case
calculation page for negative Bending Moments.
Wall Height
(m)
Load Type 1 Load Type 2 Load Type 3 +M*
Case 1
+M* Case 2
+M* Case 3
+M* Case 1
+M* Case 2
+M* Case 3
+M* Case 1
+M* Case 2
+M* Case 3
3 19.6 12.7 6.5 25.7 16.8 8.4 45.3 29.5 14.9 3.5 30.5 19.8 10.1 40.8 26.8 13.4 71.3 46.6 23.5 4 44.9 29.1 14.9 60.9 39.9 20.0 105.8 69 34.9
4.5 63.1 41.1 20.9 86.8 56.9 28.5 149.9 98 49.4 5 88.2 57.4 29.1 119 78 39.1 207.2 135.4 68.2
Load Type 1 – Earth + Compaction/Surcharge loading
Load Type 2 – Water pressure loading
Load Type 3 – Earth + Surcharge + Water Pressure loading. The buoyancy
effect on the soil in waterlogged conditions has been ignored by adopting
the dry soil density for conservatism. Load Type 3 has been derived through
the addition of Types 1 and 2, which is also a conservative approach (as the
maximum bending moments occurs at different wall heights). The design
engineer can calculate the exact bending moments if necessary.
Case 1 Support Conditions – Where pin connections have been provided at both the
top and bottom of the wall. May be applicable for when early backfilling a Dincel wall,
where the concrete is only cured for 24 hours. In this case, there is not an adequate bond
strength developed between the starter bars and the concrete, therefore there is no
bending moment at the connections and both connections are considered as pin
supports.
Case 2 Support Conditions – Where a fixed connection has been provided at the top of the
wall, such as where a high degree of bars are used to tie the slab to the top of the wall and
concrete has sufficiently cured. Pin connection at the bottom of the wall if a lower amount of
starter bars are utilised.

99 | P a g e
Case 3 Support Conditions - Where a fixed connection has been provided at the top
and bottom of the wall, such as where a high degree of bars are used to tie the wall to the
slabs and the concrete has sufficiently cured.

100 | P a g e
Appendix 3.3 – Design in accordance to AS 3600 – 2018
Capacity Table in accordance to AS 3600 – 2018 , Design information:
1. Concrete with 10mm max aggregate size, 180mm slump at the pump. f’c (28 days) = 32 MPa, f’c (24 hours) = approx. 5 MPa
2. For convenience purposes, the test results (based on a test width of
utilising 3 × 275 Dincel profiles = 0.825m width) have been converted to
1 metre design widths in the table below.
The Capacity Reduction Factor (Ø) should be determined in accordance with
the current version of AS3600-Section2. In this example following
comments are considered;
AS3600-2018 Table 2.2.2 Capacity Reduction Factors (Ø) is strictly
applicable to when steel bars are used. Dincel 275 has been tested at UTS,
the data obtained by UTS demonstrates significant ductility as shown in
the diagrams provided by UTS at the first part of this report. The designer
can adopt the following;
• Table 2.2.4 fibres in tension Ø= 0.7 Or
• More appropriately, Dincel is a tested system by UTS which demonstrates high ductility performance therefore Table 2.2.5 Ø= 0.7 can be adopted
3. For testing purposes, the Dincel wall specimens were all tested in the
horizontal orientation (whereas in real-life, walls are vertically
orientated). As a result, there is the effect of the self-weight of the
specimens creating an additional load and bending moment, which are
not present in real-life application of vertically orientated Dincel walls.
Ignoring the weight of the 275 Dincel formwork, the self-weight = 1m
width × 0.27m concrete thickness × 24 kN/m3 = 6.48 kN/m per metre
width. For simplicity, use 2/3 of the maximum moment (i.e. moment

101 | P a g e
coinciding at the location of the externally applied point load) due to the
self-weight UDL = (6.48 kN/m × 3m × 3m/ 8) × 2/3 = 4.86 kN.m per
metre width. The table below accounts for the self-weight when used as
a wall for the tested specimens. Wall type 4 in Table C below is the
theoretically calculated value by UTS which does not include M= 4.86
kN.m per metre width
4. The designer can compare the capacities given in the table below to the
load tables A 1, A2 and B1 and B2 from Appendix 2 for their design
decision.
Table C – Capacity table for tested samples (wall Types 1, 2 and 3) or theoretically
calculated conventionally formed reinforced concrete wall Type 4
Wall Type
Capacity at 24 hours old concrete Capacity at 28 days old concrete
Mu (kN.m per
metre)
Mu (kN.m per
metre) with addition of self-weight
ØMu (kN.m per
metre) Ø=0.7
Mu
(kN.m per metre)
Mu (kN.m per
metre) with addition of self-weight
ØMu (kN.m per
metre) Ø=0.7
1
Flex-Plain (275 Dincel Formwork + plain concrete)
41.21
46.07
32.25
50.06
54.92
38.44
2
Flex-BarChip (275 Dincel Formwork + fibre reinforced concrete)
50.91
55.77
39.04
71.88
76.74
53.72
3
Flex-Reo (275 Dincel Formwork + concrete reinforced with N16 steel bars @ 275mm centres
N/A (Note 1)
N/A (Note 1)
N/A (Note 1)
149.09 (Note 3)
153.95
107.77
4
Conventionally formed reinforced concrete wall with p=0.25% as per AS 3600 clause 11.7.1.a
N/A (Note 2)
N/A (Note 2)
N/A (Note 2)
70.18 (Note 4)
N/A
49.13

102 | P a g e
The above capacity values for Modulus of Rupture for Wall Types 1, 2, and 3 are
based from Table 7 (which show the capacity values for 0.825m wide tested,
simply supported 3m spanning specimens). The above capacity values have been
converted to 1m wide design strips for the purposes of direct comparison with
Tables A1, A2 and/or B1, B2 shown in Appendix 2.
Table Notes
1. 275 Dincel formwork + 24 Hours old concrete; Concrete has a low
strength at 24 hours, the bond strength between concrete and steel bars
would not represent any considerable value. Hence no tests at 24 hours
old concrete for system 3 took place.
2. Conventional concrete wall with removable formwork + 24 hours old
concrete; Concrete has a low strength at 24 hours, the bond strength
between concrete and steel bars would not represent any considerable
value, therefore ignore any capacity.
3. 275 Dincel formwork + 28 old concrete Flex-Reo specimens are
reinforced with N16 steel reinforcement vertical bars spaced at 275mm
centres in Dincel Wall. These bars are only required to be installed at the
face of the wall which will be in tension, with 50mm clear cover (see
drawing below).
4. Conventional Formwork + 28 days old concrete ;
Theoretical strength values calculated from first principles as follow:
Width= 3 × 275 = 825 mm, Formwork Depth including Dincel Formwork
= 275 mm, Overall Concrete Depth = 270 mm,
p= 0.25% (minimum AS3600 clause 11.7.1.a); 270 × 825 × 0.25% = 557 mm2
adopted for comparison purposes.
dst= 270 - (50-2.5) - 16/2 = 214.5 mm for 16 mm diameter bar use, and
fc’ = 32 MPa
Mu = 57.9 kNm for 825 wide panel OR Mu = 70.18 kNm per 1m wide panel

103 | P a g e
Where more capacity is required, 275 Dincel with N16, N20, or N24 longitudinal
reinforcement bars at 275mm centres (Dincel webs work as crack
inducers/controllers, hence horizontal steel for crack control purposes is not
required) can also be used in any harsh environment for the following reasons:
1. Technical literature demonstrates that there is nothing within the natural
environment which can destroy PVC.
2. Dincel panel joints as tested by CSIRO are waterproof.
3. Adequate concrete cover within the permanent membrane encapsulation
is always provided to any steel reinforcement bars.
4. Dowel bars at the cold joint between the footing and Dincel Wall can be
over-sized for corrosion allowance and/ or hot-dip galvanised.