Embed Size (px)
Citation preview
ANALYSIS, DESIGN AND
IMPLEMENTATION AN ACCOUNTING
INFORMATION SYSTEM BASED ON REA
REXHINA BLLOSHMI
BACHELORS DEGREE
EPOKA UNIVERSITY
2015
ANALYSIS, DESIGN AND
IMPLEMENTATION AN ACCOUNTING
INFORMATION SYSTEM BASED ON REA
BY
REXHINA BLLOSHMI
Thesis submitted to the Faculty of Economics and Administrative Sciences, Epoka
University, In Fulfilment of the Requirement for the Degree of Bachelor Studies
June 2015

i
DEDICATION
To my family and Dori for being my inspiration!
ii
ABSTRACT
Accounting Information System is a way being used by businesses to generate accurate
record keeping and financial reports and also to keep data secure by processing information
provided by users which can be used by all interested parties that have legitimate access. Financial
reports are needed to determine the financial health of the company and it is in the interest of all
the stakeholders of the company such as owner, creditors, investors, suppliers, general tax office
etc. IT people are trying to make these processes easier by implementing faster computer based
systems that aid accountants and lately even non-accountants to perform their job.
There are a lot of problems related to traditional accounting systems and modern
accounting models are required to give more efficient solutions about those problems. In these
thesis are discussed some accounting data models that try to optimize traditional accounting model.
Among different accounting models discussed in this thesis I have chosen REA to
implement an integrated enterprise system. It is provided a detailed analysis of REA and also the
design of this model that helps us in implementing the system. Then some details about the
implementation are provided.
This system intends to generate some of the main financial and managerial reports that are
needed in an enterprise. The work will be more accurate and faster thus increasing performance.
I believe that a well-designed accounting model is a competitive advantage for
organizations that adapt it.
Keywords: accounting, accounting information system, financial reports, REA,
enterprise
iii
ABSTRAKT
Sistemet e Informacionit te Kontabilitetit janë një mënyrë që përdoret nga bizneset e
ndryshme për të gjeneruar raporte financiare dhe për të regjistruar të dhëna korrekte dhe gjithashtu
të sigurta duke përpunuar informacionin e futur nga përdoruesit që mund të përdoret nga të gjitha
grupet e interesuara që kanë leje ligjërisht për të përdorur sistemin. Raportet financiare nevojiten
për të treguar situatën financiare të kompanisë, gjë e cila është në interesin e pronarëve, kreditorëve,
investitorëve, furnizuesve, zyrës së taksimit te shtetit etj. Profesionistët e fushës së teknologjisë së
informacionit janë munduar t’i thjeshtojnë këto proçese duke implementuar sisteme të shpejta
kompjuterike që ndihmojnë kontabilistët dhe jo vetëm ata, por edhe menaxherët të kryer punën e
tyre.
Sistemet tradicionale të kontabilitetit kanë shumë probleme dhe për këtë arsye modelet
moderne të kontabilitet kërkohet të kushtojnë më shumë kohë për të gjetur zgjidhje më efiçente
rreth këtyre problemeve. Në këtë tezë diskutohen disa modele kontabiliteti që mundohen të
optimizojnë modelet e kontabilitetit tradicional. Midis modeleve të ndryshme të kontabilitetit që
diskutohen në këtë tezë, unë kam zgjedhur REA për të implementuar një system të integruar për
një ndërmarrje. Teza përmban një analizë të detajuar të modelit REA dhe gjithashtu një dizenjim
të këtij modeli që më ndihmon në implementimin e sistemit. Më pas janë dhënë disa detaje rreth
implementimit. Ky sistem ka për qëllim të gjenerojë disa nga raportet financiare dhe menaxheriale
kryesorë që nevojiten në një ndërmarrje. Puna do të jetë më korrekte dhe e shpejtë duke rritur në
këtë mënyrë performancën. Unë besoj se një model kontabiliteti i ndërtuar si duhet është një
avantazh konkurues për ndërmarrjet që e përdorin atë.
Fjalë kyçe: kontabilitet, sistemet e informacionit të kontabilitetit, raporte financiare,
REA, ndërmarrje
iv
ACKNOWLEDGEMENTS
I would like to express my deepest gratitude to my supervisor, Igli Hakrama, for guiding,
encouraging and criticizing me throughout my time as his student and especially during my thesis
work.
I would like to thank all the professors at Epoka University that never denied to give
answers to my questions and for challenging me extend my knowledge beyond the constrains of
the book.
In particular I would like to express how grateful I am to Dorjan Hitaj for never letting me
down and for being the best team member in every project during all these three years.
THANK YOU

v
DECLARATION
I hereby declare that the thesis is based on my original work except for quotations and
citations which have been duly acknowledged. I also declare that it has not been previously or
concurrently submitted for any other degree at Epoka University or other institutions.
Rexhina Blloshmi
June 14, 2015
vi
Table of Contents
DEDICATION.................................................................................................................... I
ABSTRACT ...................................................................................................................... II
ABSTRAKT..................................................................................................................... III
ACKNOWLEDGEMENTS ........................................................................................... IV
DECLARATION.............................................................................................................. V
LIST OF ABBREVIATIONS ......................................................................................... X
CHAPTER 1 INTRODUCTION .................................................................................... 1
CHAPTER 2 LITERATURE REVIEW ........................................................................ 5
2.1 Accounting data models ............................................................................................... 6
2.2 Problems with traditional accounting systems........................................................... 6
2.3 Items, Agents, Cash accounting model (IAC) ............................................................ 7
2.4 Events accounting system (EAS) ................................................................................. 8
2.5 Resource Event Agent accounting model (REA) ....................................................... 9
2.5.1 Usage of REA model through years ................................................................................... 10
2.5.2 Critics against REA ............................................................................................................. 12
CHAPTER 3 ANALYSIS AND DESIGN OF REA .................................................... 13
3.1 REA model .................................................................................................................. 13
3.2 REA diagrams ............................................................................................................. 15
3.2.1 Revenue cycle ....................................................................................................................... 16
3.2.2 Expenditure cycle ................................................................................................................ 22
3.2.3 Conversion cycle .................................................................................................................. 28
vii
CHAPTER 4 STRUCTURAL DESIGN OF AIS ........................................................ 34
4.1 Class Diagram ............................................................................................................. 34
4.2 REA Model .................................................................................................................. 36
4.3 Component Diagram .................................................................................................. 39
4.4 Deployment Diagram ................................................................................................. 40
CHAPTER 5 IMPLEMENTATION ............................................................................ 41
5.1 Implementation ........................................................................................................... 42
5.1.1 Resource tables .................................................................................................................... 42
5.1.2 Events Tables ....................................................................................................................... 43
5.1.3 Agents tables ........................................................................................................................ 44
5.1.4 Pieces of codes ...................................................................................................................... 44
5.2 Demonstration............................................................................................................. 47
CHAPTER 6 CONCLUSION AND FUTURE WORK .............................................. 52
REFERENCES AND BIBLIOGRAPHY ..................................................................... 54
APPENDIX A CLASS DIAGRAM ................................................................................ A
APPENDIX B REA SYSTEM SCREENSHOTS .......................................................... B
viii
TABLE OF FIGURES
Figure 1. Duality of events .......................................................................................................................... 14
Figure 2: Agents and the related dualities ................................................................................................... 14
Figure 3: Flow of events in revenue cycle .................................................................................................. 18
Figure 4: REA model in revenue cycle ....................................................................................................... 19
Figure 5: Association and Cardinalities between Resources, Events and Agents in revenue cycle ........... 20
Figure 6: Flow of events in expenditure cycle ............................................................................................ 23
Figure 7: REA model in expenditure cycle ................................................................................................. 24
Figure 8: Association and Cardinalities between Resources, Events and Agents in Expenditure cycle .... 25
Figure 9: Flow of events in conversion cycle ............................................................................................. 29
Figure 10: REA model in conversion cycle ................................................................................................ 30
Figure 11: Association and Cardinalities between Resources, Events and Agents in conversion cycle..... 31
Figure 12: Part of REA Class Diagram ....................................................................................................... 35
Figure 13: Database of the system .............................................................................................................. 38
Figure 14: Component Diagram for REA system ....................................................................................... 39
Figure 15: Deployment Diagram for REA system ...................................................................................... 40
Figure 16: Inventory table ........................................................................................................................... 42
Figure 17: Raw_Material database table ..................................................................................................... 43
Figure 18: Customer order database table ................................................................................................... 43
Figure 19: Supplier order database table ..................................................................................................... 43
Figure 20: Sale database table ..................................................................................................................... 44
Figure 21: Purchase database table ............................................................................................................. 44
Figure 22: Supplier database table .............................................................................................................. 44
ix
Figure 23: Employee database table ........................................................................................................... 44
Figure 24: Login Page Demonstration ........................................................................................................ 48
Figure 25: Main Panel page Demonstration ............................................................................................... 49
Figure 26: Financial Reports Panel Demonstration .................................................................................... 49
Figure 27: Inventory view Demonstration .................................................................................................. 50
Figure 28: Employee view Demonstration ................................................................................................. 50
Figure 29: Customer creation Demonstration ............................................................................................. 51
Figure 30: Customer Order Demonstration ................................................................................................ 51
Figure 31: Complete Class Diagram ............................................................................................................. a
Figure 32: Cash Flow Report ........................................................................................................................ b
Figure 33: Inventory Report .......................................................................................................................... b
Figure 34: Supplier Orders Demonstration ................................................................................................... c
Figure 35: Editing supplier order .................................................................................................................. c
Figure 36: Inserting a new Supplier .............................................................................................................. d
Figure 37: Registering a new sale ................................................................................................................. d
Figure 38: Receive Debts registration ........................................................................................................... e
Figure 39: Make Order to supplier ................................................................................................................ e
x
LIST OF ABBREVIATIONS
AIS – Accounting Information System
MIS- Management Information System
REA – Resources, Events, Agents
ERP – Enterprise Resource Planning
IAC – Items, Agents, Cash
EAS – Events Accounting System
IT – Information Technology
IS –Information System
PHP- Hypertext Preprocessor
CSS – Cascading Stylesheet
PDF- Portable document format
MVC- Model, View, Controller
UML- Unified Modelling Language
1
Chapter 1
INTRODUCTION
As years pass, the role of technology in daily life is increasing tremendously. Not only my
generation, but even older generation cannot live without these technological tools that have made
life much easier and more complete. Technology has become an important participant in every
field, home, street, airports, factories and of course in business area. Large businesses have
incorporated technology in their processes at an earlier time, but medium and especially small
businesses are a little bit sceptic in using technology due to its costs. But nothing costs to have a
computer and some necessary software installed in it in order to manage better the business.
Albania is a small country, which has been a dictatorship till 1990 and therefore technology
and internet are not for long introduced to people. There were no businesses at all. Since businesses
are new for Albania, they are not so developed with latest technology and whatsoever.
In order for a business to be successful a lot of management and organization is needed. If
a businessman is not able to record all the transactions, inventories, cash flows etc. in the proper
way this can cause for a business to bankrupt. And not only this, but is it obligatory for all type of
businesses to report their financial health to government for taxation issues. In Albania, most of
the cases, the owner is also the manager or anything, and they do not have a lot of knowledge about
how to write the financial reports of their businesses. In most of the cases they send some raw data
to an accountant who prepares some financial reports which are not fully correct since the data
collected by owners may have leaked or a lot of them are noted down incorrectly.
One of the most important functions in a business is accounting. It is considered to be the
language of business. Accounting origin dates back to ancient Mesopotamia while first auditing
2
systems originate from old Egypt and Babylonia, and it is highly correlated with the development
of counting, writing and money. As countries were developing and were going towards monetary
economics, in 13th century it was presented a breakthrough in accounting field, double entry
bookkeeping. From then, this method is still being one of the most important features of accounting,
even though it has evolved over time. Nowadays it is a must for all businesses to keep track of
their financial situation, to generate reports that aid in managerial decision making and serve as
information for interested parties.
IT people are trying to give computer based solution to every real life problem. Technology
is developing with gigantic steps and it is spreading its activity in every field, especially in business.
It is thought to be one of the success catalyst in enterprises since it makes every process faster and
more accurate. IT professional has come up with brilliant ideas in aiding business functional areas
such as sales and marketing, human resources (HR), manufacturing etc. Organizations are adapting
technology to increase their overall performance by performing processes faster and more accurate.
Since accounting is a function that is used for internal management decisions and also for
external informative report to interested stakeholders such as creditor, shareholders, investors,
taxation authority and other parties that interact with the enterprise, it is of high interest to work in
eliminating inefficiencies in this field. Accounting Information System is the set of all
technological attempts to optimize accounting in enterprise. It is part of Management Information
system (MIS) and is a way being used by businesses to generate accurate record keeping and
financial reports and also to keep data secure by processing information provided by users which
can be used by all interested parties that have legitimate access [7].
3
One of the challenges that IT people face since 20th century is implementing an accounting
model that best fits the requirements of ERP systems, such as integrating most common functional
areas of an enterprise in one system, operating in real time and not relying on updates that take
place once in a period of time. Such a system supports activities between different departments
such as sales and marketing, human resources (HR), finance and accounting, production and
manufacturing, and this is achieved due to a central database that stores information about all these
activities and this information can be used by interested departments thus increasing overall
performance of the enterprise through communication and interaction. It is said that accounting is
in the center of ERP systems.
In this thesis it will be analyzed and designed a web based AIS system based on REA
accounting model. REA was presented in 1982 by McCarthy and it serves as one best models in
implementing an AIS and also ERP systems. This web application will make it easier for
accountants and non-accountants to manage their businesses. Furthermore it will be an application
of high performance due to REA structure that removes redundancies.
In the first part of the thesis I would like to state the research done by other experts of IT
or accounting area. Then I will present my analysis. In the analysis and design part of this thesis I
am going to explain REA features and also the REA structure related to a manufacturing company.
The reason I have chosen a manufacturing one is that it most of the functional areas of a business
such as sales, purchases, accounting and finance and manufacturing. To sum it up a manufacturing
company has all three cycles of a business, the revenue cycle, expenditure cycle and conversion
cycle.
A detailed design of the model will be done that will aid me in building the system. Then
in the implementation section, it will be given information about the technologies used and how

4
these technologies are cooperating with each other. Also there will be shown some of the most
important functions of the system.
As a conclusion it is given some of the competitive advantages of REA, is revised the
work done so far and are proposed future improvements in the implementation of the system.
5
Chapter 2
LITERATURE REVIEW
In this chapter I am going to introduce some of the papers and books that have helped me
to get an insight in Accounting Information Systems and from which I learned what accounting
models or data structures other people are developing during years to make computer based
accounting easier and more efficient. The sources I have chosen to base my studies on are written
by foreign researchers since these models that I am including in my thesis are not known in Albania.
Albania is still using traditional system which has its own problems that I will mention below and
no one till today has proposed a better solution.
Accounting is a crucial function in all the businesses. All of them are obligated to deliver
some detailed reports to General Tax Office of the country they operate in. Most of financial
reports are calculated by licensed accountants since for an ordinary businessman it is quite difficult
to handle this job. For a long period of time, accountants were constrained to record every
transaction and generate reports manually since no computer based models were available. But
nowadays, IT people have come up with some more efficient solutions in accounting information
systems which had a lot of benefits. Computer based accounting systems require the user to enter
all the transactions and all the accounts are updated immediately. It is faster and easier to
manipulate data, generate period reports and what is the most important fact to consider is that all
these processes are at high accuracy compared to manual accounting.
6
2.1 Accounting data models
As mentioned above in this thesis Accounting Information Systems is one of the most
actual fields where IT people are giving their attention and contribute to build more sophisticated
data models that cover all business requirements. Before such systems were developed,
accountants recorded every transaction and financial data in paper by hand, which might lead to
errors and some information might be left out. AIS not only make this job easier but also at high
accuracy. A lot of data models are analyzed and designed by business professionals and IT people.
Hoberman defines data model as a tool that aids both businessman and IT people to explain the set
of real information accurately by using symbols and text in order to improve the internal
communication in an organization thus leading to a flexible application environment [8].
Since accounting includes a lot of important business processes it is worthy to design an
efficient data model that handles all the information in a well-organized way.
2.2 Problems with traditional accounting systems
A lot of organizations are still using traditional accounting systems that appear to have a
lot of problems that can be eliminated in the computer based systems. Such problems are
redundancy and data duplication. Furthermore traditional accounting systems are used only by
accountant and it is difficult to be understood by non-accountants. Double entry bookkeeping,
debits and credits just increase the duplication of data and lower the performance of the whole
system. It is unnecessary to keep such accounts in computer systems.
It is important to mention that Double Entry is not a concept of redundancy even though
term double may suggest so, the way of how the data are stored is redundant. The concept of
double entry is the main feature of accounting showing that there are always two parts in a
7
transaction, the give and receive part. But if the transaction is stored twice, that’s what causes
redundancy and data duplication.
Double entry bookkeeping is a way of preventing system usefulness, since the data cannot
be manipulated easily to generate reports of certain purpose or be used in other processes.
Therefore the range of users that can use the data is also restricted [1]. Some of latter AIS such as
REA or IAC get rid of accounts such as Accounts receivable and payable since they are
unnecessary information that can be calculated in real time by simple queries.
2.3 Items, Agents, Cash accounting model (IAC)
IAC is an accounting model that is presented in 2004 by Ferran and Salim in their paper
“IAC Accounting Data Model: A better data structure for Computerized Accounting Systems” [2].
IAC accounting model is designed to remove redundancies of traditional accounting models.
According to traditional accounting model there are a lot of data that are being repeated
such as in General Ledger and also in Adjusted Trial Balance where the totals are calculated. There
is a high redundancy in Accounts Receivable and Accounts Payable accounts as well. If a purchase
is made on account, it should be stored in invoice, in bank journal and also in Accounts Payable.
It is obvious that there is a triple redundancy and this causes a lot of unnecessary data to be stored.
According to the concept of normalization in relational database, redundancy should be removed
in every case when it is possible. For this reason, Salim and Ferran introduced IAC as a better data
structure for AIS. This data structure removes a lot of redundancies through a new accounting
database. In case of Accounts receivable or payable, IAC removes all the tables mentioned above,
and stores the data in a table named AgentTransactions thus increasing performance and

8
decreasing redundancy. In the same logic, other redundancies are also eliminated thus having a
more efficient accounting system. IAC enables the creation of a lot of detailed financial reports.
Different from traditional system it is easier to generate the reports due to well-structured database.
As a conclusion Ferran and Salim state that IAC is easier to implement, removes redundancy and
also is not just a theoretical data structure but is currently used by a considerable number of
companies.
2.4 Events accounting system (EAS)
Benita Cox in one of her published papers has studied some of the accounting models in
order to suggest the most appropriate one in meeting organizational requirements, which according
to Cox are “accountability” and “usefulness” [1]. EAS is an accounting system that was firstly
presented in 1969 by Sorter [13]. He stated that an accounting model should maintain the economic
events related information in order to enable the users to generate their reports according to their
inputs in their own model. Events accounting requires to record and disseminate information
instead of forecasting or summarizing. Different from traditional accounting systems that use
ledgers and journals to record information, EAS uses so called base elements which are multiple
entries that contain aggregated information. In order to better evolve an EAS, information system
researchers have used data oriented model grouped into two categories, infologic models which
represent the economic events and relationships between them that are conceptual models, and
datalogic models or implementation models, that transform conceptual models in a way that is to
be used by database management systems. Benita has highlighted the importance of accountability
and usefulness of information for an AIS. According to her assumptions, a limitation in existing
AIS is that they are modeled according to data perspective rather than a strategic one. A good
9
approach would be if it meets the requirements of multiple users. A combination of EAS with an
organization’s strategic business plan, which meets the requirements is SISP. The strategic
perspective enables EAS to collect information from multiple users and not only accountants.
Benita Cox concludes that a lot of work is to be done in order to integrate and extend the SISP
approach and translate the organization objectives into data requirements, to ensure that different
users’ interests are met.
2.5 Resource Event Agent accounting model (REA)
REA accounting model was firstly represented by William E. McCarthy in 1982 as a
framework for building accounting information systems in a shared data environment [10]. REA
is a model for re-engineering accounting for computer age. One of the main initial objectives of
REA was to switch isolated functional driven system by an integrated information system. Then a
second aim of REA framework was to build a whole enterprise wide architecture.
McCarthy listed the problems of traditional accounting system, among which there are:
Limited dimensions which prevents use of productivity, reliability, maintenance,
performance etc.
Classification schemes are not always well structured for a certain enterprise thus
causing some data to be left out.
Aggregation level is very high and since there is a variety of users which need to
generate reports according to their needs it is very difficult to collect information
about economic events or objects by a certain user.
Integration with other functional area of the enterprise is too limited which causes
inconsistency in information.
10
REA is designed as a generalized ER representation. The structure of this framework
should consists set of economic resources, events, agents and relationships between them.
McCarthy stated that this model enables accountants and even non-accountants to maintain
information about the same set of data. REA optimizes accounting information systems by
excluding some unnecessary data objects and emphasizes the importance of real objects such as
resources, events and agents. In the REA model such terms as asset and liability are not closely
tied to real time objects and also accounts such as accounts receivable or payable are excludes
from REA accounts since they can be calculated in real time by information available. By
removing these unnecessary accounts, REA increases the system performance and decreases
redundancy.
In the center of REA model there is a duality, especially an exchange duality which
represents the relationship between events. If one of the resources goes away in occurrence of an
event, there must be another resource entering in order to maintain the duality aspect.
2.5.1 Usage of REA model through years
In 1998, Nakamura and Johnson presented a framework which was based on REA [11].
They state that even though REA was presented by McCarthy as an accounting model it can be
used in different business areas such as control inventory, payrolls etc. The simplicity of REA is
that it does not maintain some artifacts of traditional accounting such as receivables, payables, but
it has some essential elements of accounting and the omitted ones can be calculated from REA
object models. This way of separating the important objects to be included in the framework from
the artifacts that are not needed in the computerized system has its own benefits such as: models
are clear and easy to understand, they can be reused in other applications and calculated artifacts
from the system will be always consistent with the models. This framework was built in active
11
object oriented programming language and queries thus increasing and improving computational
performance, uniformity and system adaptability. One of the features of REA is to keep atomic
information, which allows building a flexible framework and the challenge of building a system is
to make it efficient maintaining the simplicity of REA accounting model.
In 2001 McCarthy and Geerts discussed the usage of REA object template in engineering
business applications [4]. The main focus was to give solutions to business processes related
problems with aid of REA engineering. It was specified a three layer architecture for modelling
business processes as specifying enterprise level, describing REA processes and specifying
workflow. Some of their conclusions regarding to this approach are that REA can be used not
only for structuring and design of IS but even for business processes analysis, task analysis,
business modelling and also structuring of precise descriptions of enterprise value chain.
REA model is proposed as an enterprise ontology because of conceptual modeling way.
Ontologies are specification of objects or entities that are existing in different areas and how they
are related to each other. Ontologies enable improvements in communicating and reusing.
In 2000, Geerts and McCarthy analyze REA as an ontology [3]. They state that REA fits
the ontology definition but it has never been discussed from ontology perspective. They base their
analysis on John Sowa conceptualization [9]. Using terms of John Sowa, the REA ontological
categories are first-ness or independent, second-ness or relative and third-ness or mediating. About
the independent category they are mentioned the building blocks of an enterprise such as economic
resources, agents and events and commitments, in the second-ness category are included the
relationships between REA first-ness category elements which can be association, custody or
linkage, and in the third-ness category there are included relations between second-ness category
elements.
12
As technology is advancing day by day, the applicability of REA model is also increasing.
In 2014, Business Informatics Group from Vienna University of Technology proposed a generic
REA software architecture which is based in declarations and fragments [14].
2.5.2 Critics against REA
REA has been criticized by a lot of researchers [5, 15]. In a paper published in 1990, Hale
and Sutton mentioned some of REA limitations:
It is difficult to represent REA generalization relationships in an unambiguous and concise
way
To separate and represent the definition of generalizations into super and sub components
is not easy
The failure to represent composite categories relationship in a clear way
The absence of representing the temporal dimensions of AIS
These limitations could have been kind of well-defined for the period of time when they
were stated. The idea of object oriented was new and not everybody was able to have a clear view
of how REA could be built using objects.
13
Chapter 3
ANALYSIS AND DESIGN OF REA
This chapter is divided into three parts. In the first part will be analyzed the fundamental
REA model concepts. Three basic entities of REA are resources, events and agents. Resources are
all things that carry economic value to the enterprise, events are of two groups, economic and
support events and agents which are classified as internal or external agents. In the second part of
this section will be designed the REA diagrams for the entities and the associations and
cardinalities between them. After that all the individual diagrams will be integrated in an enterprise
wide diagram. In the third part of the section it will be discussed how to generate financial reports
that can be used by multiple users.
3.1 REA model
Resources are everything that have economic value to enterprise. They are owned by the
enterprise and are scarce. Resources are used in economic events by agents and their amount
increases or decreases. In order for an economic resource to increase another one should be
decreased. Most common examples of resources are raw materials, inventory, cash etc.
Events are processes that effect the increment or decrement of resources in the enterprise.
Events are categorized as economic events or support events. Economic events are those processes
that affect the amount of resources owned by the enterprise such as purchase, sale, produce
processes. Support events are those processes that does not affect the amount of resources owned
by the enterprise. More generally those events include planning, controlling or informing for a
specific case but do not cause a change in resources.
14
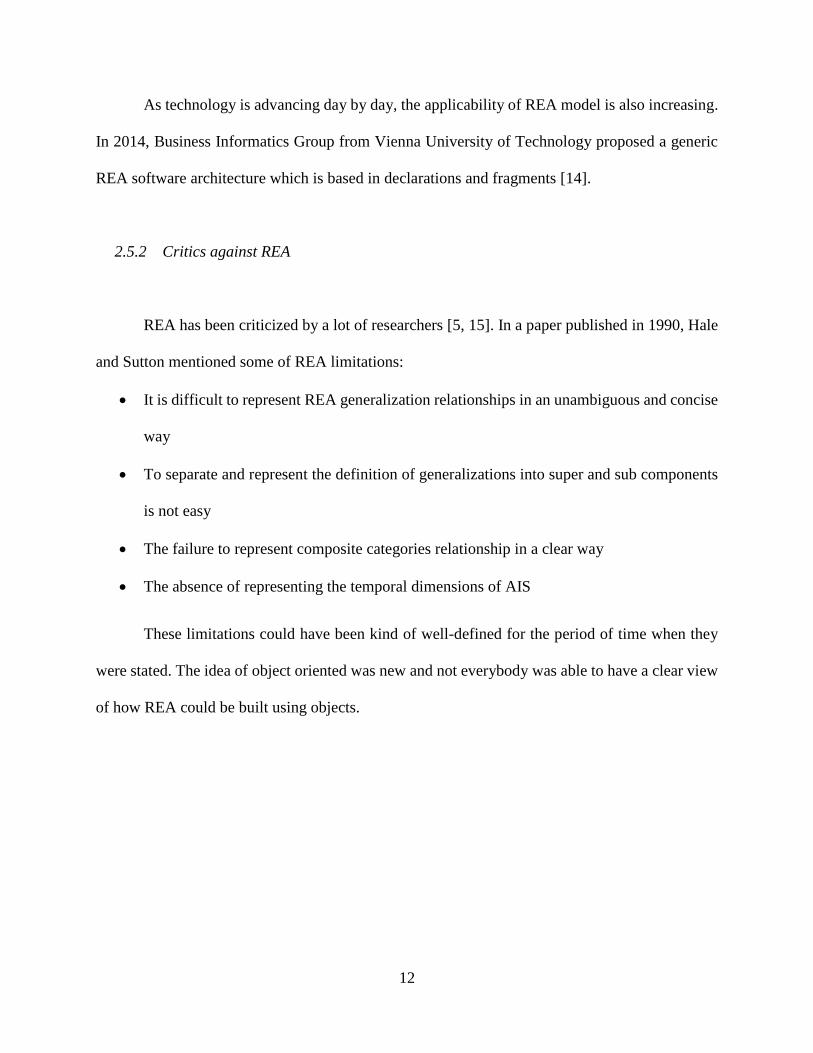
In the figure below are shown some of the most common examples of economic events.
Figure 1. Duality of events
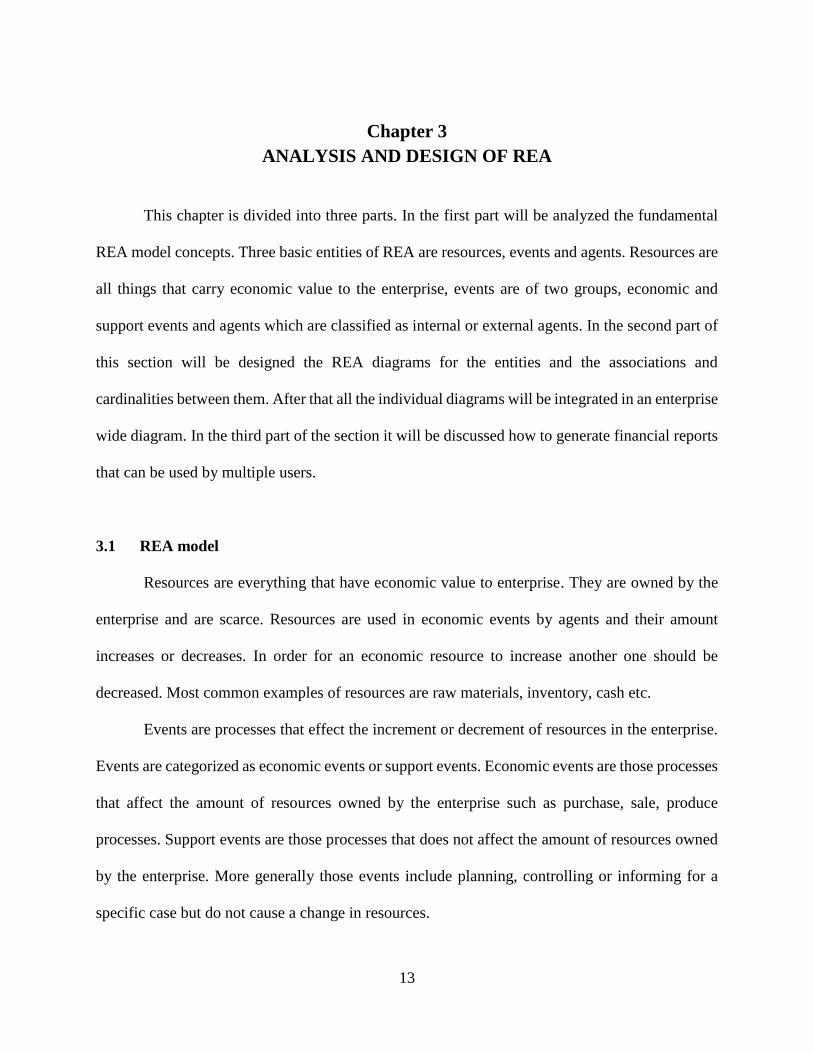
Agents are departments or even individuals who are participants in events. Agents have
the ability to affect the economic resources. They can be internal agents or external agents. In the
internal agents we can mention managers, accountants, workers etc., also called Employees. In
the other hand, external agents can be Customers that are involve in sale event and suppliers that
are involved in purchase event. Internal and external agents are also involved in support event
where instead of processes is exchanged information. For example if a customer wants to know
the material of a certain dress, he/she gets the information from the sales person, but nothing has
been changed in the resources. [6,12]
Figure 2: Agents and the related dualities
15
One of the most important features of REA is duality. In every event there must be at least
two agents, one of the agents gives and the other receives. One increment event is related to a
decrement event thus if one of enterprise resources is to be increased another one will decrease, so
one of the agents has to give a resources in exchange of another resource owned by the other agent.
It is obvious even in the schemas above that each give event is followed by a receive event and
vice versa, each increment is followed by a decrement thus maintaining the concept of duality.
A crucial fact to be mentioned is that the increment and decrement could happen in
different moments. For example in a sale event the sales person gives resource in the moment of
exchange process but may receive cash in a later time. Even though REA does not have accounts
receivable or payable information stored anywhere in the database, it keeps track of these accounts
by calculating the difference between the sales occurred and the cash received. REA model rejects
to use traditional artifacts such as debits or credits in order to reduce redundancy and increase the
performance of the system. But it makes it possible to generate all the financial reports as in
traditional accounting directly from the events table in the database.
3.2 REA diagrams
To make it more understandable and clear, I will start simple by building diagrams for each
of the entities separately and after that integrate all of them in an enterprise wide system. I would
like to base my work on manufacturing sector because it includes revenue cycle, expenditure cycle
and conversion cycle. Including all the business process into REA modelling will give a better
insight of what is the benefit of adapting REA in enterprise system. In Albania one of the most
16
common manufacturing business is furniture manufacturing. For this reason I will model REA
taking in consideration the resources, events and agents of this sector. [6]
To build a complete REA diagram 4 steps must be followed:
i. Identify events
ii. Identify resources
iii. Identify agents
iv. Identify the associations and cardinalities between each entity
There are three economic cycles in a manufacturing company, revenue cycle, expenditure
cycle and conversion cycle. Each of these cycles has its own events, resources and agents and the
relationship between these entities is different in every cycle. In the following sections, each of
the economic cycle of a manufacturing company will be described, analyzed and a REA diagram
will be modelled for the specific entities.
3.2.1 Revenue cycle
The revenue cycle in a furniture manufacturing company is as follows:
The customer goes to the company showroom, where the sales person presents the
company catalog to the customer and also explains the details and prices. If the customer decides
to order anything he is sent to sales manager. The sales manager takes the order from the customer
and necessary information and after signing a deal, he sends the order to the production manager.
After the production of the certain product, the shipping clerk deliveries it to the customer. The
financial manager records the transaction in the journal and prepares an invoice that is to be paid
by a preset date. When the customer pays cash to cash receipt clerk the financial manager records
17
the change and the cash resource is increased while accounts receivable for the customer are
decreased.
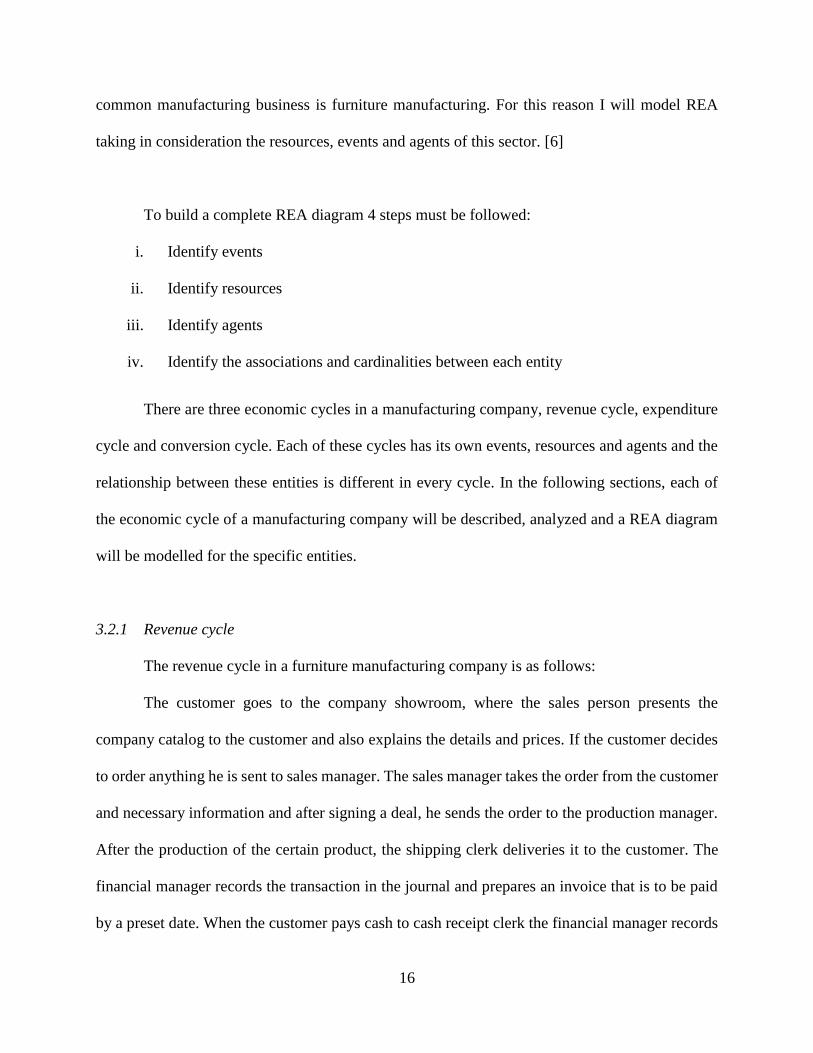
First step: Identify events
Events are the value added actions that all the agents of the company take. The event can
be economic or support events. The events in the example of revenue cycle are Check Catalog,
Take Order, Ship Product, Receive Cash and the other actions taken are not valid REA entities.
Some of the actions mentioned are support and some economic events, but it is important to
emphasize that in a model there must be at least two economic events that have opposite effects in
the inventory, increment and decrement events thus retaining REA duality concept. Production is
for sure an economic event but it is not included in the revenue cycle rather than in conversion
cycle which will be discussed later in this thesis.
One of the main purposes of REA is to record only those events that add value to the
organization, such as using cash to buy resources and then use these resources to generate revenues.
Posting data in the general ledger or recording payment on account does not add any value to
enterprise. For this reason REA removes the artifacts of traditional accounting such as debits,
credits, account receivable and payable since it find it unnecessary to keep records of these data
since they can be calculated easily using the information of transactions. For example the account
receivable is the difference between the sale to customer and cash received when the sale is paid.
Check Catalog is a support event because it does not affect the amount of inventory of the
company. The sales person is giving information to the customer. This event may not be included
in the model if the since it does not change anything, but if the manager wants to know which of
18
the products are most preferred by customers, to use it for further forecasting, it would be necessary
to keep track of this event.
Take order is a support event. It is a commitment for a sale to happen in the future, but
does not directly affect resources account.
Ship Product is an economic event. The inventory is decreased directly when a product is
delivered to the customer. This is the decrement half of the economic duality.
Receive Cash is an economic event and it is the increment half of the economic duality.
This event directly affects cash resource by increasing it.
Figure 3: Flow of events in revenue cycle
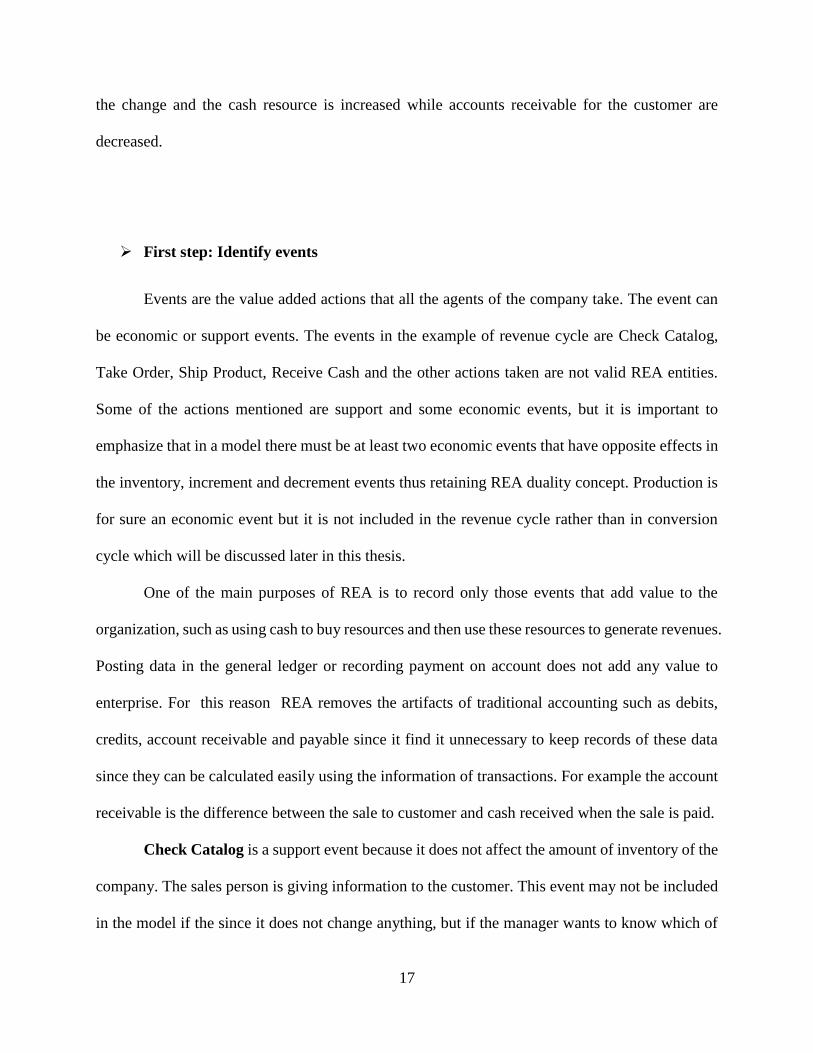
Second step: Identify resources
In the revenue cycle example there are two resources affected by the economic events. In
the Ship Product event the inventory or product resource is decreased and in the Receive Cash
event cash resource is increased.
Third Step: Identify agents
Each economic event has at least two agents as participants. Agents are classified as
internal and external agents. The only external agent related with all the events is Customer while
the internal agents are instances of Employee entity which are sales person, sales manager,
shipping clerk and cash receipt clerk.
19
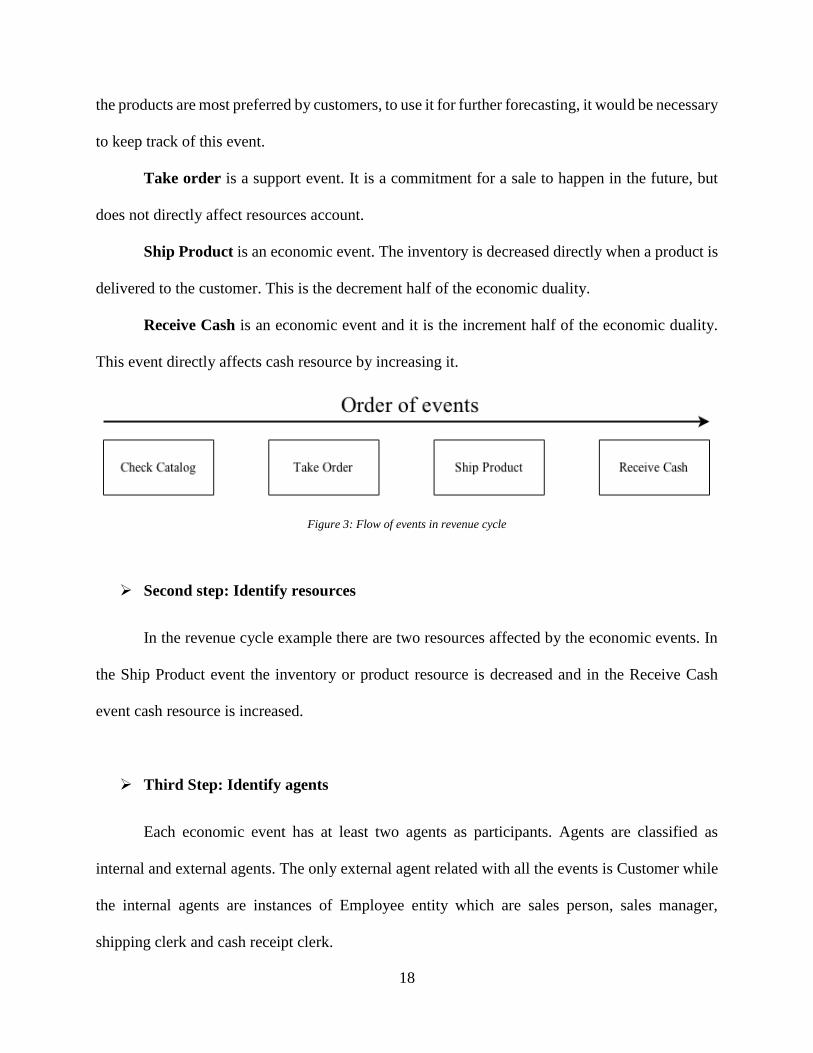
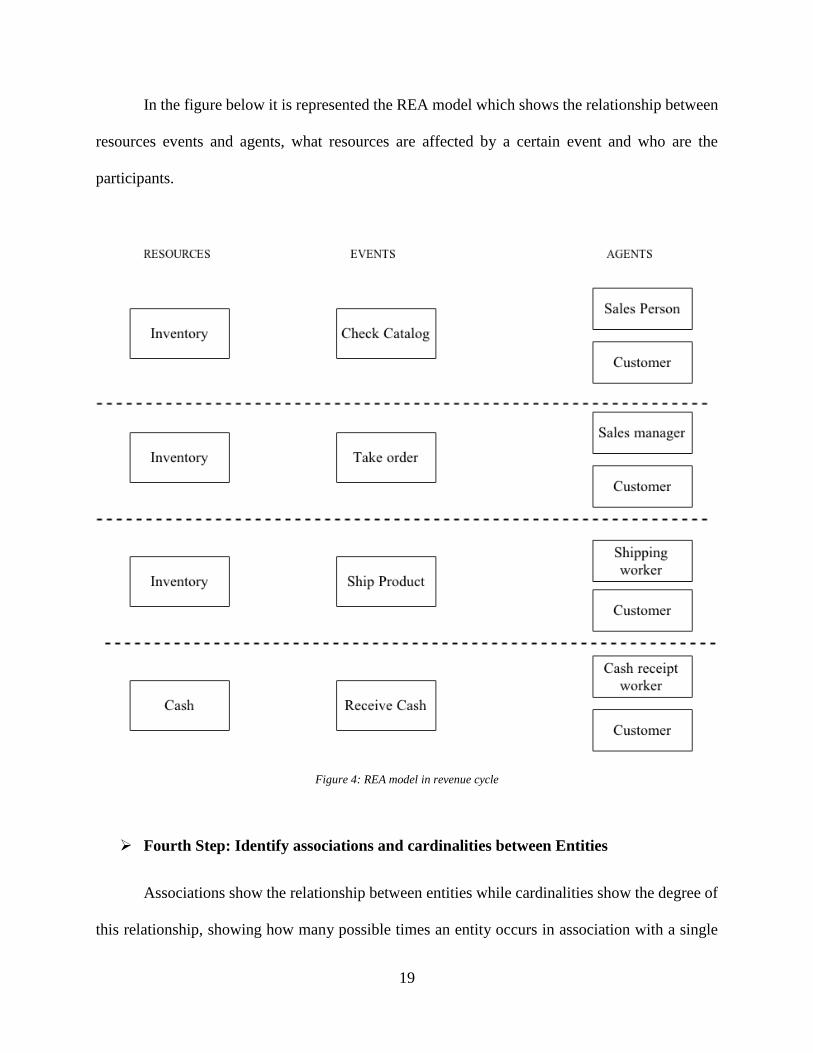
In the figure below it is represented the REA model which shows the relationship between
resources events and agents, what resources are affected by a certain event and who are the
participants.
Figure 4: REA model in revenue cycle
Fourth Step: Identify associations and cardinalities between Entities
Associations show the relationship between entities while cardinalities show the degree of
this relationship, showing how many possible times an entity occurs in association with a single
20
occurrence in the other related entity. There are four cardinality types, zero or one, one and only
one, zero or many and one or many.
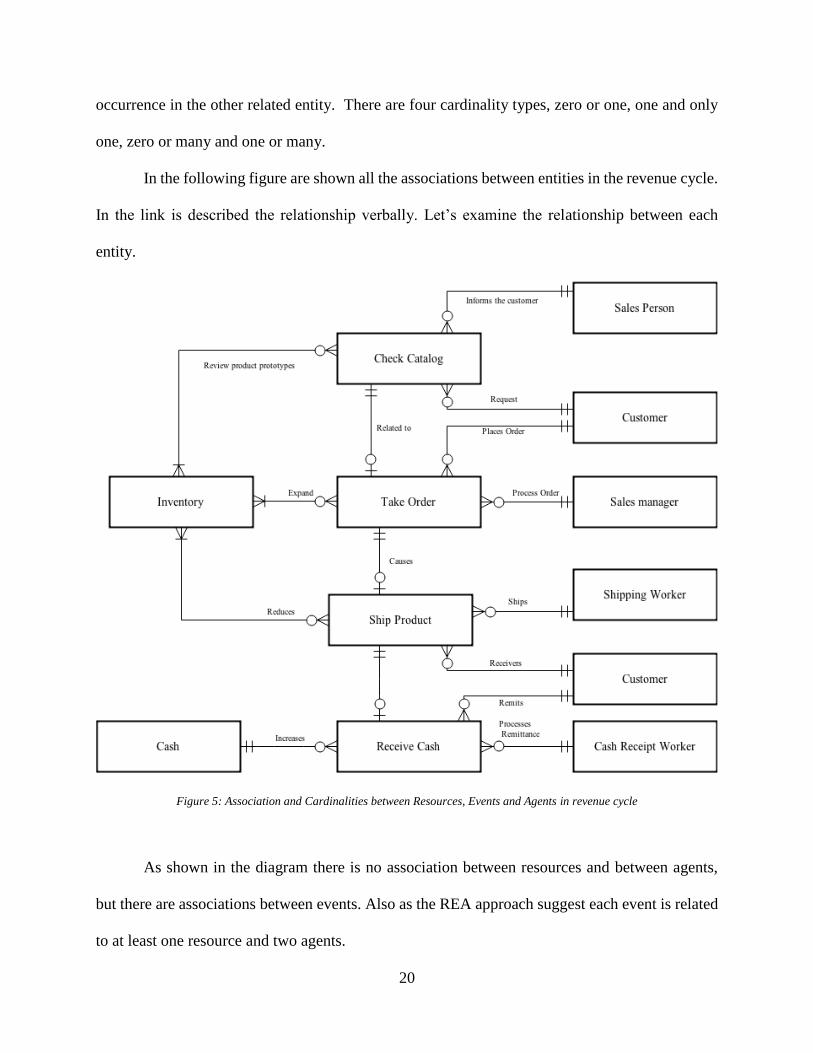
In the following figure are shown all the associations between entities in the revenue cycle.
In the link is described the relationship verbally. Let’s examine the relationship between each
entity.
Figure 5: Association and Cardinalities between Resources, Events and Agents in revenue cycle
As shown in the diagram there is no association between resources and between agents,
but there are associations between events. Also as the REA approach suggest each event is related
to at least one resource and two agents.
21
Association between Check Catalog and Take Order events
When a customer requires a certain product, Check Catalog event happens first to check
if the requested product is an available in the inventory or if it can be manufactured. Then, if
the product is available the customer can choose to buy it or not. Each Take order event
happens after a Check Catalog has happened, so there is a 1:1 cardinality in the Check Catalog
side. Then the customer can either order the product or not, so the cardinality in the Take Order
side is 0:1.
Association between Take Order and Ship Product events
If the customer orders a product, when the product is ready it is going to be delivered
to him. During this time no ship has occurred. So there is 1:1 cardinality exists in the Take
Order side and a 0:1 cardinality exists in the Ship Product side. The zero cardinality shows the
time difference between the moment when the order is taken and when it is shipped.
Association between Ship Product and Receive Cash events
Ship Product and Receive Cash are two duality processes. Ship Product is the give half
of the duality and Receive Cash is the receive half of the duality. The cardinality in the Ship
Product side is 1:1 because for Receive Cash to happen, a Ship Product event must have
occurred. While the cardinality in the Receive Cash side is 0:1 and this zero shows the time
difference from the moment the product is shipped to the moment the cash is received.
Associations of the Events with Agents
Each event has the cardinality 0:M in association with agents and each agent has the
cardinality 1:1 in association with events. 1:1 cardinality of agents means that one event must
22
have an agent representative and the 0:M cardinality means that an agent can be participant in
an event many times or none.
Association of Events and Resources
o Receive Cash event and Cash resource
The cardinality in the Cash side is 1:1 meaning that there is only one cash account
while the cardinality in the Receive Cash side is 0:M meaning that cash can be received
from many customers but it is deposited in only one Cash account.
o Check Catalog, Take Order, Ship Product events and Inventory resource
There exists a many to many relationship between each of these events and
Inventory resource. In the relationship between Check Catalog and Inventory the many-to-
many relationship means that the customer request may involve one or many items in
inventory while the items of inventory can be requested zero or many times by the customer.
So in the Check catalog side there is a 0:M cardinality and in the Inventory side there is
1:M cardinality. In the same logic in the relationship between Take Order and Ship Product
events with Inventory resource, the order/delivery might involve one or many items of
inventory, while the items of the inventory might have been ordered or shipped zero or
many times.
3.2.2 Expenditure cycle
The expenditure cycle in a furniture manufacturing company is as follows:
The production manager receives the order and checks the resources if the required raw
materials needed to produce the product are available. If there are not sufficient amount of raw
materials, the production manager has to buy them from the supplier. The missing items are
23
ordered by the purchasing clerk. When supplier completes the order, the production manager
receives items. The financial manager records the transaction in the journal and receives the
invoice from supplier that is to be paid in a preset date and records it in the account payable account.
When Cash Disbursement clerk pays cash to supplier, financial manager decreases cash account
and account payable is updated.
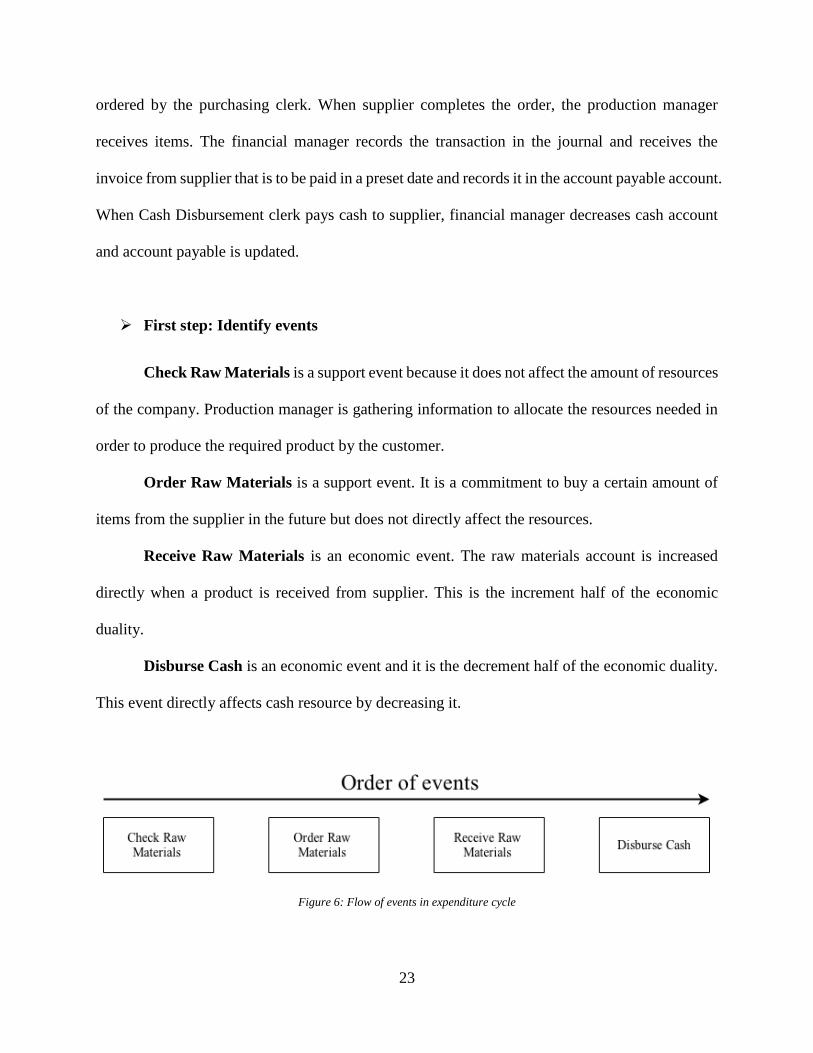
First step: Identify events
Check Raw Materials is a support event because it does not affect the amount of resources
of the company. Production manager is gathering information to allocate the resources needed in
order to produce the required product by the customer.
Order Raw Materials is a support event. It is a commitment to buy a certain amount of
items from the supplier in the future but does not directly affect the resources.
Receive Raw Materials is an economic event. The raw materials account is increased
directly when a product is received from supplier. This is the increment half of the economic
duality.
Disburse Cash is an economic event and it is the decrement half of the economic duality.
This event directly affects cash resource by decreasing it.
Figure 6: Flow of events in expenditure cycle
24
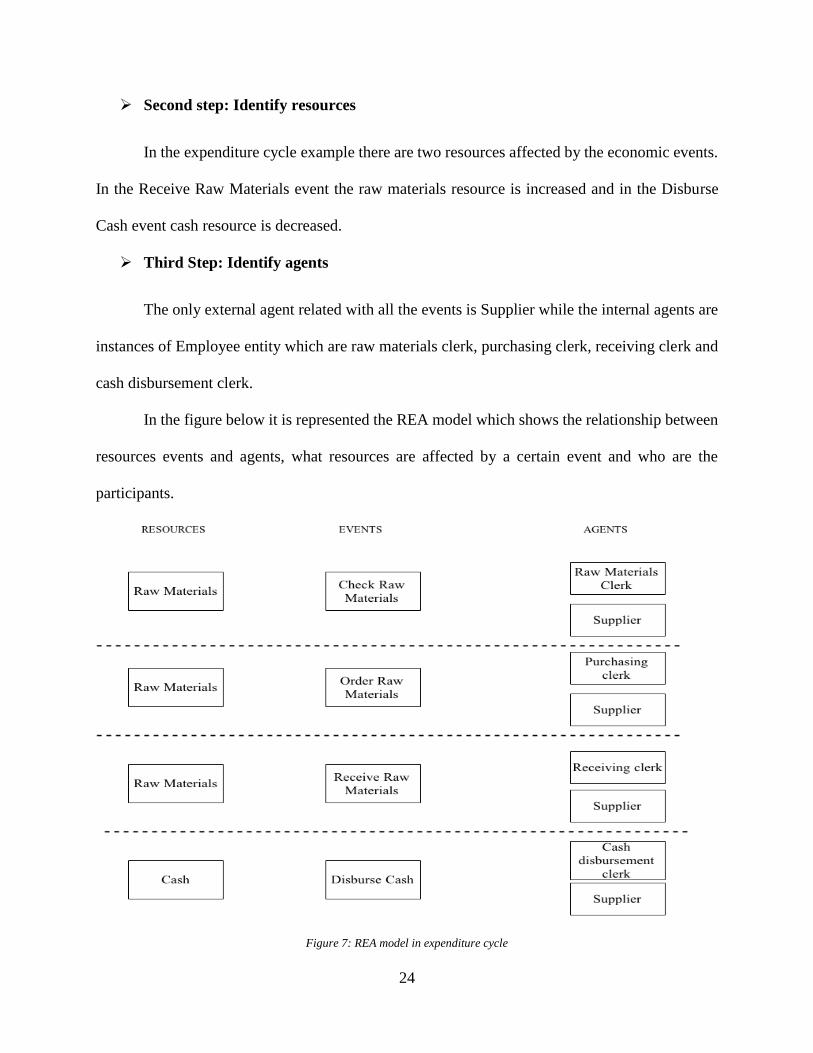
Second step: Identify resources
In the expenditure cycle example there are two resources affected by the economic events.
In the Receive Raw Materials event the raw materials resource is increased and in the Disburse
Cash event cash resource is decreased.
Third Step: Identify agents
The only external agent related with all the events is Supplier while the internal agents are
instances of Employee entity which are raw materials clerk, purchasing clerk, receiving clerk and
cash disbursement clerk.
In the figure below it is represented the REA model which shows the relationship between
resources events and agents, what resources are affected by a certain event and who are the
participants.
Figure 7: REA model in expenditure cycle
25
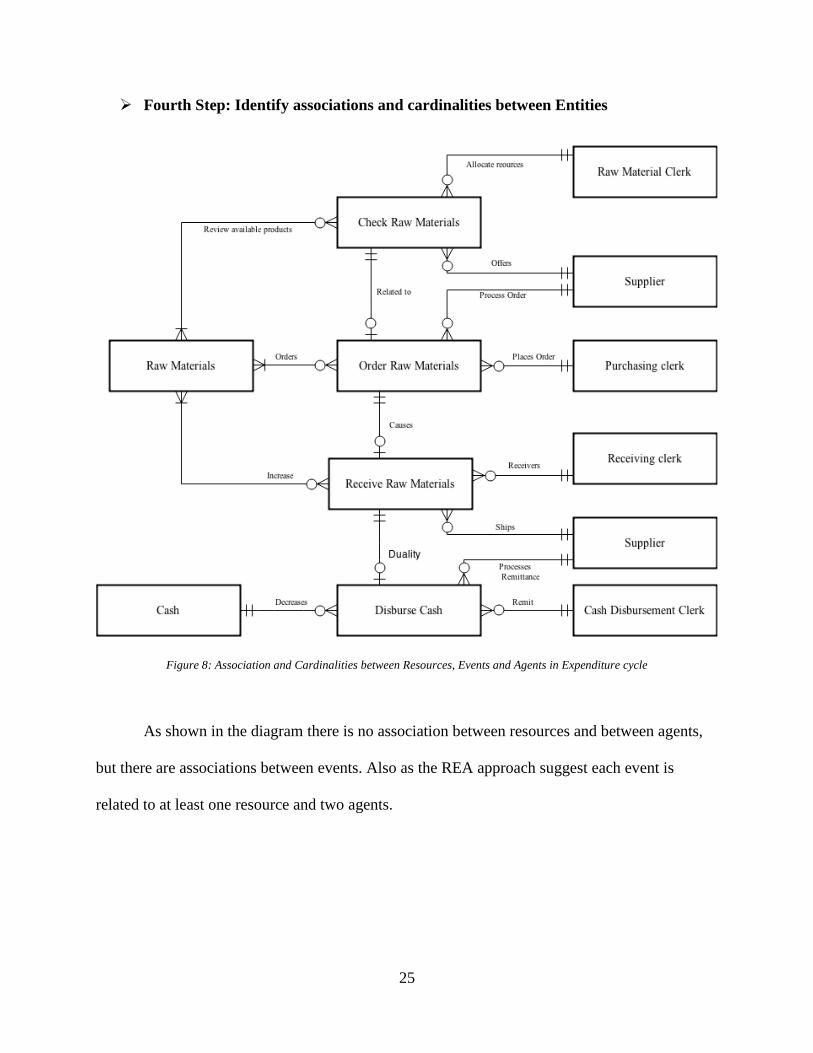
Fourth Step: Identify associations and cardinalities between Entities
Figure 8: Association and Cardinalities between Resources, Events and Agents in Expenditure cycle
As shown in the diagram there is no association between resources and between agents,
but there are associations between events. Also as the REA approach suggest each event is
related to at least one resource and two agents.
26
Association between Check Raw Materials and Order Raw Materials events
When a production manager allocated the resources needed for the production of a certain
product, he/she check the resources for raw materials needed. If raw materials needed are
missing, purchasing clerk orders them. The cardinality in the Check Raw Materials side is 1:1
which means that for each Order Raw Materials event a Check Raw Materials event has
happened, while the cardinality in the Order Raw Materials side is 0:1 meaning that the
purchasing clerk decides to buy the Raw Materials or not.
.
Association between Order Raw Materials and Receive Raw Materials events
If the purchasing clerk orders a product, the receiving clerk must wait until the product is
shipped by supplier. During this time no ship has occurred. So there is 1:1 cardinality exists
in the Order Raw Materials side and a 0:1 cardinality exists in the Receive Raw Materials side.
The zero cardinality shows the time difference between the moment when the raw materials
are ordered and when they are received.
Association between Receive Raw Materials and Disburse Cash events
Receive Raw Materials and Disburse Cash are two duality processes. Receive Raw Materials
is the receive half of the duality and Disburse Cash is the give half of the duality. The
cardinality in the Receive Raw Materials side is 1:1 because for Disburse Cash to happen, a
Receive Raw Materials event must have occurred. While the cardinality in the Disburse Cash
side is 0:1 and this zero shows the time difference from the moment the raw materials are
received to the moment the cash is disbursed.
27
Associations of the Events with Agents
Each event has the cardinality 0:M in association with agents and each agent has the cardinality
1:1 in association with events. 1:1 cardinality of agents means that one event must have an
agent representative and the 0:M cardinality means that an agent can be participant in an event
many times or none.
Association of Events and Resources
o Disburse Cash event and Cash resource
The cardinality in the Cash side is 1:1 meaning that there is only one cash account while
the cardinality in the Disburse Cash side is 0:M meaning that cash can be paid to one or
many suppliers but it is withdrawn from only one Cash account.
o Check Raw Materials, Order Raw Materials, Receive Raw Materials events
and Inventory resource
There exists a many to many relationship between each of these events and Raw
Materials resource. In the relationship between Check Raw Materials and Raw Materials,
the many-to-many relationship means that the production supervisor’s request may involve
one or many items in Raw Materials while the items of Raw Materials can be requested
zero or many times by the production supervisor. So in the Check Raw Materials side there
is a 0:M cardinality and in the Raw Materials side there is 1:M cardinality. In the same
logic in the relationship between Order Raw Materials and Receive Raw Materials events
28
with Raw Materials resource, the order/receipt might involve one or many items of Raw
Materials, while the items of the Raw Materials might have been ordered or receipt zero or
many times.
3.2.3 Conversion cycle
Conversion cycle is where production takes place. Production supervisor and raw materials
clerk decide the raw materials needed to produce a certain product. Raw materials clerk gives the
raw materials to the supervisor who assigns task to workers. They are using raw materials and their
skills to build final product. While product is being built it is on work in process inventory. Then
product is completed it is moved from work in process account to finished goods inventory. This
is an internal transaction and internal and external agents might not be so obvious. But we consider
the work in process clerk to be selling the product to finished goods clerk, so the work in process
clerk is the external agent whose resources are reduced and finished goods clerk is the internal
agent whose resources are increased.
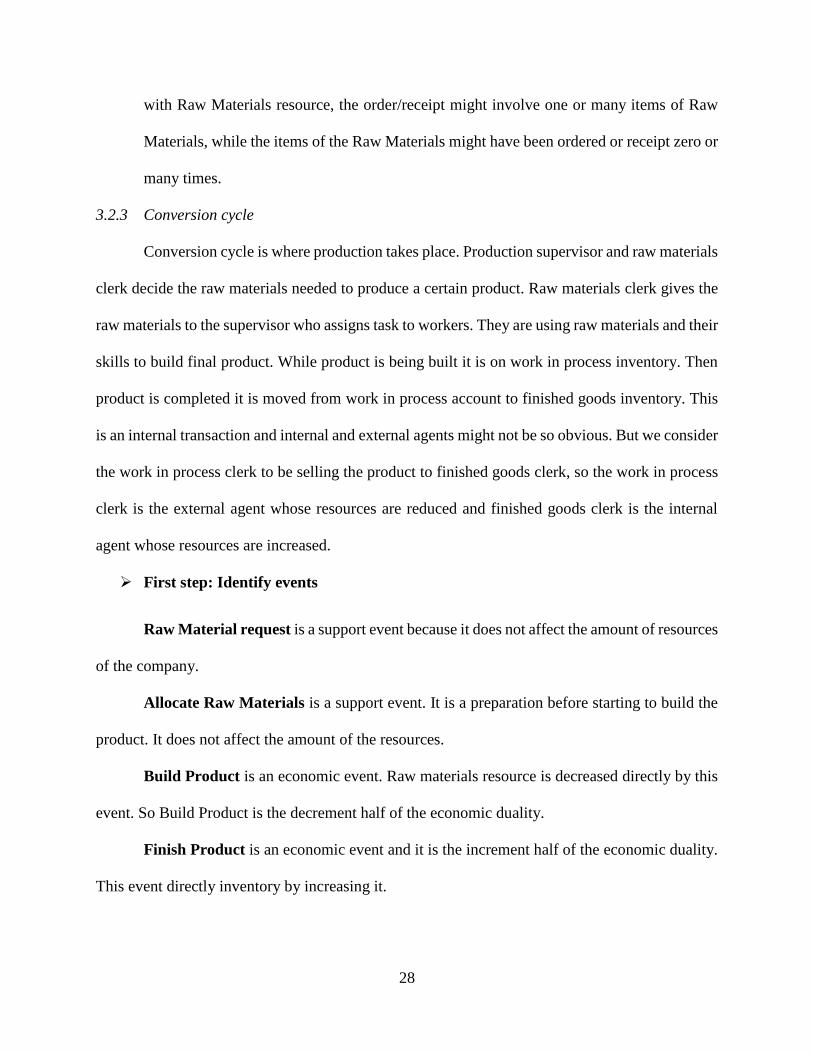
First step: Identify events
Raw Material request is a support event because it does not affect the amount of resources
of the company.
Allocate Raw Materials is a support event. It is a preparation before starting to build the
product. It does not affect the amount of the resources.
Build Product is an economic event. Raw materials resource is decreased directly by this
event. So Build Product is the decrement half of the economic duality.
Finish Product is an economic event and it is the increment half of the economic duality.
This event directly inventory by increasing it.
29
Figure 9: Flow of events in conversion cycle
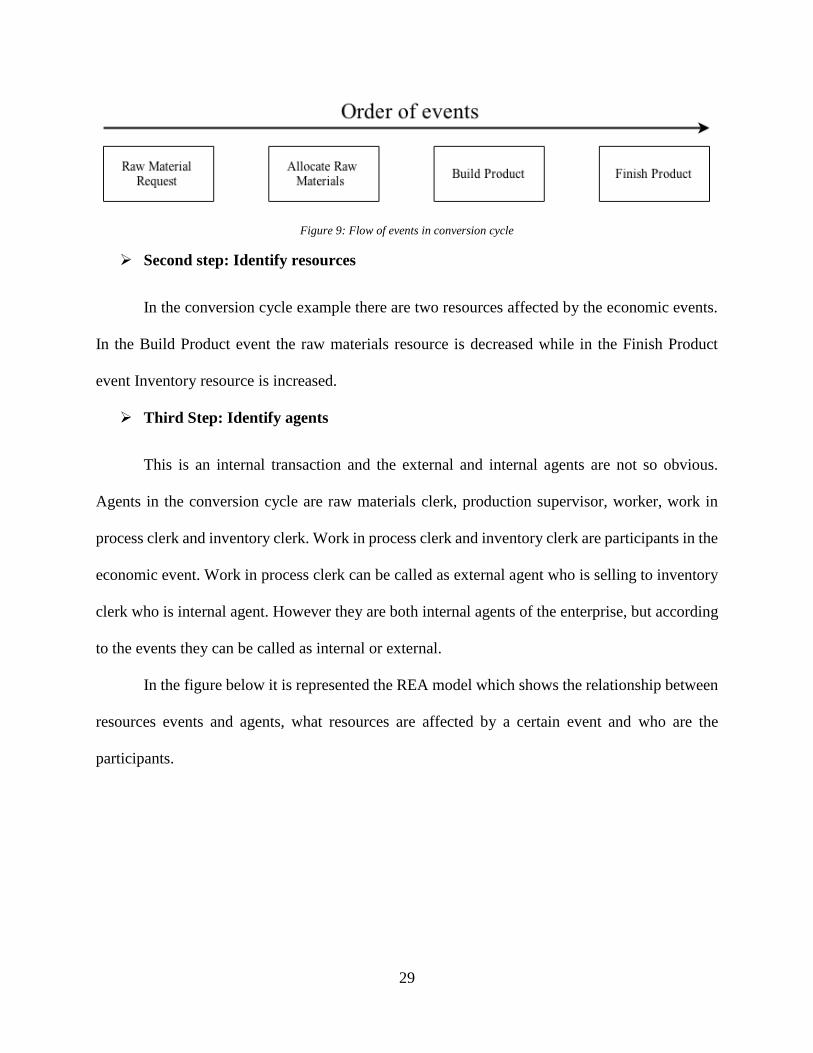
Second step: Identify resources
In the conversion cycle example there are two resources affected by the economic events.
In the Build Product event the raw materials resource is decreased while in the Finish Product
event Inventory resource is increased.
Third Step: Identify agents
This is an internal transaction and the external and internal agents are not so obvious.
Agents in the conversion cycle are raw materials clerk, production supervisor, worker, work in
process clerk and inventory clerk. Work in process clerk and inventory clerk are participants in the
economic event. Work in process clerk can be called as external agent who is selling to inventory
clerk who is internal agent. However they are both internal agents of the enterprise, but according
to the events they can be called as internal or external.
In the figure below it is represented the REA model which shows the relationship between
resources events and agents, what resources are affected by a certain event and who are the
participants.
30
Figure 10: REA model in conversion cycle
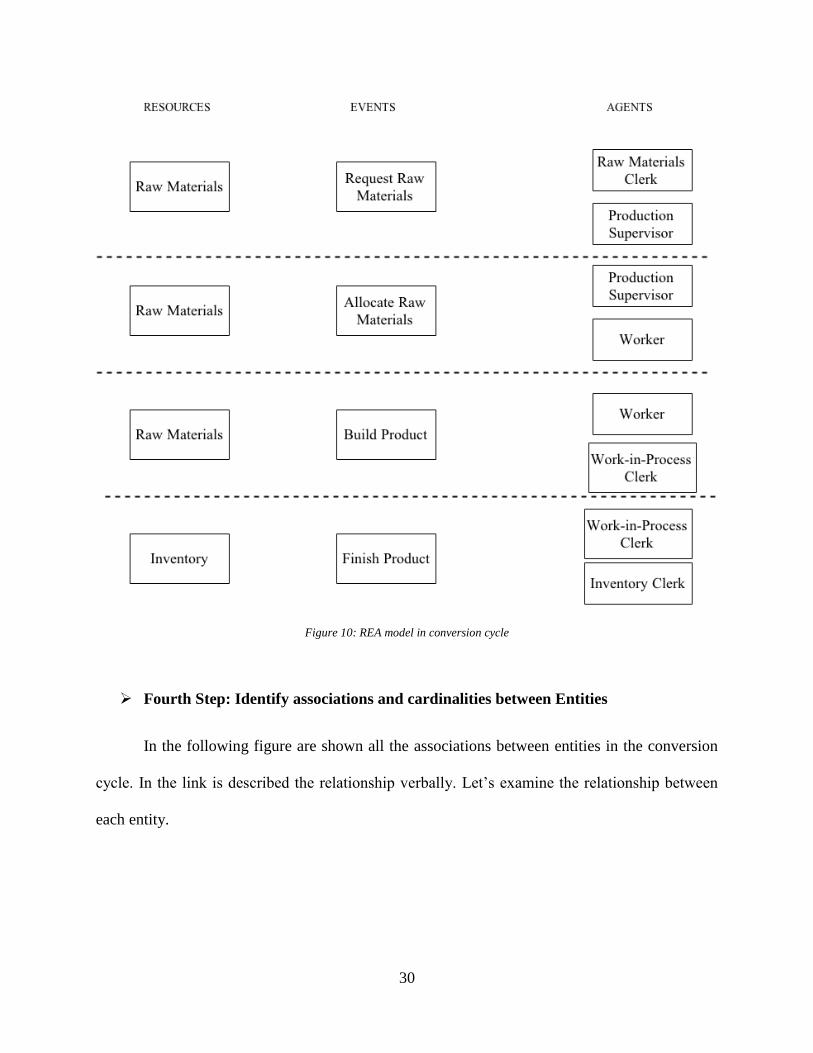
Fourth Step: Identify associations and cardinalities between Entities
In the following figure are shown all the associations between entities in the conversion
cycle. In the link is described the relationship verbally. Let’s examine the relationship between
each entity.
31
Figure 11: Association and Cardinalities between Resources, Events and Agents in conversion cycle
As shown in the diagram there is no association between resources and between agents,
but there are associations between events. Also as the REA approach suggest each event is related
to at least one resource and two agents.
Association between Raw Materials Request and Allocate Raw Materials events
Production supervisor is responsible for allocating raw materials. But firstly he/she sends
a request to raw materials clerk to check if the necessary raw materials are available. The
cardinality in the Raw Materials Request side is 1:1 which means that for each Allocate Raw
Materials event a Raw Materials Request event has happened, while the cardinality in Allocate
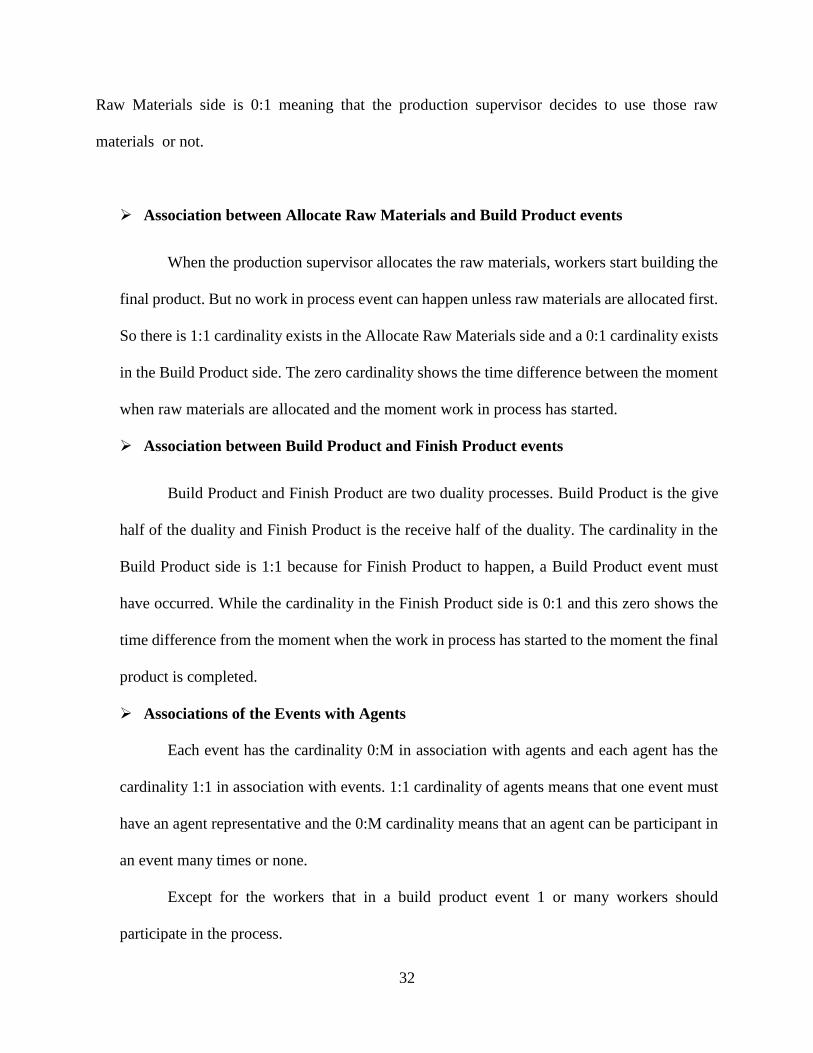
32
Raw Materials side is 0:1 meaning that the production supervisor decides to use those raw
materials or not.
Association between Allocate Raw Materials and Build Product events
When the production supervisor allocates the raw materials, workers start building the
final product. But no work in process event can happen unless raw materials are allocated first.
So there is 1:1 cardinality exists in the Allocate Raw Materials side and a 0:1 cardinality exists
in the Build Product side. The zero cardinality shows the time difference between the moment
when raw materials are allocated and the moment work in process has started.
Association between Build Product and Finish Product events
Build Product and Finish Product are two duality processes. Build Product is the give
half of the duality and Finish Product is the receive half of the duality. The cardinality in the
Build Product side is 1:1 because for Finish Product to happen, a Build Product event must
have occurred. While the cardinality in the Finish Product side is 0:1 and this zero shows the
time difference from the moment when the work in process has started to the moment the final
product is completed.
Associations of the Events with Agents
Each event has the cardinality 0:M in association with agents and each agent has the
cardinality 1:1 in association with events. 1:1 cardinality of agents means that one event must
have an agent representative and the 0:M cardinality means that an agent can be participant in
an event many times or none.
Except for the workers that in a build product event 1 or many workers should
participate in the process.
33
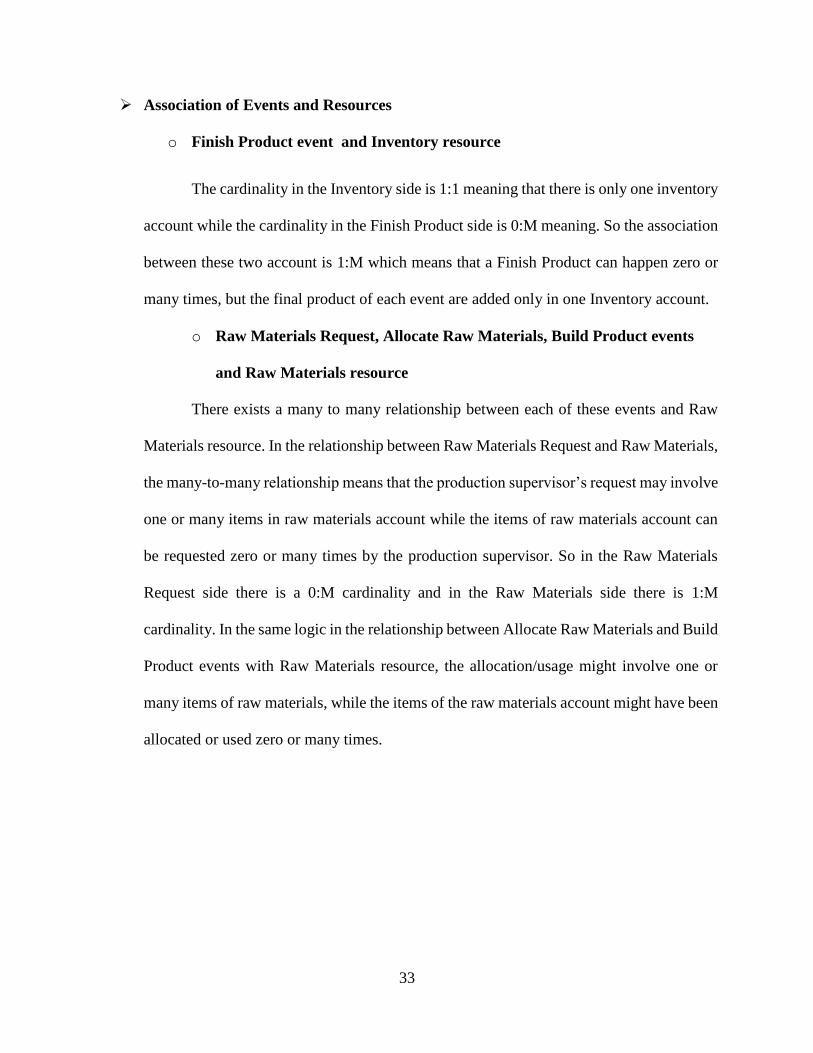
Association of Events and Resources
o Finish Product event and Inventory resource
The cardinality in the Inventory side is 1:1 meaning that there is only one inventory
account while the cardinality in the Finish Product side is 0:M meaning. So the association
between these two account is 1:M which means that a Finish Product can happen zero or
many times, but the final product of each event are added only in one Inventory account.
o Raw Materials Request, Allocate Raw Materials, Build Product events
and Raw Materials resource
There exists a many to many relationship between each of these events and Raw
Materials resource. In the relationship between Raw Materials Request and Raw Materials,
the many-to-many relationship means that the production supervisor’s request may involve
one or many items in raw materials account while the items of raw materials account can
be requested zero or many times by the production supervisor. So in the Raw Materials
Request side there is a 0:M cardinality and in the Raw Materials side there is 1:M
cardinality. In the same logic in the relationship between Allocate Raw Materials and Build
Product events with Raw Materials resource, the allocation/usage might involve one or
many items of raw materials, while the items of the raw materials account might have been
allocated or used zero or many times.
34
Chapter 4
STRUCTURAL DESIGN OF AIS
In order to build an integrated AIS based on REA we have chosen a web application since it
is more flexible and can be accessed despite location. The programming language in which the
application is build is object oriented PHP. The whole application is build according to a Model-
View-Controller (MVC) framework. The model part is the representation of REA entities, view
is what is being displayed to user and controller controls how the model entities are shown in
the user view. The system will take information about transactions as input from the user and
will generate financial reports and also managerial reports such as inventory state, remainders
about order and also summarizing and forecasting.
4.1 Class Diagram
Class Diagram is an UML diagram which shows the structure of the system. It includes
the classes of the system, attributes of these classes, methods of each classes and the relationship
between them. A class diagram is useful for object oriented modelling. It consists of classes that
may be considered as the main classes of the system and other useful classes to be programmed.
For each of the entities in the REA model there will be build one entity class which has
the attributes of the certain entity in the database and a specific controller for each of the entities.
The entity controller handles all the interaction with the database and computational part. So the
entity controller has most of the methods or operations that the system performs.
Since there are a lot of entities defined for this system as it will be shown even below in
the REA model section, there are a lot of classes in the class diagram and it cannot be shown all
35
considering that it will be unclear. But the completed version of Class Diagram will be places in
the appendix part.
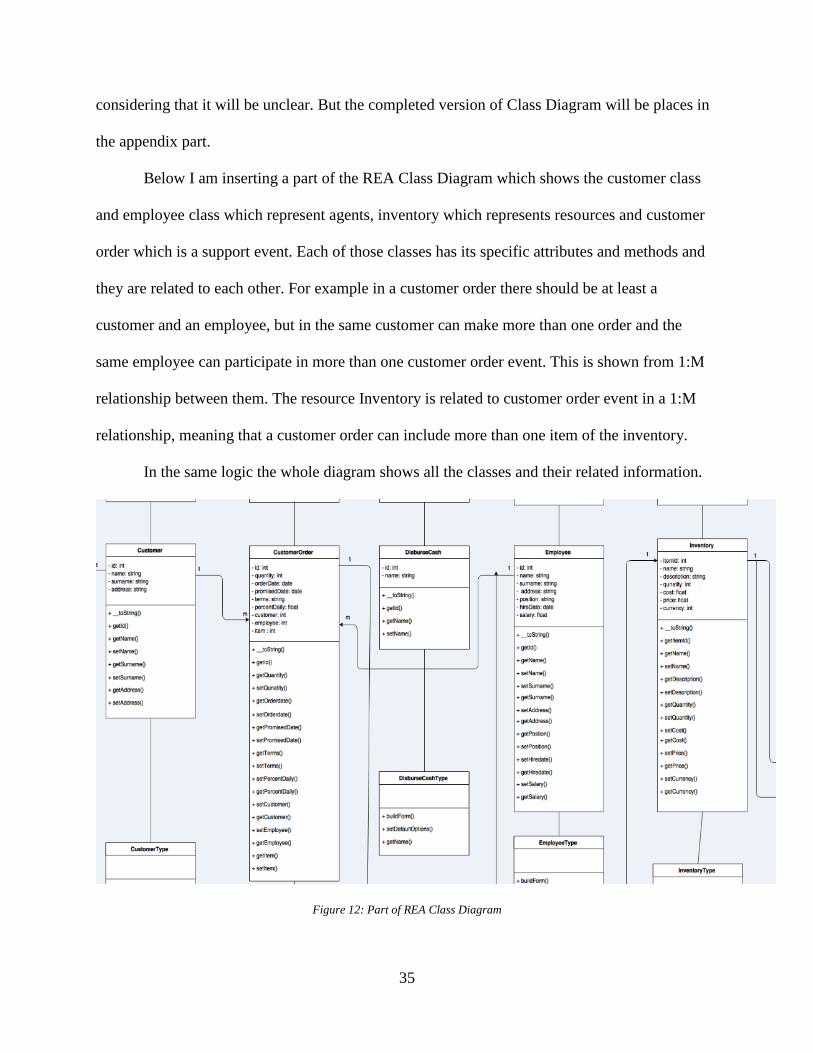
Below I am inserting a part of the REA Class Diagram which shows the customer class
and employee class which represent agents, inventory which represents resources and customer
order which is a support event. Each of those classes has its specific attributes and methods and
they are related to each other. For example in a customer order there should be at least a
customer and an employee, but in the same customer can make more than one order and the
same employee can participate in more than one customer order event. This is shown from 1:M
relationship between them. The resource Inventory is related to customer order event in a 1:M
relationship, meaning that a customer order can include more than one item of the inventory.
In the same logic the whole diagram shows all the classes and their related information.
Figure 12: Part of REA Class Diagram
36
4.2 REA Model
Almost the whole REA model is built in the database since I have mentioned even above
that REA is built as relational database. In the Analysis and Design of REA chapter I have designed
each of the cycles separately. In order to build the whole system I have to integrate all of them in
one. This is done in the database. I have skipped some of the entities such as Check Catalog, Check
Raw Materials etc. because I can implement such things in the controller.
Below I am showing the database I have used to build my system.
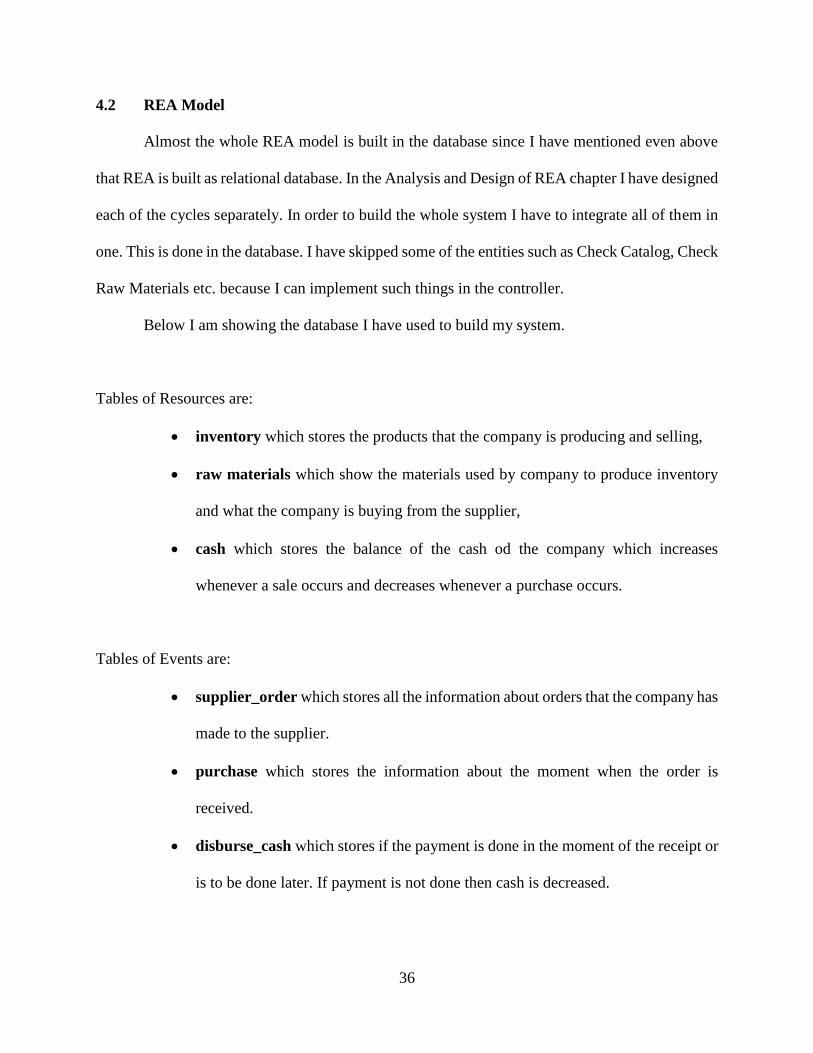
Tables of Resources are:
inventory which stores the products that the company is producing and selling,
raw materials which show the materials used by company to produce inventory
and what the company is buying from the supplier,
cash which stores the balance of the cash od the company which increases
whenever a sale occurs and decreases whenever a purchase occurs.
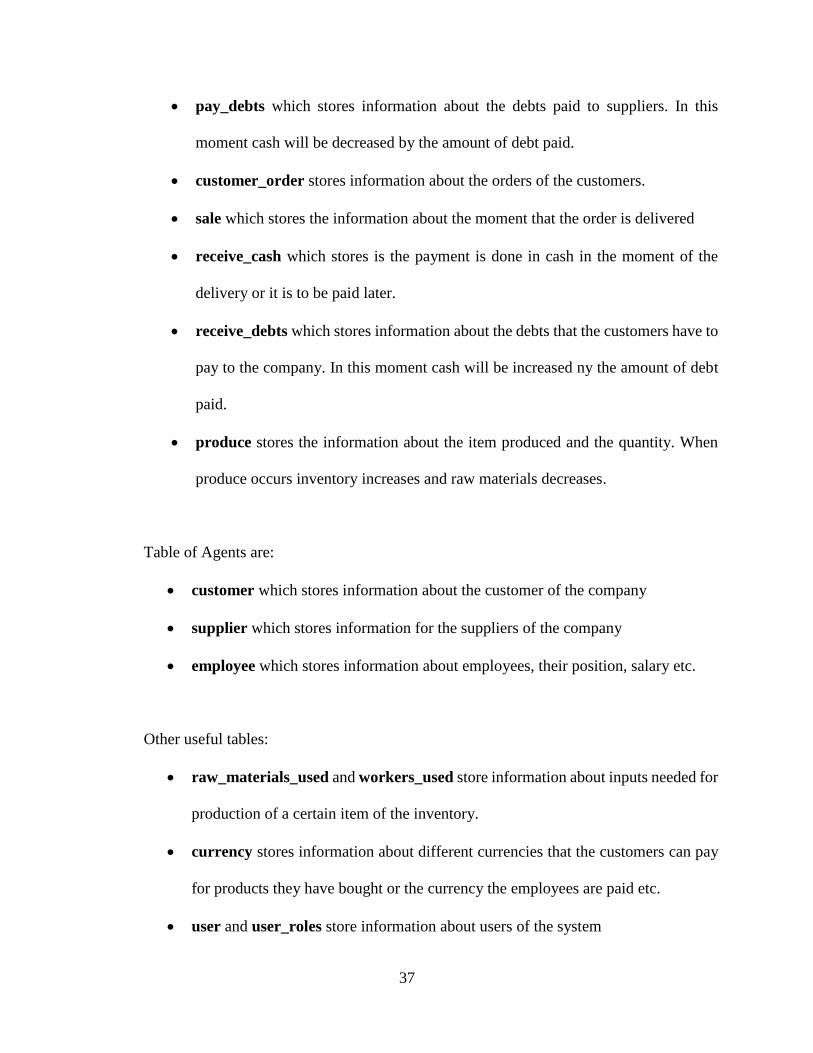
Tables of Events are:
supplier_order which stores all the information about orders that the company has
made to the supplier.
purchase which stores the information about the moment when the order is
received.
disburse_cash which stores if the payment is done in the moment of the receipt or
is to be done later. If payment is not done then cash is decreased.
37
pay_debts which stores information about the debts paid to suppliers. In this
moment cash will be decreased by the amount of debt paid.
customer_order stores information about the orders of the customers.
sale which stores the information about the moment that the order is delivered
receive_cash which stores is the payment is done in cash in the moment of the
delivery or it is to be paid later.
receive_debts which stores information about the debts that the customers have to
pay to the company. In this moment cash will be increased ny the amount of debt
paid.
produce stores the information about the item produced and the quantity. When
produce occurs inventory increases and raw materials decreases.
Table of Agents are:
customer which stores information about the customer of the company
supplier which stores information for the suppliers of the company
employee which stores information about employees, their position, salary etc.
Other useful tables:
raw_materials_used and workers_used store information about inputs needed for
production of a certain item of the inventory.
currency stores information about different currencies that the customers can pay
for products they have bought or the currency the employees are paid etc.
user and user_roles store information about users of the system
38
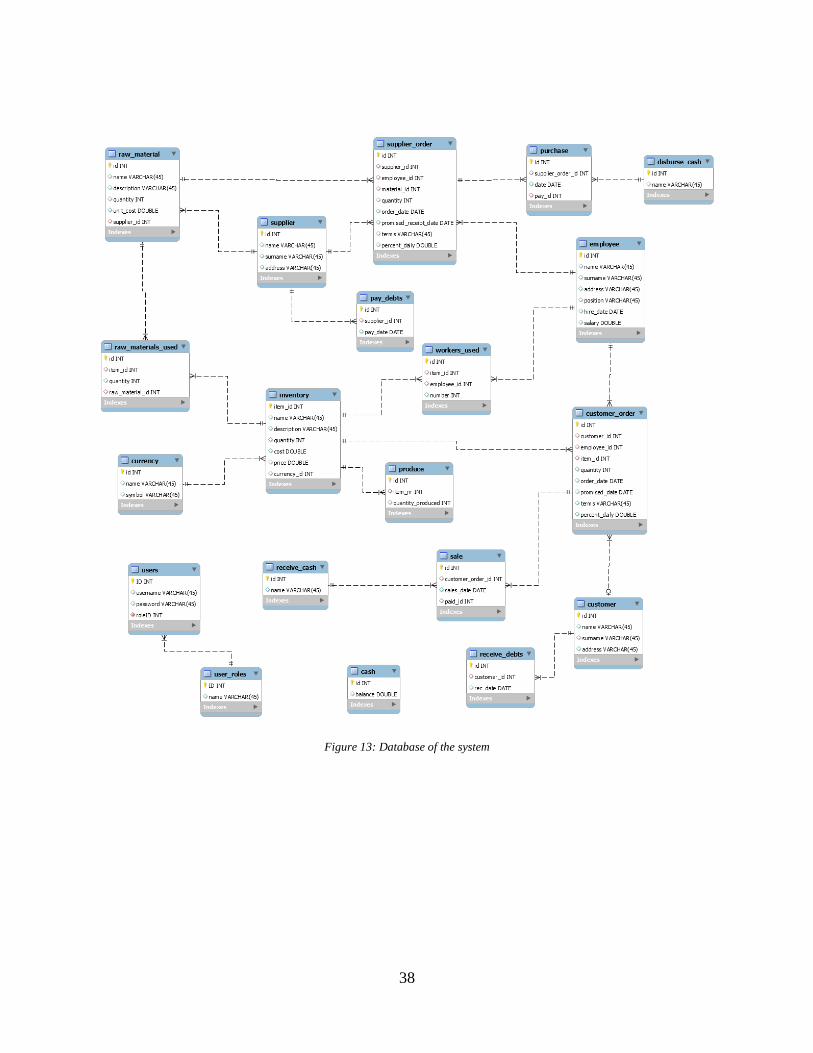
Figure 13: Database of the system
39
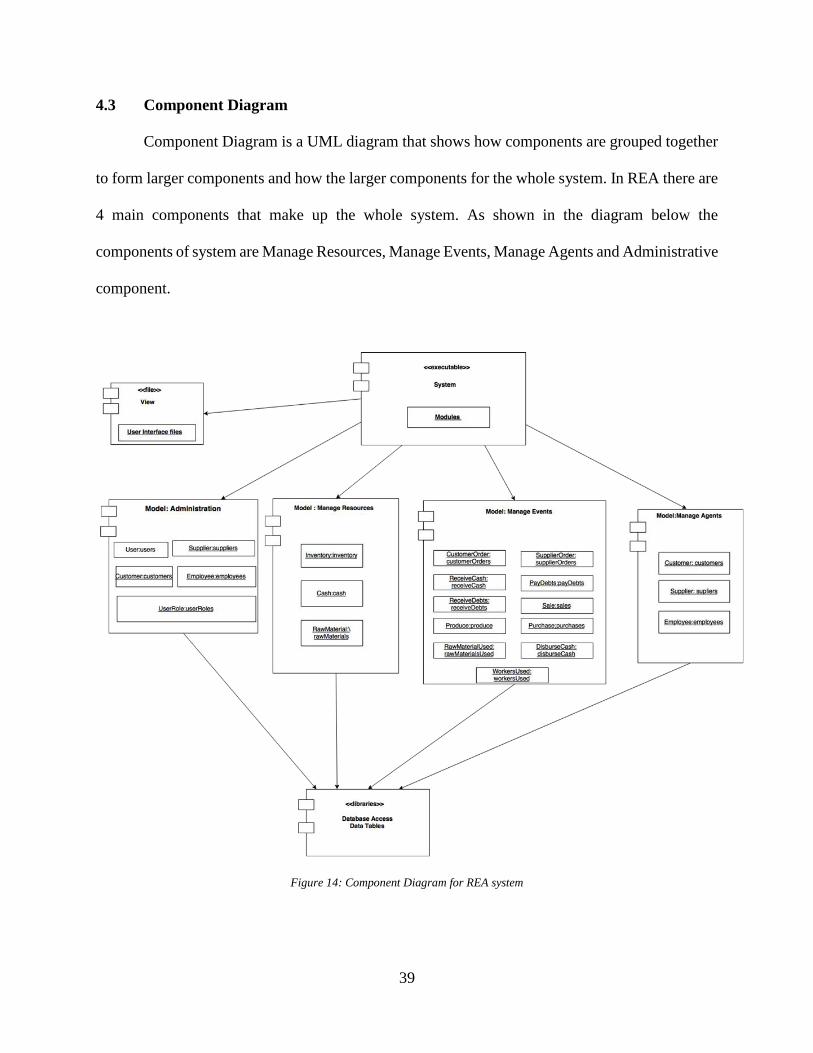
4.3 Component Diagram
Component Diagram is a UML diagram that shows how components are grouped together
to form larger components and how the larger components for the whole system. In REA there are
4 main components that make up the whole system. As shown in the diagram below the
components of system are Manage Resources, Manage Events, Manage Agents and Administrative
component.
Figure 14: Component Diagram for REA system
40
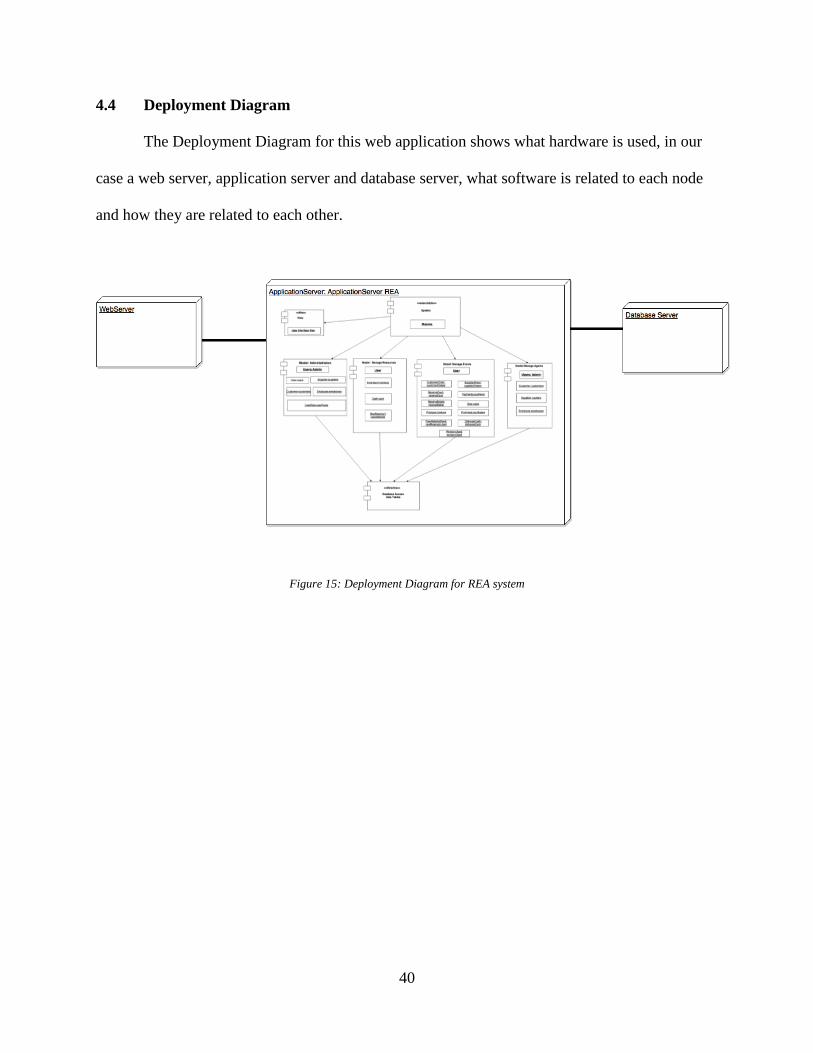
4.4 Deployment Diagram
The Deployment Diagram for this web application shows what hardware is used, in our
case a web server, application server and database server, what software is related to each node
and how they are related to each other.
Figure 15: Deployment Diagram for REA system
41
Chapter 5
IMPLEMENTATION
The system I am building is a web based system. I have chosen the system to be web based
since it is more flexible and can be accessed wherever there is internet coverage and whenever the
user needs to make any change or take information. The basic programming language of the system
is object oriented PHP. I have used Symfony framework to build the system since it has a lot of
benefits such as faster, adaptable, stable and sustainable, easy to use etc. Other technologies used
are:
o HTML
o CSS
o JAVASCRIPT
o JQUERY
o AJAX
o MYSQL
o PDF
These technologies are all needed in order for the system to be interactive and functional. PHP is
the server side scripting that interacts with the database and performs the calculations needed to
generate the reports. HTML contains elements such as forms from which information is gathered
from user. CSS is used to make a user friendly interface and attractive software. MYSQL is the
language that executes query from the database. PDF is used to generate reports that are
downloadable. In this way all the technologies have their own functions that are all needed in the
system.
42
5.1 Implementation
To build the system based on REA one of the biggest challenges was to build a well-
structured database. Since the whole point of REA is to reduce redundancy and data duplication it
was very important to normalize the database up to third level of normalization. I was careful not
to record the same information in more than one table to reduce data duplication. Since I am
building a whole enterprise system I have a lot of database tables to deal with, as it was shown
even in chapter 4 in the ER diagram.
Below I am showing the structure of some of the tables.
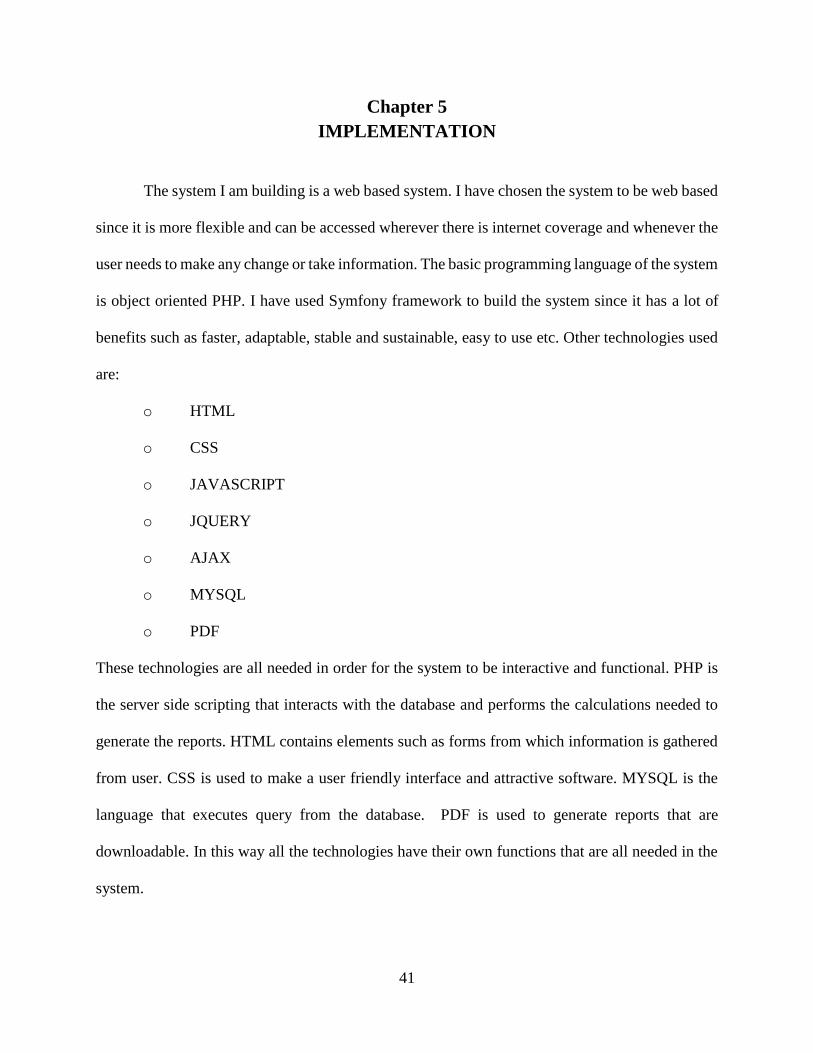
5.1.1 Resource tables
This is the table of inventory and the attributes it stores. It has one primary key which is
item_id and one foreign key which is currency_id.
Figure 16: Inventory table
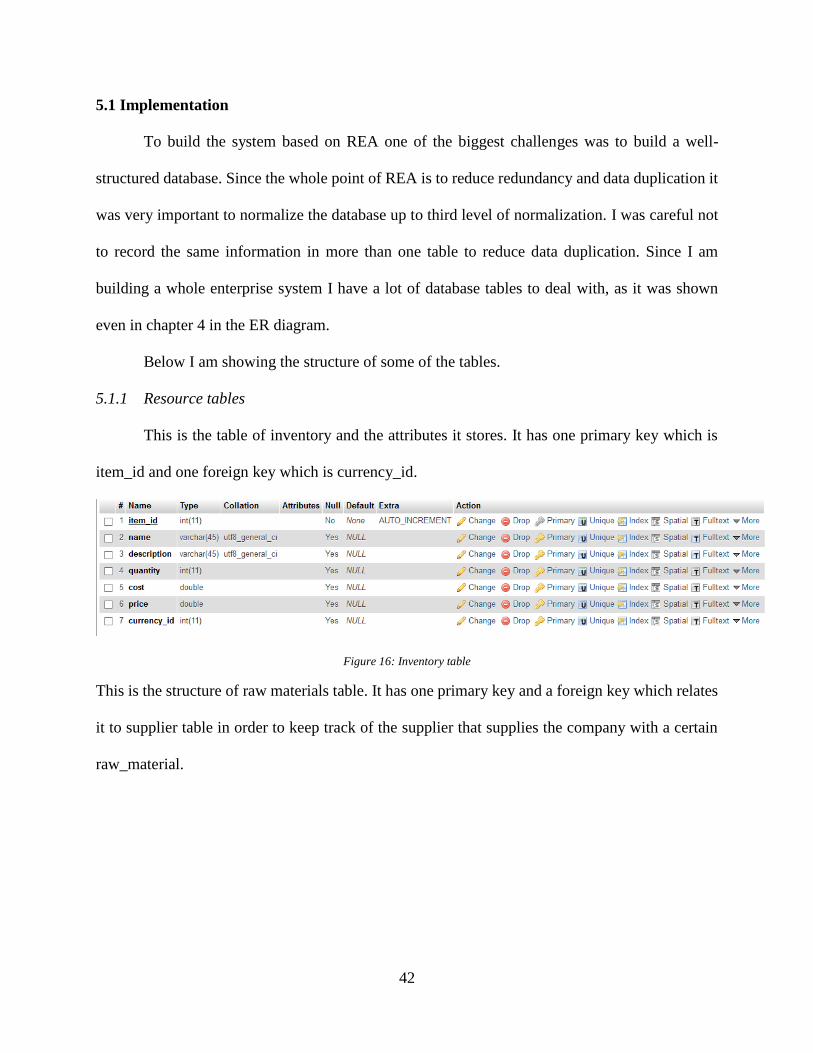
This is the structure of raw materials table. It has one primary key and a foreign key which relates
it to supplier table in order to keep track of the supplier that supplies the company with a certain
raw_material.
43
Figure 17: Raw_Material database table
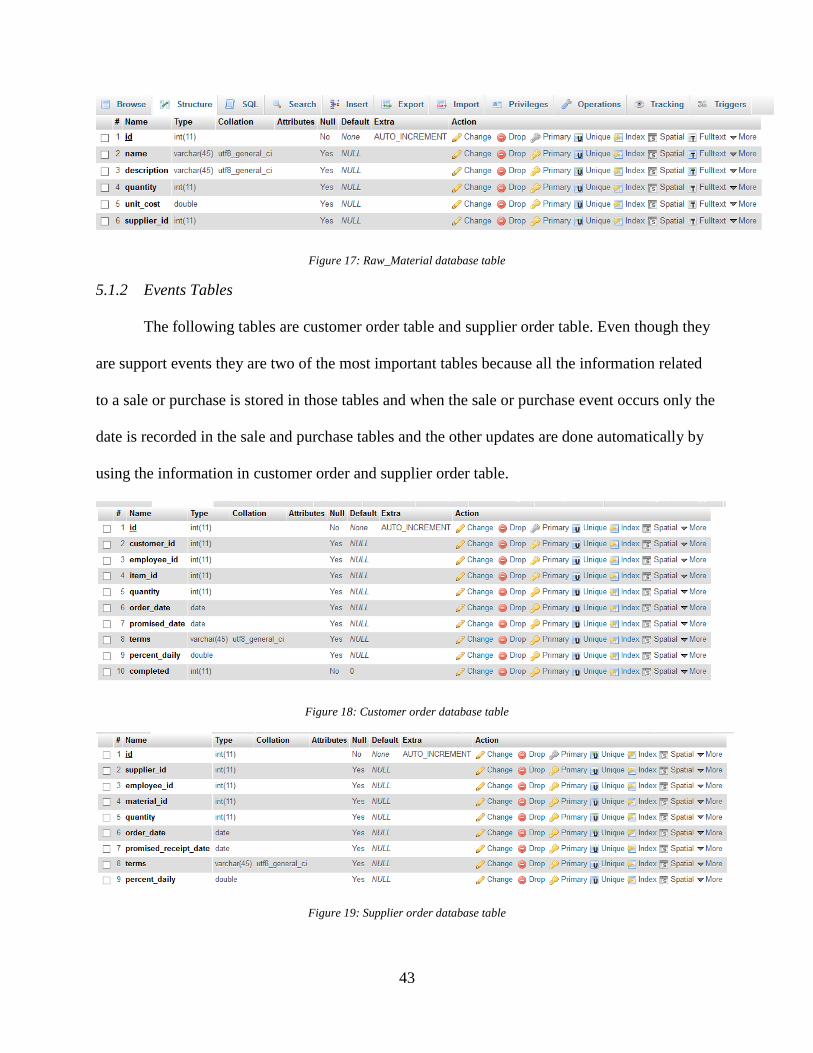
5.1.2 Events Tables
The following tables are customer order table and supplier order table. Even though they
are support events they are two of the most important tables because all the information related
to a sale or purchase is stored in those tables and when the sale or purchase event occurs only the
date is recorded in the sale and purchase tables and the other updates are done automatically by
using the information in customer order and supplier order table.
Figure 18: Customer order database table
Figure 19: Supplier order database table
44
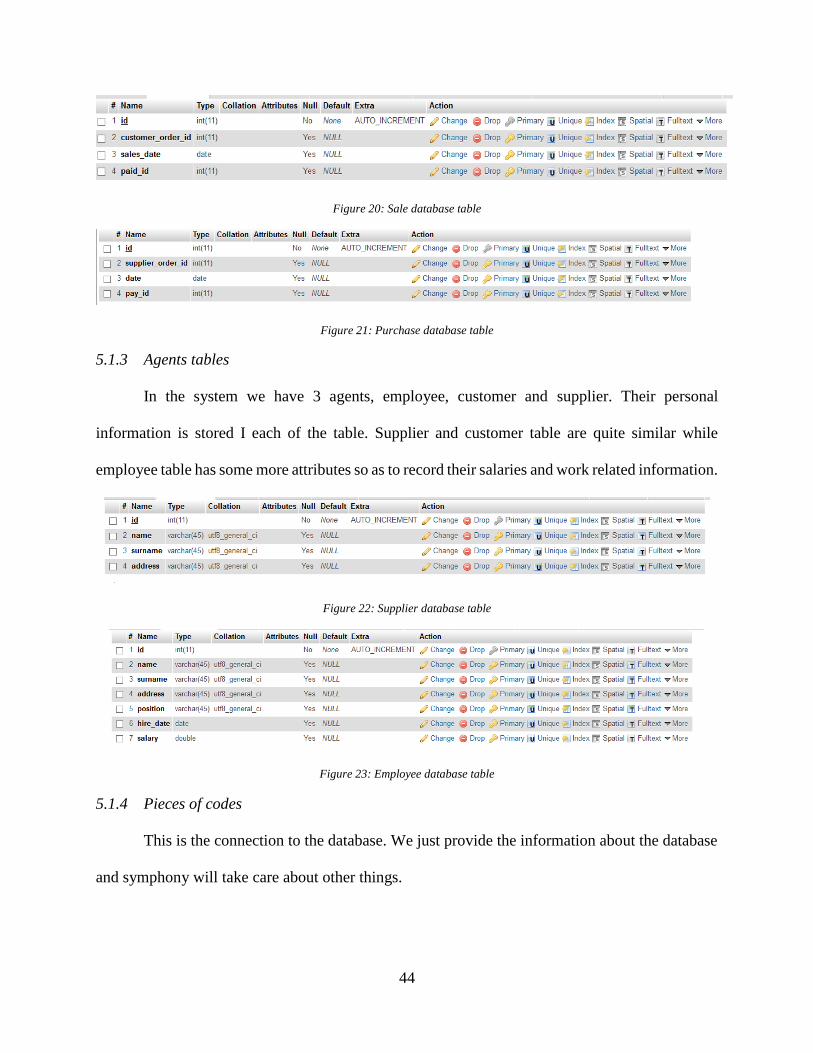
Figure 20: Sale database table
Figure 21: Purchase database table
5.1.3 Agents tables
In the system we have 3 agents, employee, customer and supplier. Their personal
information is stored I each of the table. Supplier and customer table are quite similar while
employee table has some more attributes so as to record their salaries and work related information.
Figure 22: Supplier database table
Figure 23: Employee database table
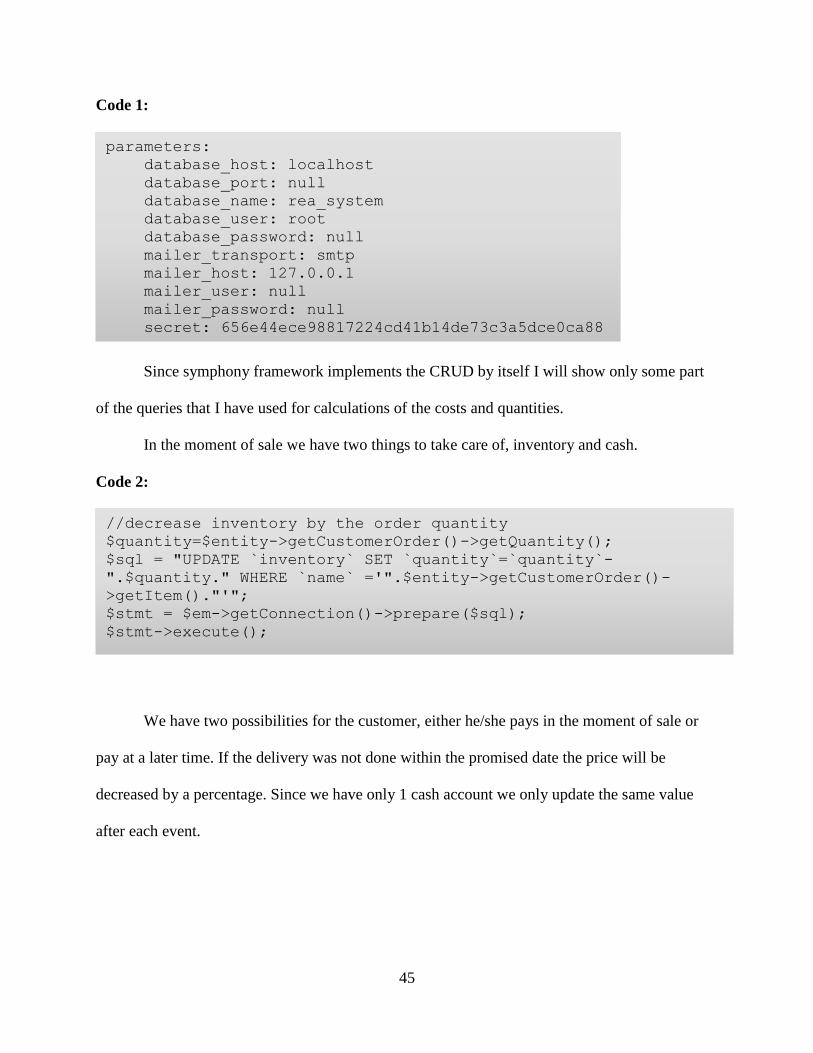
5.1.4 Pieces of codes
This is the connection to the database. We just provide the information about the database
and symphony will take care about other things.
45
Code 1:
Since symphony framework implements the CRUD by itself I will show only some part
of the queries that I have used for calculations of the costs and quantities.
In the moment of sale we have two things to take care of, inventory and cash.
Code 2:
We have two possibilities for the customer, either he/she pays in the moment of sale or
pay at a later time. If the delivery was not done within the promised date the price will be
decreased by a percentage. Since we have only 1 cash account we only update the same value
after each event.
parameters:
database_host: localhost
database_port: null
database_name: rea_system
database_user: root
database_password: null
mailer_transport: smtp
mailer_host: 127.0.0.1
mailer_user: null
mailer_password: null
secret: 656e44ece98817224cd41b14de73c3a5dce0ca88
//decrease inventory by the order quantity
$quantity=$entity->getCustomerOrder()->getQuantity();
$sql = "UPDATE `inventory` SET `quantity`=`quantity`-
".$quantity." WHERE `name` ='".$entity->getCustomerOrder()-
>getItem()."'";
$stmt = $em->getConnection()->prepare($sql);
$stmt->execute();
46
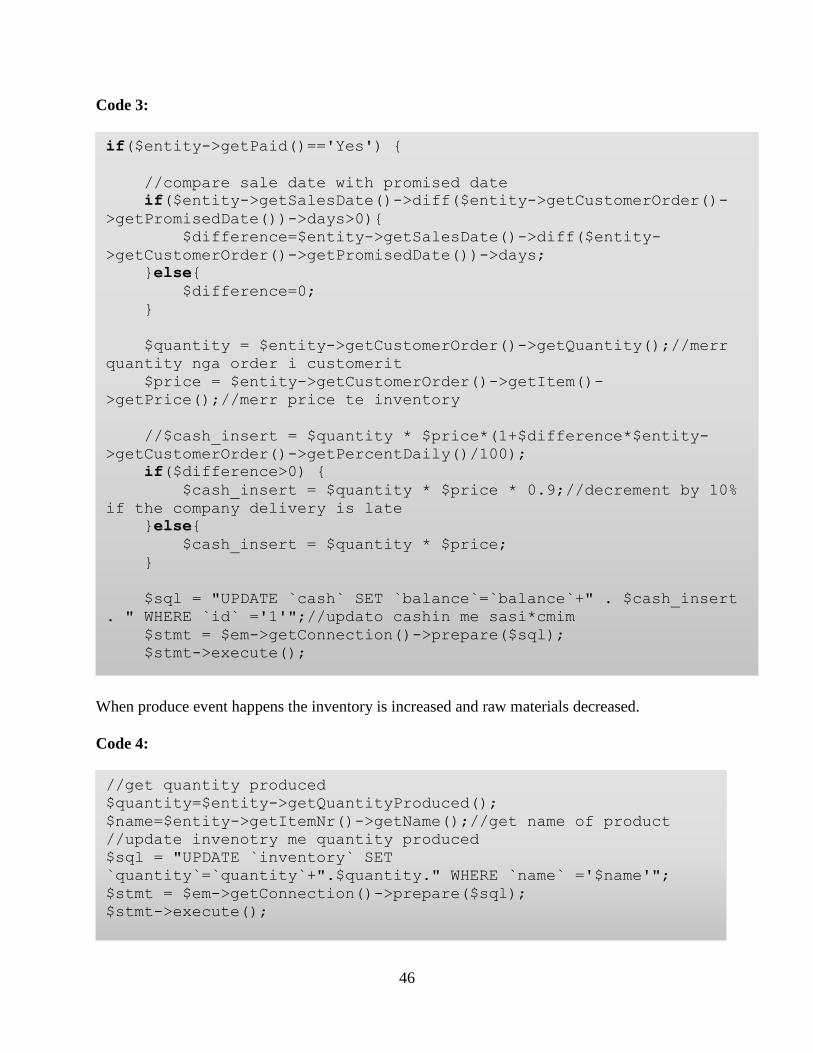
Code 3:
When produce event happens the inventory is increased and raw materials decreased.
Code 4:
if($entity->getPaid()=='Yes') {
//compare sale date with promised date
if($entity->getSalesDate()->diff($entity->getCustomerOrder()-
>getPromisedDate())->days>0){
$difference=$entity->getSalesDate()->diff($entity-
>getCustomerOrder()->getPromisedDate())->days;
}else{
$difference=0;
}
$quantity = $entity->getCustomerOrder()->getQuantity();//merr
quantity nga order i customerit
$price = $entity->getCustomerOrder()->getItem()-
>getPrice();//merr price te inventory
//$cash_insert = $quantity * $price*(1+$difference*$entity-
>getCustomerOrder()->getPercentDaily()/100);
if($difference>0) {
$cash_insert = $quantity * $price * 0.9;//decrement by 10%
if the company delivery is late
}else{
$cash_insert = $quantity * $price;
}
$sql = "UPDATE `cash` SET `balance`=`balance`+" . $cash_insert
. " WHERE `id` ='1'";//updato cashin me sasi*cmim
$stmt = $em->getConnection()->prepare($sql);
$stmt->execute();
//get quantity produced
$quantity=$entity->getQuantityProduced();
$name=$entity->getItemNr()->getName();//get name of product
//update invenotry me quantity produced
$sql = "UPDATE `inventory` SET
`quantity`=`quantity`+".$quantity." WHERE `name` ='$name'";
$stmt = $em->getConnection()->prepare($sql);
$stmt->execute();
47
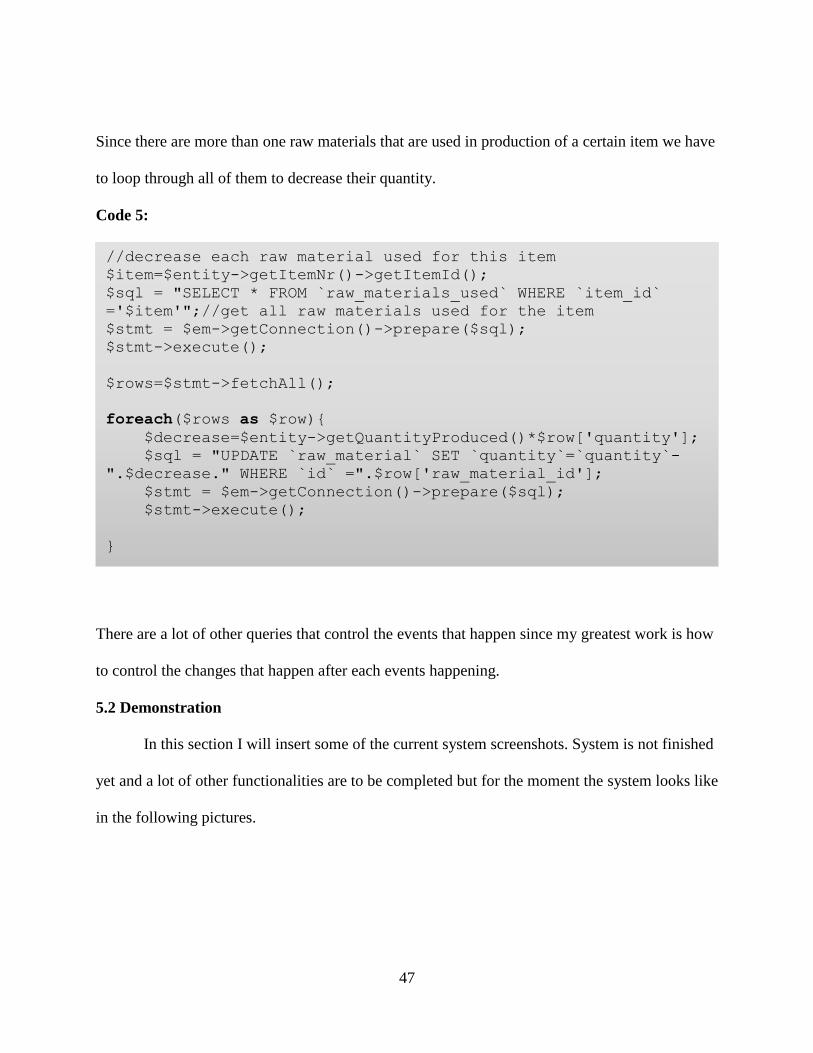
Since there are more than one raw materials that are used in production of a certain item we have
to loop through all of them to decrease their quantity.
Code 5:
There are a lot of other queries that control the events that happen since my greatest work is how
to control the changes that happen after each events happening.
5.2 Demonstration
In this section I will insert some of the current system screenshots. System is not finished
yet and a lot of other functionalities are to be completed but for the moment the system looks like
in the following pictures.
//decrease each raw material used for this item
$item=$entity->getItemNr()->getItemId();
$sql = "SELECT * FROM `raw_materials_used` WHERE `item_id`
='$item'";//get all raw materials used for the item
$stmt = $em->getConnection()->prepare($sql);
$stmt->execute();
$rows=$stmt->fetchAll();
foreach($rows as $row){
$decrease=$entity->getQuantityProduced()*$row['quantity'];
$sql = "UPDATE `raw_material` SET `quantity`=`quantity`-
".$decrease." WHERE `id` =".$row['raw_material_id'];
$stmt = $em->getConnection()->prepare($sql);
$stmt->execute();
}
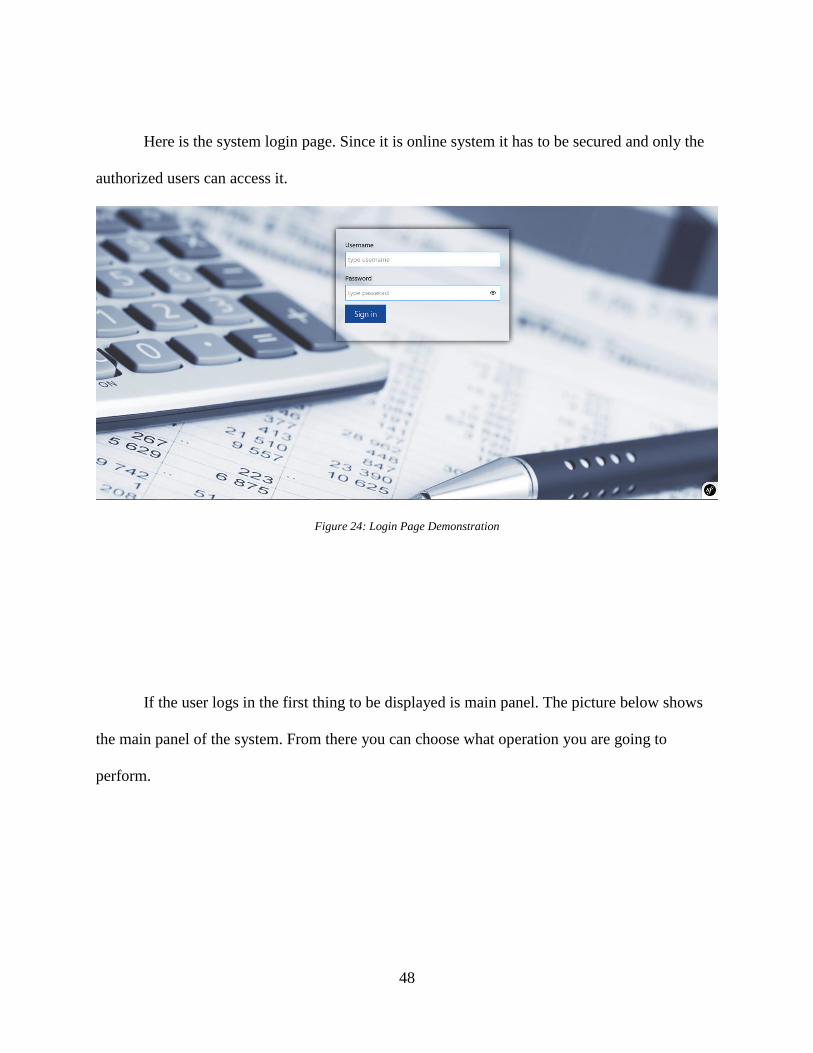
48
Here is the system login page. Since it is online system it has to be secured and only the
authorized users can access it.
Figure 24: Login Page Demonstration
If the user logs in the first thing to be displayed is main panel. The picture below shows
the main panel of the system. From there you can choose what operation you are going to
perform.
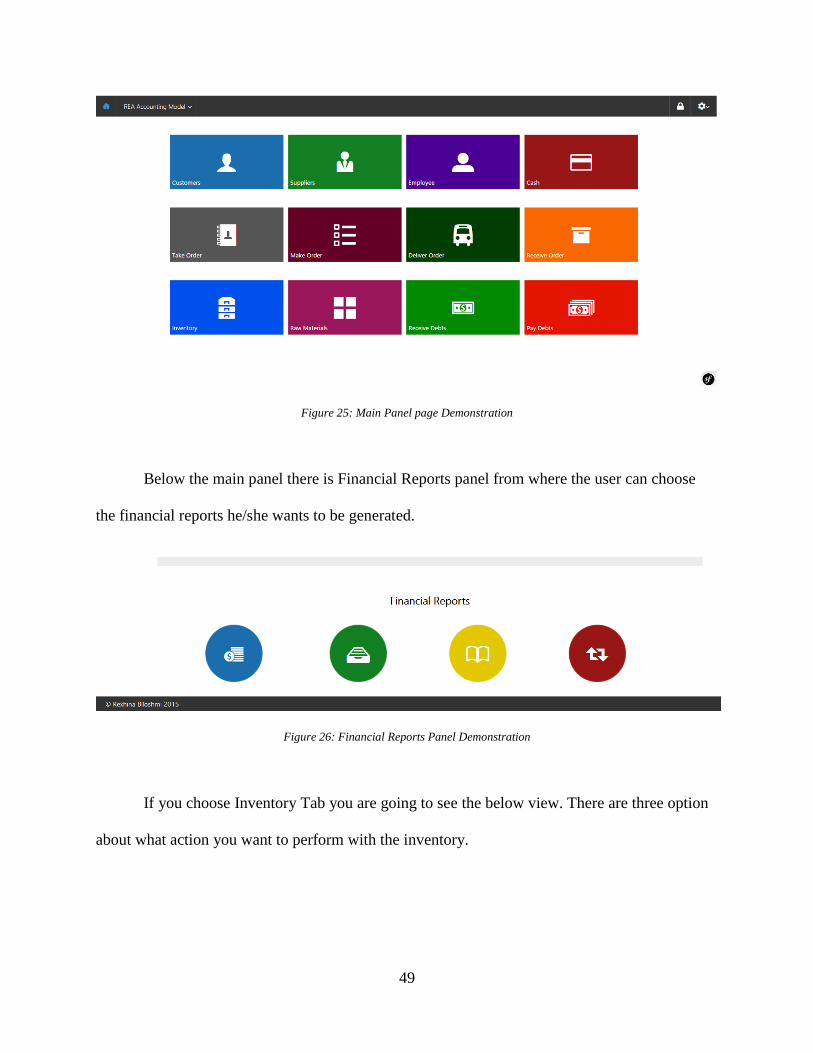
49
Figure 25: Main Panel page Demonstration
Below the main panel there is Financial Reports panel from where the user can choose
the financial reports he/she wants to be generated.
Figure 26: Financial Reports Panel Demonstration
If you choose Inventory Tab you are going to see the below view. There are three option
about what action you want to perform with the inventory.
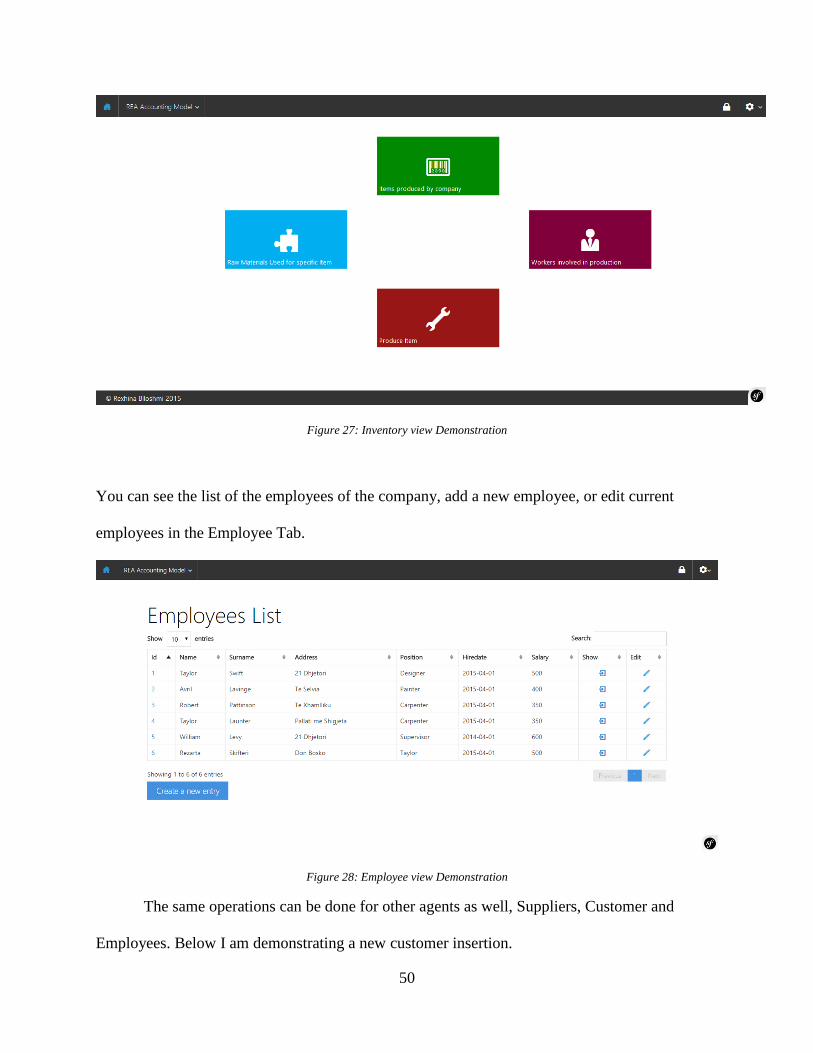
50
Figure 27: Inventory view Demonstration
You can see the list of the employees of the company, add a new employee, or edit current
employees in the Employee Tab.
Figure 28: Employee view Demonstration
The same operations can be done for other agents as well, Suppliers, Customer and
Employees. Below I am demonstrating a new customer insertion.
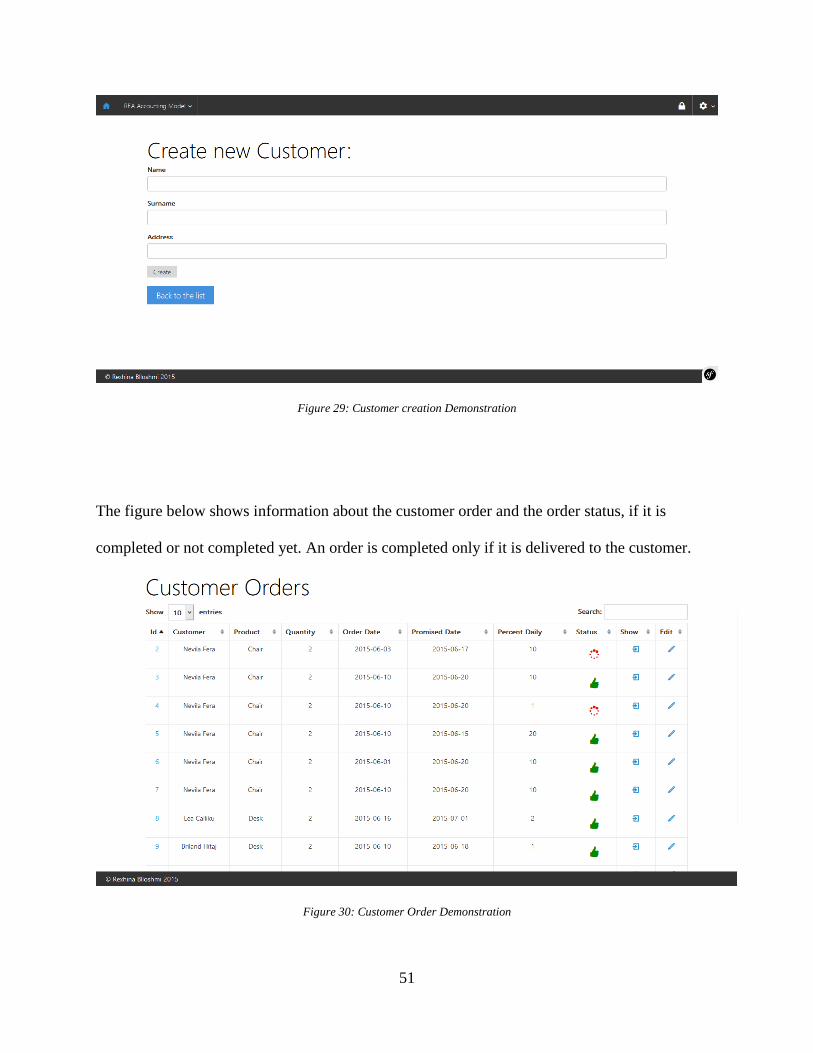
51
Figure 29: Customer creation Demonstration
The figure below shows information about the customer order and the order status, if it is
completed or not completed yet. An order is completed only if it is delivered to the customer.
Figure 30: Customer Order Demonstration
52
Chapter 6
CONCLUSION AND FUTURE WORK
Applying technology in business is not only about building system that shorten the job, but they
must ensure accuracy, reliability and performance. This was not offered by traditional accounting
systems. By studying new models such as REA and with a little effort we can build very good
systems that will increase the overall performance of the enterprise.
REA’s advantages can be seen mostly from the value chain. Companies, to remain competitive
must differentiate between their activities, and while doing so, they become adaptable and
responsive to the changing environment. The REA approach to business process modeling aids
managers to focus on core economic events and also makes possible identifying non value added
activities so they can be eliminated. By keeping track of all the events and who is performing the
events makes it possible to reduce even faults in the processes of the company. This improves
efficiency which results in increased overall productivity.
Storing both financial and nonfinancial data for business events in the same database reduces the
costs of storage and maintenance and also reduces the need for multiple data collection. Financial
and nonfinancial data storing allows a wider perspective for management decisions via the support
of multiple views. REA supplies timely, relevant and accurate information. This results into high
quality products, flexible production and significant improvement in customer service.
Even though REA is rare in business practice I must admit that after analyzing its logic and
properties it is not that difficult to build a whole system based on REA. A lot of work should be
done and we have to be careful of every single detail so as not to fail the whole system but it can
be implemented and in a very good way.
53
In the future I intend to add every left behind detail so as my system is complete. It is very
important to include more functional areas in the system such as human resource planning,
marketing etc. This would increase the usability and reliability of REA. Also a checking of the
current processes needs to be done so they can be more representative and can be used by a wide
number of businesses despite their operating sector. I am considering of making it possible to
generate different types of financial and managerial reports. It is expected to adapt it to all types
of businesses according to user needs and environmental changes. The main processes are
expected to have the same logic, since it is based in REA but minor changes can be developed in
order to satisfy the user needs.
54
REFERENCES AND BIBLIOGRAPHY
[1] Cox, B. (2003). Accountability lost: The rise and fall of double entry. Omega
International Journal of Management Science, 303-310.
[2] Ferran, C., & Salim, R. (2004). IAC accounting data model: A better data structure for
computerized accounting systems. Review of Business Information system, (pp. 109-
119).
[3] Geerts, G. l., & McCarthy, W. E. (2000). The Ontological Foundation of REA
Enterprise Information System. USA.
[4] Geerts, G. L., & McCarthy, W. E. (2001). Using Object Templates from REA
Accounting Model to Engineer business processes and tasks. The Review of Business
Information Systems, 89-108.
[5] Hale DP, Sutton. S. (1990). Integrating semantic and temporal dimensions into
accounting models. American Accounting Association Meetings. Toronto Canada.
[6] Hall, J. A. (2011). Accounting Information Systems (7th ed.). USA: Cengage Learning.
[7] Hardcastle, E. (2008). Business Information Systems. Ventus Publishing.
[8] Hoberman, S. (2009). Data modelling made simple (2nd ed.). USA, Bradley Beach:
Technics Plublications.
[9] John, S. (1999). Knowledge representation: logical, philosophical, and computational
foundations. Pacific Grove: Cole Publishing.
[10] McCarthy, W. E. (1982). The REA accounting model: A Generalized Framework for a
Shared Data Envirnment. The Accounting Review, 554-578.
55
[11] Nakamura, H., & Johnson, R. E. (1998). Adaptive Framework for the REA Accounting
Model. OOPSLA’98 Workshop on Business Object Design and Implementation IV, 1-
13.
[12] Pavel, H. (2006). Model-Driven design using business patterns. Berlin, Germany :
Springer.
[13] Sorter, G. H. (1969). An “Events” Approach to Basic Accounting Theory. The
Accounting Review, 44.
[14] Wally, B., Mazak, A., Mayrhofer, D., & Huemer, C. (2014). A Generic REA Software
Architecture based on Fragments and Declarations. Vienna Austria.
[15] Weber, R. (1986). Data Models Research in Accounting: An evaluation of Wholesale
Distribution Software. The Accounting Review, 498-518.
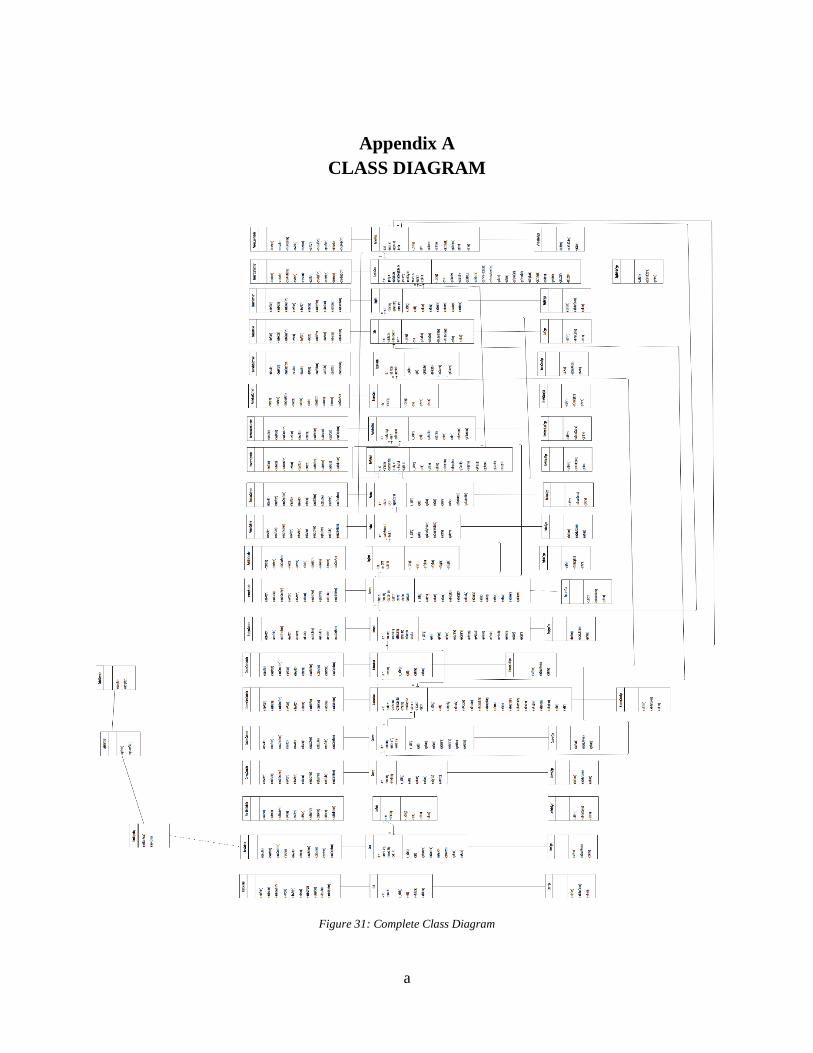
a
Appendix A
CLASS DIAGRAM
Figure 31: Complete Class Diagram
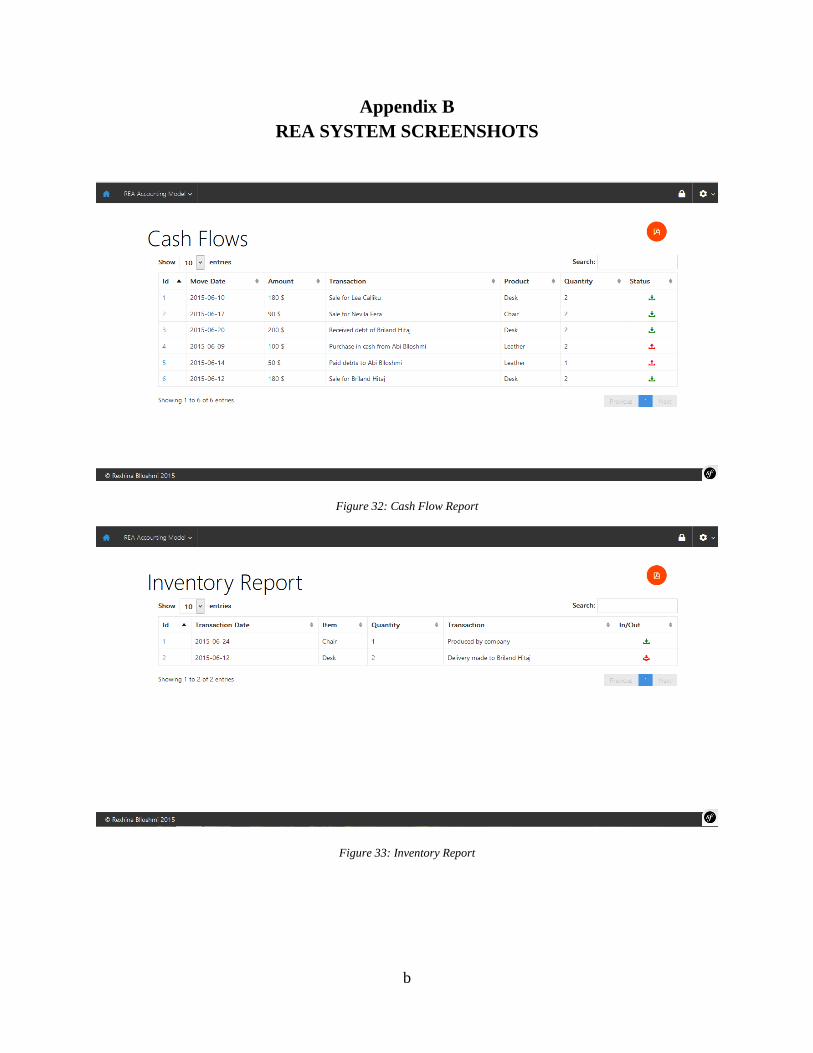
b
Appendix B
REA SYSTEM SCREENSHOTS
Figure 32: Cash Flow Report
Figure 33: Inventory Report
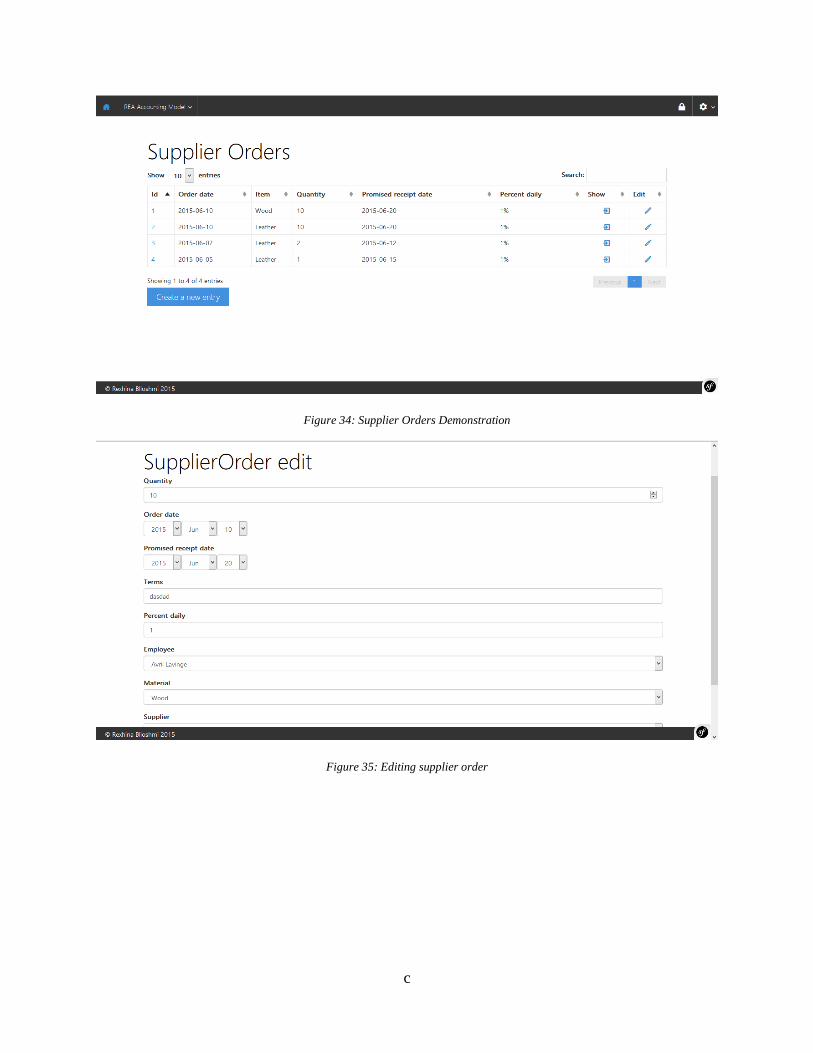
c
Figure 34: Supplier Orders Demonstration
Figure 35: Editing supplier order
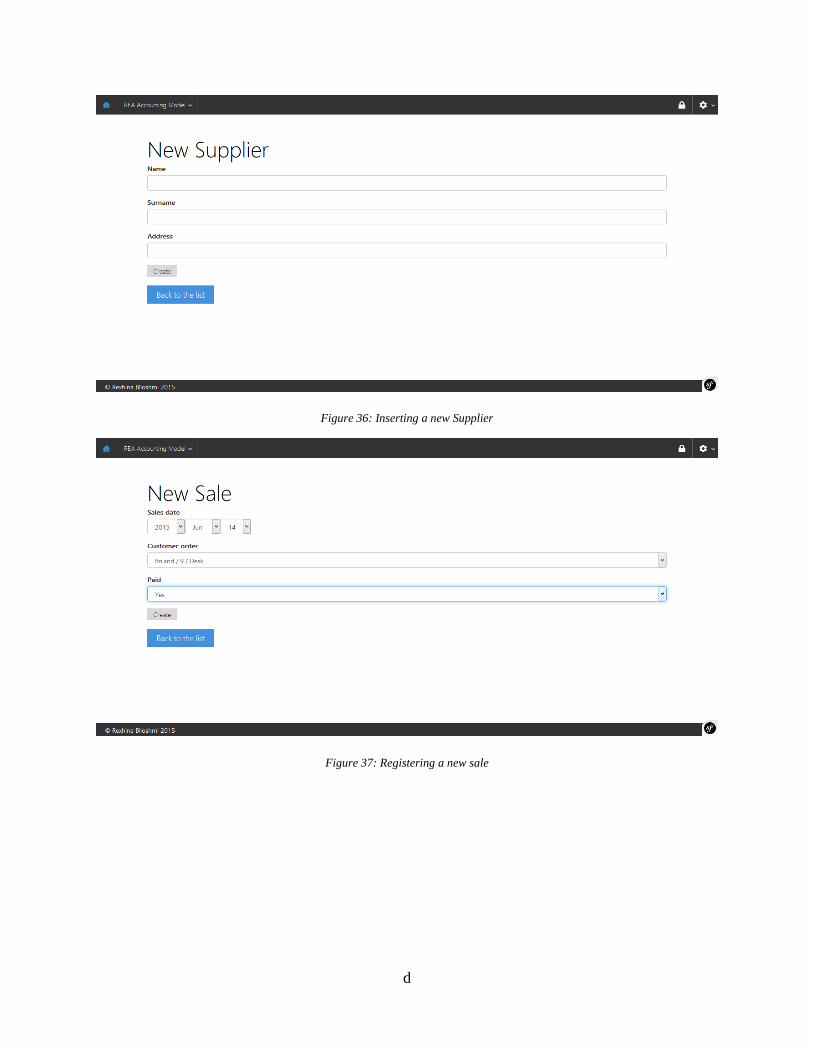
d
Figure 36: Inserting a new Supplier
Figure 37: Registering a new sale
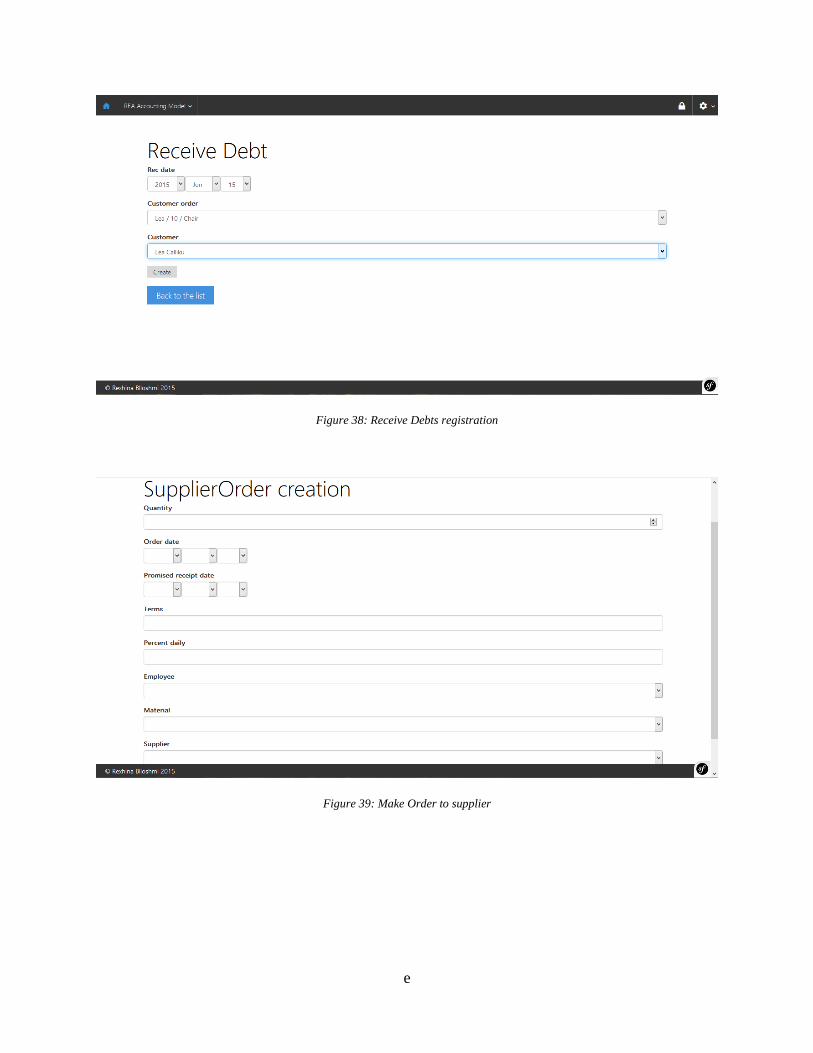
e
Figure 38: Receive Debts registration
Figure 39: Make Order to supplier