Embed Size (px)
Citation preview

APPLICATION NOTE
Malvern Instruments WorldwideSales and service centres in over 65 countrieswww.malvern.com/contact ©2017 Malvern Instruments Limited
How to use GPC/SEC for compositionalanalysisDetermining the relative concentration of two components in a polymer sample
MOLECULAR SIZE
MOLECULARSTRUCTURE
MOLECULAR WEIGHT
IntroductionOver the last century, as synthetic polymers became more prevalent, a desire
arose to fine-tune the physical properties of these materials to produce the
optimal end-product for a given application. One method researchers explored
was to mix two or more types of monomers so that a single chain of the resulting
polymer would be a combination and potentially possess a unique set of physical
properties. Copolymers, the term used to describe these polymers consisting of
two or more different constituent units, can exhibit a variety of monomer patterns
and structures (e.g. random, alternating, block, comb). While the monomer
arrangement and overall shape of the copolymers can affect their physical
properties, so can the relative concentration of each monomer present. For
example, in styrene-butadiene rubber, when the concentration of styrene is high
the resulting rubbers are more rigid. With low styrene content, the materials
are softer and more elastic. Additionally, mixing two different polymers where
the individual polymer chains are not covalently bonded is an alternate, and
sometimes more accessible, method to produce materials with customized
properties. These non-covalently bonded samples are referred to as polymer
blends or mixtures. Knowing the relative concentration of each monomer present
in a copolymer or mixture is critical to understanding the physical properties of
the end-product.
One analytical technique that can provide this information is gel permeation
chromatography (GPC) or, equivalently, size-exclusion chromatography
(SEC). GPC/SEC is a widely used technique to characterize a wide variety of
macromolecules, from bulk manufactured materials to natural polymers and
proteins. This technique can be used to measure the molecular weight moments
(Mw, Mn), molecular weight distribution (Mw/Mn), intrinsic viscosity (IV) and

APPLICATION NOTE
2 How to use GPC/SEC for compositional analysis
hydrodynamic size (RH) of these macromolecules. Figure 1 shows Malvern’s
OMNISEC, a complete, all-inclusive GPC/SEC system.
A brief overview of how GPC/SEC works: A solvated sample is carried by a liquid
mobile phase through an analytical column full of porous gel particles, where
diffusion-controlled separation of the macromolecular components occurs, and
is ultimately observed by different detectors as each slice of sample elutes. A
common advanced detection GPC/SEC setup includes refractive index (RI) UV/
photodiode array (PDA) detector, viscometer, and light scattering detectors. For
reasons that will be explained below, a minimum configuration of RI and UV/PDA
detectors is required for copolymer / compositional analysis.
In this Application Note, one copolymer and one polymer mixture, both
comprised of polystyrene (PS) and poly(methyl methacrylate) (PMMA), will be
analyzed using GPC/SEC in order to determine the relative concentration of each
monomer present. The results will be presented and comparisons will be made
between the two.
Figure 1: Malvern’s OMNISEC Tetra Detection GPC/SEC System
APPLICATION NOTE
3 How to use GPC/SEC for compositional analysis
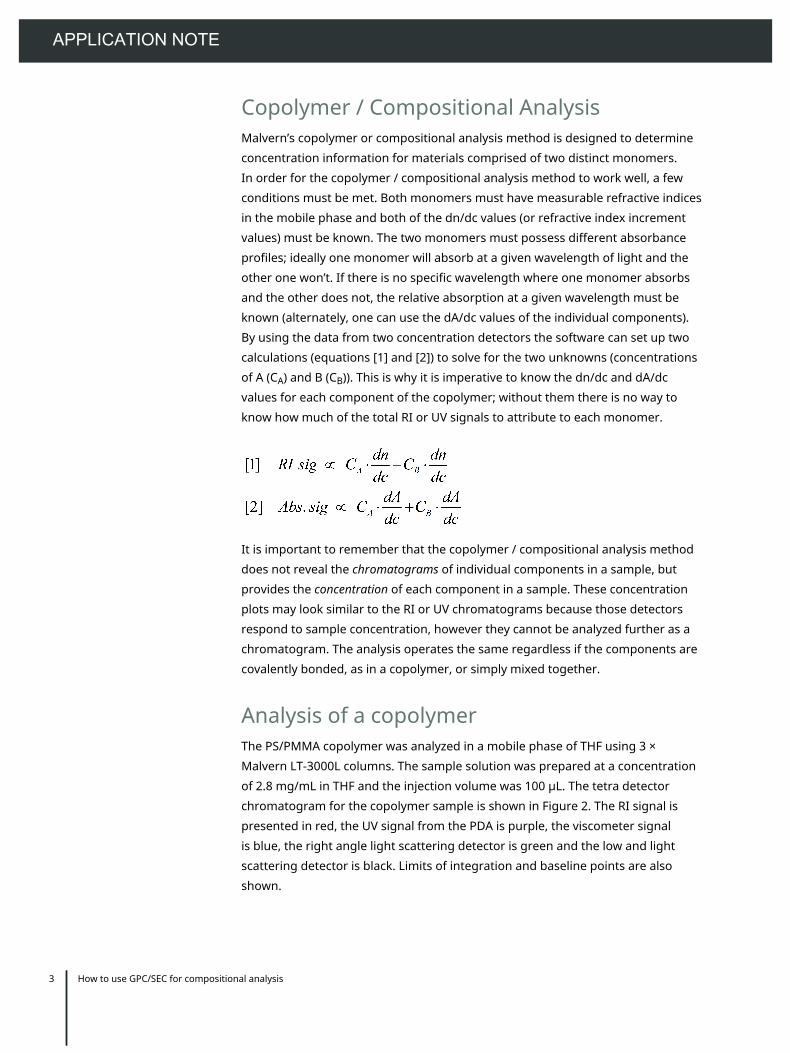
Copolymer / Compositional AnalysisMalvern’s copolymer or compositional analysis method is designed to determine
concentration information for materials comprised of two distinct monomers.
In order for the copolymer / compositional analysis method to work well, a few
conditions must be met. Both monomers must have measurable refractive indices
in the mobile phase and both of the dn/dc values (or refractive index increment
values) must be known. The two monomers must possess different absorbance
profiles; ideally one monomer will absorb at a given wavelength of light and the
other one won’t. If there is no specific wavelength where one monomer absorbs
and the other does not, the relative absorption at a given wavelength must be
known (alternately, one can use the dA/dc values of the individual components).
By using the data from two concentration detectors the software can set up two
calculations (equations [1] and [2]) to solve for the two unknowns (concentrations
of A (CA) and B (CB)). This is why it is imperative to know the dn/dc and dA/dc
values for each component of the copolymer; without them there is no way to
know how much of the total RI or UV signals to attribute to each monomer.
It is important to remember that the copolymer / compositional analysis method
does not reveal the chromatograms of individual components in a sample, but
provides the concentration of each component in a sample. These concentration
plots may look similar to the RI or UV chromatograms because those detectors
respond to sample concentration, however they cannot be analyzed further as a
chromatogram. The analysis operates the same regardless if the components are
covalently bonded, as in a copolymer, or simply mixed together.
Analysis of a copolymerThe PS/PMMA copolymer was analyzed in a mobile phase of THF using 3 ×
Malvern LT-3000L columns. The sample solution was prepared at a concentration
of 2.8 mg/mL in THF and the injection volume was 100 µL. The tetra detector
chromatogram for the copolymer sample is shown in Figure 2. The RI signal is
presented in red, the UV signal from the PDA is purple, the viscometer signal
is blue, the right angle light scattering detector is green and the low and light
scattering detector is black. Limits of integration and baseline points are also
shown.

APPLICATION NOTE
4 How to use GPC/SEC for compositional analysis
Figure 2: Tetra detector chromatogram of the copolymer sample
In setting up the copolymer / compositional analysis method the dn/dc value used
for PS in THF was 0.185 and for PMMA in THF was 0.085. The dA/dc values used
for PS and PMMA were 1 and 0, respectively. These are not the absolute dA/dc
values for PS and PMMA, but since PS has an absorption at 254 nm and PMMA
doesn’t, then all of the UV absorption data will be attributable to PS making the all
or nothing values of 1 and 0 appropriate.
The molecular characterization data for the copolymer sample is shown below in
Table 1. In addition to the Mw, Mn, Mw/Mn, IV and RH, the weight fractions of PS
and PMMA are listed. Data for three injections are presented, along with relative
standard deviations.
Table 1. Molecular characterization data for three injections of the copolymer sample; Mz, Mw, Mn
in Da
The data for the copolymer sample is consistent with the chromatograms shown
in Figure 2, representing a well-defined sample with a narrow distribution. It is
important to note that this copolymer sample has a single distribution, meaning
the peak is not bimodal and there is only one sample peak present. This indicates
that the two different monomers exist within this single distribution. This is a
common characteristic of copolymers; however, this is not absolutely true for all
examples of copolymers.
The weight fraction data provides insight into the relative concentration of
each monomer. The weight fraction of PS was found to be 0.51 and the weight
fraction of PMMA was found to be 0.49. When the molecular mass of each
monomer is taken into account (104.15 Da for styrene and 100.121 Da for methyl
methacrylate), the weight fractions of PS and PMMA indicate that the monomers

APPLICATION NOTE
5 How to use GPC/SEC for compositional analysis
exist in a 1:1 ratio (a 1:1 copolymer would have weight fractions of 0.51 for PS and
0.49 for PMMA from PS = 104.15 Da/204.271 Da; PMMA = 100.121 Da/204.271 Da).
The weight fraction provides relative concentration information, but doesn’t
provide insight into how that concentration exists over the MW range of the
sample. In order to determine if the two components exist evenly throughout
the material or if one monomer is biased to the high or low MW material, a visual
representation of the individual monomer concentrations, as shown in Figure 3, is
examined.
Figure 3: Concentrations of PS (magenta), PMMA (dark blue), and total sample (aqua) plotted
against retention volume for the copolymer sample
The concentration plots in Figure 3 indicate that the concentrations of PS and
PMMA are very similar at each point throughout the sample’s molecular weight
distribution. Regardless of the molecular weight of a polymer chain within this
sample, the ratio of PS to PMMA will be about 1:1. This type of information
can assist researchers in determining how effectively their copolymerization
processes are working and if the end-product displays the desired characteristics.
Analysis of a polymer mixtureTo complement the analysis of the copolymer sample, a polymer mixture sample
was analyzed. The analysis conditions were similar, using a mobile phase of
THF and 2 × Malvern T6000M columns. The sample solution was prepared at a
concentration of 2.5 mg/mL in THF and the injection volume was 100 µL. The tetra
detector chromatogram for the polymer mixture sample is shown in Figure 4. As
above, the RI signal is presented in red, the UV signal from the PDA is purple, the
viscometer signal is blue, the right angle light scattering detector is green and the
low and light scattering detector is black. Limits of integration and baseline points
are also shown.

APPLICATION NOTE
6 How to use GPC/SEC for compositional analysis
Figure 4: Tetra detector chromatogram of the polymer mixture sample
As with the previous example for the copolymer sample, the dn/dc value used for
PS in THF was 0.185 and for PMMA in THF was 0.085. The dA/dc values used for PS
and PMMA were 1 and 0, respectively.
The molecular characterization data for the polymer mixture sample is shown
below in Table 2. In addition to Mw, Mn, Mw/Mn, IV, and RH, the weight fractions
of PS and PMMA are listed. Data for three injections are presented, along with
relative standard deviations.
Table 2. Molecular characterization data for three injections of the copolymer sample; Mz, Mw, Mn
in Da
The data for the polymer mixture provides reproducible average values for
the entire bimodal sample distribution. As opposed to the copolymer sample
analyzed above, the polymer mixture clearly shows two peaks in most of the
detector responses shown in Figure 4. While this does not necessarily indicate
that they are composed of different types/ratios of materials, the differences in
the detector responses of each peak suggest that to be the case. Specifically, a
comparison of the RI and UV chromatograms for the polymer mixture reveals
that the narrower peak eluting at 18 mL is present in the RI signal but not the UV
detector response. This means that whatever material is responsible for that peak
does not have a UV absorbance and is different than the material eluting earlier
that provides the broad peak in the UV signal (14-20 mL).
As with the copolymer sample, the weight fraction data provides a thorough
analysis of the relative concentration of each monomer. The weight fraction of
PS in the polymer mixture was found to be 0.51 and the weight fraction of PMMA

APPLICATION NOTE
7 How to use GPC/SEC for compositional analysis
was found to be 0.49. Like the copolymer example previously explored, these
weight fractions indicate a 1:1 ratio of PS to PMMA in the polymer mixture sample.
So while the weight fractions indicate the PS:PMMA ratio in the polymer mixture
is 1:1, the weight fractions do not specify if the monomers are evenly distributed
in a manner similar to the copolymer example. By viewing the concentrations
of each component as a function of elution volume, as shown in Figure 5, it can
be seen that the two components mostly comprise different portions of the
chromatograms. This makes sense for a sample that is simply a mixture of two
polymers, since each component would have its own distribution that may or may
not overlap with the other.
Figure 5: Concentrations of PS (magenta), PMMA (dark blue), and total sample (aqua) plotted
against retention volume for the polymer mixture sample
The concentration plots in Figure 5 reveal that PS and PMMA in the sample
possess separate distributions within the mixture. The earlier eluting, broader
peak is pure PS, while the later eluting, narrower peak is mostly PMMA, with some
low molecular weight material from the PS distribution contributing. This is in
contrast to the evenly distributed styrene and methyl methacrylate components
in the copolymer sample previously discussed. Both samples are comprised of
PS and PMMA in a 1:1 ratio, however the way the two monomers are distributed
throughout the samples are vastly different. Observation of this difference is only
accessible when using a GPC/SEC setup that includes both an RI and UV detector.

APPLICATION NOTE
8 How to use GPC/SEC for compositional analysis
ConclusionsMalvern’s OMNISEC tetra detection GPC/SEC system provides outstanding
chromatography data for the analysis of both the copolymer and polymer mixture
samples. The analyses revealed reproducible molecular characterization data
and included the weight fractions of each component within the samples. Both
samples were found to contain a PS:PMMA ratio of 1:1. While their chemical
constituency was identical, the MW profiles of the samples were found to be quite
different. The different MW profiles observed supported the notion that the two
samples were different types; one a copolymer with a single MW distribution and
one a mixture of two polymers, each with their own distribution. The copolymer /
compositional analysis method provided accurate data regardless of the physical
relationship between the PS and PMMA within each sample.
It should be noted that the same analysis techniques described here are not
limited to synthetic polymers and can be applied to other application areas. The
copolymer / compositional analysis method has been beneficial in the life-science
arena, specifically to study protein-PEG conjugates or membrane proteins in
detergent micelles.
The ability to test and measure the concentrations of components within a sample
as part of advanced GPC/SEC analysis offers a valuable set of data and results.
This type of sophisticated analysis can provide researchers and manufacturers
the insight needed in order to develop and produce unique products for specific
applications.

APPLICATION NOTE
©2017 Malvern Instruments LimitedAN170113CompositionalCopolymer
Malvern InstrumentsLimitedGrovewood Road, Malvern,Worcestershire, UK. WR141XZ
Tel: +44 1684 892456Fax: +44 1684 892789www.malvern.com
Malvern Instruments is part of Spectris plc, the Precision Instrumentation and Controls Company.
Spectris and the Spectris logo are Trade Marks of Spectris plc.
All information supplied within is correct at time of publication.
Malvern Instruments pursues a policy of continual improvement due to technical development. We thereforereserve the right to deviate from information, descriptions, and specifications in this publication without notice.Malvern Instruments shall not be liable for errors contained herein or for incidental or consequential damages inconnection with the furnishing, performance or use of this material.
Malvern Instruments owns the following registered trademarks: Bohlin, FIPA, Insitec, ISYS, Kinexus, Malvern,Malvern 'Hills' logo, Mastersizer, MicroCal, Morphologi, Rosand, 'SEC-MALS', Viscosizer, Viscotek, Viscogel andZetasizer.