Embed Size (px)
Citation preview
Analysis Incentive or Disincentive Perception on
Fisherman Ocean North East Java
Abstract—Illegal unreported unregulated fishing
undermines efforts to fisheries resource in Nort Sea East Java.
As we now, fishing resource in ocean north east java has long
indicated of overfishing or can be interpreted the area in poor
condition. The Republic of Indonesia Ministry of Maritime
Affairs and Fisheries has implemented a regulatory framework
to try to reduce illegal, unregulated and unreported fishing
practices using incentive and disincentive schemes. This paper
analysis incentive or disincentive perception on fisherman
ocean north east java. We use cluster random sampling with
total respondents were 694 fishermen in 11 distric. Method of
analysis: descriptive analysis and logistic regression model. The
result showed that the policy of reducing IUU practices would
be more effective if it used a sanction mechanism (disinsentive)
rather than giving insentive to them not to carry out IUU
practuces.
Keywords—Fisheries management, Incentives, Illegal
Fishing
I. INTRODUCTION
In recent years, illegal, unreported and unregulated
fishing activities (Illegal, Unreported and Unregulated
(IUU)), have been the subject of international studies
(Varkey et al., 2010; Sodik, 2009). IUU hampers efforts to
conserve and manage fish populations in all types of capture
fisheries (Ndiaye, 2011: Chen, 2012). The Food and
Agriculture Organization (FAO) estimates that 61.3% of
marine fisheries stocks are fully exploited, 28.8% are in the
indicator of overexploitation of stocks and only 9.9% of
marine waters are categorized as below the normal
exploitation limit (under fished stock ) (Fao, 2014). This
situation certainly creates an increase in social costs and has
a negative impact on food security and protection of capture
fisheries resources. IUU fisheries activities can cause a
decrease in fish sstock continuously and hinder efforts to
rebuild stocks of fisheries that have fallen (Cisneros-
Montemayor, etc., 2013: Polacheck, 2012: Osterblom and
Folke, 2013). The scholars argue there are no effective
instruments to control IUU practices, the lack of political will
and limited human resource are the reasons for the
implementation of IUU control policies that are no effective
(Agnew et al, 2009: Stokke, 2009: Sumaila, 2012).
Especially for Indonesia, illegal fishing provides an
understanding of fishing in archipelagic waters, territorial
seas and exclusive economic zones (EEZs) of Indonesia
which do not get permission to capture through existing
regulations (Bailey, 2003). So what is meant by illegal
fishing is all types of fishing activities that are not in
accordance with existing regulations, both carried out by
Indonesian-flagged fishermen and foreign-flagged fishermen.
For the category of unreported fishing, including fishing
activities that are contrary to existing regulations, such as
fishing using trawls or catching protected species or fishing
that do not report catches (Fao, 2014: KKP, 2012). For
catches that are included in unregulated, fishing activities are
not regulated in the existing regulations. Some examples of
IUU activities in this country are like foreign ships that catch
without permission, in fishing using toxic substances, fishing
in conservation areas and catching fish without documents or
licenses.
IUU practices that occur in Indonesian waters result in
losses of up to Rp. 30 trillion every year or about 25% of the
fishery potential in Indonesia (Pusdatin DKP, 2010). This
value is not included in the long-term impacts on marine
habitats and environment, as well as negative impacts on the
social aspects of fishing communities. Some examples of
IUU of capture fisheries in this country include illegal fishing
by foreign vessels, use of toxic substances and catching fish
without a document or license. Some of the factors that
contribute to this increase in IUU fishing include the lack of
effective regulation and inadequate monitoring. The results
of the FAO study (2012) show that of the 4,326 units of ships
examined, only 20% entered the remaining court
proceedings. The origin of these violators include Indonesia
(317 people), Malaysia (10 people), Vietnam (407 people),
Thailand (270 people), Philippines (266 people), Laos (1
person), Cambodia (1 person), Myanmar ( 1 person) and
China (1 person).
The reason from the community side is the high level of
IUU activities due to poverty and high inequality between
workers in the fisheries sector and workers outside the
fisheries sector (Pauly, 1989). This condition puts pressure
on fishermen to exploit fisheries resources more in order to
fulfill their decent lives. In particular, the Ministry of Marine
Affairs and Fisheries has established a list of serious
violations in accordance with the provisions of the IUU
countermeasure action plan but has not yet arrived at
operational indicators that can be applied as a control
instrument in the field.
For example European Commission (EC) has established
a list of IUU violations along with operational control
instruments in the field. The instrument uses a point system
Muhammad Madyan
Dept Management
Faculty Economic And businees Unair
Surabaya, Indonesia
Gigih Prihantono
Dept Economics Faculty Economic And businees Unair
Surabaya,Indonesia
International Conference on Maritime and Archipelago (ICoMA 2018)
Copyright © 2019, the Authors. Published by Atlantis Press. This is an open access article under the CC BY-NC license (http://creativecommons.org/licenses/by-nc/4.0/).
Advances in Engineering Research, volume 167
154

where fishing vessels will be forced to stop temporarily if the
ship owner's fishermen have reached a certain number of
points (EC, 2009, 2011). The application of these points is
based on damage done to the marine environment that affects
fish stocks. The following indicators of serious violations
along with the points given to fishermen who violate. If the
accumulation of fisherman points reaches 18 points, the
fisherman may not go to sea for 2 months, 4 months may not
go to sea if the accumulated points increase by 36 points, 8
months cannot go to sea (54 points), 12 months may not go
to sea (72 points) and if accumulated points reach 90 so the
fisherman loses a license to catch fish.
In addition to sanctions for revocation of permits, there
are monetary sanctions ranging from Rp. 310.000($ 22) for
minor violations of up to Rp. 3.500.000 ($ 250) for
maximum violations. The scenario begins replicated for this
program to be successfully implemented, the European
Commission builds a positive perception on the community
about this regulation (Cochrane, 1999; Dimech et al., 2009).
Building positive perception on the agents involved in
regulation will contribute to the possibility of successful
policies. The establishment of agent perceptions can lead to
more effective management actions. Some studies of
economics regarding the perception of an individual / agent
are strongly influenced by the mechanism of incentives and
disincentives (Eggert and Ellegrd, 2003; Hansen et al., 2006;
Jernsen and Vestergaard, 2002).
Based on this background, this study focuses on how
implemented incentive or disincentive mechanism can
influence fisherman to comply with regulations by not
conducting IUU activities. Some empirical literature shows
that imposing monetary disincentives has a positive effect on
compliance with IUU rules (Bodman et al., 2002; Furlong,
1991; Hatcher and Gordon, 2005; Viteri and Chávez, 2007).
While other empirical studies found that attributes such as
individual morality and level of social capital also have a
positive effect on compliance with IUU rules (Jacquet et al.,
2011; Jagers et al., 2012; Hatcher et al., 2000; Kuperan and
Sutinen, 1998) From the debate on the results of the study,
this study specifically has the aim of evaluating the
perception of fishermen about the possibility of applying
incentives / disincentives to comply with fisheries rights
about IUU.
II. METHODOLOGY
This study uses a quantitative approach with primary data
sources on fishermen along the north coast of East Java
Province. Sampling in this study used the sampling method
use stratified random. The questionnaire structure consists of
three parts question. The first part is related to the incentive
mechanism. The second part is related to fisherman decision
making process and the third is related to monitoring. We
have used a four point likert scale to ask the perception
fisherman (Berghofer, 2008; Gelcich et al., 2008) to answer
each question item in the questionnaire. Where the value of 1
means very unfavorable until value 4 is very profitable. The
population studied is a ship operating in the northern sea
region of East Java which is divided into 7 regencies which
are directly adjacent to the north coast of East Java. Sampling
using cluster random sampling method. The total number of
respondents was 694 fishermen. Characteristic data of
fishermen can be seen in table 2.
The sample taken in this study uses a random sampling
method with a total of 694 ships for 7 regencies north coast
of East Java. Table 2 shows the characteristics of respondents
based on the division of the ship segment used by using the
fishing gear. As the data shown in table 2 shows the majority
of vessels classified as small scale fisheries have an average
vessel length of less than 10 m, without specialization in the
use of fishing gear. So the fisherman in carrying out their
activities uses various type fishing gear, depending on the
species they want to capture The impact is that the cost for
fishing gear for small scale fisheries fishermen is greater than
for fishermen who have specialization in the use of fishing
gear.
Small scale fishermen mostly have quite homogeneous
winning activities in each of the winning areas and the
shipowners do not make records related to income and costs.
Because of this, we are not getting enough information to
include income in statistical analysis. In terms of regulation,
small vessels have not been regulated in the marine fisheries
law (Marm, 2013). In addition to small-sized vessels, the
types of ships that often operate in the North Sea of Java are
purse seines and trawls. This type of ship can also operate far
to the sea in Kalimantan or Sulawesi.
To identify the characteristics of individual fishermen we
divide into three categories, namely social, economic and
fishing techniques which affect the amount or least of fish
catches. The econometric model built in this study uses
logistic regression models that have been used by Agresti
(1984) and Long and Cheng (2004). This model assumes
there is a proportional probability, where the coefficient
value of the variable illustrates the relationship between each
group has the same results. The logistic model can be seen in
the equation below: Pr 𝑉 = 𝐹(𝛽0 + 𝛽1𝐴𝑔𝑒 + 𝛽2𝑆ℎ𝑖𝑝𝑜𝑤𝑛𝑒𝑟 + 𝛽3𝐶𝑟𝑒𝑤
+ 𝛽4𝐿𝑒𝑛𝑔𝑡ℎ + 𝛽5𝐶𝑎𝑝𝑎𝑐𝑖𝑡𝑦+ 𝛽6 𝐹𝑖𝑠ℎ𝑖𝑛𝑔 𝑆𝑒𝑔𝑚𝑒𝑛𝑡 + 𝜇
Where for the fishing segment variable we divide based on the type of vessel as shown in table 2. We divide the dependent variable into three categories which will later display the regression results differently. The first category is related to perception related to the provision of reward and punishment. The second category is related to monetary incentives / disincentives. The third category is related to non-monetary incentives / disincentives. Then to find out if the model is in a robust condition, the proportional probability of the assumption needs to be tested through the Brand Wald test (Brant, 1990) and the likelihood-ratio test.
TABLE 1 INDICATOR ANDPOINT OF SANCTIONFOR FISHERMAN
No Indicator Point
1 Do not register on the ship sattelite communication
3
2 Use Fishing Gear Prohibited 4
3 Capturing Excess Allowable Capacity 5
4 Fishing Restricted Area 6
5 Fishing Protecting Spesies 7
6 Trade with the black list ship 7
Source : (Eropean Comision,2011)
Advances in Engineering Research, volume 167
155
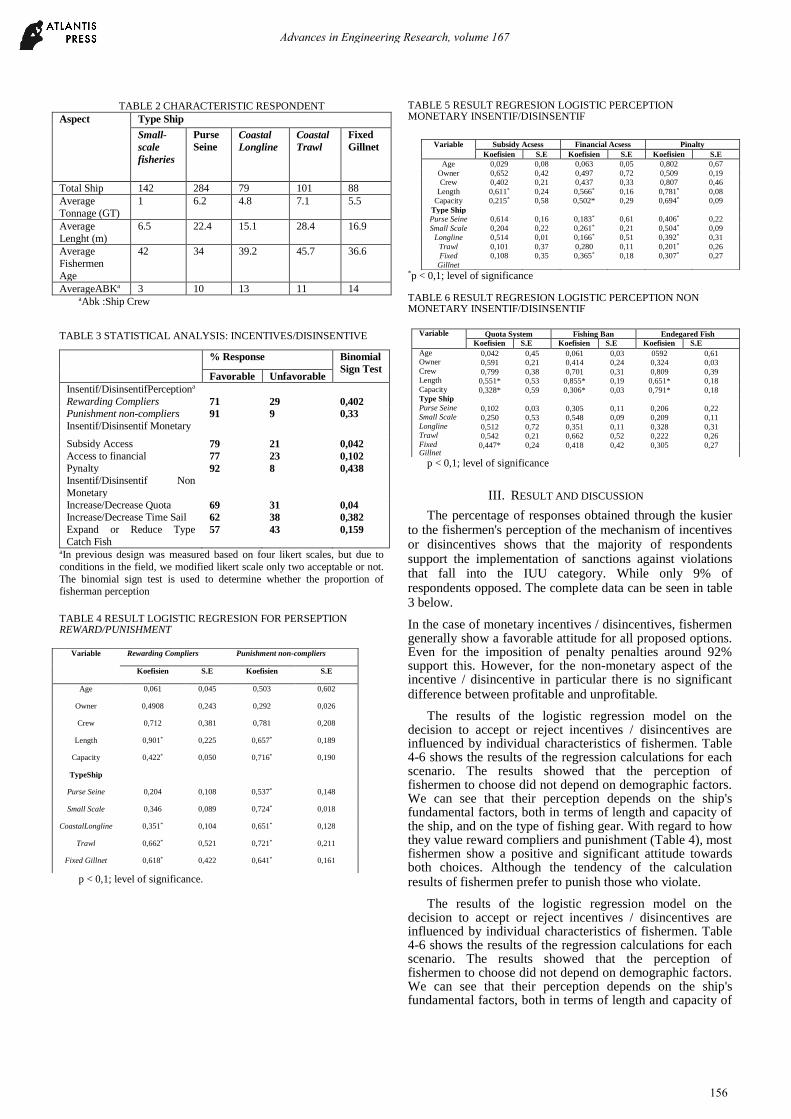
TABLE 2 CHARACTERISTIC RESPONDENT
Aspect Type Ship
Small-
scale
fisheries
Purse
Seine
Coastal
Longline
Coastal
Trawl
Fixed
Gillnet
Total Ship 142 284 79 101 88
Average
Tonnage (GT)
1 6.2 4.8 7.1 5.5
Average
Lenght (m)
6.5 22.4 15.1 28.4 16.9
Average
Fishermen
Age
42 34 39.2 45.7 36.6
AverageABKa 3 10 13 11 14 aAbk :Ship Crew
TABLE 3 STATISTICAL ANALYSIS: INCENTIVES/DISINSENTIVE
% Response Binomial
Sign Test Favorable Unfavorable
Insentif/DisinsentifPerceptiona
Rewarding Compliers 71 29 0,402
Punishment non-compliers 91 9 0,33
Insentif/Disinsentif Monetary
Subsidy Access 79 21 0,042
Access to financial 77 23 0,102
Pynalty 92 8 0,438
Insentif/Disinsentif Non
Monetary
Increase/Decrease Quota 69 31 0,04
Increase/Decrease Time Sail 62 38 0,382
Expand or Reduce Type
Catch Fish 57 43 0,159
aIn previous design was measured based on four likert scales, but due to
conditions in the field, we modified likert scale only two acceptable or not.
The binomial sign test is used to determine whether the proportion of
fisherman perception
TABLE 4 RESULT LOGISTIC REGRESION FOR PERSEPTION REWARD/PUNISHMENT
p < 0,1; level of significance.
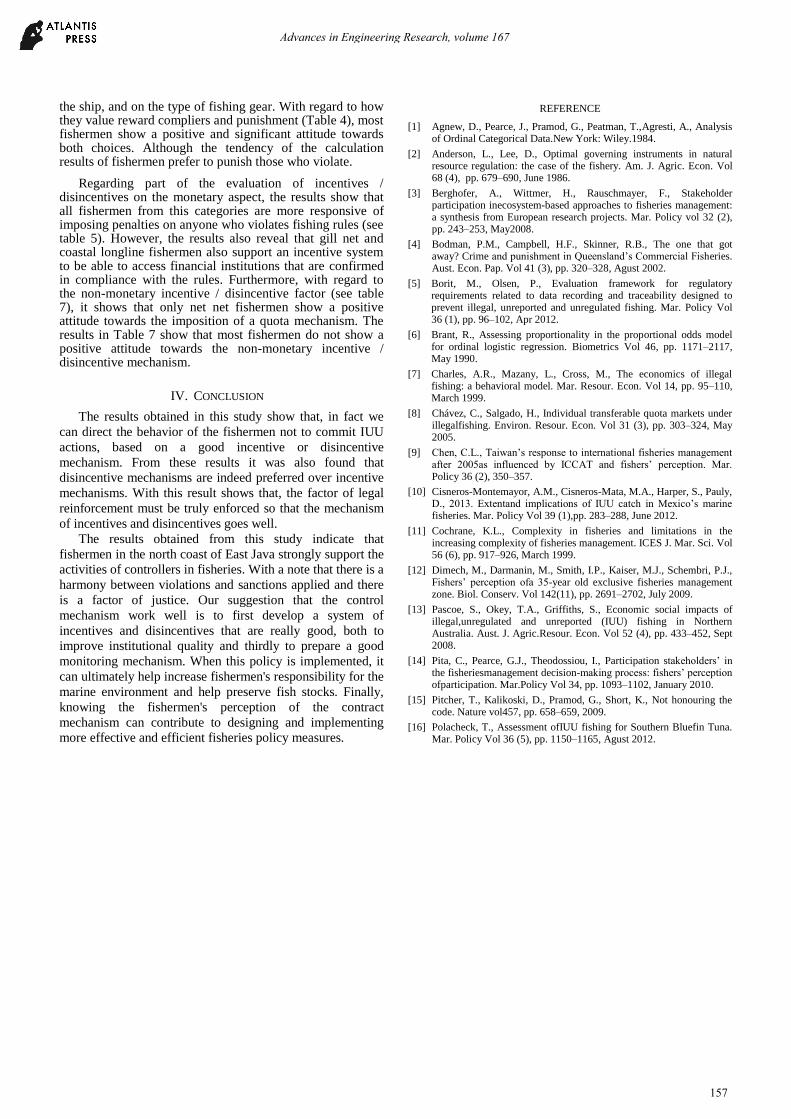
TABLE 5 RESULT REGRESION LOGISTIC PERCEPTION MONETARY INSENTIF/DISINSENTIF
*p < 0,1; level of significance TABLE 6 RESULT REGRESION LOGISTIC PERCEPTION NON MONETARY INSENTIF/DISINSENTIF
p < 0,1; level of significance
III. RESULT AND DISCUSSION
The percentage of responses obtained through the kusier to the fishermen's perception of the mechanism of incentives or disincentives shows that the majority of respondents support the implementation of sanctions against violations that fall into the IUU category. While only 9% of respondents opposed. The complete data can be seen in table 3 below.
In the case of monetary incentives / disincentives, fishermen generally show a favorable attitude for all proposed options. Even for the imposition of penalty penalties around 92% support this. However, for the non-monetary aspect of the incentive / disincentive in particular there is no significant difference between profitable and unprofitable
The results of the logistic regression model on the decision to accept or reject incentives / disincentives are influenced by individual characteristics of fishermen. Table 4-6 shows the results of the regression calculations for each scenario. The results showed that the perception of fishermen to choose did not depend on demographic factors. We can see that their perception depends on the ship's fundamental factors, both in terms of length and capacity of the ship, and on the type of fishing gear. With regard to how they value reward compliers and punishment (Table 4), most fishermen show a positive and significant attitude towards both choices. Although the tendency of the calculation results of fishermen prefer to punish those who violate.
The results of the logistic regression model on the decision to accept or reject incentives / disincentives are influenced by individual characteristics of fishermen. Table 4-6 shows the results of the regression calculations for each scenario. The results showed that the perception of fishermen to choose did not depend on demographic factors. We can see that their perception depends on the ship's fundamental factors, both in terms of length and capacity of
Variable Rewarding Compliers Punishment non-compliers
Koefisien S.E Koefisien S.E
Age 0,061 0,045 0,503 0,602
Owner 0,4908 0,243 0,292 0,026
Crew 0,712 0,381 0,781 0,208
Length 0,901* 0,225 0,657* 0,189
Capacity 0,422* 0,050 0,716* 0,190
TypeShip
Purse Seine 0,204 0,108 0,537* 0,148
Small Scale 0,346 0,089 0,724* 0,018
CoastalLongline 0,351* 0,104 0,651* 0,128
Trawl 0,662* 0,521 0,721* 0,211
Fixed Gillnet 0,618* 0,422 0,641* 0,161
Variable Subsidy Acsess Financial Acsess Pinalty
Koefisien S.E Koefisien S.E Koefisien S.E
Age 0,029 0,08 0,063 0,05 0,802 0,67
Owner 0,652 0,42 0,497 0,72 0,509 0,19
Crew 0,402 0,21 0,437 0,33 0,807 0,46
Length 0,611* 0,24 0,566* 0,16 0,781* 0,08
Capacity 0,215* 0,58 0,502* 0,29 0,694* 0,09
Type Ship
Purse Seine 0,614 0,16 0,183* 0,61 0,406* 0,22
Small Scale 0,204 0,22 0,261* 0,21 0,504* 0,09
Longline 0,514 0,01 0,166* 0,51 0,392* 0,31
Trawl 0,101 0,37 0,280 0,11 0,201* 0,26
Fixed
Gillnet
0,108 0,35 0,365* 0,18 0,307* 0,27
Variable Quota System Fishing Ban Endegared Fish
Koefisien S.E Koefisien S.E Koefisien S.E
Age 0,042 0,45 0,061 0,03 0592 0,61 Owner 0,591 0,21 0,414 0,24 0,324 0,03 Crew 0,799 0,38 0,701 0,31 0,809 0,39 Length 0,551* 0,53 0,855* 0,19 0,651* 0,18 Capacity 0,328* 0,59 0,306* 0,03 0,791* 0,18 Type Ship Purse Seine 0,102 0,03 0,305 0,11 0,206 0,22 Small Scale 0,250 0,53 0,548 0,09 0,209 0,11 Longline 0,512 0,72 0,351 0,11 0,328 0,31 Trawl 0,542 0,21 0,662 0,52 0,222 0,26 Fixed Gillnet
0,447* 0,24 0,418 0,42 0,305 0,27
Advances in Engineering Research, volume 167
156
the ship, and on the type of fishing gear. With regard to how they value reward compliers and punishment (Table 4), most fishermen show a positive and significant attitude towards both choices. Although the tendency of the calculation results of fishermen prefer to punish those who violate.
Regarding part of the evaluation of incentives / disincentives on the monetary aspect, the results show that all fishermen from this categories are more responsive of imposing penalties on anyone who violates fishing rules (see table 5). However, the results also reveal that gill net and coastal longline fishermen also support an incentive system to be able to access financial institutions that are confirmed in compliance with the rules. Furthermore, with regard to the non-monetary incentive / disincentive factor (see table 7), it shows that only net net fishermen show a positive attitude towards the imposition of a quota mechanism. The results in Table 7 show that most fishermen do not show a positive attitude towards the non-monetary incentive / disincentive mechanism.
IV. CONCLUSION
The results obtained in this study show that, in fact we
can direct the behavior of the fishermen not to commit IUU
actions, based on a good incentive or disincentive
mechanism. From these results it was also found that
disincentive mechanisms are indeed preferred over incentive
mechanisms. With this result shows that, the factor of legal
reinforcement must be truly enforced so that the mechanism
of incentives and disincentives goes well.
The results obtained from this study indicate that
fishermen in the north coast of East Java strongly support the
activities of controllers in fisheries. With a note that there is a
harmony between violations and sanctions applied and there
is a factor of justice. Our suggestion that the control
mechanism work well is to first develop a system of
incentives and disincentives that are really good, both to
improve institutional quality and thirdly to prepare a good
monitoring mechanism. When this policy is implemented, it
can ultimately help increase fishermen's responsibility for the
marine environment and help preserve fish stocks. Finally,
knowing the fishermen's perception of the contract
mechanism can contribute to designing and implementing
more effective and efficient fisheries policy measures.
REFERENCE
[1] Agnew, D., Pearce, J., Pramod, G., Peatman, T.,Agresti, A., Analysis of Ordinal Categorical Data.New York: Wiley.1984.
[2] Anderson, L., Lee, D., Optimal governing instruments in natural resource regulation: the case of the fishery. Am. J. Agric. Econ. Vol 68 (4), pp. 679–690, June 1986.
[3] Berghofer, A., Wittmer, H., Rauschmayer, F., Stakeholder participation inecosystem-based approaches to fisheries management: a synthesis from European research projects. Mar. Policy vol 32 (2), pp. 243–253, May2008.
[4] Bodman, P.M., Campbell, H.F., Skinner, R.B., The one that got away? Crime and punishment in Queensland’s Commercial Fisheries. Aust. Econ. Pap. Vol 41 (3), pp. 320–328, Agust 2002.
[5] Borit, M., Olsen, P., Evaluation framework for regulatory requirements related to data recording and traceability designed to prevent illegal, unreported and unregulated fishing. Mar. Policy Vol 36 (1), pp. 96–102, Apr 2012.
[6] Brant, R., Assessing proportionality in the proportional odds model for ordinal logistic regression. Biometrics Vol 46, pp. 1171–2117, May 1990.
[7] Charles, A.R., Mazany, L., Cross, M., The economics of illegal fishing: a behavioral model. Mar. Resour. Econ. Vol 14, pp. 95–110, March 1999.
[8] Chávez, C., Salgado, H., Individual transferable quota markets under illegalfishing. Environ. Resour. Econ. Vol 31 (3), pp. 303–324, May 2005.
[9] Chen, C.L., Taiwan’s response to international fisheries management after 2005as influenced by ICCAT and fishers’ perception. Mar. Policy 36 (2), 350–357.
[10] Cisneros-Montemayor, A.M., Cisneros-Mata, M.A., Harper, S., Pauly, D., 2013. Extentand implications of IUU catch in Mexico’s marine fisheries. Mar. Policy Vol 39 (1),pp. 283–288, June 2012.
[11] Cochrane, K.L., Complexity in fisheries and limitations in the increasing complexity of fisheries management. ICES J. Mar. Sci. Vol 56 (6), pp. 917–926, March 1999.
[12] Dimech, M., Darmanin, M., Smith, I.P., Kaiser, M.J., Schembri, P.J., Fishers’ perception ofa 35-year old exclusive fisheries management zone. Biol. Conserv. Vol 142(11), pp. 2691–2702, July 2009.
[13] Pascoe, S., Okey, T.A., Griffiths, S., Economic social impacts of illegal,unregulated and unreported (IUU) fishing in Northern Australia. Aust. J. Agric.Resour. Econ. Vol 52 (4), pp. 433–452, Sept 2008.
[14] Pita, C., Pearce, G.J., Theodossiou, I., Participation stakeholders’ in the fisheriesmanagement decision-making process: fishers’ perception ofparticipation. Mar.Policy Vol 34, pp. 1093–1102, January 2010.
[15] Pitcher, T., Kalikoski, D., Pramod, G., Short, K., Not honouring the code. Nature vol457, pp. 658–659, 2009.
[16] Polacheck, T., Assessment ofIUU fishing for Southern Bluefin Tuna. Mar. Policy Vol 36 (5), pp. 1150–1165, Agust 2012.
Advances in Engineering Research, volume 167
157