Embed Size (px)
Citation preview

Analysis of abatement measures in the Cement and Aluminum Sectors
Nadine Allemand (TFTEI Technical Secretariat, Citepa) Simon Glöser-Chahoud (TFTEI Technical Secretariat, KIT/DFIU)
1Joint EECCA_CG-TFTEI Virtual Workshop, April 26-27, 2021

Agenda
2
Abatement measures in the cement industries
Overview of TFTEI work on cement production
Informal technical document on BATs in the cement sector
Abatement measures in the aluminium industries
Overview of TFTEI work on aluminium production
Informal technical document on BATs in the Aluminium
sector
Joint EECCA_CG-TFTEI Virtual Workshop, April 26-27, 2021

Overview of the work
3
Limit values and emission reduction commitments in the Amended Gothenburg Protocol
A document providing information on reduction techniques for SO2, NOx and PM and their costs
Update an existing document from 2005 and information developed for the revision of the Gothenburg Protocol

Reduction techniques for NOx
4
Primary measures such as “Multi-Stage Combustion (MSC)”:o 500-800 mg/Nm3 at 10%O2 daily average
SNCR (Selective Non-Catalytic Reduction)o Les than 500 mg/Nm3 up to possibly 300 mg/Nm3 in some specific cases
SCR (Selective Catalytic Reduction)o 200 mg/Nm3 at 10% O2 daily average, can be obtained
Beilmann R. 2016. NOx in Cement Clinker Production

Equipment in NOx emission reduction techniques
5
Source: Cinti J. Experience on NOx emission reduction- TFTEI berlin workshop 2019

Costs of SCR for cement plants
6
SCR Updated cost data
Average daily NOx concentrations to be abated mg/Nm3 at 10%O2 1200Outlet daily NOx concentrations reached mg/Nm3 at 10%O2 200Investments (Capex) kEuros 5000-15000Operational cost (Opex) Euro per t clinker 0.3-1.1Electricity consumption kWh per t clinker 3-7
For a plant of 3000 t clinker per day : o Emissions are reduced from 2650 t/year to 440 t
Considering a lifetime of 20 y and 4% interest rate, the annual costs range between:o 655 k€/y to 2160 k€/yearo 0.70 to 2.15 €/t clinkero 300 to 980 €/t NOx abated

Reduction techniques for dust emissions
7
For the kiln firing processes and cooling and milling processes, BAT associated emission levels range from <10 – 20 mg/Nm3 , as the daily average value. ESP and fabric filters are used.
For diffuse emissions from dustyoperations, reduction measures can beencapsulation of some operations, covering conveyors…
Thermax enviro: pulse jet fabric filter
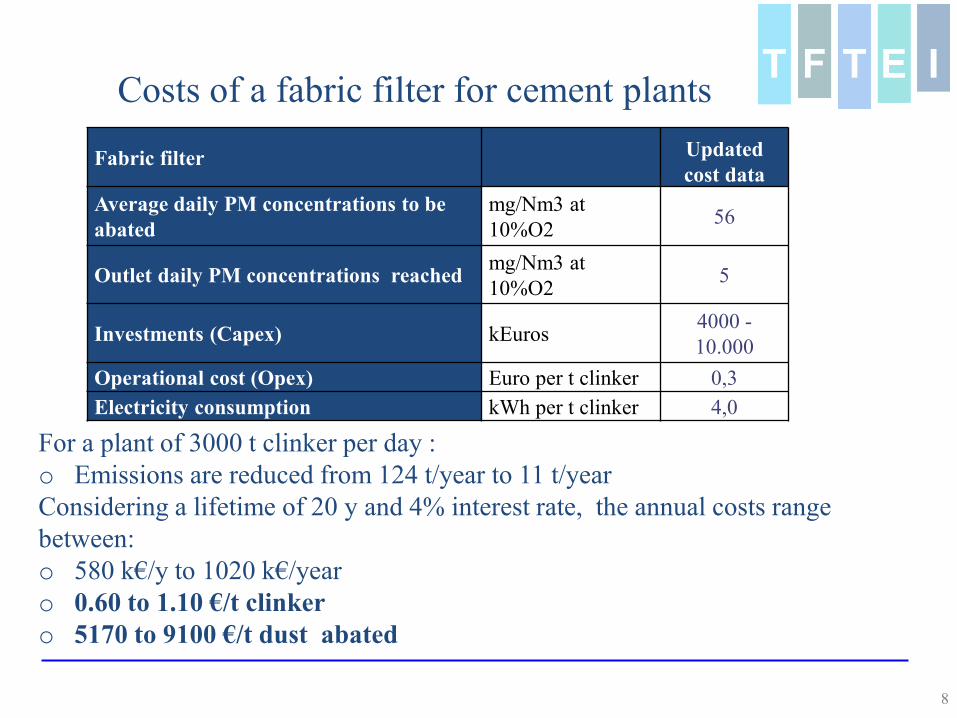
Costs of a fabric filter for cement plants
8
Fabric filter Updated cost data
Average daily PM concentrations to be abated
mg/Nm3 at 10%O2 56
Outlet daily PM concentrations reached mg/Nm3 at 10%O2 5
Investments (Capex) kEuros 4000 -10.000
Operational cost (Opex) Euro per t clinker 0,3Electricity consumption kWh per t clinker 4,0
For a plant of 3000 t clinker per day : o Emissions are reduced from 124 t/year to 11 t/yearConsidering a lifetime of 20 y and 4% interest rate, the annual costs range between:o 580 k€/y to 1020 k€/yearo 0.60 to 1.10 €/t clinkero 5170 to 9100 €/t dust abated

Reduction techniques for SO2
9
SO2 emissions from cement plants depend on the total input of sulphur compounds and the type of process used and are primarily determined by the content of the volatile sulphur in the raw materials and possibly by the fuels. Primary measures:
o optimisation techniques, such as optimising the clinker burning process including the smoothing of kiln operation,
o uniform distribution of the hot meal in the kiln riser o prevention of reducing conditions in the burning process o choice of raw materials and fuels
Secondary measures when SO2 emission are high:o Addition of absorbent such as slaked lime, quick lime…to the raw materialo Dry adsorption in a dry scrubbero Wet scrubber
The BAT AEL as daily average value, ranges from < 50 to 400 mg/Nm3

Costs of adsorbent injection for cement plants
10
Adsorbent injection Updated cost data
Average dailySO2 concentrations to be abated
mg/Nm3 at 10%O2 600-1000
Outlet daily SO2 concentrations reached
mg/Nm3 at 10%O2 400
Investments (Capex) kEuros 200-750
Operational cost (Opex) Euro per t clinker0.3 - 0.7
Electricity consumption kWh per t clinker0.1 - 0.3
For a plant of 3000 t clinker per day : o Emissions are reduced by 440 to 1320 t /y
Considering a lifetime of 20 y and 4% interest rate, the annual costs range between:o 300 k€/y to 730 k€/yearo 0.30 to 0.80 €/t clinkero 700 to 1650 €/t SO2 abated

Agenda
11
Abatement measures in the cement industries
Overview of TFTEI work on cement production
Informal technical document on BATs in the cement sector
Abatement measures in the aluminium industries
Overview of TFTEI work on aluminium production
Informal technical document on BATs in the aluminium
sector
Joint EECCA_CG-TFTEI Virtual Workshop, April 26-27, 2021

Task force on Techno-Economic Issues
BAT reference document (BREF) for non-ferrous metals
12
Comprehensive description and specification of emission abatement technologies for major non-ferrous metals copper and its alloys; aluminium and its alloys; lead and tin; zinc and cadmium; precious metals; ferro-alloys (e.g. FeCr, FeSi, FeMn,); nickel and cobalt; carbon and graphite electrodes.
> 1000 pages of partly site specific data Skipping between different abatement
technologies and sections necessary to extract information
Joint EECCA_CG-TFTEI Virtual Workshop, April 26-27, 2021
Task force on Techno-Economic Issues
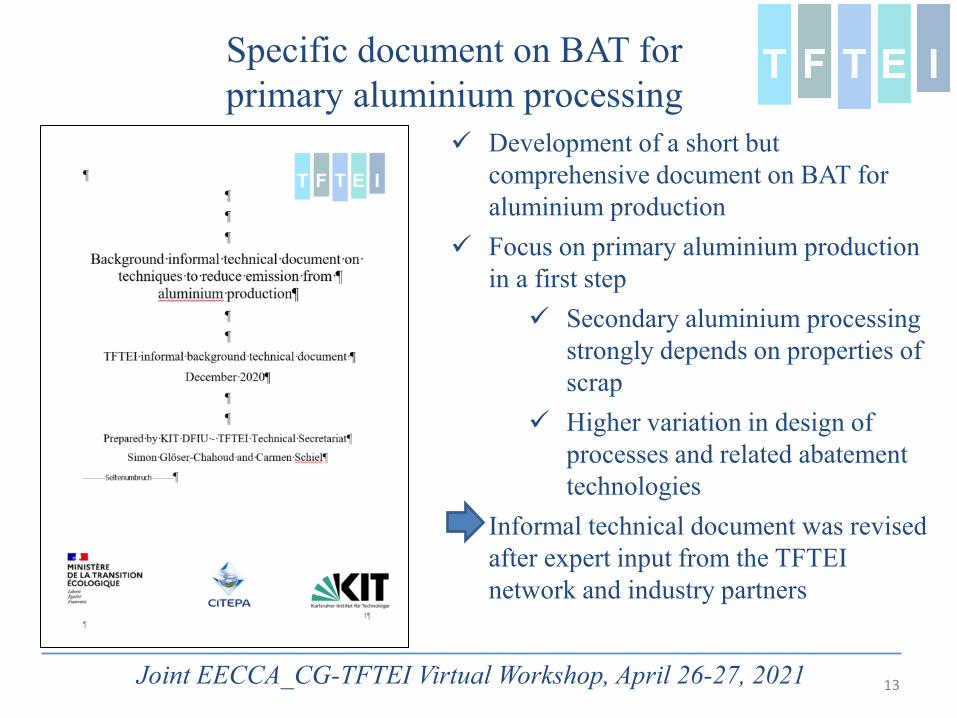
Specific document on BAT for primary aluminium processing
13
Development of a short but comprehensive document on BAT for aluminium production
Focus on primary aluminium production in a first step Secondary aluminium processing
strongly depends on properties of scrap
Higher variation in design of processes and related abatement technologies
Informal technical document was revised after expert input from the TFTEI network and industry partners
Joint EECCA_CG-TFTEI Virtual Workshop, April 26-27, 2021

Task force on Techno-Economic Issues
1. Calcination of Bauxite to produce Alumina (Bayer Process)
2. Production of electrode materials for fused-salt electrolysis
3. Fused-salt electrolysis (Hall-Héroult Process)
1. Prebake cell
2. Soderberg cell
4. Casting, further treatment
Basic processing steps in primary aluminium production
14Joint EECCA_CG-TFTEI Virtual Workshop, April 26-27, 2021
Molten aluminumBayer Process
Basic processing of primary aluminum
Bauxite concentrates Alumina (Al2O3)
Fused-salt electrolysis
Casting, further treatment
Fuels Electricity Fuels
Anodes

Task force on Techno-Economic Issues
Main technologies for aluminium electrolysis
15
Cell technology Cell type Anode
configurationAlumina feed configuration Acronym Breakdown in
Europe
Prebake cellCentre worked
Vertical Bar broken centre feed CWPB (*) None
Vertical Point centre feed PFPB 90 %
Side-worked Vertical Manual side feed SWPB (*) None
Søderberg cell
Vertical stud VerticalManual side feed SWVSS (*) None
Point feed PFVSS 10 %
Horizontal stud Horizontal
Manual side feed
HSS (*) NoneBar broken feedPoint feed
(*): No longer in operation in Europe.
The Søderberg technology uses a continuous anode, which is introduced into the cell as a paste and then bakes in the cell itself.
The Prebake technology uses multiple anodes in each cell, which are baked in a separate facility.
Source: USGS (2018), German Environmental Agency UBA (2018)
Joint EECCA_CG-TFTEI Virtual Workshop, April 26-27, 2021

Task force on Techno-Economic Issues
Fused-salt electrolysis (Hall-Héroult Process)
16
+
-
Molten aluminum
Graphite anodes
Al2O3 dissolved in molten cryolite
Key abatement technologies Avoidance of „anode effect“ in which PFCs are formed
Point feeding of anodes and alumina, computer controlled voltage Efficient gas collection from electrolytic cells
Fluoride “scrubbing systems” use alumina to extract gaseous fluoride from pot gases (alternative scrubbing with crushed limestone or water).
Wet scrubbing for the Søderberg process and boosted suction systems in combination with dry alumina scrubbing for the Prebake process.
Joint EECCA_CG-TFTEI Virtual Workshop, April 26-27, 2021
Emission parameter Prebake (PFPB) SøderbergTotal fluorides (kg/kg Al) 250-450*10-6 300-600*10-6
Dust (kg/kg Al) 200-600*10-6 800-1400*10-6
SO2 (kg/kg Al) 0.01-0.025 not reported
Total emissions to air from primary aluminium production (smelting and electrolysis)with the currently highest levels of abatement technologies (Cusano et al., 2017).

Task force on Techno-Economic Issues
Emission levels and abatement technologies in the EU BAT conclusions
17Joint EECCA_CG-TFTEI Virtual Workshop, April 26-27, 2021
Emission parameter BAT defined in the European conclusions Emission level kg/kg Alexisting new plant
Dust Dry scrubber using alumina as the adsorbent agent followed by a bag filter (and potentially an additional wet scrubber if applicable)
1200*10-6 600*10-6
Total fluorides, mainly HF
600*10-6 350*10-6
SO2 Use of low-sulphur anodes and wet scrubbing system if applicable
0,0025-0,015 0,0025-0,015
Perfluorocarbons,mainly Perfluoroethane
andPerfluormethane
• Automatic multiple point feeding of alumina
• Automatic anode effect suppression • Computer control of the electrolysis
process based on active cell databases and monitoring of cell operating parameters
not reported not reported
• Emission levels for aluminium smelting and electrolysis• Wet scrubbers are only used in case of very high off-gas flow rates, due to cross-
media effects and in case of the availability of large volumes of water
• The BREF document provides a vast and up-to-date collection of relevant abatement technologies that meet current EU emission levels

Analysis of abatement measures in the Cement and Aluminum Sectors
BACKUP
Nadine Allemand (TFTEI Technical Secretariat, CITEPA) Simon Glöser-Chahoud (TFTEI Technical Secretariat, KIT/DFIU)
18

Task force on Techno-Economic Issues
Alumina production and related emissions (Bayer Process)
19
Bauxite Pressure vessel
Milling / crushing
NaOH
Filtering
Red mud
Na[Al(OH)4]
Cooling & crystallization WaterAl(OH)3
(crystallization seed)
Rotary clin(calcination)
Aluminum oxide
Emission parameter Emission valueDust (kg/kg alumina) 50-100*10-6
NOx (kg/kg alumina) 100-200*10-6
CO2 (kg/kg alumina) not reported
Dust from milling / crushing and further treatment most relevant air emission
NOx, SOx emissions depend on fuel and combustion technologies
Emission ranges for different plants taken from the BAT document
Joint EECCA_CG-TFTEI Virtual Workshop, April 26-27, 2021

Task force on Techno-Economic Issues
Emission abatement technologies for alumina production
20
Exemplary values for different plants taken from the BAT document
Clean gas
Process air flow in
Dust discharge
Mechanical discharge of
dust from fibres
Gas flow in
Discharge of dust
Isolator
Clean gas
Discharge electrode
Collector electrode
bag filter electrostatic precipitator (ESP)
Average flue gas flow (Nm3/h) Abatementtechnology
Average emission value of dust mg/Nm3 (kg/t alumina)
220 000 ESP 68 0.1300 000 ESP 23 0.01107 000 Fabric filter 23 0.0793 000 Fabric filter 23 0.05
Joint EECCA_CG-TFTEI Virtual Workshop, April 26-27, 2021

Anode production
21
Production process: Raw materials: petroleum coke, coal tar
bits or recycled anode butts Distinction between Prebake and
Soderberg anodes Forming and baking at around 1200°C Graphitization
Proposed abatement technologies Bag filters for dust (alternatively ESP
with cyclone) Recuperative incinerators for VOC Coke scrubbers for pitch vapors Treatment of fluorides in case of the
use of recycled anode butts
Concept of a recuperative incinerator
Emission parameter Emission valueTotal fluoride (kg/kg anode) 10-100*10-6
Dust (kg/kg anode) 10-1000*10-6
SO2 (kg/kg anode) 100 - 6000*10-6
NOx (kg/kg anode) 100 - 400*10-6
BaP (kg/kg anode) 0-3*10-6
Emission ranges for different plants taken from the BAT document
Joint EECCA_CG-TFTEI Virtual Workshop, April 26-27, 2021