Embed Size (px)
Citation preview
*Associate Professor (formerly Kobori Research Complex, Kajima Corporation)sResearch Engineer
CCC 0098—8847/97/030377—17 Received 30 November 1995( 1997 by John Wiley & Sons, Ltd. Revised 17 September 1996
EARTHQUAKE ENGINEERING AND STRUCTURAL DYNAMICS, VOL. 26, 377—393 (1997)
ANALYSIS OF AMPLIFICATION CHARACTERISTICS OF GROUNDMOTIONS IN THE HEAVILY DAMAGED BELT ZONE DURING
THE 1995 HYOGO-KEN NANBU EARTHQUAKE
MASATO MOTOSAKA*
Earthquake Engineering Division, Disaster Control Research Center, Faculty of Engineering, Tohoku University,Aramaki-Aoba, Aoba-ku, Sendai 980-77, Japan
AND
MASAYUKI NAGANOs
Kobori Research Complex, Kajima Corporation, Tokyo, Japan
SUMMARY
To estimate the amplification characteristics of ground motions in the heavily damaged belt zone in Kobe City during the1995 Hyogo-ken Nanbu earthquake, 3D wave propagation analyses of a 2D deep irregular underground structure modelwith a vertical discontinuity were performed at an early stage as a preliminary and qualitative study. The hyperelementmethod was applied to the analyses for incident plane waves expected from the wavefields due to the source mechanism.The observation records at Kobe University of the rock site were used as control motions. The ground motions on theengineering bedrock (assumed to be on the free surface of the Osaka group layers having a shear velocity of 500m/s) andat ground surface were calculated. The effects of the deep irregular underground structure and shallow surface layers onthe ground motion amplification are discussed. Although there are qualifications due to the uncertain characteristics ofthe input rock motion and shear wave velocities of the underground structure, the analytical results show that the groundmotion in the heavily damaged belt zone were amplified due to the focusing effect of the deep irregular undergroundstructure as well as the shallow surface layers, and that the calculated peak ground acceleration (PGA) distributioncoincided closely with the distributions of structural damage.
KEY WORDS: Hyogo-ken Nanbu Earthquake; damaged belt zone; deep irregular underground structure; focusing effect; wavepropagation analysis; hyperelement method
1. INTRODUCTION
A characteristic damage distribution occurred in Kobe City during the 1995 Hyogo-ken Nanbu earthquake,concentrated along the 1—2 km-wide heavily damaged belt zone1 is shown in Figure 1. The highest death tolland most of the injured were concentrated in this zone, where the JMA seismic intensity was VII. Thesouthernmost Rokko geological faults are also plotted as a broken line in Figure 1. It is noted that the heavilydamaged belt zone is located south of the Rokko faults. Seismic observations recorded there very large velocityand acceleration amplitudes normal to the Rokko faults. The recorded peak ground acceleration (PGA) atFukiai (FKI) in the belt zone exceeded 800 cm/s2 and the PGA and the peak ground velocity (PGV) at Takatori(TKT) exceeded 600 cm/s2 and 130 cm/s in two horizontal directions both in the belt zone, while the PGAobserved at the Kobe University (KBU), in a rock site outside the belt zone, was about 300 cm/s2 or less and themaximum velocity was 55 cm/s.2,3 The locations of these and other observation sites are indicated in Figure 1.
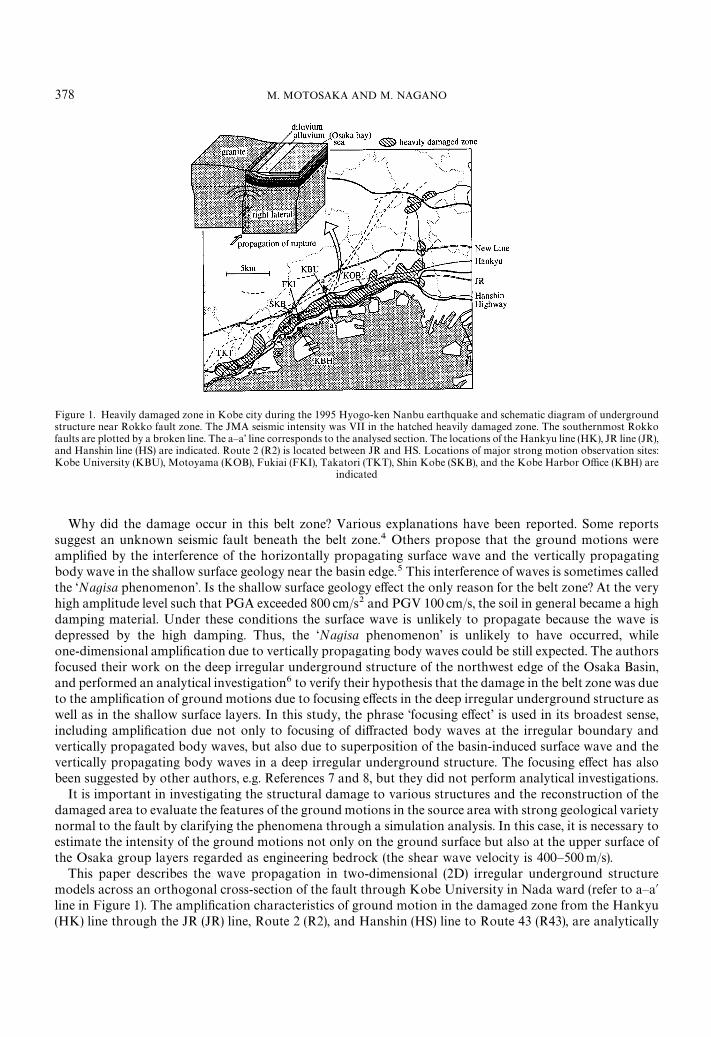
Figure 1. Heavily damaged zone in Kobe city during the 1995 Hyogo-ken Nanbu earthquake and schematic diagram of undergroundstructure near Rokko fault zone. The JMA seismic intensity was VII in the hatched heavily damaged zone. The southernmost Rokkofaults are plotted by a broken line. The a—a’ line corresponds to the analysed section. The locations of the Hankyu line (HK), JR line (JR),and Hanshin line (HS) are indicated. Route 2 (R2) is located between JR and HS. Locations of major strong motion observation sites:Kobe University (KBU), Motoyama (KOB), Fukiai (FKI), Takatori (TKT), Shin Kobe (SKB), and the Kobe Harbor Office (KBH) are
indicated
Why did the damage occur in this belt zone? Various explanations have been reported. Some reportssuggest an unknown seismic fault beneath the belt zone.4 Others propose that the ground motions wereamplified by the interference of the horizontally propagating surface wave and the vertically propagatingbody wave in the shallow surface geology near the basin edge.5 This interference of waves is sometimes calledthe ‘Nagisa phenomenon’. Is the shallow surface geology effect the only reason for the belt zone? At the veryhigh amplitude level such that PGA exceeded 800 cm/s2 and PGV 100 cm/s, the soil in general became a highdamping material. Under these conditions the surface wave is unlikely to propagate because the wave isdepressed by the high damping. Thus, the ‘Nagisa phenomenon’ is unlikely to have occurred, whileone-dimensional amplification due to vertically propagating body waves could be still expected. The authorsfocused their work on the deep irregular underground structure of the northwest edge of the Osaka Basin,and performed an analytical investigation6 to verify their hypothesis that the damage in the belt zone was dueto the amplification of ground motions due to focusing effects in the deep irregular underground structure aswell as in the shallow surface layers. In this study, the phrase ‘focusing effect’ is used in its broadest sense,including amplification due not only to focusing of diffracted body waves at the irregular boundary andvertically propagated body waves, but also due to superposition of the basin-induced surface wave and thevertically propagating body waves in a deep irregular underground structure. The focusing effect has alsobeen suggested by other authors, e.g. References 7 and 8, but they did not perform analytical investigations.
It is important in investigating the structural damage to various structures and the reconstruction of thedamaged area to evaluate the features of the ground motions in the source area with strong geological varietynormal to the fault by clarifying the phenomena through a simulation analysis. In this case, it is necessary toestimate the intensity of the ground motions not only on the ground surface but also at the upper surface ofthe Osaka group layers regarded as engineering bedrock (the shear wave velocity is 400—500m/s).
This paper describes the wave propagation in two-dimensional (2D) irregular underground structuremodels across an orthogonal cross-section of the fault through Kobe University in Nada ward (refer to a—a@line in Figure 1). The amplification characteristics of ground motion in the damaged zone from the Hankyu(HK) line through the JR (JR) line, Route 2 (R2), and Hanshin (HS) line to Route 43 (R43), are analytically
378 M. MOTOSAKA AND M. NAGANO
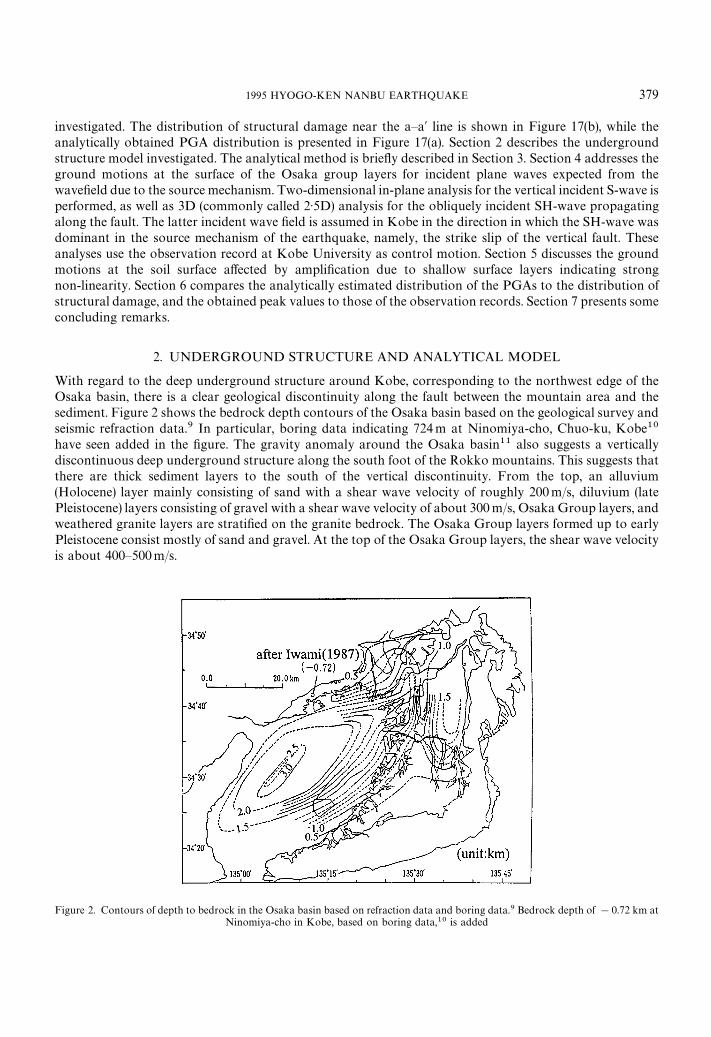
Figure 2. Contours of depth to bedrock in the Osaka basin based on refraction data and boring data.9 Bedrock depth of !0.72 km atNinomiya-cho in Kobe, based on boring data,10 is added
investigated. The distribution of structural damage near the a—a@ line is shown in Figure 17(b), while theanalytically obtained PGA distribution is presented in Figure 17(a). Section 2 describes the undergroundstructure model investigated. The analytical method is briefly described in Section 3. Section 4 addresses theground motions at the surface of the Osaka group layers for incident plane waves expected from thewavefield due to the source mechanism. Two-dimensional in-plane analysis for the vertical incident S-wave isperformed, as well as 3D (commonly called 2·5D) analysis for the obliquely incident SH-wave propagatingalong the fault. The latter incident wave field is assumed in Kobe in the direction in which the SH-wave wasdominant in the source mechanism of the earthquake, namely, the strike slip of the vertical fault. Theseanalyses use the observation record at Kobe University as control motion. Section 5 discusses the groundmotions at the soil surface affected by amplification due to shallow surface layers indicating strongnon-linearity. Section 6 compares the analytically estimated distribution of the PGAs to the distribution ofstructural damage, and the obtained peak values to those of the observation records. Section 7 presents someconcluding remarks.
2. UNDERGROUND STRUCTURE AND ANALYTICAL MODEL
With regard to the deep underground structure around Kobe, corresponding to the northwest edge of theOsaka basin, there is a clear geological discontinuity along the fault between the mountain area and thesediment. Figure 2 shows the bedrock depth contours of the Osaka basin based on the geological survey andseismic refraction data.9 In particular, boring data indicating 724m at Ninomiya-cho, Chuo-ku, Kobe10have seen added in the figure. The gravity anomaly around the Osaka basin11 also suggests a verticallydiscontinuous deep underground structure along the south foot of the Rokko mountains. This suggests thatthere are thick sediment layers to the south of the vertical discontinuity. From the top, an alluvium(Holocene) layer mainly consisting of sand with a shear wave velocity of roughly 200m/s, diluvium (latePleistocene) layers consisting of gravel with a shear wave velocity of about 300 m/s, Osaka Group layers, andweathered granite layers are stratified on the granite bedrock. The Osaka Group layers formed up to earlyPleistocene consist mostly of sand and gravel. At the top of the Osaka Group layers, the shear wave velocityis about 400—500m/s.
1995 HYOGO-KEN NANBU EARTHQUAKE 379
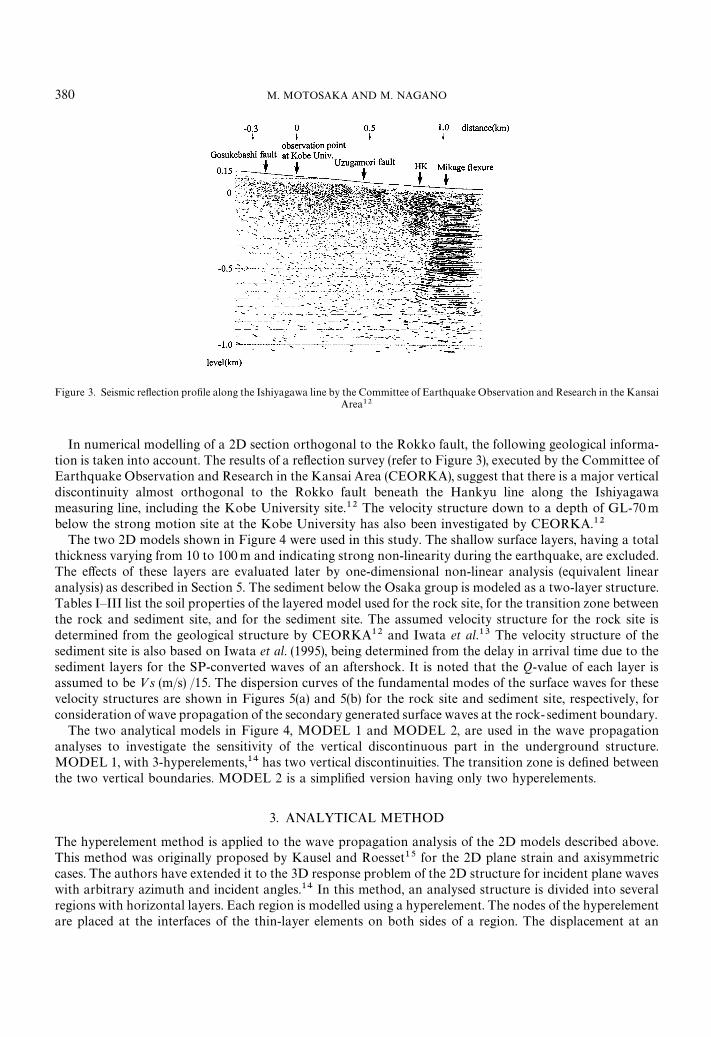
Figure 3. Seismic reflection profile along the Ishiyagawa line by the Committee of Earthquake Observation and Research in the KansaiArea12
In numerical modelling of a 2D section orthogonal to the Rokko fault, the following geological informa-tion is taken into account. The results of a reflection survey (refer to Figure 3), executed by the Committee ofEarthquake Observation and Research in the Kansai Area (CEORKA), suggest that there is a major verticaldiscontinuity almost orthogonal to the Rokko fault beneath the Hankyu line along the Ishiyagawameasuring line, including the Kobe University site.12 The velocity structure down to a depth of GL-70mbelow the strong motion site at the Kobe University has also been investigated by CEORKA.12
The two 2D models shown in Figure 4 were used in this study. The shallow surface layers, having a totalthickness varying from 10 to 100 m and indicating strong non-linearity during the earthquake, are excluded.The effects of these layers are evaluated later by one-dimensional non-linear analysis (equivalent linearanalysis) as described in Section 5. The sediment below the Osaka group is modeled as a two-layer structure.Tables I—III list the soil properties of the layered model used for the rock site, for the transition zone betweenthe rock and sediment site, and for the sediment site. The assumed velocity structure for the rock site isdetermined from the geological structure by CEORKA12 and Iwata et al.13 The velocity structure of thesediment site is also based on Iwata et al. (1995), being determined from the delay in arrival time due to thesediment layers for the SP-converted waves of an aftershock. It is noted that the Q-value of each layer isassumed to be »s (m/s) /15. The dispersion curves of the fundamental modes of the surface waves for thesevelocity structures are shown in Figures 5(a) and 5(b) for the rock site and sediment site, respectively, forconsideration of wave propagation of the secondary generated surface waves at the rock-sediment boundary.
The two analytical models in Figure 4, MODEL 1 and MODEL 2, are used in the wave propagationanalyses to investigate the sensitivity of the vertical discontinuous part in the underground structure.MODEL 1, with 3-hyperelements,14 has two vertical discontinuities. The transition zone is defined betweenthe two vertical boundaries. MODEL 2 is a simplified version having only two hyperelements.
3. ANALYTICAL METHOD
The hyperelement method is applied to the wave propagation analysis of the 2D models described above.This method was originally proposed by Kausel and Roesset15 for the 2D plane strain and axisymmetriccases. The authors have extended it to the 3D response problem of the 2D structure for incident plane waveswith arbitrary azimuth and incident angles.14 In this method, an analysed structure is divided into severalregions with horizontal layers. Each region is modelled using a hyperelement. The nodes of the hyperelementare placed at the interfaces of the thin-layer elements on both sides of a region. The displacement at an
380 M. MOTOSAKA AND M. NAGANO
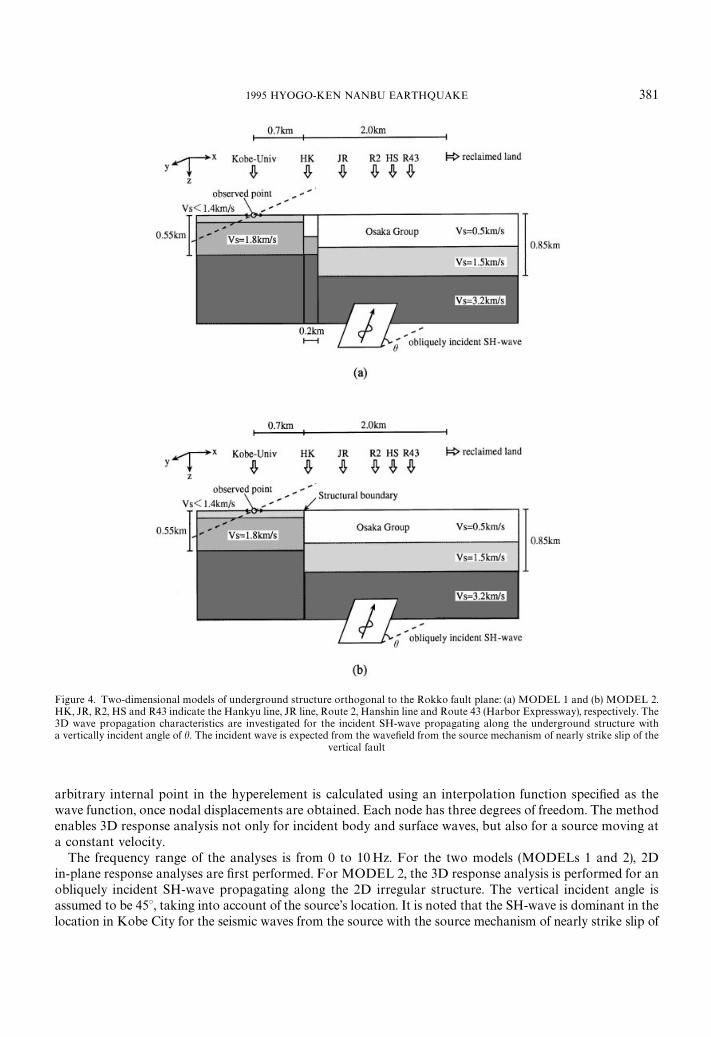
Figure 4. Two-dimensional models of underground structure orthogonal to the Rokko fault plane: (a) MODEL 1 and (b) MODEL 2.HK, JR, R2, HS and R43 indicate the Hankyu line, JR line, Route 2, Hanshin line and Route 43 (Harbor Expressway), respectively. The3D wave propagation characteristics are investigated for the incident SH-wave propagating along the underground structure witha vertically incident angle of h. The incident wave is expected from the wavefield from the source mechanism of nearly strike slip of the
vertical fault
arbitrary internal point in the hyperelement is calculated using an interpolation function specified as thewave function, once nodal displacements are obtained. Each node has three degrees of freedom. The methodenables 3D response analysis not only for incident body and surface waves, but also for a source moving ata constant velocity.
The frequency range of the analyses is from 0 to 10 Hz. For the two models (MODELs 1 and 2), 2Din-plane response analyses are first performed. For MODEL 2, the 3D response analysis is performed for anobliquely incident SH-wave propagating along the 2D irregular structure. The vertical incident angle isassumed to be 45°, taking into account of the source’s location. It is noted that the SH-wave is dominant in thelocation in Kobe City for the seismic waves from the source with the source mechanism of nearly strike slip of
1995 HYOGO-KEN NANBU EARTHQUAKE 381
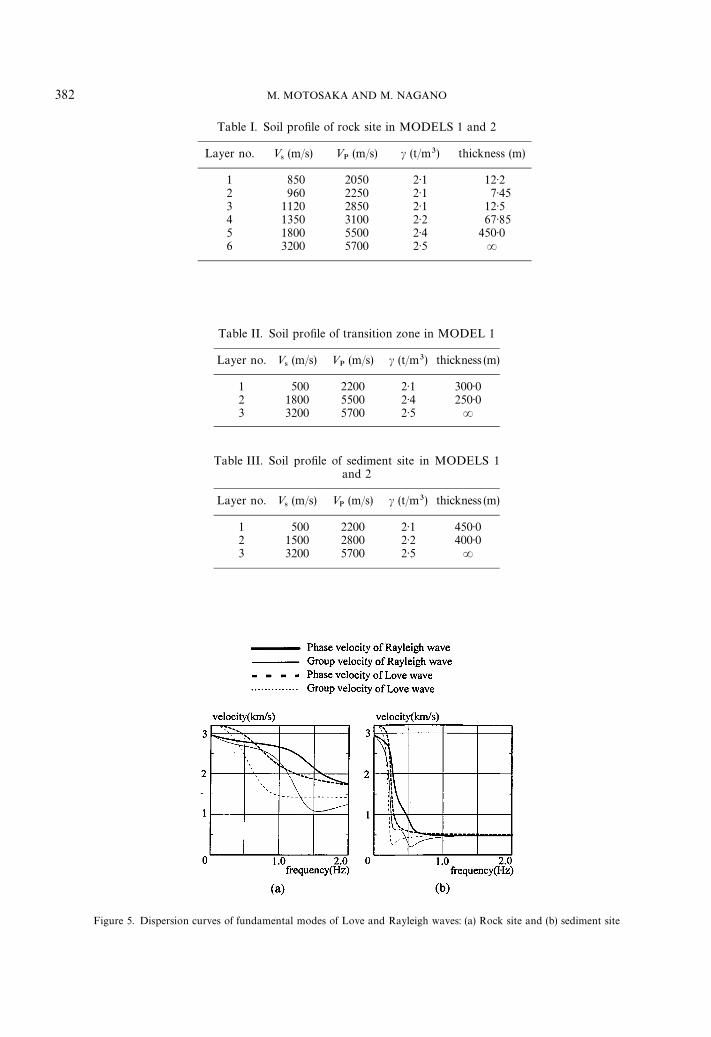
Table I. Soil profile of rock site in MODELS 1 and 2
Layer no. »4(m/s) »
P(m/s) c (t/m3) thickness (m)
1 850 2050 2·1 12·22 960 2250 2·1 7·453 1120 2850 2·1 12·54 1350 3100 2·2 67·855 1800 5500 2·4 450·06 3200 5700 2·5 R
Table II. Soil profile of transition zone in MODEL 1
Layer no. »4(m/s) »
P(m/s) c (t/m3) thickness (m)
1 500 2200 2·1 300·02 1800 5500 2·4 250·03 3200 5700 2·5 R
Table III. Soil profile of sediment site in MODELS 1and 2
Layer no. »4(m/s) »
P(m/s) c (t/m3) thickness (m)
1 500 2200 2·1 450·02 1500 2800 2·2 400·03 3200 5700 2·5 R
Figure 5. Dispersion curves of fundamental modes of Love and Rayleigh waves: (a) Rock site and (b) sediment site
382 M. MOTOSAKA AND M. NAGANO
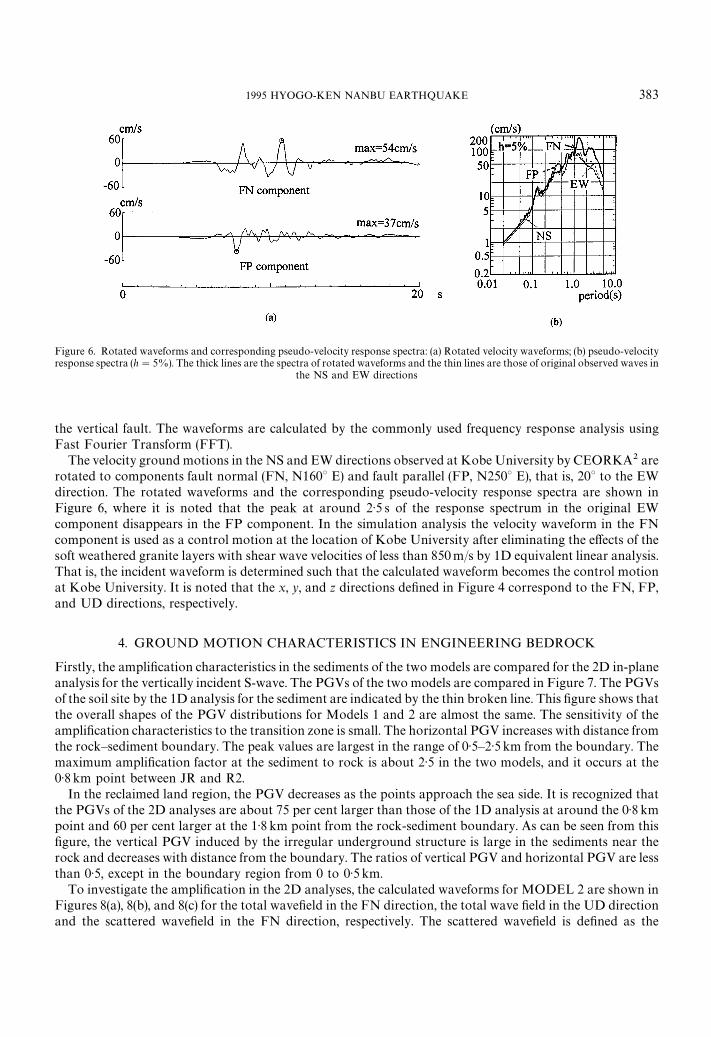
Figure 6. Rotated waveforms and corresponding pseudo-velocity response spectra: (a) Rotated velocity waveforms; (b) pseudo-velocityresponse spectra (h"5%). The thick lines are the spectra of rotated waveforms and the thin lines are those of original observed waves in
the NS and EW directions
the vertical fault. The waveforms are calculated by the commonly used frequency response analysis usingFast Fourier Transform (FFT).
The velocity ground motions in the NS and EW directions observed at Kobe University by CEORKA2 arerotated to components fault normal (FN, N160° E) and fault parallel (FP, N250° E), that is, 20° to the EWdirection. The rotated waveforms and the corresponding pseudo-velocity response spectra are shown inFigure 6, where it is noted that the peak at around 2·5 s of the response spectrum in the original EWcomponent disappears in the FP component. In the simulation analysis the velocity waveform in the FNcomponent is used as a control motion at the location of Kobe University after eliminating the effects of thesoft weathered granite layers with shear wave velocities of less than 850m/s by 1D equivalent linear analysis.That is, the incident waveform is determined such that the calculated waveform becomes the control motionat Kobe University. It is noted that the x, y, and z directions defined in Figure 4 correspond to the FN, FP,and UD directions, respectively.
4. GROUND MOTION CHARACTERISTICS IN ENGINEERING BEDROCK
Firstly, the amplification characteristics in the sediments of the two models are compared for the 2D in-planeanalysis for the vertically incident S-wave. The PGVs of the two models are compared in Figure 7. The PGVsof the soil site by the 1D analysis for the sediment are indicated by the thin broken line. This figure shows thatthe overall shapes of the PGV distributions for Models 1 and 2 are almost the same. The sensitivity of theamplification characteristics to the transition zone is small. The horizontal PGV increases with distance fromthe rock—sediment boundary. The peak values are largest in the range of 0·5—2·5km from the boundary. Themaximum amplification factor at the sediment to rock is about 2·5 in the two models, and it occurs at the0·8 km point between JR and R2.
In the reclaimed land region, the PGV decreases as the points approach the sea side. It is recognized thatthe PGVs of the 2D analyses are about 75 per cent larger than those of the 1D analysis at around the 0·8 kmpoint and 60 per cent larger at the 1·8 km point from the rock-sediment boundary. As can be seen from thisfigure, the vertical PGV induced by the irregular underground structure is large in the sediments near therock and decreases with distance from the boundary. The ratios of vertical PGV and horizontal PGV are lessthan 0·5, except in the boundary region from 0 to 0·5 km.
To investigate the amplification in the 2D analyses, the calculated waveforms for MODEL 2 are shown inFigures 8(a), 8(b), and 8(c) for the total wavefield in the FN direction, the total wave field in the UD directionand the scattered wavefield in the FN direction, respectively. The scattered wavefield is defined as the
1995 HYOGO-KEN NANBU EARTHQUAKE 383
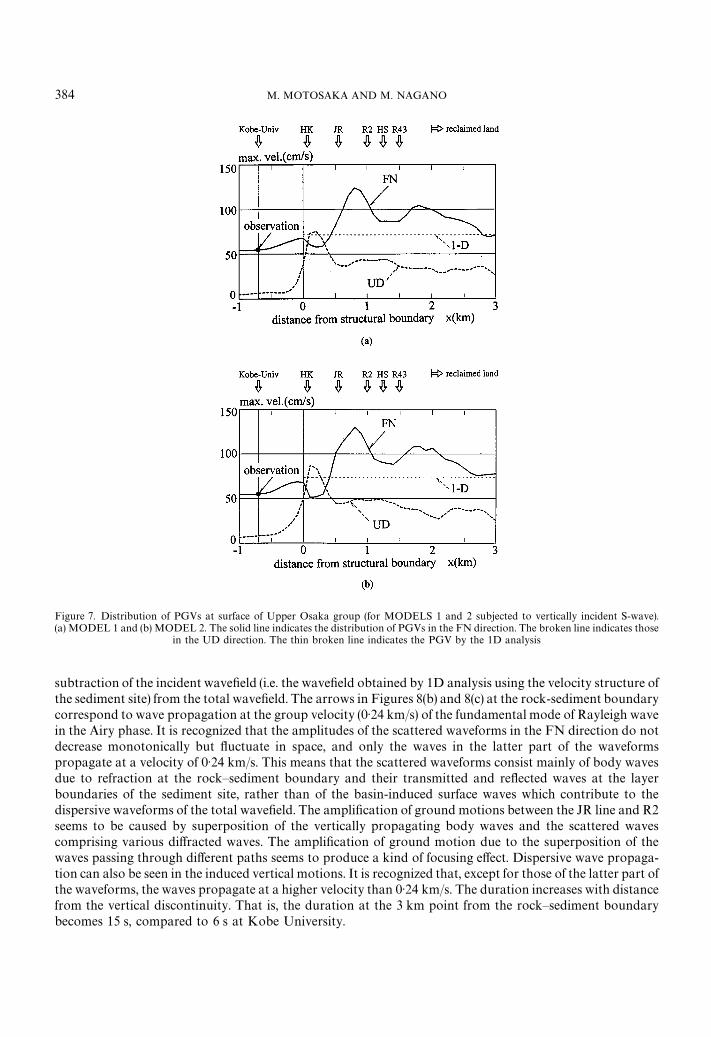
Figure 7. Distribution of PGVs at surface of Upper Osaka group (for MODELS 1 and 2 subjected to vertically incident S-wave).(a) MODEL 1 and (b) MODEL 2. The solid line indicates the distribution of PGVs in the FN direction. The broken line indicates those
in the UD direction. The thin broken line indicates the PGV by the 1D analysis
subtraction of the incident wavefield (i.e. the wavefield obtained by 1D analysis using the velocity structure ofthe sediment site) from the total wavefield. The arrows in Figures 8(b) and 8(c) at the rock-sediment boundarycorrespond to wave propagation at the group velocity (0·24 km/s) of the fundamental mode of Rayleigh wavein the Airy phase. It is recognized that the amplitudes of the scattered waveforms in the FN direction do notdecrease monotonically but fluctuate in space, and only the waves in the latter part of the waveformspropagate at a velocity of 0·24 km/s. This means that the scattered waveforms consist mainly of body wavesdue to refraction at the rock—sediment boundary and their transmitted and reflected waves at the layerboundaries of the sediment site, rather than of the basin-induced surface waves which contribute to thedispersive waveforms of the total wavefield. The amplification of ground motions between the JR line and R2seems to be caused by superposition of the vertically propagating body waves and the scattered wavescomprising various diffracted waves. The amplification of ground motion due to the superposition of thewaves passing through different paths seems to produce a kind of focusing effect. Dispersive wave propaga-tion can also be seen in the induced vertical motions. It is recognized that, except for those of the latter part ofthe waveforms, the waves propagate at a higher velocity than 0·24 km/s. The duration increases with distancefrom the vertical discontinuity. That is, the duration at the 3 km point from the rock—sediment boundarybecomes 15 s, compared to 6 s at Kobe University.
384 M. MOTOSAKA AND M. NAGANO
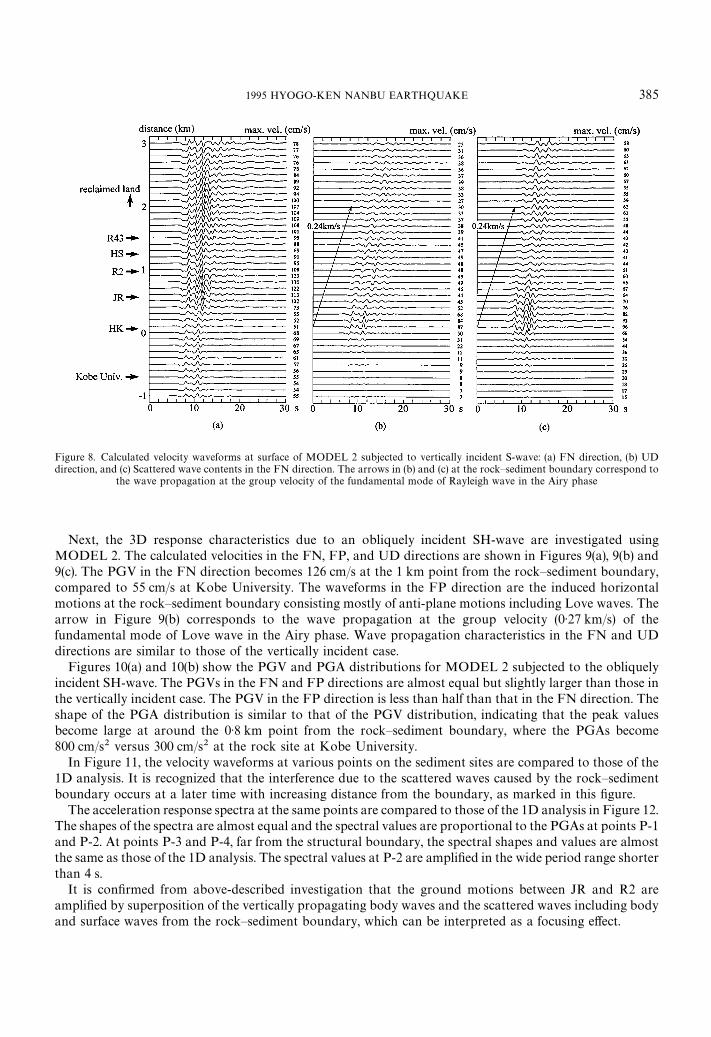
Figure 8. Calculated velocity waveforms at surface of MODEL 2 subjected to vertically incident S-wave: (a) FN direction, (b) UDdirection, and (c) Scattered wave contents in the FN direction. The arrows in (b) and (c) at the rock—sediment boundary correspond to
the wave propagation at the group velocity of the fundamental mode of Rayleigh wave in the Airy phase
Next, the 3D response characteristics due to an obliquely incident SH-wave are investigated usingMODEL 2. The calculated velocities in the FN, FP, and UD directions are shown in Figures 9(a), 9(b) and9(c). The PGV in the FN direction becomes 126 cm/s at the 1 km point from the rock—sediment boundary,compared to 55 cm/s at Kobe University. The waveforms in the FP direction are the induced horizontalmotions at the rock—sediment boundary consisting mostly of anti-plane motions including Love waves. Thearrow in Figure 9(b) corresponds to the wave propagation at the group velocity (0·27 km/s) of thefundamental mode of Love wave in the Airy phase. Wave propagation characteristics in the FN and UDdirections are similar to those of the vertically incident case.
Figures 10(a) and 10(b) show the PGV and PGA distributions for MODEL 2 subjected to the obliquelyincident SH-wave. The PGVs in the FN and FP directions are almost equal but slightly larger than those inthe vertically incident case. The PGV in the FP direction is less than half than that in the FN direction. Theshape of the PGA distribution is similar to that of the PGV distribution, indicating that the peak valuesbecome large at around the 0·8 km point from the rock—sediment boundary, where the PGAs become800 cm/s2 versus 300 cm/s2 at the rock site at Kobe University.
In Figure 11, the velocity waveforms at various points on the sediment sites are compared to those of the1D analysis. It is recognized that the interference due to the scattered waves caused by the rock—sedimentboundary occurs at a later time with increasing distance from the boundary, as marked in this figure.
The acceleration response spectra at the same points are compared to those of the 1D analysis in Figure 12.The shapes of the spectra are almost equal and the spectral values are proportional to the PGAs at points P-1and P-2. At points P-3 and P-4, far from the structural boundary, the spectral shapes and values are almostthe same as those of the 1D analysis. The spectral values at P-2 are amplified in the wide period range shorterthan 4 s.
It is confirmed from above-described investigation that the ground motions between JR and R2 areamplified by superposition of the vertically propagating body waves and the scattered waves including bodyand surface waves from the rock—sediment boundary, which can be interpreted as a focusing effect.
1995 HYOGO-KEN NANBU EARTHQUAKE 385
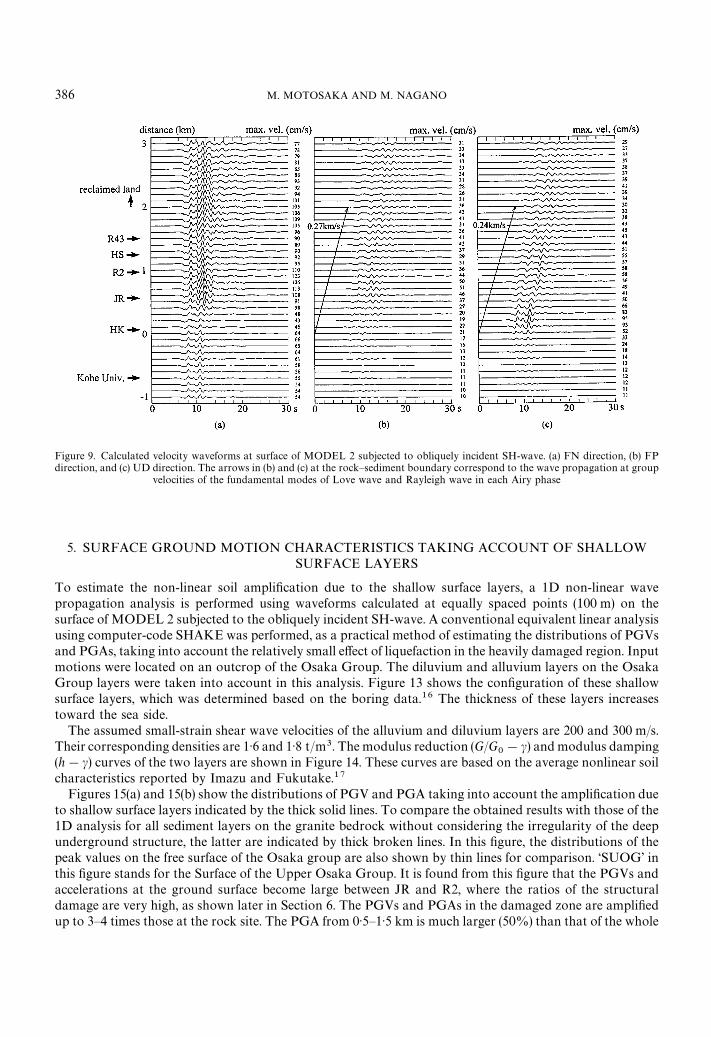
Figure 9. Calculated velocity waveforms at surface of MODEL 2 subjected to obliquely incident SH-wave. (a) FN direction, (b) FPdirection, and (c) UD direction. The arrows in (b) and (c) at the rock—sediment boundary correspond to the wave propagation at group
velocities of the fundamental modes of Love wave and Rayleigh wave in each Airy phase
5. SURFACE GROUND MOTION CHARACTERISTICS TAKING ACCOUNT OF SHALLOWSURFACE LAYERS
To estimate the non-linear soil amplification due to the shallow surface layers, a 1D non-linear wavepropagation analysis is performed using waveforms calculated at equally spaced points (100 m) on thesurface of MODEL 2 subjected to the obliquely incident SH-wave. A conventional equivalent linear analysisusing computer-code SHAKE was performed, as a practical method of estimating the distributions of PGVsand PGAs, taking into account the relatively small effect of liquefaction in the heavily damaged region. Inputmotions were located on an outcrop of the Osaka Group. The diluvium and alluvium layers on the OsakaGroup layers were taken into account in this analysis. Figure 13 shows the configuration of these shallowsurface layers, which was determined based on the boring data.16 The thickness of these layers increasestoward the sea side.
The assumed small-strain shear wave velocities of the alluvium and diluvium layers are 200 and 300 m/s.Their corresponding densities are 1·6 and 1·8 t/m3. The modulus reduction (G/G
0!c) and modulus damping
(h!c) curves of the two layers are shown in Figure 14. These curves are based on the average nonlinear soilcharacteristics reported by Imazu and Fukutake.17
Figures 15(a) and 15(b) show the distributions of PGV and PGA taking into account the amplification dueto shallow surface layers indicated by the thick solid lines. To compare the obtained results with those of the1D analysis for all sediment layers on the granite bedrock without considering the irregularity of the deepunderground structure, the latter are indicated by thick broken lines. In this figure, the distributions of thepeak values on the free surface of the Osaka group are also shown by thin lines for comparison. ‘SUOG’ inthis figure stands for the Surface of the Upper Osaka Group. It is found from this figure that the PGVs andaccelerations at the ground surface become large between JR and R2, where the ratios of the structuraldamage are very high, as shown later in Section 6. The PGVs and PGAs in the damaged zone are amplifiedup to 3—4 times those at the rock site. The PGA from 0·5—1·5 km is much larger (50%) than that of the whole
386 M. MOTOSAKA AND M. NAGANO
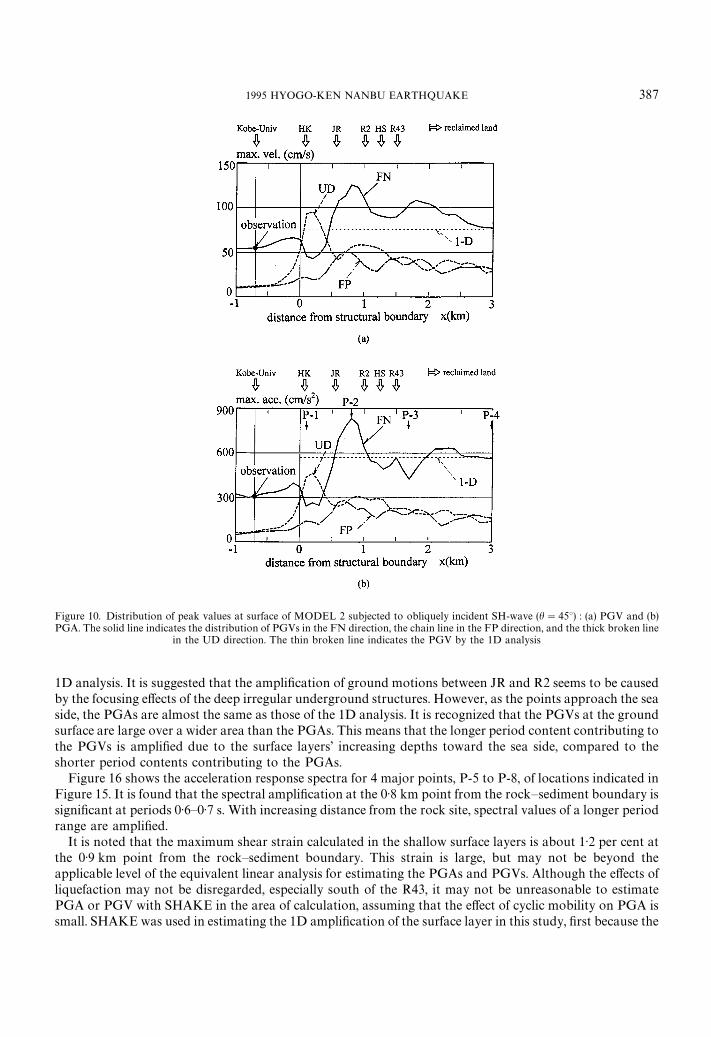
Figure 10. Distribution of peak values at surface of MODEL 2 subjected to obliquely incident SH-wave (h"45°) : (a) PGV and (b)PGA. The solid line indicates the distribution of PGVs in the FN direction, the chain line in the FP direction, and the thick broken line
in the UD direction. The thin broken line indicates the PGV by the 1D analysis
1D analysis. It is suggested that the amplification of ground motions between JR and R2 seems to be causedby the focusing effects of the deep irregular underground structures. However, as the points approach the seaside, the PGAs are almost the same as those of the 1D analysis. It is recognized that the PGVs at the groundsurface are large over a wider area than the PGAs. This means that the longer period content contributing tothe PGVs is amplified due to the surface layers’ increasing depths toward the sea side, compared to theshorter period contents contributing to the PGAs.
Figure 16 shows the acceleration response spectra for 4 major points, P-5 to P-8, of locations indicated inFigure 15. It is found that the spectral amplification at the 0·8 km point from the rock—sediment boundary issignificant at periods 0·6—0·7 s. With increasing distance from the rock site, spectral values of a longer periodrange are amplified.
It is noted that the maximum shear strain calculated in the shallow surface layers is about 1·2 per cent atthe 0·9 km point from the rock—sediment boundary. This strain is large, but may not be beyond theapplicable level of the equivalent linear analysis for estimating the PGAs and PGVs. Although the effects ofliquefaction may not be disregarded, especially south of the R43, it may not be unreasonable to estimatePGA or PGV with SHAKE in the area of calculation, assuming that the effect of cyclic mobility on PGA issmall. SHAKE was used in estimating the 1D amplification of the surface layer in this study, first because the
1995 HYOGO-KEN NANBU EARTHQUAKE 387
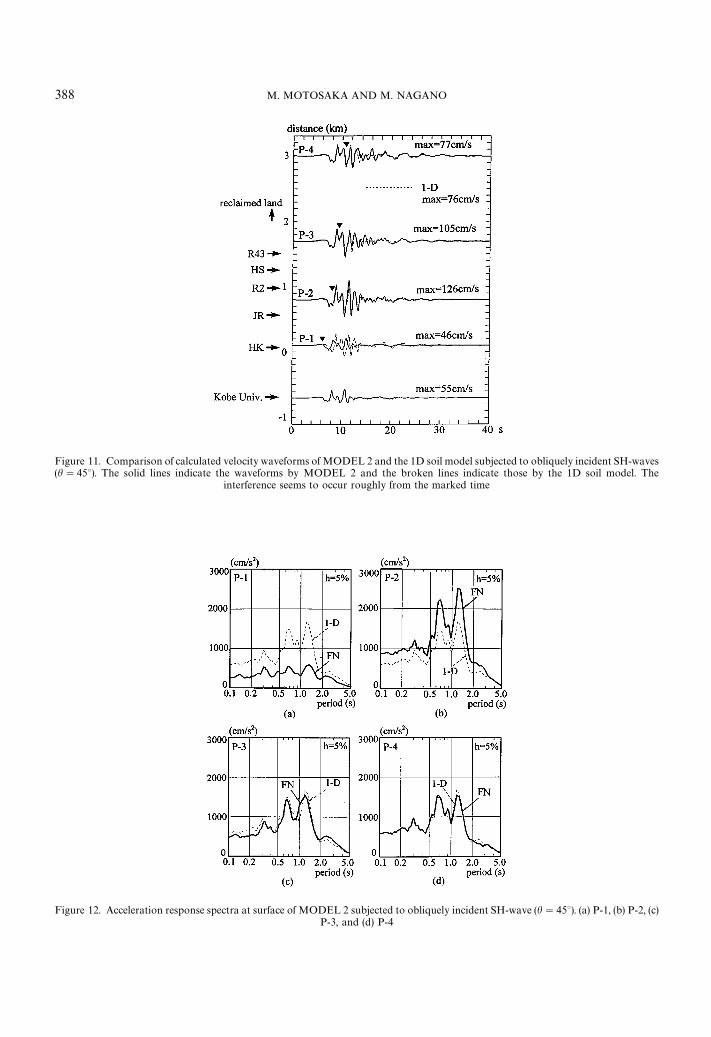
Figure 11. Comparison of calculated velocity waveforms of MODEL 2 and the 1D soil model subjected to obliquely incident SH-waves(h"45°). The solid lines indicate the waveforms by MODEL 2 and the broken lines indicate those by the 1D soil model. The
interference seems to occur roughly from the marked time
Figure 12. Acceleration response spectra at surface of MODEL 2 subjected to obliquely incident SH-wave (h"45°). (a) P-1, (b) P-2, (c)P-3, and (d) P-4
388 M. MOTOSAKA AND M. NAGANO
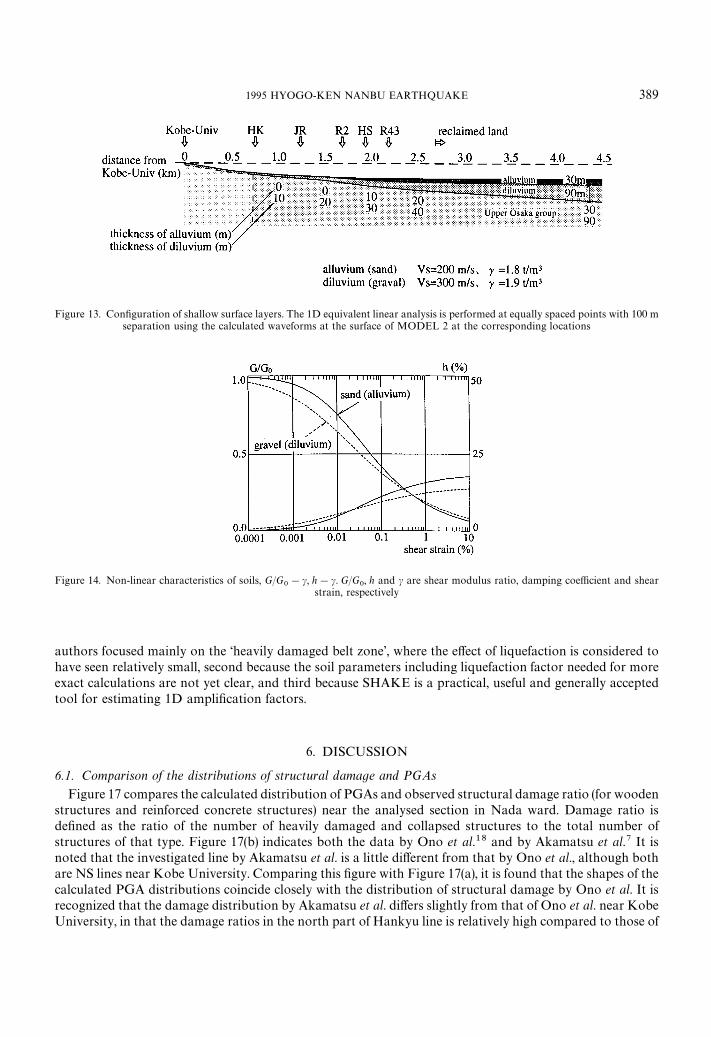
Figure 13. Configuration of shallow surface layers. The 1D equivalent linear analysis is performed at equally spaced points with 100 mseparation using the calculated waveforms at the surface of MODEL 2 at the corresponding locations
Figure 14. Non-linear characteristics of soils, G/G0!c, h!c. G/G
0, h and c are shear modulus ratio, damping coefficient and shear
strain, respectively
authors focused mainly on the ‘heavily damaged belt zone’, where the effect of liquefaction is considered tohave seen relatively small, second because the soil parameters including liquefaction factor needed for moreexact calculations are not yet clear, and third because SHAKE is a practical, useful and generally acceptedtool for estimating 1D amplification factors.
6. DISCUSSION
6.1. Comparison of the distributions of structural damage and PGAs
Figure 17 compares the calculated distribution of PGAs and observed structural damage ratio (for woodenstructures and reinforced concrete structures) near the analysed section in Nada ward. Damage ratio isdefined as the ratio of the number of heavily damaged and collapsed structures to the total number ofstructures of that type. Figure 17(b) indicates both the data by Ono et al.18 and by Akamatsu et al.7 It isnoted that the investigated line by Akamatsu et al. is a little different from that by Ono et al., although bothare NS lines near Kobe University. Comparing this figure with Figure 17(a), it is found that the shapes of thecalculated PGA distributions coincide closely with the distribution of structural damage by Ono et al. It isrecognized that the damage distribution by Akamatsu et al. differs slightly from that of Ono et al. near KobeUniversity, in that the damage ratios in the north part of Hankyu line is relatively high compared to those of
1995 HYOGO-KEN NANBU EARTHQUAKE 389
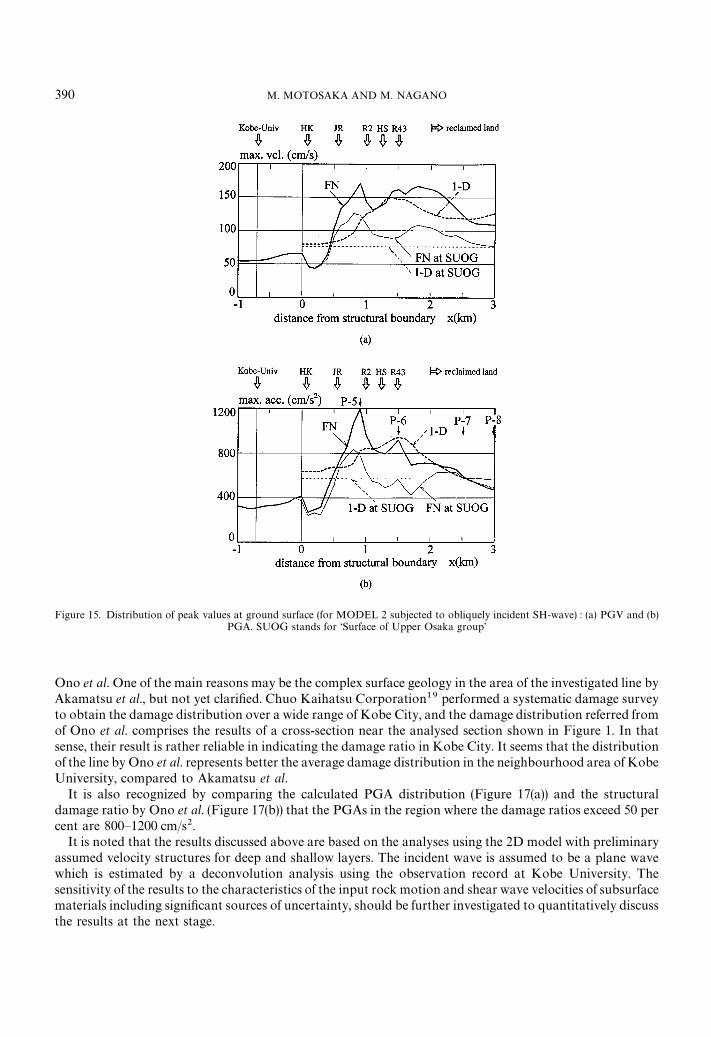
Figure 15. Distribution of peak values at ground surface (for MODEL 2 subjected to obliquely incident SH-wave) : (a) PGV and (b)PGA. SUOG stands for ‘Surface of Upper Osaka group’
Ono et al. One of the main reasons may be the complex surface geology in the area of the investigated line byAkamatsu et al., but not yet clarified. Chuo Kaihatsu Corporation19 performed a systematic damage surveyto obtain the damage distribution over a wide range of Kobe City, and the damage distribution referred fromof Ono et al. comprises the results of a cross-section near the analysed section shown in Figure 1. In thatsense, their result is rather reliable in indicating the damage ratio in Kobe City. It seems that the distributionof the line by Ono et al. represents better the average damage distribution in the neighbourhood area of KobeUniversity, compared to Akamatsu et al.
It is also recognized by comparing the calculated PGA distribution (Figure 17(a)) and the structuraldamage ratio by Ono et al. (Figure 17(b)) that the PGAs in the region where the damage ratios exceed 50 percent are 800—1200 cm/s2.
It is noted that the results discussed above are based on the analyses using the 2D model with preliminaryassumed velocity structures for deep and shallow layers. The incident wave is assumed to be a plane wavewhich is estimated by a deconvolution analysis using the observation record at Kobe University. Thesensitivity of the results to the characteristics of the input rock motion and shear wave velocities of subsurfacematerials including significant sources of uncertainty, should be further investigated to quantitatively discussthe results at the next stage.
390 M. MOTOSAKA AND M. NAGANO
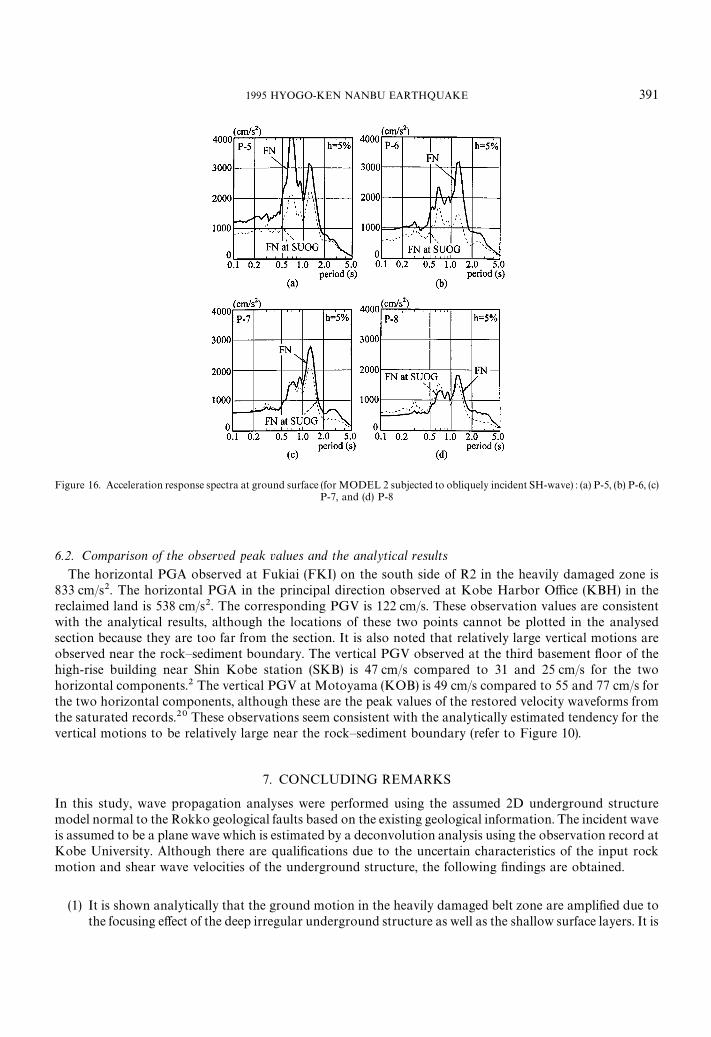
Figure 16. Acceleration response spectra at ground surface (for MODEL 2 subjected to obliquely incident SH-wave) : (a) P-5, (b) P-6, (c)P-7, and (d) P-8
6.2. Comparison of the observed peak values and the analytical results
The horizontal PGA observed at Fukiai (FKI) on the south side of R2 in the heavily damaged zone is833 cm/s2. The horizontal PGA in the principal direction observed at Kobe Harbor Office (KBH) in thereclaimed land is 538 cm/s2. The corresponding PGV is 122 cm/s. These observation values are consistentwith the analytical results, although the locations of these two points cannot be plotted in the analysedsection because they are too far from the section. It is also noted that relatively large vertical motions areobserved near the rock—sediment boundary. The vertical PGV observed at the third basement floor of thehigh-rise building near Shin Kobe station (SKB) is 47 cm/s compared to 31 and 25 cm/s for the twohorizontal components.2 The vertical PGV at Motoyama (KOB) is 49 cm/s compared to 55 and 77 cm/s forthe two horizontal components, although these are the peak values of the restored velocity waveforms fromthe saturated records.20 These observations seem consistent with the analytically estimated tendency for thevertical motions to be relatively large near the rock—sediment boundary (refer to Figure 10).
7. CONCLUDING REMARKS
In this study, wave propagation analyses were performed using the assumed 2D underground structuremodel normal to the Rokko geological faults based on the existing geological information. The incident waveis assumed to be a plane wave which is estimated by a deconvolution analysis using the observation record atKobe University. Although there are qualifications due to the uncertain characteristics of the input rockmotion and shear wave velocities of the underground structure, the following findings are obtained.
(1) It is shown analytically that the ground motion in the heavily damaged belt zone are amplified due tothe focusing effect of the deep irregular underground structure as well as the shallow surface layers. It is
1995 HYOGO-KEN NANBU EARTHQUAKE 391
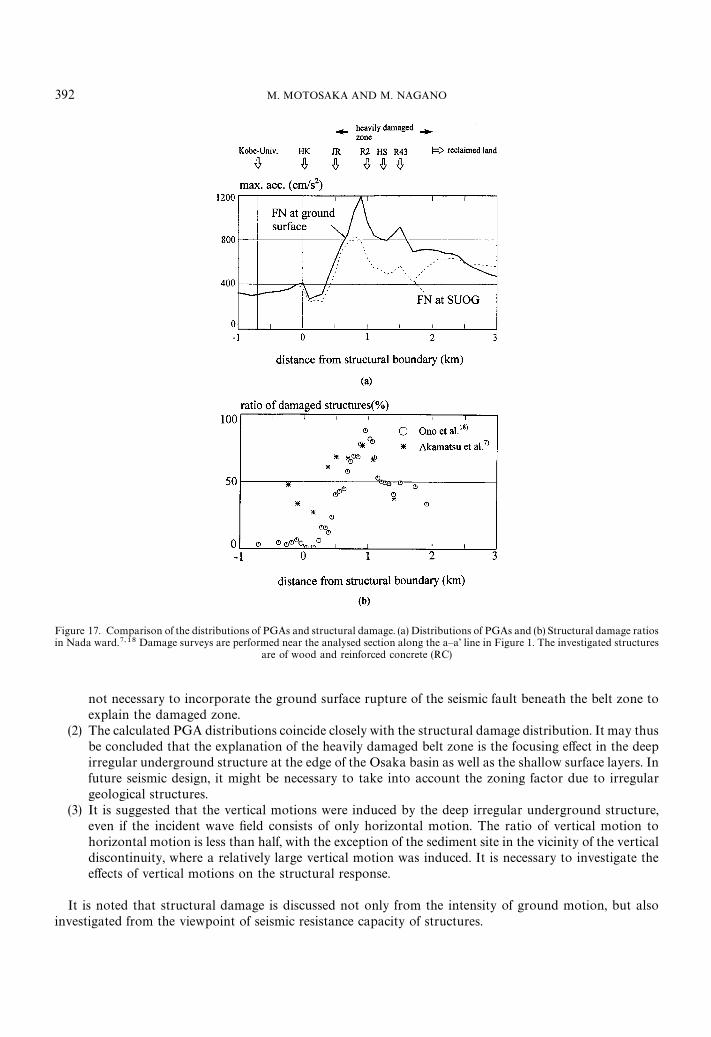
Figure 17. Comparison of the distributions of PGAs and structural damage. (a) Distributions of PGAs and (b) Structural damage ratiosin Nada ward.7,18 Damage surveys are performed near the analysed section along the a—a’ line in Figure 1. The investigated structures
are of wood and reinforced concrete (RC)
not necessary to incorporate the ground surface rupture of the seismic fault beneath the belt zone toexplain the damaged zone.
(2) The calculated PGA distributions coincide closely with the structural damage distribution. It may thusbe concluded that the explanation of the heavily damaged belt zone is the focusing effect in the deepirregular underground structure at the edge of the Osaka basin as well as the shallow surface layers. Infuture seismic design, it might be necessary to take into account the zoning factor due to irregulargeological structures.
(3) It is suggested that the vertical motions were induced by the deep irregular underground structure,even if the incident wave field consists of only horizontal motion. The ratio of vertical motion tohorizontal motion is less than half, with the exception of the sediment site in the vicinity of the verticaldiscontinuity, where a relatively large vertical motion was induced. It is necessary to investigate theeffects of vertical motions on the structural response.
It is noted that structural damage is discussed not only from the intensity of ground motion, but alsoinvestigated from the viewpoint of seismic resistance capacity of structures.
392 M. MOTOSAKA AND M. NAGANO
The sensitivity of the results to the characteristics of the input rock motion and shear wave velocities of thesubsurface materials including significant sources of uncertainty, should be further investigated to discussquantitatively the results at next stage. The amplification characteristics of the ground motions in theanalysed irregular structure should also be investigated for the complete incident wavefield, by consideringa finite moving source with inhomogeneous slip distribution.
ACKNOWLEDGEMENTS
We are grateful to the Committee of Earthquake Observation and Research in Kansai Area (CEORKA),who provided valuable earthquake observation data and also valuable information on the velocity structureat the Kobe University site and the results along the Ishiyagawa measuring line obtained from the reflectionsurvey referred to in this study. We also thank Dr. Takuji Kobori, Professor Emeritus of Kyoto Universityand Chief Advisor of Kajima Corporation, who provided valuable advice in this study.
REFERENCES
1. M. Takemura and Y. Tsuji, ‘Strong motion distribution in Kobe area due to the 1995 Southern Hyogo Earthquake (M"7·2) inJapan as inferred from the topple rate of tombstones’, J. phys. earth 43, 747—753 (1995).
2. Building Research Institute (BRI), ‘Interim Report of damage survey during the 1995 Hyogo-ken Nanbu earthquake’, 123—125 (1995)(in Japanese).
3. K. Toki, K. Irikura and T. Kagawa, ‘Strong motion records in the source area of the Hyogoken-Nambu Earthquake, 17 January1995, Japan’, J. natural disaster sci. 16, 23—30 (1995).
4. M. Watanabe and Y. Suzuki, ‘Late Quaternary activity of active faults in Kobe area’, Programme and Abstracts, The SeismologicalSociety of Japan, 2, A85 (1995) (in Japanese).
5. T. Suzuki, M. Hakuno and S. Igarashi, ‘Numerical simulation on ground motion amplification on dipping soft soil layers’, Proc.23rd JSCE earthquake engineering symp., 73—76 (1995) (in Japanese).
6. M. Motosaka and M. Nagano, ‘Analysis on amplification characteristics of ground motions in Kobe City taking account of deepirregular underground structure— interpretation of heavily damaged belt zone during the 1995 Hyogo-ken Nanbu Earthquake’, J.struct. construction eng. (¹rans. AIJ), 488, 39—48 (1996) (in Japanese with English abstract).
7. J. Akamatsu, H. Morikawa, H. Saito and M. Jido, ‘Relation between the distribution of damage caused by the 1995 Hyogoken-Nambu earthquake and vibration characteristics inferred from microseisms’, J. natural disaster sci. 16, 63—70 (1995).
8. K. Nakagawa, ‘Relation between earthquake ground failure and subsurface structure’, Proc. symp. on the Great Hanshin-Awajiearthquake and its geo-environments, 233—238 (1995) (in Japanese).
9. Y. Iwasaki, ‘Earthquake environment in Hanshin area and strong ground motions during the Hyogo-ken Nanbu earthquake’, Soilfound. 43, 2—6 (1995) (in Japanese).
10. Y. Iwami, ¹own and Soil in Kobe, Kobe Shinbun Press Center, 1987, p. 14 (in Japanese).11. S. Kobayashi, S. Yoshida, S. Okubo, R. Shichi, T. Shimamoto and T. Kato, ‘2·5-dimensional analysis of the gravity anomaly across
the Rokko fault system’, Programme and Abstracts, The Seismological Society of Japan, 2, A61 (1995) (in Japanese).12. Y. Iwasaki, T. Hongo, H. Yokota and S. Ito, ‘Ground characteristics of the Rokko-dai (Kobe University) Ground Motion
Monitoring Site’, Programme and Abstracts, The Seismological Society of Japan, 2, P77 (1995) (in Japanese).13. T. Iwata, K. Hatayama, H. Kawase, K. Irikura and K. Matsunami, ‘Aftershock observations at Higashinada ward, Kobe City’, J.
natural disaster sci. 16, 41—48 (1995).14. M. Nagano and M. Motosaka, ‘Response analysis of 2-D structure subjected to obliquely incident waves with arbitrary horizontal
angles’, J. struct. construction eng. (¹rans. AIJ) 474, 67—76 (1995) (in Japanese with English abstract).15. E. Kausel and J. M. Roesset, ‘Semianalytical hyperelement for layered strata’, J. eng. mech. ASCE 103, 569—588 (1977).16. Japan Society of Soil Mechanics and Foundation Engineering, Kansai branch, Soil in Kansai area, 1992 (in Japanese).17. M. Imazu and K. Fukutake, ‘Dynamic shear modulus and Damping of gravel materials’, Proc. 21st Japan national conf. on soil
mechanics and foundation engineering, 509—512 (1986) (in Japanese).18. S. Ono, K. Ishikawa and S. Mizoguchi, ‘Earthquake damage survey of buildings & houses during the 1995 Hyogo-ken Nanbu
earthquake’, Proc. 50th ann. conf. of the Japan Society of Civil Engineers, 1-(B), 948—949 (1995) (in Japanese).19. Chuo Kaihatsu Corporation, Report on damage survey of the 1995 Hyogo-ken Nanbu earthquake, 1995 (in Japanese).20. T. Kagawa, K. Irikura and I. Yokoi, ‘Saturation characteristics of servo velocity seismograph—application for the records obtained
under the Hyogoken-Nanbu earthquake’, Programme and Abstracts, The Seismological Society of Japan, 2, A91 (1995) (in Japanese).
.
1995 HYOGO-KEN NANBU EARTHQUAKE 393