Embed Size (px)
Citation preview
ANALYSIS OF API 5C3 FAILURE PREDECTION FORMULAE FOR CASING & TUBING
S. Staelens1, T. Galle1, W. De Waele1, P. De Baets1
1 Ghent University, Laboratory Soete, Belgium
Abstract Due to the increasing demand for oil and gas, coupled with the fact that oil reserves are becoming rather scarce, the petroleum industry is pushed to drill and complete deeper wells. Threaded connections are often the weakest link in this process and are therefore the subject of research and optimization.
At first, this paper presents a brief overview of the design characteristics of today’s premium connections. Secondly, the failure mechanisms of Oil Country Tubular Goods (OCTG) are discussed. At last, an in-depth analysis of the API 5C3 formulae is given. Four formulas for collapse are given in API 5C3, each valid for a specific D/t range. With increasing yield strength of the steel, the difference between the yield strength collapse and the plastic collapse gets larger. Also, the elastic collapse zone gets bigger, so stronger materials with relatively large D/t ratios will collapse in the elastic zone instead of the plastic or transition zone. These four formulas can be approached by a third-order polynomial equation that is valid for all D/t ratios.
Keywords: threaded and coupled; OCTG; buttress thread; premium connection; failure mechanisms
1 INTRODUCTION
Drilling and completion of High Pressure/High Temperature (HPHT) wells are common practice. Some conditions of field examples are illustrated in Figure 1. Well depths up to 12000m are no longer unusual. Because of this increasing depth, the pressure and temperature also increases. Clearly, the applied casing and tubing have to be able to withstand extreme conditions. Failure of these OCTG can cost millions of dollars, can cause environmental disasters and hence are to be avoided.
Because of the harsh conditions associated with HPHT wells, traditional OCTG threaded connections can no longer guarantee safety and premium connections are required [1]. Such connections have a better leak resistance and an overall improved integrity.
Figure 1: Some field examples of HPHT wells in the world [2]
The design of premium connections differs from the standard API connections in various ways. At first, metal-to-metal (MTM) seals are used to guarantee the sealability. In addition, a torque shoulder can be used to withstand the high torques required in HPHT wells. At last, the standard hooked or buttress thread shape can be modified in numerous ways to withstand the higher loads and conditions of HPHT wells [3].
Reliable materials for deep well construction must have highstrength and corrosion resistance athigh temperatures.
Bruce Craig* MetCorr Denver, Colorado
T he increasing worldwide demand for oiland gas coupled with the fact that thepeak of oil production has been reachedor soon will be, has pushed the petroleum
industry into drilling ever deeper wells. Welldepths of 25,000 ft (7620 m) and greater are nolonger unusual, and even deeper wells areexpected.
Generally, increasing depth means increasingpressure and temperature. High-pressure/high-temperature (HPHT) wells have generally beenconsidered wells in which temperatures and pres-sures at the bottom of the well exceed 300 to 350°F(149 to 177°C) and 10,000 psi (69 MPa), respec-tively. Many HPHT wells have already beendrilled and completed in this category with greatsuccess and no unusual requirements for specialmaterials.
Figure 1 illustrates some of these successfulfield applications, in addition to more recent activity in East Texas and the Gulf of Mexico.The industry has had to pursue ever more hos-tile conditions than the original HPHT limitsstated above to keep up with demand. In thiscase, conditions exceeding 400°F (204°C) and20,000 psi (138 MPa) at bottomhole have beenlabeled variously as Extreme HPHT (xHPHT)and Ultra HPHT. (The term HPHT is usedthroughout this article to include both extremeand ultra.)
This is where challenges will be for both thematerials themselves and materials engineersin the petroleum industry for the future. Drillingthese HPHT wells requires specialized methodsand considerable planning, but the materials havelargely remained steel drill pipe and steel com-ponents, although other alloys such as titaniumare being considered.
However, the real materials challenges are incompleting and producing the wells after theyare drilled. This is the reason this article focuseson well construction rather than drilling. *Member of ASM International
Liners, tubing, and stringsFigure 2 shows a typical well completion for
those unfamiliar with the industry terminology.Surface casing and some of the intermediatecasing strings are not affected by HPHT condi-tions, and thus standard steel tubulars functionwell.
The major components that require greater at-tention and represent materials challenges are theliner at the bottom of the well, the tieback casingstring, the tubing (and associated jewelry), andthe Christmas tree, which is not shown but com-
ADVANCED MATERIALS & PROCESSES/MAY 2008 33
MATERIALS FOR
DEEP OIL AND GAS WELLCONSTRUCTION
Drilling rig at sunset.
POW
ERIN
G T
HE
FUTU
RE
Fig. 1 — Some of the prominent HPHT fields in the world.Updated from Ref. 1.
!! !
!
!!
!
!! !
!
!
Initial rreservoir ppressure, MMPa69 883 997 1110 1124 1138
10 112 114 116 118 220Initial rreservoir ppressure, kksi
525 (274)
475 (246)
425 (219)
375 (190)
325(163)R
eser
voir
ttem
pera
ture
, °°F
((°C
)
MaddenDeep
Mary AAnnMobile BBay
Shearwater
FranklinThomasville
East TTexas
New GGulf oofMexicoFields
ElginVilla/Trecate
Erskine
EmblaMalossa
These design features and their effects are briefly discussed in the following section. More detailed information can be found in [4, 5]. In the last section of this paper, the failure mechanisms of traditional OCTG are summarized and an analysis of the formulae in API 5C3 is conducted.
2 DESIGN FEATURES OF PREMIUM CONNECTIONS
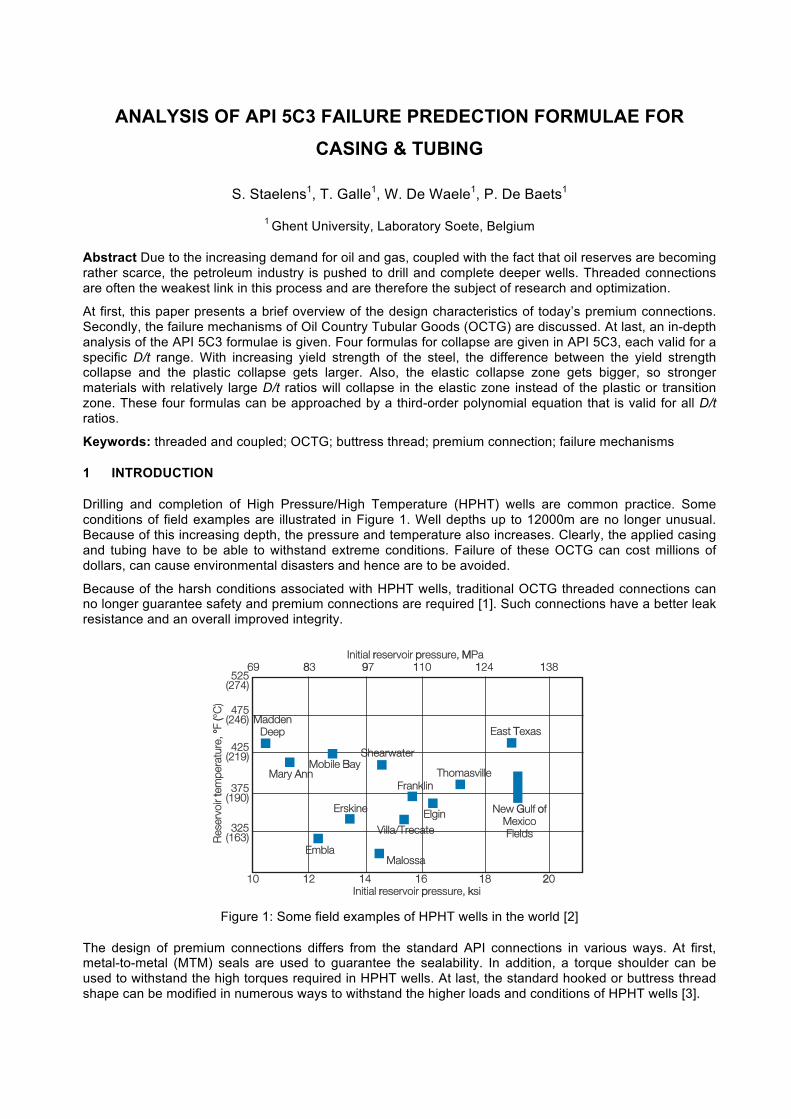
A typical premium connection is illustrated in Figure 2. It shows the three main features that can be changed for obtaining an optimal design: the thread profile, the torque shoulder and the MTM-sealing area. Though only these are discussed in the following paragraphs, it should be mentioned that the design of premium connections is not limited to the above-mentioned three aspects. Various other improvements can and are made to the premium connections of today such as applying a lubricant relief groove and/or stress relief grooves, the use of “dopeless technology”, ….
Figure 2: Typical premium connection (HES Seal-Lock Apex) [6]
2.1 Thread design The commonly used thread profile of premium connections is trapezoidal. Changes can be made to the shape of the threads, the pitch (e.g. FOX, JFE [7]) and the interference between the thread of the pin and the box (e.g. VAM21, VAM Services [8]). Each has its own effects.
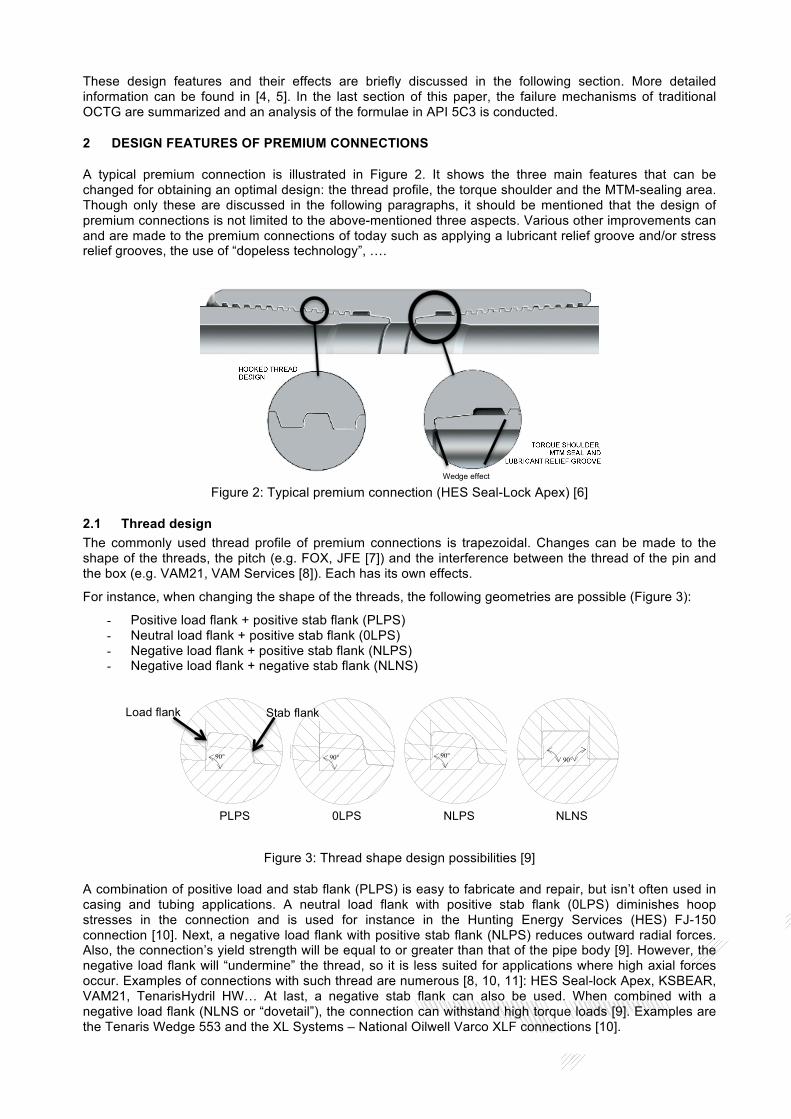
For instance, when changing the shape of the threads, the following geometries are possible (Figure 3):
- Positive load flank + positive stab flank (PLPS) - Neutral load flank + positive stab flank (0LPS) - Negative load flank + positive stab flank (NLPS) - Negative load flank + negative stab flank (NLNS)
Figure 3: Thread shape design possibilities [9]
A combination of positive load and stab flank (PLPS) is easy to fabricate and repair, but isn’t often used in casing and tubing applications. A neutral load flank with positive stab flank (0LPS) diminishes hoop stresses in the connection and is used for instance in the Hunting Energy Services (HES) FJ-150 connection [10]. Next, a negative load flank with positive stab flank (NLPS) reduces outward radial forces. Also, the connection’s yield strength will be equal to or greater than that of the pipe body [9]. However, the negative load flank will “undermine” the thread, so it is less suited for applications where high axial forces occur. Examples of connections with such thread are numerous [8, 10, 11]: HES Seal-lock Apex, KSBEAR, VAM21, TenarisHydril HW… At last, a negative stab flank can also be used. When combined with a negative load flank (NLNS or “dovetail”), the connection can withstand high torque loads [9]. Examples are the Tenaris Wedge 553 and the XL Systems – National Oilwell Varco XLF connections [10].
Wedge effect
SPE 97585 7
Flank to Flank Crest to Root Figure 1. Thread iInterferences
Positive Load Flank Zero Load Flank
Negative Load Flank Negative Load and Stab Flanks Figure 2. Thread forms
Parallel to pipe axis Parallel to thread cone Figure 3. Crest – root designs
Figure 4. 10!” x 101 lb/ft VM110SS VAM HP SC80 Threaded and coupled connection with secondary external metal seals.
Figure 5. Resilient seal in threaded and coupled connection.
Figure 6. ISO testing with metal and resilient seals.
Typical SemiFlush (SF) ConnectionInternal Metal Seal
Expanded Box External Metal Seal
Figure 7. Typical expanded box semi-flush connection.
Metal Seal
Figure 8. VAM PRO - Pin nose to pin nose with radial metal seal connection.
Optional Resilient Seal
Radial Metal Seal
Figure 9. VAM PRO RS - Pin nose to pin nose radial metal seal connection with optional resilient seal.
Figure 10. 7.97” OD x 1.123”wt VAM PRO RS connection with pin nose to pin nose shoulder.
EPA Series B Series A Series
(psi) (psi) (psi) (deg-F) (psi)MTM 27500 - 25000 425 15000RS 25000 - 25000 425 15000
MTM 27500 - 25000 425 15000RS 25000 - 25000 425 15000
IPC Series
7.97" 1.123"-wall P110 VAM PRO RS
Seal TestedSample
1
2
Secondary Metal Seal
90° 90°
90° 90°
PLPS 0LPS NLPS NLNS
Load flank Stab flank
2.2 Shoulder design When applying a torque shoulder (Figure 2), a higher torque load can be applied and the total applied torque load can be controlled better. Therefore, the risk of galling and over-torque reduces. In addition, make-up gets easier and the sealability of the connection can be better guaranteed [4, 12].
A connection with a “reversed torque shoulder angle”, as seen in Figure 2, causes a “wedge effect”. This improves the self-alignment, radial stability and structural strength of the connection [4].
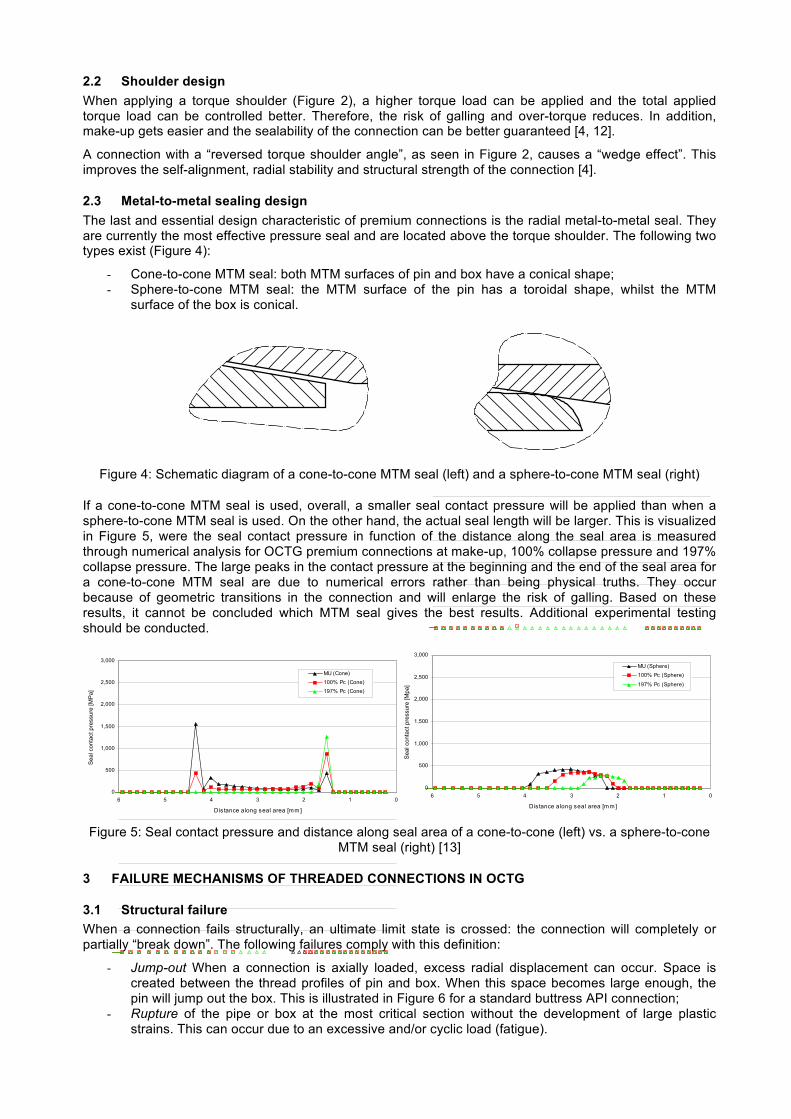
2.3 Metal-to-metal sealing design The last and essential design characteristic of premium connections is the radial metal-to-metal seal. They are currently the most effective pressure seal and are located above the torque shoulder. The following two types exist (Figure 4):
- Cone-to-cone MTM seal: both MTM surfaces of pin and box have a conical shape; - Sphere-to-cone MTM seal: the MTM surface of the pin has a toroidal shape, whilst the MTM
surface of the box is conical.
Figure 4: Schematic diagram of a cone-to-cone MTM seal (left) and a sphere-to-cone MTM seal (right)
If a cone-to-cone MTM seal is used, overall, a smaller seal contact pressure will be applied than when a sphere-to-cone MTM seal is used. On the other hand, the actual seal length will be larger. This is visualized in Figure 5, were the seal contact pressure in function of the distance along the seal area is measured through numerical analysis for OCTG premium connections at make-up, 100% collapse pressure and 197% collapse pressure. The large peaks in the contact pressure at the beginning and the end of the seal area for a cone-to-cone MTM seal are due to numerical errors rather than being physical truths. They occur because of geometric transitions in the connection and will enlarge the risk of galling. Based on these results, it cannot be concluded which MTM seal gives the best results. Additional experimental testing should be conducted.
Figure 5: Seal contact pressure and distance along seal area of a cone-to-cone (left) vs. a sphere-to-cone
MTM seal (right) [13]
3 FAILURE MECHANISMS OF THREADED CONNECTIONS IN OCTG
3.1 Structural failure When a connection fails structurally, an ultimate limit state is crossed: the connection will completely or partially “break down”. The following failures comply with this definition:
- Jump-out When a connection is axially loaded, excess radial displacement can occur. Space is created between the thread profiles of pin and box. When this space becomes large enough, the pin will jump out the box. This is illustrated in Figure 6 for a standard buttress API connection;
- Rupture of the pipe or box at the most critical section without the development of large plastic strains. This can occur due to an excessive and/or cyclic load (fatigue).
Structural AnalysisOCTG Premium Connections
!"www.simytec.com
Sphere-cone seal
Cone-cone seal
#
$##
!%###
!%$##
&%###
&%$##
'%###
#!&'($)
*+,-./012.34/52,1.32.61.27889
:1.3204/-.0-2;61,,<6127=>.9
=?2@A4/1B!##C2>02@A4/1B!DEC2>02@A4/1B
#
$##
!%###
!%$##
&%###
&%$##
'%###
#!&'($)
*+,-./012.34/52,1.32.61.27889
:1.3204/-.0-2;61,,<6127=;.9
=?2@:;F161B!##C2>02@:;F161B
!DEC2>02@:;F161B
G/2-F1284H13+/524I2+/H<,-6+.32;6401,,1,
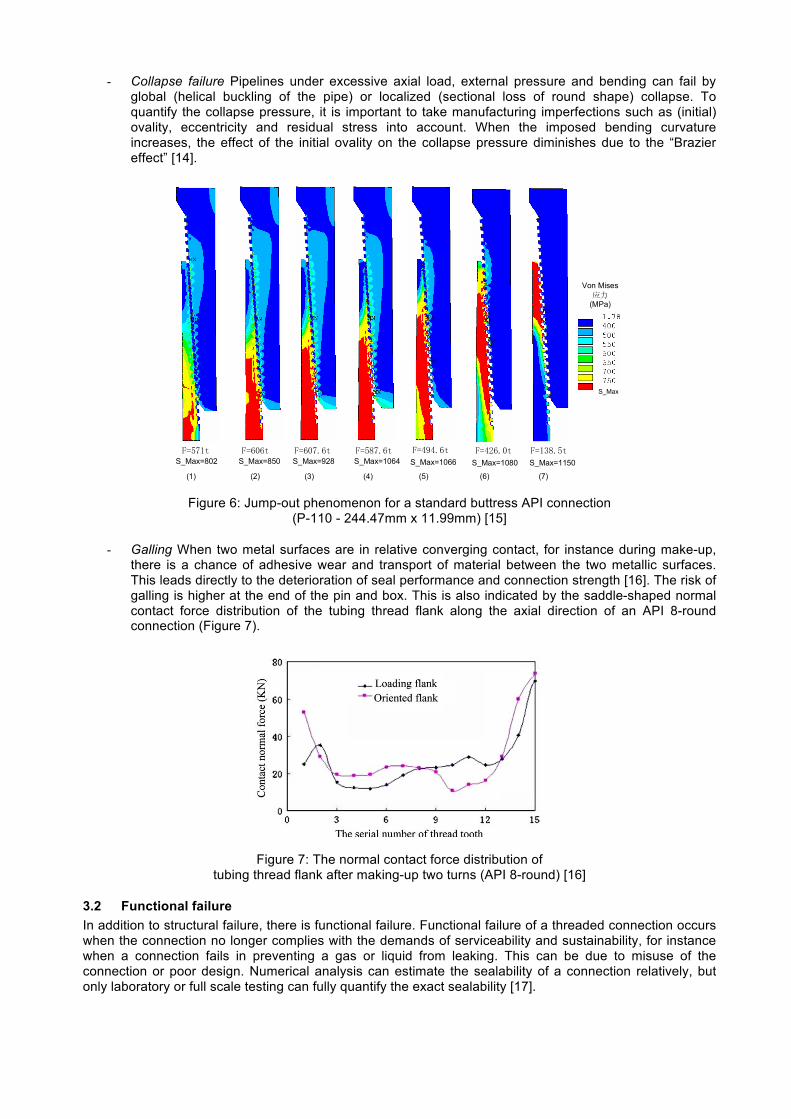
- Collapse failure Pipelines under excessive axial load, external pressure and bending can fail by global (helical buckling of the pipe) or localized (sectional loss of round shape) collapse. To quantify the collapse pressure, it is important to take manufacturing imperfections such as (initial) ovality, eccentricity and residual stress into account. When the imposed bending curvature increases, the effect of the initial ovality on the collapse pressure diminishes due to the “Brazier effect” [14].
Figure 6: Jump-out phenomenon for a standard buttress API connection
(P-110 - 244.47mm x 11.99mm) [15]
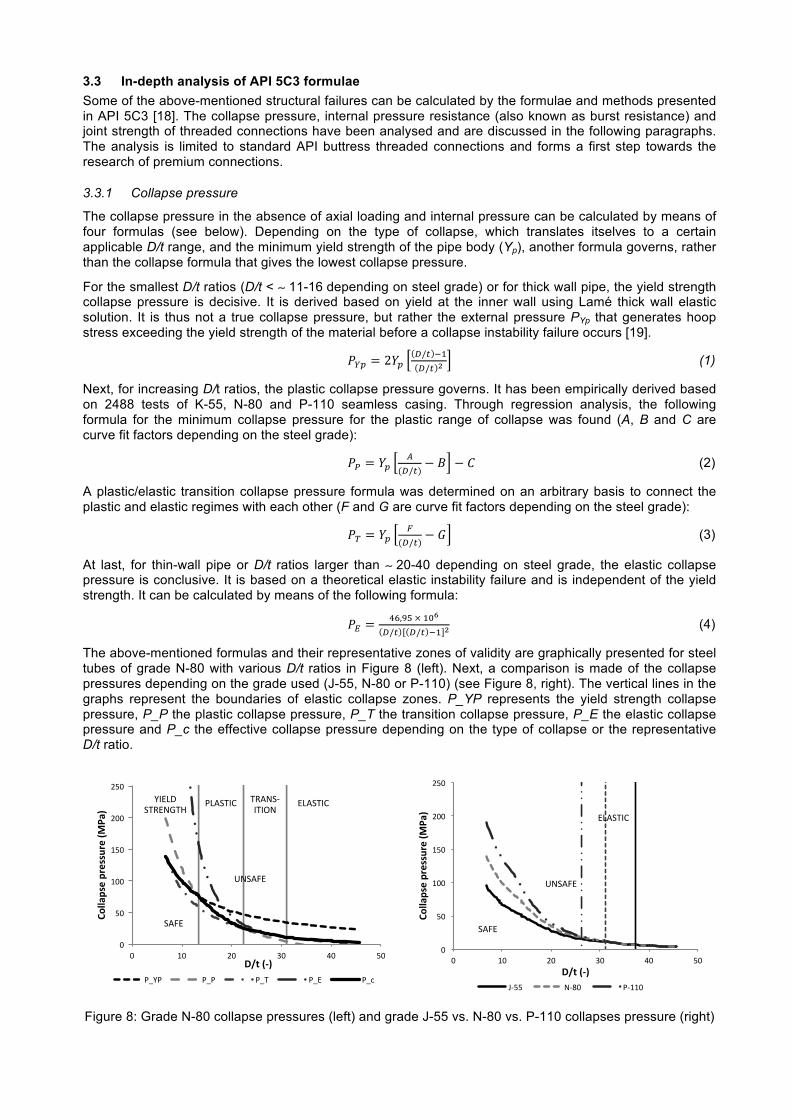
- Galling When two metal surfaces are in relative converging contact, for instance during make-up, there is a chance of adhesive wear and transport of material between the two metallic surfaces. This leads directly to the deterioration of seal performance and connection strength [16]. The risk of galling is higher at the end of the pin and box. This is also indicated by the saddle-shaped normal contact force distribution of the tubing thread flank along the axial direction of an API 8-round connection (Figure 7).
Figure 7: The normal contact force distribution of
tubing thread flank after making-up two turns (API 8-round) [16]
3.2 Functional failure In addition to structural failure, there is functional failure. Functional failure of a threaded connection occurs when the connection no longer complies with the demands of serviceability and sustainability, for instance when a connection fails in preventing a gas or liquid from leaking. This can be due to misuse of the connection or poor design. Numerical analysis can estimate the sealability of a connection relatively, but only laboratory or full scale testing can fully quantify the exact sealability [17].
!"#$%&'() !"#$%&'*( !"#$%&+)' !"#$%&,(-. !"#$%&,(-- !"#$%&,('( !"#$%&,,*(
!"#$%
/012#3454
6#7$8
6,8 6)8 698 6.8 6*8 6-8 6:8 !
!"#$%&'()'!*+,-'+,#*&'./0'12,'3"4&4'45%&440'6&789*+45":';2,&)'<$=982$5'!>'4"=$*+5"2,'2?'5@&'A$55%&44':2,,&:5"2,'!
!"#$%
/012#3454
6#7$8
6,8 6)8 698 6.8 !
!"#$%&'B)'!*+,-'+,#*&'C/0'12,'3"4&4'45%&440'6&789*+45":';2,&)'<$=982$5'!>'4"=$*+5"2,'2?'5@&'A$55%&44':2,,&:5"2,'!
6,8 6)8 698 6.8 6*8
!"#$%
/012#3454
6#7$8
!
!"#$%&'D)'!*+,-'+,#*&'E//0'12,'3"4&4'45%&440'6&789*+45":';2,&)'<$=982$5'!>'4"=$*+5"2,'2?'5@&'A$55%&44':2,,&:5"2,'
the pipe is evidently higher than that of the coupling. The strain at the first engaged thread of the two ends ofthe pin is very large even to 6000 le. At make-up about two turns there is a generalized plastification of the pinnose.
3.2. Distribution of normal contact force
The normal contact force distribution of the tubing thread flank along the axial direction is shown in Fig. 4.The shape of the normal contact force distribution is like a saddle. This is in accordance with the phenomenonthat thread galling failure easily appears at the two ends of tubing threaded connections in oil and gas fields. Itwas further found that make-up or break out on a tubing connection will a!ect the taper of the pin and reducethe pitch diameter. Ovality of tubing or coupling does not a!ect the contact stress distribution pattern in thecircumferential direction; however, it a!ects the actual value of the contact stresses.
The tensile load has a definite impact on the normal contact force distribution. The normal contact force ofthe lead flank of the thread diminishes under the action of tensile load, and is shown in Fig. 5. Furthermore, ithas a strong influence on the equivalent stress distribution, and the maximal equivalent stress appears at thefirst engaged thread of the end of the male thread. The average contact pressure at the stab flank decreaseswith increasing tension. The leak resistance according to the API (1987) formula does not depend on appliedtension. However, the test results and FEA calculations indicate that tension will reduce the sealability of anAPI 10-R tubing connection.
The taper of the pipe thread is also an important factor a!ecting the distribution of normal contact force ofthe oil casing and tubing. The distribution of normal contact force is shown in Fig. 6 under the API ultimateconjugate of 0.067708 taper pin and 0.0599 taper box. The work situation is named as small head and big hatin oil and gas fields. Fig. 7 shows the distribution of normal contact force under the other API ultimate con-jugate of 0.0599 taper pin and 0.067708 taper box. This is named as big head and small hat in oil and gas fields.
Fig. 4. The normal contact force distribution of tubing thread flank after making-up two turns.
Fig. 5. The normal contact force distribution of tubing thread flank after making-up two turns and applying 120 kN tensile load.
1278 Y. Guangjie et al. / Engineering Failure Analysis 13 (2006) 1275–1284
3.3 In-depth analysis of API 5C3 formulae Some of the above-mentioned structural failures can be calculated by the formulae and methods presented in API 5C3 [18]. The collapse pressure, internal pressure resistance (also known as burst resistance) and joint strength of threaded connections have been analysed and are discussed in the following paragraphs. The analysis is limited to standard API buttress threaded connections and forms a first step towards the research of premium connections.
3.3.1 Collapse pressure
The collapse pressure in the absence of axial loading and internal pressure can be calculated by means of four formulas (see below). Depending on the type of collapse, which translates itselves to a certain applicable D/t range, and the minimum yield strength of the pipe body (Yp), another formula governs, rather than the collapse formula that gives the lowest collapse pressure.
For the smallest D/t ratios (D/t < ∼ 11-16 depending on steel grade) or for thick wall pipe, the yield strength collapse pressure is decisive. It is derived based on yield at the inner wall using Lamé thick wall elastic solution. It is thus not a true collapse pressure, but rather the external pressure PYp that generates hoop stress exceeding the yield strength of the material before a collapse instability failure occurs [19].
!!" = 2!!!/! !!!/! ! (1)
Next, for increasing D/t ratios, the plastic collapse pressure governs. It has been empirically derived based on 2488 tests of K-55, N-80 and P-110 seamless casing. Through regression analysis, the following formula for the minimum collapse pressure for the plastic range of collapse was found (A, B and C are curve fit factors depending on the steel grade):
!! = !!!
(!/!)− ! − ! (2)
A plastic/elastic transition collapse pressure formula was determined on an arbitrary basis to connect the plastic and elastic regimes with each other (F and G are curve fit factors depending on the steel grade):
!! = !!!
(!/!)− ! (3)
At last, for thin-wall pipe or D/t ratios larger than ∼ 20-40 depending on steel grade, the elastic collapse pressure is conclusive. It is based on a theoretical elastic instability failure and is independent of the yield strength. It can be calculated by means of the following formula:
!! =!",!" × !"!
!/! !/! !! ! (4)
The above-mentioned formulas and their representative zones of validity are graphically presented for steel tubes of grade N-80 with various D/t ratios in Figure 8 (left). Next, a comparison is made of the collapse pressures depending on the grade used (J-55, N-80 or P-110) (see Figure 8, right). The vertical lines in the graphs represent the boundaries of elastic collapse zones. P_YP represents the yield strength collapse pressure, P_P the plastic collapse pressure, P_T the transition collapse pressure, P_E the elastic collapse pressure and P_c the effective collapse pressure depending on the type of collapse or the representative D/t ratio.
Figure 8: Grade N-80 collapse pressures (left) and grade J-55 vs. N-80 vs. P-110 collapses pressure (right)
!"
#!"
$!!"
$#!"
%!!"
%#!"
!" $!" %!" &!" '!" #!"
!"##$%&'(%)'&&*)'(+,
-$.(
/01(+2.(()*(" ()(" ()+" ()," ()-"
*.,/0"1+2,34+5"
(/61+.7" +26318.+.93""
,/61+.7"
16:,"
;316:,"
!"
#!"
$!!"
$#!"
%!!"
%#!"
!" $!" %!" &!" '!" #!"
!"##$%&'(%)'&&*)'(+,
-$.(
/01(+2.(()##" *)+!" ,)$$!"
-./0"
1*-./0"
02.-345"
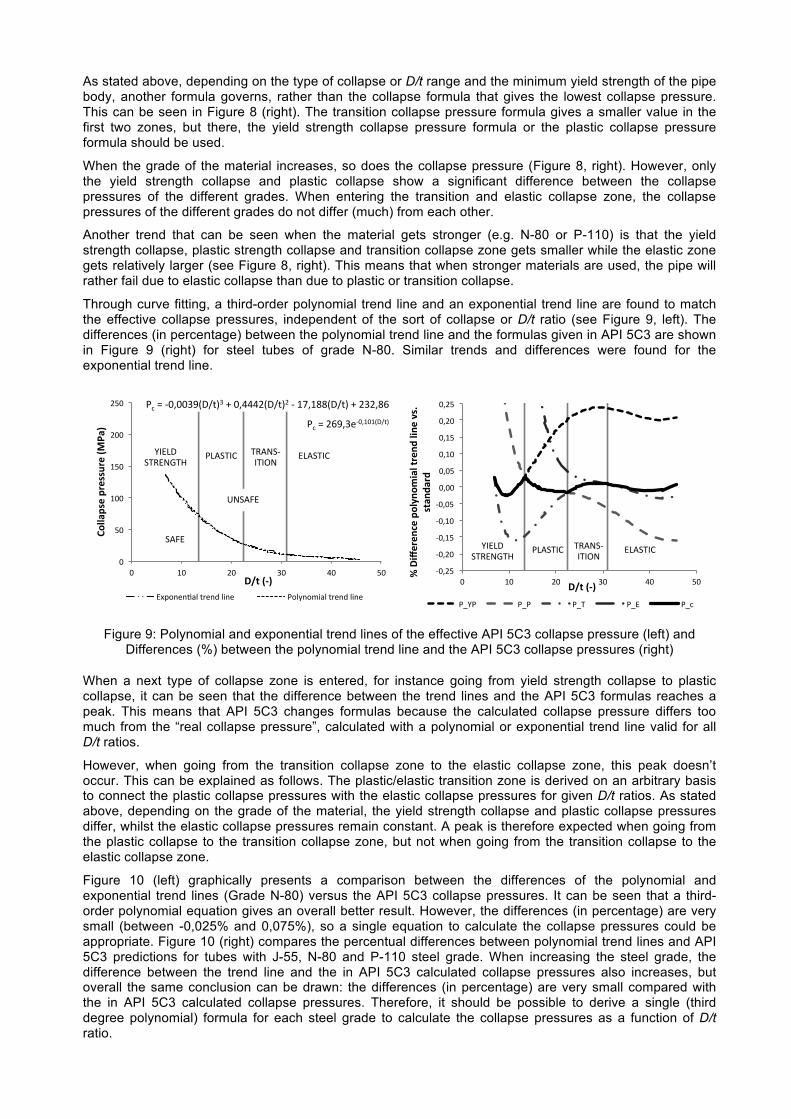
As stated above, depending on the type of collapse or D/t range and the minimum yield strength of the pipe body, another formula governs, rather than the collapse formula that gives the lowest collapse pressure. This can be seen in Figure 8 (right). The transition collapse pressure formula gives a smaller value in the first two zones, but there, the yield strength collapse pressure formula or the plastic collapse pressure formula should be used.
When the grade of the material increases, so does the collapse pressure (Figure 8, right). However, only the yield strength collapse and plastic collapse show a significant difference between the collapse pressures of the different grades. When entering the transition and elastic collapse zone, the collapse pressures of the different grades do not differ (much) from each other.
Another trend that can be seen when the material gets stronger (e.g. N-80 or P-110) is that the yield strength collapse, plastic strength collapse and transition collapse zone gets smaller while the elastic zone gets relatively larger (see Figure 8, right). This means that when stronger materials are used, the pipe will rather fail due to elastic collapse than due to plastic or transition collapse.
Through curve fitting, a third-order polynomial trend line and an exponential trend line are found to match the effective collapse pressures, independent of the sort of collapse or D/t ratio (see Figure 9, left). The differences (in percentage) between the polynomial trend line and the formulas given in API 5C3 are shown in Figure 9 (right) for steel tubes of grade N-80. Similar trends and differences were found for the exponential trend line.
Figure 9: Polynomial and exponential trend lines of the effective API 5C3 collapse pressure (left) and
Differences (%) between the polynomial trend line and the API 5C3 collapse pressures (right)
When a next type of collapse zone is entered, for instance going from yield strength collapse to plastic collapse, it can be seen that the difference between the trend lines and the API 5C3 formulas reaches a peak. This means that API 5C3 changes formulas because the calculated collapse pressure differs too much from the “real collapse pressure”, calculated with a polynomial or exponential trend line valid for all D/t ratios.
However, when going from the transition collapse zone to the elastic collapse zone, this peak doesn’t occur. This can be explained as follows. The plastic/elastic transition zone is derived on an arbitrary basis to connect the plastic collapse pressures with the elastic collapse pressures for given D/t ratios. As stated above, depending on the grade of the material, the yield strength collapse and plastic collapse pressures differ, whilst the elastic collapse pressures remain constant. A peak is therefore expected when going from the plastic collapse to the transition collapse zone, but not when going from the transition collapse to the elastic collapse zone.
Figure 10 (left) graphically presents a comparison between the differences of the polynomial and exponential trend lines (Grade N-80) versus the API 5C3 collapse pressures. It can be seen that a third-order polynomial equation gives an overall better result. However, the differences (in percentage) are very small (between -0,025% and 0,075%), so a single equation to calculate the collapse pressures could be appropriate. Figure 10 (right) compares the percentual differences between polynomial trend lines and API 5C3 predictions for tubes with J-55, N-80 and P-110 steel grade. When increasing the steel grade, the difference between the trend line and the in API 5C3 calculated collapse pressures also increases, but overall the same conclusion can be drawn: the differences (in percentage) are very small compared with the in API 5C3 calculated collapse pressures. Therefore, it should be possible to derive a single (third degree polynomial) formula for each steel grade to calculate the collapse pressures as a function of D/t ratio.
!"#$#%&'()*+,(-,-./012#
!"#$#+,(,,)'./012)#3#,(444%./012%#+#-5(-66./012#3#%)%(6&#
,#
7,#
-,,#
-7,#
%,,#
%7,#
,# -,# %,# ),# 4,# 7,#
!"##$%&'(%)'&&*)'(+,
-$.(
/01(+2.(89:;<*<=>?#1@*<A#?B<*# !;?C<;DB>?#1@*<A#?B<*#
EF8G/#HIJ8KLIM#
!GNHIFO# IJNKH+FIFPK##
8GNHIFO#
HNQ8#
RKHNQ8#
!"#$%&
!"#$"&
!"#'%&
!"#'"&
!"#"%&
"#""&
"#"%&
"#'"&
"#'%&
"#$"&
"#$%&
"& '"& $"& ("& )"& %"&
!"#$%&'&(
)&"*+,-(+.
$/,"0'&(1
",$(&
"234"
30/(
1/'1"
#50"678"*+,*& *+*& *+-& *+.& *+/&
,0.12&3-4.56-7&
*183-09& -4853!0-0:5&&
.183-09&
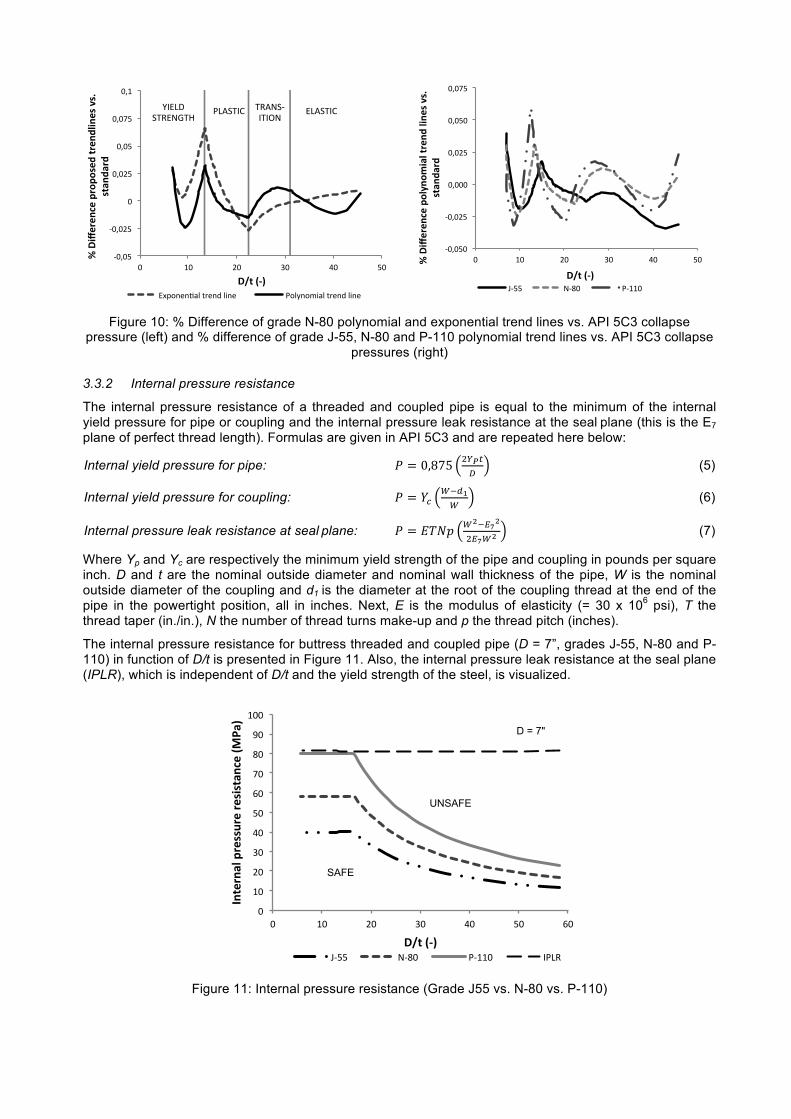
Figure 10: % Difference of grade N-80 polynomial and exponential trend lines vs. API 5C3 collapse
pressure (left) and % difference of grade J-55, N-80 and P-110 polynomial trend lines vs. API 5C3 collapse pressures (right)
3.3.2 Internal pressure resistance
The internal pressure resistance of a threaded and coupled pipe is equal to the minimum of the internal yield pressure for pipe or coupling and the internal pressure leak resistance at the seal plane (this is the E7 plane of perfect thread length). Formulas are given in API 5C3 and are repeated here below:
Internal yield pressure for pipe: ! = 0,875 !!!!!
(5)
Internal yield pressure for coupling: ! = !!!!!!!
(6)
Internal pressure leak resistance at seal plane: ! = !"#$ !!!!!!
!!!!! (7)
Where Yp and Yc are respectively the minimum yield strength of the pipe and coupling in pounds per square inch. D and t are the nominal outside diameter and nominal wall thickness of the pipe, W is the nominal outside diameter of the coupling and d1 is the diameter at the root of the coupling thread at the end of the pipe in the powertight position, all in inches. Next, E is the modulus of elasticity (= 30 x 106 psi), T the thread taper (in./in.), N the number of thread turns make-up and p the thread pitch (inches).
The internal pressure resistance for buttress threaded and coupled pipe (D = 7”, grades J-55, N-80 and P-110) in function of D/t is presented in Figure 11. Also, the internal pressure leak resistance at the seal plane (IPLR), which is independent of D/t and the yield strength of the steel, is visualized.
Figure 11: Internal pressure resistance (Grade J55 vs. N-80 vs. P-110)
!"#"$%
!"#"&$%
"%
"#"&$%
"#"$%
"#"'$%
"#(%
"% ("% &"% )"% *"% $"%
!"#$%&'&(
)&"*'+*+
,&-".'&(
-/$(&,"0,1"
,.2(
-2'-"
#3."456"+,-./0/123%450/6%37/0% 8.39/.:723%450/6%37/0%
;<+=>%?@A+BC@D%
8=E?@<F% @AEB?!<@<GB%%
+=E?@<F%
!"#"$"%
!"#"&$%
"#"""%
"#"&$%
"#"$"%
"#"'$%
"% ("% &"% )"% *"% $"%!"#$%&'&(
)&"*+,-(+.
$/,"0'&(1
",$(&
2"324"
20/(
1/'1
"
#50"678"+!$$% ,!-"% .!(("%
!"
#!"
$!"
%!"
&!"
'!"
(!"
)!"
*!"
+!"
#!!"
!" #!" $!" %!" &!" '!" (!"
!"#$%"&'()%$**+%$(%$*,*#&"
-$(./
0&1(
23#(.41(,-''" .-*!" /-##!" 0/12"
UNSAFE
SAFE
D = 7"
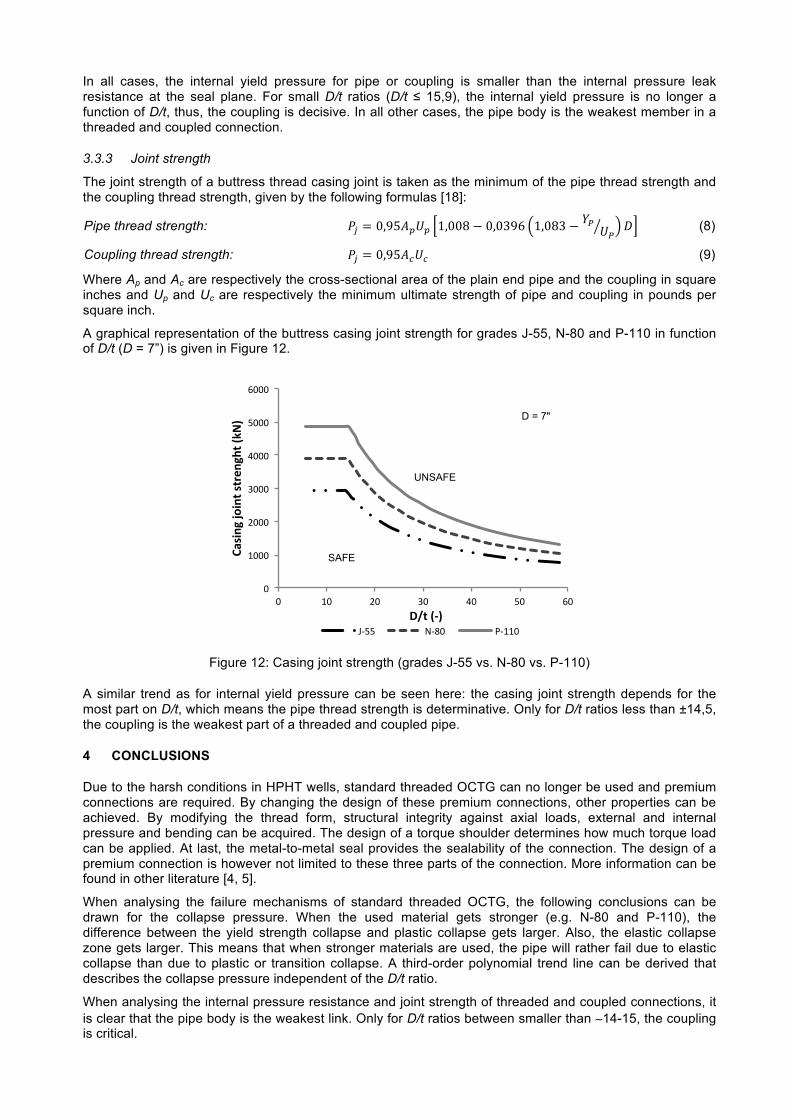
In all cases, the internal yield pressure for pipe or coupling is smaller than the internal pressure leak resistance at the seal plane. For small D/t ratios (D/t ≤ 15,9), the internal yield pressure is no longer a function of D/t, thus, the coupling is decisive. In all other cases, the pipe body is the weakest member in a threaded and coupled connection.
3.3.3 Joint strength
The joint strength of a buttress thread casing joint is taken as the minimum of the pipe thread strength and the coupling thread strength, given by the following formulas [18]:
Pipe thread strength: !! = 0,95!!!! 1,008 − 0,0396 1,083 − !! !! ! (8)
Coupling thread strength: !! = 0,95!!!! (9)
Where Ap and Ac are respectively the cross-sectional area of the plain end pipe and the coupling in square inches and Up and Uc are respectively the minimum ultimate strength of pipe and coupling in pounds per square inch.
A graphical representation of the buttress casing joint strength for grades J-55, N-80 and P-110 in function of D/t (D = 7”) is given in Figure 12.
Figure 12: Casing joint strength (grades J-55 vs. N-80 vs. P-110)
A similar trend as for internal yield pressure can be seen here: the casing joint strength depends for the most part on D/t, which means the pipe thread strength is determinative. Only for D/t ratios less than ±14,5, the coupling is the weakest part of a threaded and coupled pipe.
4 CONCLUSIONS
Due to the harsh conditions in HPHT wells, standard threaded OCTG can no longer be used and premium connections are required. By changing the design of these premium connections, other properties can be achieved. By modifying the thread form, structural integrity against axial loads, external and internal pressure and bending can be acquired. The design of a torque shoulder determines how much torque load can be applied. At last, the metal-to-metal seal provides the sealability of the connection. The design of a premium connection is however not limited to these three parts of the connection. More information can be found in other literature [4, 5].
When analysing the failure mechanisms of standard threaded OCTG, the following conclusions can be drawn for the collapse pressure. When the used material gets stronger (e.g. N-80 and P-110), the difference between the yield strength collapse and plastic collapse gets larger. Also, the elastic collapse zone gets larger. This means that when stronger materials are used, the pipe will rather fail due to elastic collapse than due to plastic or transition collapse. A third-order polynomial trend line can be derived that describes the collapse pressure independent of the D/t ratio.
When analysing the internal pressure resistance and joint strength of threaded and coupled connections, it is clear that the pipe body is the weakest link. Only for D/t ratios between smaller than ∼14-15, the coupling is critical.
!"
#!!!"
$!!!"
%!!!"
&!!!"
'!!!"
(!!!"
!" #!" $!" %!" &!" '!" (!"
!"#$%&'()
$%*'#*+,%
&-*'./0
1'
23*'.41')*''" +*,!" -*##!"
SAFE
UNSAFE
D = 7"

5 REFERENCES
[1] J. Van Wittenberghe, et al., Fatigue investigation of threaded pipe connections. Sustainable Construction and Design (SCAD), 2010. 1(1): p. 182-189.
[2] Craig, B., Materials for deep oil and gas well construction, in Advanced Materials & Processes, May 2008: p. 33 - 35.
[3] L.B. Hilbert Jr. and I.A. Kalil. Evaluation of Premium Threaded Connections Using Finite-Element Analysis and Full-Scale Testing, SPE/IADC Drilling Conference, New Orleans, Louisiana, USA, 1992.
[4] Galle, T., et al., Influence of design features on the structural integrity of threaded pipe connections. Sustainable Construction and Design (SCAD), 2011. 2(2): p. 237-245.
[5] J. Van Wittenberghe, et al., Design Characteristics that improve the fatigue life of threaded pipe connections. Sustainable Construction and Design (SCAD), 2011. 2(2): p. 334-341.
[6] Hunting, HES Seal lock Apex, U.S. Pat. No. 4,600,225, 2002 [7] Yamamoto, K., et al., Stress Analysis of Premium Threaded Connection “FOX” by Finite Element
Method, in Kawasaki Steel Giho 20, 1989: p. 202-207. [8] Sugino, M., et al. Development of an Innovative High-performance Premium Threaded Connection
for OCTG, Offshore Technology Conference, Houston, Texas, USA, 2010. [9] Bradley, A.B., et al. Premium Connection Design, Testing, and Installation for HPHT Sour Wells,
SPE High Pressure-High Temperature Sour Well Design Applied Technology Workshop, The Woodlands, Texas, U.S.A, 2005.
[10] World Oil, 2008-09 Casing Reference Tables, November 2008 [11] Takano, J., et al., Development of Premium Connection “KSBEAR” for Withstanding High
Compression, in Kawasaki Steel Giho 34, 2002: p. 21-28. [12] Santi, N.J., et al. Premium & Semi-premium Connections Design Optimization for Varied Drilling-
with-Casing Applications, Offshore Technology Conference, Houston, Texas, USA, 2005. [13] Dvorkin, E.N. On the modeling of industrial processes, SIM&TEC. 2010. [14] Dvorkin, E.N. and R.G. Toscano, Finite element models in the steel industry: Part II: Analyses of
tubular products performance. Computers & Structures, 2003. 81(8-11): p. 575-594. [15] Lian Zhanghua, et al., Analysis of jump-out loads on connectors of buttress and round threads of
casing. China Petroleum Machinery, 2004-05. [16] Guangjie, Y., et al., Numerical and experimental distribution of temperature and stress fields in API
round threaded connection, in Engineering Failure Analysis 13, 2006: p. 1275 – 1284. [17] Cernocky, E.P., et al. A standardized approach to finite element analysis of casing-tubing
connections to establish relative sealing performance as a function of design geometry, machining tolerances and applied loads, Fourth World Congress on Computational Mechanics, Buenos Aires, Argentinië, 1998. p. 1167 - 1186.
[18] API Bull 5C3, Petroleum and natural gas industries - Formulae and calculation for casing, tubing, drill pipe and line pipe properties, 1993, American Petroleum Institute.
[19] Mitchell, R.F., Casing Desing, in Petroleum Engineering Handbook, Volume II: Drilling Engineering, 2007.