Embed Size (px)
Citation preview

RESEARCH ARTICLE Open Access
Analysis of BAC-end sequences (BESs) anddevelopment of BES-SSR markers for geneticmapping and hybrid purity assessment inpigeonpea (Cajanus spp.)Abhishek Bohra1,2†, Anuja Dubey1,3†, Rachit K Saxena1,2, R Varma Penmetsa4, KN Poornima1,5, Naresh Kumar1,6,Andrew D Farmer7, Gudipati Srivani1, Hari D Upadhyaya1, Ragini Gothalwal3, S Ramesh5, Dhiraj Singh6,Kulbhushan Saxena1, PB Kavi Kishor2, Nagendra K Singh8, Christopher D Town9, Gregory D May7,Douglas R Cook4* and Rajeev K Varshney1,10*
Abstract
Background: Pigeonpea [Cajanus cajan (L.) Millsp.] is an important legume crop of rainfed agriculture. Despite ofconcerted research efforts directed to pigeonpea improvement, stagnated productivity of pigeonpea during lastseveral decades may be accounted to prevalence of various biotic and abiotic constraints and the situation isexacerbated by availability of inadequate genomic resources to undertake any molecular breeding programme foraccelerated crop improvement. With the objective of enhancing genomic resources for pigeonpea, this studyreports for the first time, large scale development of SSR markers from BAC-end sequences and their subsequentuse for genetic mapping and hybridity testing in pigeonpea.
Results: A set of 88,860 BAC (bacterial artificial chromosome)-end sequences (BESs) were generated afterconstructing two BAC libraries by using HindIII (34,560 clones) and BamHI (34,560 clones) restriction enzymes.Clustering based on sequence identity of BESs yielded a set of >52K non-redundant sequences, comprising 35Mbp or >4% of the pigeonpea genome. These sequences were analyzed to develop annotation lists and subdividethe BESs into genome fractions (e.g., genes, retroelements, transpons and non-annotated sequences). Parallelanalysis of BESs for microsatellites or simple sequence repeats (SSRs) identified 18,149 SSRs, from which a set of6,212 SSRs were selected for further analysis. A total of 3,072 novel SSR primer pairs were synthesized and testedfor length polymorphism on a set of 22 parental genotypes of 13 mapping populations segregating for traits ofinterest. In total, we identified 842 polymorphic SSR markers that will have utility in pigeonpea improvement. Basedon these markers, the first SSR-based genetic map comprising of 239 loci was developed for this previouslyuncharacterized genome. Utility of developed SSR markers was also demonstrated by identifying a set of 42markers each for two hybrids (ICPH 2671 and ICPH 2438) for genetic purity assessment in commercial hybridbreeding programme.
Conclusion: In summary, while BAC libraries and BESs should be useful for genomics studies, BES-SSR markers, andthe genetic map should be very useful for linking the genetic map with a future physical map as well as formolecular breeding in pigeonpea.
* Correspondence: [email protected]; [email protected]† Contributed equally1International Crops Research Institute for the Semi-Arid Tropics (ICRISAT),Patancheru, Hyderabad, 502324, India4Department of Plant Pathology, University of California, Davis, CA 95616,USAFull list of author information is available at the end of the article
Bohra et al. BMC Plant Biology 2011, 11:56http://www.biomedcentral.com/1471-2229/11/56
© 2011 Bohra et al; licensee BioMed Central Ltd. This is an Open Access article distributed under the terms of the Creative CommonsAttribution License (http://creativecommons.org/licenses/by/2.0), which permits unrestricted use, distribution, and reproduction inany medium, provided the original work is properly cited.

BackgroundPigeonpea [Cajanus cajan (L.) Millsp.], also known astuar or arhar, is an economically important legume cropwith an annual production of 3.65 Mt. Cultivation ofpigeonpea occurs on ~5 million hectares, primarily inAsia and countries of eastern and southern Africa, andto a lesser extent in countries of Latin America and theCaribbean. As a member of the sub tribe Cajaninae,pigeonpea is contained in an early diverging lineage oftribe Phaseoleae, a monophyletic group of legumes thatcontains several of the world’s most important foodlegumes including soybean, common bean, cowpea andmung bean. Similar to most other Phaseoleae species,pigeonpea contains 11 pairs of chromosomes (2n = 22)and has a moderately sized genome in the range of0.853 pg or 858 Mbp [1].India is the world’s largest producer of pigeonpea and
the presumed center of origin [2]. Relative to mostother crop legumes pigeonpea is highly drought tolerant,being able to retain productivity with less than 650 mmannual rainfall. Owing to its capacity for symbioticnitrogen fixation, pigeonpea seeds have high levels ofprotein and they specifically enriched for amino acidsthat are often limiting in the human diet, includingmethionine, lysine, and tryptophan. In resource poorareas of the world, pigeonpea serves as an importantforage and cover crop, while the stems provide wood fortool making and fuel, and thatch for roofing. These fac-tors, especially the ability to withstand elevated tempera-tures and limited water availability, add to pigeonpea’simportance as a crop in semi-arid tropical (SAT) regionsof the world, especially in the SAT of India whereapproximately 77% of global production occurs. Despiteits importance in the SAT regions, little concertedresearch effort has been directed at either improvementor technology transfer in this crop. Thus, the pigeonpeaproduction has remained static [3] and a range of bioticand abiotic stresses continue reduce yields by 50% orgreater [4]. Among the most important limiting factorsare Fusarium wilt, sterility mosaic disease, pod borer,soil salinity and water logging. Very recently, hybridbreeding technology based on the cytoplasmic-nuclearmale-sterility (CMS) system has been implemented inthe pigeonpea breeding programme at ICRISAT [5], andthis technology holds great potential to increase pigeon-pea productivity.Various advances in plant biotechnology and especially
genomics together with traditional plant breeding tech-nologies have led to the development of new improvedvarieties in a number of crop species with greater toler-ance/resistance and higher yield [6,7]. In this context,molecular markers play a very important role as theseare used for estimating diversity in germplasm, trait
mapping, molecular breeding, genetic purity assessmentof hybrid seeds, etc. Among a range of molecular mar-kers starting with isozymes, RFLP (restriction fragmentlength polymorphism), RAPD (random amplified poly-morphic DNA), AFLP (amplified fragment length poly-morphism), SSR (simple sequence repeat), DArT(diversity array technology), and most recently SNP (sin-gle nucleotide polymorphism), that have become avail-able during last two decades [8], SSR markers haveemerged as the current markers of choice for plantgenetics and breeding applications [9]. While SNP mar-kers have a promising future in plant breeding applica-tions, and may augment or displace SSR based markersystems, SNP based markers and associated technologiesare in their infancy in most crops, including pigeonpea,while SSR marker technologies are better established forwide spread use in molecular breeding.In case of pigeonpea, at present, only a few hundred
SSR markers are available [10-13], a situation that isfurther hampered by low levels of genetic diversitywithin cultivated germplasm demands development ofSSR markers at large scale.Traditionally, three approaches are used for identifica-
tion and development of SSR markers: (i) constructionof SSR-enriched library followed by sequencing of SSRpositive clones [9], (ii) mining of EST (expressedsequence tag) transcript sequence generated by Sangersequencing [14] or short transcript sequences generatedby next generation sequencing technologies [15],(iii) mining the BAC (bacterial artificial chromosome)-end sequences (BESs) [16]. So far, the first twoapproaches have been used for developing SSR markersin pigeonpea with some success despite the labour-intensive and time consuming nature of the SSR enrich-ment and very low polymorphism levels of SSRs identi-fied from the mining of transcript sequences. Thedevelopment of SSR markers from BESs circumventsthe limitations of the first two approaches, as a largenumber of SSRs can be rapidly identified and suchgenomic SSRs tend to display higher level of poly-morphism relative to transcript associated SSRs. In addi-tion, BES-SSR markers serve a useful resource forintegrating genetic and physical maps [16-18].The present study was undertaken with following
objectives: (i) construction of two BAC libraries andsequencing of BAC-ends, (ii) comprehensive analysis ofBAC-end sequences (BESs) for gaining insights inpigeonpea genome, (iii) mining the BESs for develop-ment of large scale SSR markers, (iv) characterizationof newly developed BES-SSR markers on a panel ofparental genotypes, (v) development of the first SSR-based genetic map for pigeonpea, and (vi) identifica-tion of an informative set of SSR markers suitable for
Bohra et al. BMC Plant Biology 2011, 11:56http://www.biomedcentral.com/1471-2229/11/56
Page 2 of 15

purity assessment of two leading hybrids, ICPH 2438and ICPH 2671 to facilitate efficient hybrid seedproduction.
ResultsBAC-end sequence analysisTwo BAC libraries were developed from pigeonpea cul-tivar “Asha”, based on partial digestion with HindIII andBamHI restriction enzymes. BAC clones were sequencedfrom both insert ends to yield 88,860 DNA sequenceswith an average read length of 620 bp.As a prelude to the comprehensive analysis of BAC-
end sequences, we analyzed BESs for redundancybetween clones and for sequence content as well as forremoval of cytoplasmic organellar sequences using theannotation pipeline shown in Figure 1. Sequences wereclustered using criteria of ≥95% identity and ≥200 bpoverlap, producing a set of 41,736 singleton sequencesand 10,711 sequence clusters. This non-redundantsequence set was filtered for rRNA, chloroplast andmitochondrial sequences using BLAST’N’ against data-sets of the corresponding sequence types, yielding a setof 41,329 singletons and 10,610 non-redundant BESsthat were presumed to derive from the nuclear genome.
In total this non-redundant nuclear genome dataset sur-veys 35 Mb or ~4.3% of the pigeonpea genome.A series of parallel analyses were performed to anno-
tate the features of singletons and clustered BESs. Simi-larity to transcribed sequences or known proteins wasassessed by BLAST’N’ and BLAST’X’ of sequencesagainst the TIGR plant transcript assemblies http://plantta.jcvi.org/ and the National Center for Biotechnol-ogy Information (NCBI) non-redundant protein data-base, respectively, using an E-value cut-off of <1.00E-20.Further evidence of protein coding regions, as well asstandardized nomenclature, was obtained by queriesagainst the Interpro and GeneOntology Molecular Func-tion databases. Similarity to known plant repeatsequences was assessed by BLAST’N’ and tBLAST’X’against a database of plant repeat sequences (http://www.jcvi.org).Based on the compiled information, BESs were subdi-
vided into five primary categories: (1) non-annotated,(2) gene-containing, (3) retroelement-containing, (4)transposable element-containing, and (5) organelle- orribosomal rRNA-containing, as shown in Table 1. Mostsequence annotations were supported by multiple lines ofevidence and a fraction of sequences were predicted to
Figure 1 Annotation pipeline for analysis of BESs. This pipeline resulted in selection of non-redundant genomic BAC-ends which excludedorganeller sequences, and further identification, annotation of non-redundant sequences together with SSR discovery, selection and primerdesigning.
Bohra et al. BMC Plant Biology 2011, 11:56http://www.biomedcentral.com/1471-2229/11/56
Page 3 of 15
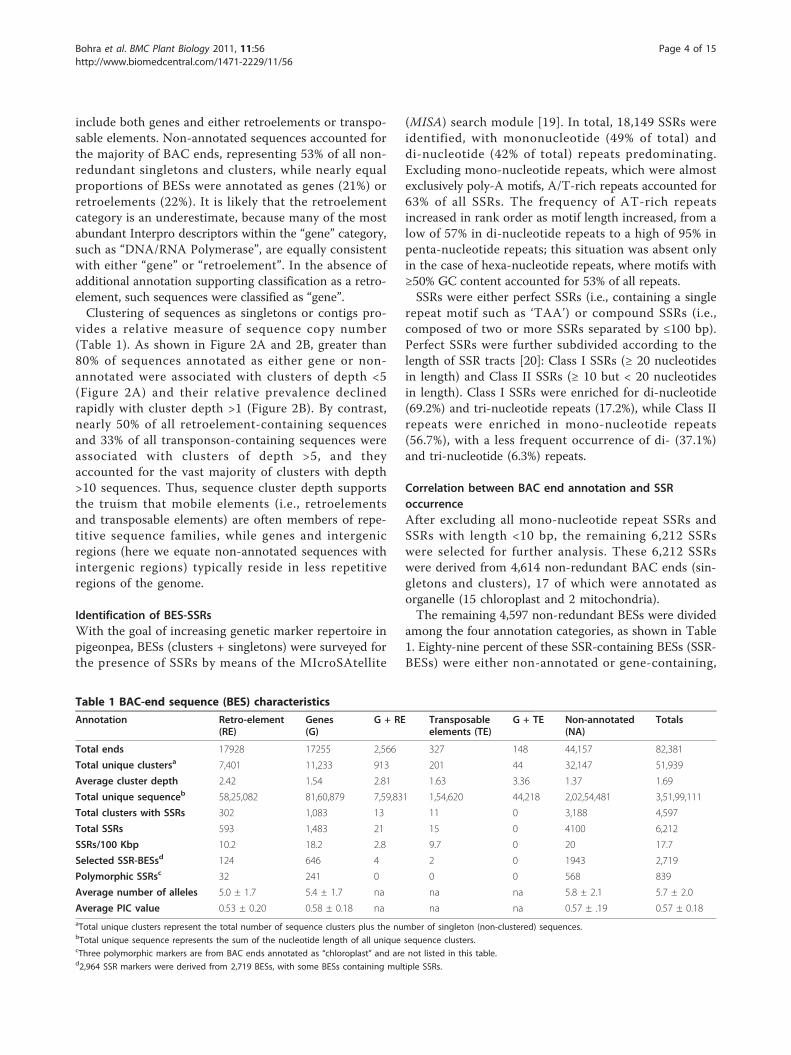
include both genes and either retroelements or transpo-sable elements. Non-annotated sequences accounted forthe majority of BAC ends, representing 53% of all non-redundant singletons and clusters, while nearly equalproportions of BESs were annotated as genes (21%) orretroelements (22%). It is likely that the retroelementcategory is an underestimate, because many of the mostabundant Interpro descriptors within the “gene” category,such as “DNA/RNA Polymerase”, are equally consistentwith either “gene” or “retroelement”. In the absence ofadditional annotation supporting classification as a retro-element, such sequences were classified as “gene”.Clustering of sequences as singletons or contigs pro-
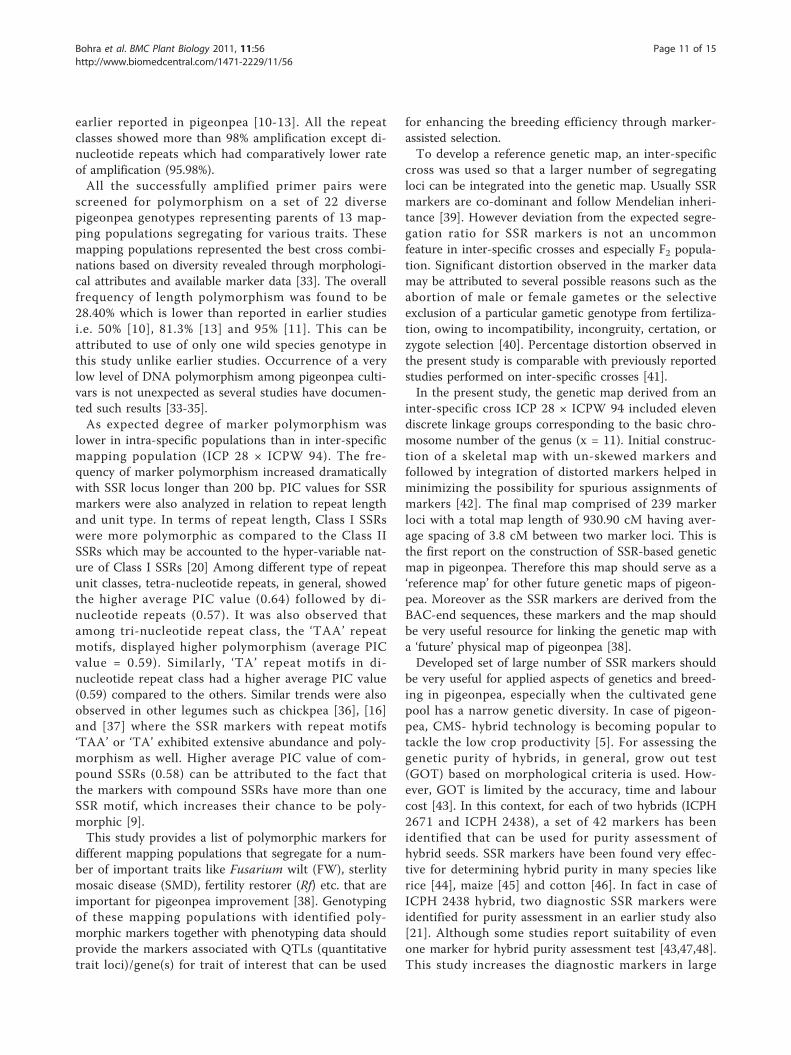
vides a relative measure of sequence copy number(Table 1). As shown in Figure 2A and 2B, greater than80% of sequences annotated as either gene or non-annotated were associated with clusters of depth <5(Figure 2A) and their relative prevalence declinedrapidly with cluster depth >1 (Figure 2B). By contrast,nearly 50% of all retroelement-containing sequencesand 33% of all transponson-containing sequences wereassociated with clusters of depth >5, and theyaccounted for the vast majority of clusters with depth>10 sequences. Thus, sequence cluster depth supportsthe truism that mobile elements (i.e., retroelementsand transposable elements) are often members of repe-titive sequence families, while genes and intergenicregions (here we equate non-annotated sequences withintergenic regions) typically reside in less repetitiveregions of the genome.
Identification of BES-SSRsWith the goal of increasing genetic marker repertoire inpigeonpea, BESs (clusters + singletons) were surveyed forthe presence of SSRs by means of the MIcroSAtellite
(MISA) search module [19]. In total, 18,149 SSRs wereidentified, with mononucleotide (49% of total) anddi-nucleotide (42% of total) repeats predominating.Excluding mono-nucleotide repeats, which were almostexclusively poly-A motifs, A/T-rich repeats accounted for63% of all SSRs. The frequency of AT-rich repeatsincreased in rank order as motif length increased, from alow of 57% in di-nucleotide repeats to a high of 95% inpenta-nucleotide repeats; this situation was absent onlyin the case of hexa-nucleotide repeats, where motifs with≥50% GC content accounted for 53% of all repeats.SSRs were either perfect SSRs (i.e., containing a single
repeat motif such as ‘TAA’) or compound SSRs (i.e.,composed of two or more SSRs separated by ≤100 bp).Perfect SSRs were further subdivided according to thelength of SSR tracts [20]: Class I SSRs (≥ 20 nucleotidesin length) and Class II SSRs (≥ 10 but < 20 nucleotidesin length). Class I SSRs were enriched for di-nucleotide(69.2%) and tri-nucleotide repeats (17.2%), while Class IIrepeats were enriched in mono-nucleotide repeats(56.7%), with a less frequent occurrence of di- (37.1%)and tri-nucleotide (6.3%) repeats.
Correlation between BAC end annotation and SSRoccurrenceAfter excluding all mono-nucleotide repeat SSRs andSSRs with length <10 bp, the remaining 6,212 SSRswere selected for further analysis. These 6,212 SSRswere derived from 4,614 non-redundant BAC ends (sin-gletons and clusters), 17 of which were annotated asorganelle (15 chloroplast and 2 mitochondria).The remaining 4,597 non-redundant BESs were divided
among the four annotation categories, as shown in Table1. Eighty-nine percent of these SSR-containing BESs (SSR-BESs) were either non-annotated or gene-containing,
Table 1 BAC-end sequence (BES) characteristics
Annotation Retro-element(RE)
Genes(G)
G + RE Transposableelements (TE)
G + TE Non-annotated(NA)
Totals
Total ends 17928 17255 2,566 327 148 44,157 82,381
Total unique clustersa 7,401 11,233 913 201 44 32,147 51,939
Average cluster depth 2.42 1.54 2.81 1.63 3.36 1.37 1.69
Total unique sequenceb 58,25,082 81,60,879 7,59,831 1,54,620 44,218 2,02,54,481 3,51,99,111
Total clusters with SSRs 302 1,083 13 11 0 3,188 4,597
Total SSRs 593 1,483 21 15 0 4100 6,212
SSRs/100 Kbp 10.2 18.2 2.8 9.7 0 20 17.7
Selected SSR-BESsd 124 646 4 2 0 1943 2,719
Polymorphic SSRsc 32 241 0 0 0 568 839
Average number of alleles 5.0 ± 1.7 5.4 ± 1.7 na na na 5.8 ± 2.1 5.7 ± 2.0
Average PIC value 0.53 ± 0.20 0.58 ± 0.18 na na na 0.57 ± .19 0.57 ± 0.18aTotal unique clusters represent the total number of sequence clusters plus the number of singleton (non-clustered) sequences.bTotal unique sequence represents the sum of the nucleotide length of all unique sequence clusters.cThree polymorphic markers are from BAC ends annotated as “chloroplast” and are not listed in this table.d2,964 SSR markers were derived from 2,719 BESs, with some BESs containing multiple SSRs.
Bohra et al. BMC Plant Biology 2011, 11:56http://www.biomedcentral.com/1471-2229/11/56
Page 4 of 15

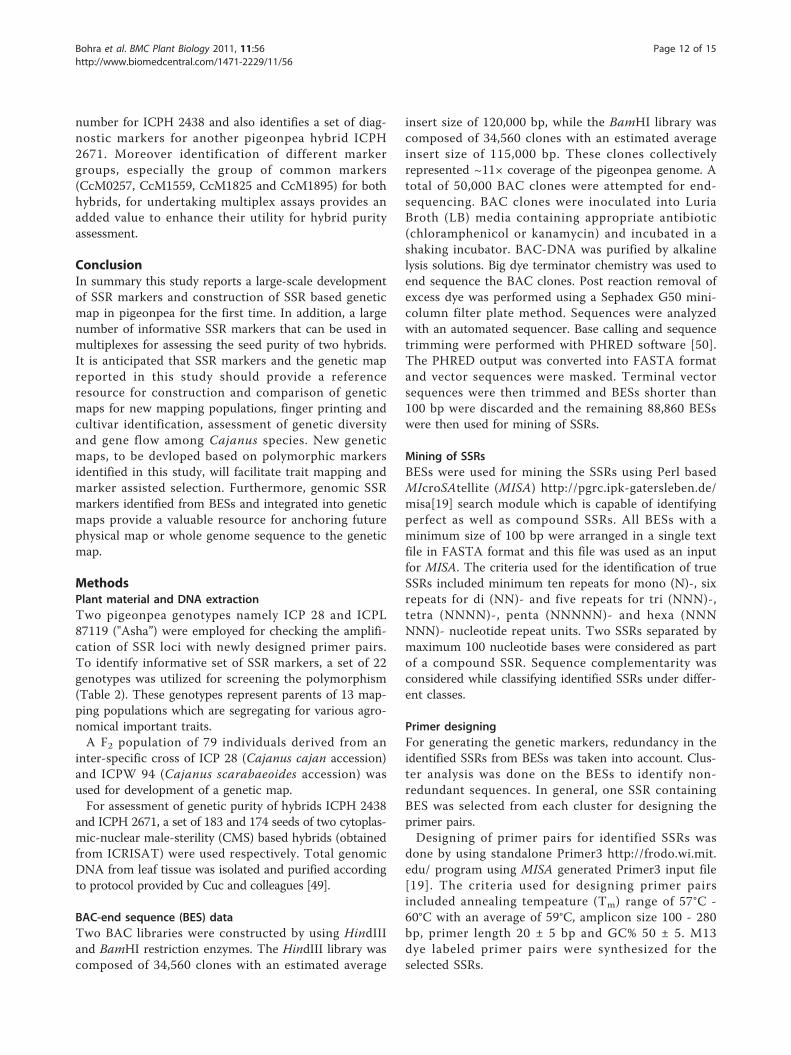
while 9.8% were retroelement-containing (Figure 3 andTable 1). The rate of SSR occurrence per 100 kb also dif-fers considerably between annotation categories, consis-tent with the uneven discovery of SSRs betweenannotation categories. Thus, SSRs are twice as frequentper 100 kb in gene-containing (G) and non-annotated
(NA) sequences compared to retroelement-containing(RE) sequences (Table 1 and Figure 3). Consistent withthe likely pressure of purifying selection, BAC ends con-taining tri-nucleotide repeats were more likely to be anno-tated as genes (31%), compared to the remaining SSR-containing BAC sequences (22% annotated as genes).
Figure 2 Distribution of BAC end categories according to BES cluster depth. Cluster depth supported the repetitive nature of mobilegenetic elements while genic regions were mostly associated with less repetitive sequences.
Bohra et al. BMC Plant Biology 2011, 11:56http://www.biomedcentral.com/1471-2229/11/56
Page 5 of 15

For purposes of developing a uniform analysis ofknown pigeonpea SSRs, we obtained 457 SSRs sub-mitted to NCBI GenBank by researchers at the Univer-sity of Bonn (submitted by Odney et al.) and previouslydeveloped by our group (Varshney et al.). Both of thesepublicly available SSR sets were generated using PCR-based microsatellite enrichment strategies. As shown inthe Table 1, the relative distribution of SSRs betweengenome fractions differs substantially for SSRs obtainedby means of genome enrichment compared to randomBAC end sequencing. In particular, genome-enrichmentmethodologies produced approximately three times therate of retroelement-associated SSRs and an ~100-foldincrease in the rate of SSRs derived from organelle orrRNA sequences, most of which were chloropast derived(data not shown).
Development of novel SSR genetic markersPrimer pairs were designed and synthesized for a totalof 3,072 non-redundant BAC-end sequence SSRs (BES-SSRs). We refer to these SSR markers as CcM (Cajanuscajan Microsatellite) (Additional file 1: List of newlydeveloped SSR markers isolated from BESs ofpigeonpea).All 3,072 primer pairs were screened for amplification
of DNA from two pigeonpea genotypes, i.e., ICP 28 andthe popular variety “Asha”, ICPL 87119. This analysis
identified a set of 2,964 markers (96.5%) with scorableamplicons (Additional file 1: List of newly developedSSR markers isolated from BESs of pigeonpea). These2,964 SSRs correspond to 2,719 BESs (Table 1), becausesome BESs contain multiple SSRs. Screening of these2,964 markers on 22 pigeonpea genotypes, including 21cultivated and one wild type (Table 2), further defined asubset of 842 polymorphic markers (28.4%). Amongthese polymorphic SSRs, allele count ranged from 2 to14 (average of 5.65 alleles per marker) in the germplasmsurveyed. 281 of the 842 polymorphic SSRs were poly-morphic exclusively in wild species. Allelic data obtainedfrom 22 genotypes were used to calculate the poly-morphism information content (PIC) value of each CcMmarker, and thus infer the discriminatory power ofthese CcM markers. PIC values ranged from 0.08 to0.90 with an average of 0.57 (Additional file 2: Poly-morphism status of SSR markers tested on 22 parentalgenotypes).As shown in Table 3, Class I SSRs were on average
more polymorphic (328 of 900, or 36.4%) than Class IISSRs (287 of 1,438, or 20.0%), with mean PIC values of0.60 and 0.53 (significant at p < 0.0001), respectively.Within this set of perfect SSRs, di-nucleotide repeatsaccounted for the largest number of polymorphic locii.e. 39.9% for Class I and 22.8% for Class II). SSRsderived from compound repeats had an average
Figure 3 Distribution and frequency of SSRs in differing genome fractions. Maximum frequency and maximum amount of SSRs wasexhibited by non annotated regions followed by the regions containing ‘genes’.
Bohra et al. BMC Plant Biology 2011, 11:56http://www.biomedcentral.com/1471-2229/11/56
Page 6 of 15

polymorphism rate of 36.3%, similar to Class I SSRs.The average genotype pair was distinguished by 137polymorphic SSRs (Table 4). As expected, however,polymorphism rates varied considerably depending onthe genotype pair under comparison, from a low of 52
polymorphic SSRs (ICPL 332 × ICPL 20096) to a highof 378 polymorphic SSRs (ICP 28 × ICPW 94).
Construction of an SSR-based genetic mapAn inter-specific F2 population derived from ICP 28(C. cajan) × ICPW 94 (C. scaraboides) was selected forthe construction of a reference genetic map. Consistentwith a wide genetic cross, this pairwise comparison hadthe highest number of polymorphic SSRs (Table 4). Themapping population was genotyped with all polymorphicmarkers and marker segregation data were analyzed bythe goodness of fit test for a 1:2:1 segregation ratio.Only 138 (36.50%) markers showed good agreementwith the expected segregation ratio 1:2:1 (at the thresh-old of p = 0.05). Among the 240 markers with deviationfrom Mendelian ratios we observed instances of com-plete absence or very low occurence of one parentalallele, and instances of excess heterozygosity.The genetic linkage map was constructed in a stepwise
manner, beginning with the 138 normally segregatingmarkers at LOD 5 and a minimum recombination fractionof 37.5. Subsequently, the 240 distorted markers weretested for integration with the help of Joinmap 3.0 soft-ware. The combined 239 markers yielded a genetic map of930.90 cM (919 kb/cM) (Figure 4), with an average of 21markers per linkage groups and an average between mar-ker distance of 3.8 cM. A total of 11 linkage group couldbe assigned, and these are presumed to correspond to thehaploid chromosome set of C. cajan (n = 11).
Identification of informative SSR markers for hybridpurity assessmentIn pigeonpea, there is a need for genetic markers toassess hybrid seed purity. Among the genotypes
Table 2 List of genotypes used and their characters
AccessionID
Species Maturitygroup
cDM dDF Seedcolor
ICP 28 C. cajan - - - -
ICPW 94 C.scarabaeoides
- - - -
ICPB 2049 C. cajan aMD 160 118 B
ICPL 99050 C. cajan MD 175 123 B
ICPL 20096 C. cajan MD 185 127 B
ICPL 332 C. cajan MD 178 118 B
ICP 7035 C. cajan MD 192 130 P
TTB7 C. cajan - - - -
ICPL 87091 C. cajan bSD 121 74 C
ICPL 87119 C. cajan MD 180 122 B
ICP 8863 C. cajan MD 176 114 B
ICPL 20097 C. cajan MD 187 131 B
ICPL 88034 C. cajan SD 137 88 B
ICPL 84023 C. cajan SD 134 68 B
ICPR 2671 C. cajan MD 180 122 B
ICPA 2043 C. cajan MD 175 115 B
ICPR 3467 C. cajan - - - -
ICPR 2438 C. cajan - - - -
ICPA 2039 C. cajan MD 122 80
ICPR 2447 C. cajan - - - -
ICPL 20108 C. cajan MD 181 125 C
ICP 2376 C. cajan MD 176 118 CaMD: medium duration, bSD: short duration, cDM: days to maturation,dDF: days to flowering, B: brown, P: purple, C: cream.
Table 3 Distribution of polymorphic markers into different repeat classes
SSR type Repeat classes Number of markerssynthesized
Number of markersamplified
Number of polymorphicmarkers
PIC value Number ofalleles
Compound 657 626 (95.28%) 227 (36.26%) 0.08-0.88(0.58) 2-12 (5.74)
Perfect
Class I
NN 639 592 (92.64%) 236 (39.86%) 0.08-0.90 (0.60) 2-14 (6.55)
NNN 200 194 (97%) 66 (34.02%) 0.08-0.85 (0.60) 2-13 (5.87)
NNNN 62 61(98.38%) 14 (22.95%) 0.28-0.81 (0.50) 3-9 (4.71)
NNNNN 10 10 (100%) 2 (20%) 0.52-0.76 (0.64) 5-7 (6)
NNNNNN 43 43 (100%) 10 (23.25%) 0.52-0.76 (0.64) 2-7 (4.4)
Total 954 900 (94.33%) 328 (36.44%)
Class II
NN 1,006 987 (98.11%) 219 (22.18%) 0.08-0.83 (0.53) 2-9 (4.9)
NNN 455 451 (99.12%) 68 (15.07%) 0.08-0.74 (0.48) 2-6 (4.4)
Total 1,461 1,438 (98.42%) 287 (19.95%)
Grand Total 3,072 2,964 (96.48%) 842 (28.40%)
Bohra et al. BMC Plant Biology 2011, 11:56http://www.biomedcentral.com/1471-2229/11/56
Page 7 of 15

surveyed for SSR polymorphism (Table 4), four geno-types (ICPA 2039, ICPR 2438, ICPA 2043 and ICPR2671) have been used for the development of twohybrids: ICPH 2438 (ICPA 2039 × ICPR 2438) andICPH 2671 (ICPA 2043 × ICPR 2671) [5,21]. For eachhybrid, 42 polymorphic markers were selected that dis-tinguished the parental lines and which gave high qual-ity amplification in prior analyses. To assess thereliability of these SSR markers, 183 seeds of ICPH 2438and 174 seeds of ICPH 2671 were obtained from theICRISAT germplasm and analyzed together with seedsof parental lines. Based on this analysis, both ICPH2438 and ICPH 2671 seed stocks had high rates of pur-ity (96.3% and 94.8%, respectively). However, the fre-quency with which tested hybrids showed bandingpatterns typical of both parental alleles was dependentupon the markers under analysis. Accordingly the mar-ker wise hybrid purity index varied between markers,ranging from 31.88% (CcM0724) to 99.42% (CcM0752)for ICPH 2671 and from 71.26% (CcM0133) to 100%(CcM2241) for ICPH 2438. A total of 30 markers forICPH 2671 and 35 markers for ICPH 2438 could detectpurity between 90 - 100% (Additional file 3: Purityindex of polymorphic SSR markers on pigeonpea hybridICPH 2671 individuals and Additional file 4: Purity
index of polymorphic SSR markers on pigeonpea hybridICPH 2438 individuals). The frequency of heterozygosityfor the hybrid in ICPH 2438 ranged from a minimum of53.1% (23/42) to a maximum of 100% (42/42). In caseof ICPH 2671 heterozygosity for a hybrid ranged fromminimum 53.1% (23/42) to a maximum of 95.24% (40/42).With the objective of reducing the cost and time of
PCR assays for purity assessment, we identified sets ofSSRs with allele sizes that were sufficiently different topermit multiplex analysis of hybrid seeds. In the case ofICPH 2671, 35 of the 42 markers were assigned to 9multiplex groups (MG 1- MG 9, Table 5). Figure 5shows the example of multiplexing the 7 ICPH 2671MG 1 markers. Similarly for ICPH 2438, 26 of the 42markers were assigned to 12 marker groups. A singlemultiplex of four markers (CcM0257, CcM1559,CcM1825 and CcM1895) produced well resolved poly-morphisms on both ICPH 2671 and ICPH 2438.
DiscussionThe narrow genetic base of pigeonpea has hindered thewide use of molecular marker technology for cropimprovement [22]. In the present study, two BAClibraries were developed with an estimated ~11× gen-ome coverage of pigeonpea. Sequencing of 50,000 BACclones from both insert ends provided 88,860 BESs.Removal of cytoplasmic orgeneller BESs and clusteranalysis facilitated the maximum possible recovery ofnuclear genomic sequences comprising 41,329 single-tons and 10,601 non-redundant contigs. With anobjective to understand the constitution of SSR con-taining BAC clones, BESs were run through an annota-tion pipeline. Major proportion of the sequencesremained non-annotated which may be considered as‘novel’ C. cajan sequences. The overall repetitive frac-tion, resulting from BES analysis was found to beintermediate (22.15%) when compared with the per-centage of repetitive elements in BESs of otherlegumes such as Trifolium (8.5%), soybean (33.5%), andcommon bean (49.3%) [23]. BES annotation analysishas shown a considerable variability in the amount ofrepetitive fraction in different crop species such astomato (49.3%) [24], papaya (16%) [25], banana (36%)[26] and citrus (25%) [27]. This variation in theamount of repetitive elements in BESs is an indicativefeature of presence of repetitive elements in the gen-ome of a species. A varying level of annotations in dif-ferent species may also be responsible for difference inrepetitive elements. Proportion of annotated genic frac-tion was found more or less similar as observed in theBESs analysis of other crop species such as Phaseolus(29.3%) [23], apple (10.9%) [28], banana (11%) [26],Brassica (11%) [29] and papaya (19.%) [25].
Table 4 SSR polymorphism status on 13 mappingpopulations
Mapping parents aSegregatingtraits
Number ofF2 lines
Number ofpolymorphicmarkers
ICP 28 × ICPW 94 PB 79 378
ICPB 2049 × ICPL99050
FW 370 103
ICP 332 × ICPL 7035 SMD - 84
ICPL 332 × ICPL20096
FW and SMD 384 52
ICPL 87119 × ICPL87091
FW and SMD 124 114
ICPL 8863 × ICPL20097
SMD 384 143
ICPL 88034 × ICPL84023
WL - 106
ICPA 2043 × ICPR2671
FR 243 179
ICPA 2043 × ICPR3467
FR 261 173
ICPA 2039 × ICPR2447
FR 123 149
ICPA 2039 × ICPR2438
FR 240 137
ICPL 20102 × ICP2376
FW - 84
TTB7 × ICP 7035 SMD 144 80aPB: pod borer, FW: Fusarium wilt, SMD: sterility mosaic disease, WL: waterlogging,
FR: fertility restoration.
Bohra et al. BMC Plant Biology 2011, 11:56http://www.biomedcentral.com/1471-2229/11/56
Page 8 of 15

BESs have been very useful to develop SSR markers inseveral plant species including legumes like soybean[17], common bean [23] and Medicago [16]. In terms ofSSRs abundance, overall density of 1 SSR per 5.64 kbseems to be in good congruency with the earlier reportsin plant genomes [30]. Similar results showing SSR fre-quencies of 1 SSR per 4 to 10 kb were achieved in dif-ferent plant species like Medicago, soybean, Lotus,Arabidopsis and rice [16]. This discrepancy observed indifferent studies may be accounted to (i) amount ofsequence data analyzed, (ii) criteria for SSR identifica-tion, and (iii) different sources of derived sequences. It isalso important to note that after excluding non-annotatedBESs, majority (70.21%) of SSRs belong to be associatedwith genes. These observations are in agreement of the
comprehensive study in plant genomes where SSRs werefound associated mainly with genes [31].In terms of distribution of SSRs, unlike the common
occurrence of ‘CG’ motif in monocot species, ‘CG’motifs were the least abundant in pigeonpea genome, aspreviously observed in other legume species (Medicago,Lotus and soybean). Such low abundance of “CG” di-nucleotide repeats may be attributed to their tendencyof forming secondary structures (hairpins), leading to aselective pressure against ‘CG’ accumulation in genomes[32].While converting identified SSRs into genetic markers,
though 3,072 SSR primer pairs were synthesized; ofthese 2,964 (96.48%) primers yielded scorable amplicons.This rate of successful amplification is quite higher than
Figure 4 Reference genetic map of pigeonpea derived from an inter-specific F2 population (ICP 28 × ICPW 94). Initially, a skeleton mapwith normally segregating markers was constructed using MAPMAKER/EXP 3.0 while further integration of additional markers was performedwith Joinmap 3.0 by keeping the mapmaker order as “fixed”. Distances between the loci (in cM) are shown to the left of the linkage group andall the loci at the right side of the map.
Bohra et al. BMC Plant Biology 2011, 11:56http://www.biomedcentral.com/1471-2229/11/56
Page 9 of 15

Table 5 Details on marker groups (MGs) for multiplex assays for assessing purity of two hybrids
Hybrid/Markergroup ID
Number ofmarkers
Marker names
ICPH 2671a
MG 1 7 CcM0724:CcM2626:CcM2300:CcM1837:CcM1565:CcM3024:CcM1246
MG 2 7 CcM2350:CcM0737:CcM2517:CcM1825:CcM2228:CcM0516:CcM0171
MG 3 6 CcM2802:CcM2704:CcM2097:CcM0021:CcM1459:CcM0752
MG 4 6 CcM1895:CcM2076:CcM2948:CcM1707:CcM2257:CcM2281
MG 5 5 CcM1232:CcM1053:CcM1139:CcM2401:CcM0207
MG 6 4 CcM2370:CcM0374:CcM0257:CcM0246
MG 7 2 CcM1984:CcM0252
MG 8 2 CcM1385:CcM2453
MG 9 2 CcM1559:CcM0948
ICPH 2438
MG 1 8 CcM1825:CcM0878:CcM2672:CcM0057:CcM1713:CcM1651:CcM1647:CcM2330
MG 2 6 CcM1338:CcM1669:CcM2492:CcM2413:CcM0858:CcM1251
MG 3 5 CcM0121:CcM0008:CcM0257:CcM2380:CcM1371
MG 4 5 CcM1559:CcM2241:CcM1895:CcM0402:CcM1406
MG 5 4 CcM2386:CcM2449:CcM1565:CcM0207
MG 6 2 CcM0522:CcM1438
MG 7 2 CcM2164:CcM2781
MG 8 2 CcM0133:CcM0195
MG 9 2 CcM0481:CcM2595
MG10 2 CcM0948:CcM1282
MG11 2 CcM1616:CcM0252
MG12 2 CcM2982:CcM1078aOut of 42 informative markers identified for ICPH 2671, only 41 primers could be grouped in different multiplexes and the marker CcM1277 could not bemultiplexed in any marker group.
Figure 5 Electropherogram display for the multiplex set MG 1 for purity assessment of hybrid ICPH 2671. This figure shows the analysis(GENEMAPPER output) of seven SSR markers of MG1 for ICPH 2671 in a single capillary. SSR markers labeled with the same fluorescence dye areanalyzed in individual panels. A. Analysis of two VIC (green) labeled SSR markers, B. Two NED (black) labeled SSR markers, C. One PET (red)labeled SSR markers, and D. Analysis of two FAM (blue) labeled SSR markers.
Bohra et al. BMC Plant Biology 2011, 11:56http://www.biomedcentral.com/1471-2229/11/56
Page 10 of 15
earlier reported in pigeonpea [10-13]. All the repeatclasses showed more than 98% amplification except di-nucleotide repeats which had comparatively lower rateof amplification (95.98%).All the successfully amplified primer pairs were
screened for polymorphism on a set of 22 diversepigeonpea genotypes representing parents of 13 map-ping populations segregating for various traits. Thesemapping populations represented the best cross combi-nations based on diversity revealed through morphologi-cal attributes and available marker data [33]. The overallfrequency of length polymorphism was found to be28.40% which is lower than reported in earlier studiesi.e. 50% [10], 81.3% [13] and 95% [11]. This can beattributed to use of only one wild species genotype inthis study unlike earlier studies. Occurrence of a verylow level of DNA polymorphism among pigeonpea culti-vars is not unexpected as several studies have documen-ted such results [33-35].As expected degree of marker polymorphism was
lower in intra-specific populations than in inter-specificmapping population (ICP 28 × ICPW 94). The fre-quency of marker polymorphism increased dramaticallywith SSR locus longer than 200 bp. PIC values for SSRmarkers were also analyzed in relation to repeat lengthand unit type. In terms of repeat length, Class I SSRswere more polymorphic as compared to the Class IISSRs which may be accounted to the hyper-variable nat-ure of Class I SSRs [20] Among different type of repeatunit classes, tetra-nucleotide repeats, in general, showedthe higher average PIC value (0.64) followed by di-nucleotide repeats (0.57). It was also observed thatamong tri-nucleotide repeat class, the ‘TAA’ repeatmotifs, displayed higher polymorphism (average PICvalue = 0.59). Similarly, ‘TA’ repeat motifs in di-nucleotide repeat class had a higher average PIC value(0.59) compared to the others. Similar trends were alsoobserved in other legumes such as chickpea [36], [16]and [37] where the SSR markers with repeat motifs‘TAA’ or ‘TA’ exhibited extensive abundance and poly-morphism as well. Higher average PIC value of com-pound SSRs (0.58) can be attributed to the fact thatthe markers with compound SSRs have more than oneSSR motif, which increases their chance to be poly-morphic [9].This study provides a list of polymorphic markers for
different mapping populations that segregate for a num-ber of important traits like Fusarium wilt (FW), sterlitymosaic disease (SMD), fertility restorer (Rf) etc. that areimportant for pigeonpea improvement [38]. Genotypingof these mapping populations with identified poly-morphic markers together with phenotyping data shouldprovide the markers associated with QTLs (quantitativetrait loci)/gene(s) for trait of interest that can be used
for enhancing the breeding efficiency through marker-assisted selection.To develop a reference genetic map, an inter-specific
cross was used so that a larger number of segregatingloci can be integrated into the genetic map. Usually SSRmarkers are co-dominant and follow Mendelian inheri-tance [39]. However deviation from the expected segre-gation ratio for SSR markers is not an uncommonfeature in inter-specific crosses and especially F2 popula-tion. Significant distortion observed in the marker datamay be attributed to several possible reasons such as theabortion of male or female gametes or the selectiveexclusion of a particular gametic genotype from fertiliza-tion, owing to incompatibility, incongruity, certation, orzygote selection [40]. Percentage distortion observed inthe present study is comparable with previously reportedstudies performed on inter-specific crosses [41].In the present study, the genetic map derived from an
inter-specific cross ICP 28 × ICPW 94 included elevendiscrete linkage groups corresponding to the basic chro-mosome number of the genus (x = 11). Initial construc-tion of a skeletal map with un-skewed markers andfollowed by integration of distorted markers helped inminimizing the possibility for spurious assignments ofmarkers [42]. The final map comprised of 239 markerloci with a total map length of 930.90 cM having aver-age spacing of 3.8 cM between two marker loci. This isthe first report on the construction of SSR-based geneticmap in pigeonpea. Therefore this map should serve as a‘reference map’ for other future genetic maps of pigeon-pea. Moreover as the SSR markers are derived from theBAC-end sequences, these markers and the map shouldbe very useful resource for linking the genetic map witha ‘future’ physical map of pigeonpea [38].Developed set of large number of SSR markers should
be very useful for applied aspects of genetics and breed-ing in pigeonpea, especially when the cultivated genepool has a narrow genetic diversity. In case of pigeon-pea, CMS- hybrid technology is becoming popular totackle the low crop productivity [5]. For assessing thegenetic purity of hybrids, in general, grow out test(GOT) based on morphological criteria is used. How-ever, GOT is limited by the accuracy, time and labourcost [43]. In this context, for each of two hybrids (ICPH2671 and ICPH 2438), a set of 42 markers has beenidentified that can be used for purity assessment ofhybrid seeds. SSR markers have been found very effec-tive for determining hybrid purity in many species likerice [44], maize [45] and cotton [46]. In fact in case ofICPH 2438 hybrid, two diagnostic SSR markers wereidentified for purity assessment in an earlier study also[21]. Although some studies report suitability of evenone marker for hybrid purity assessment test [43,47,48].This study increases the diagnostic markers in large
Bohra et al. BMC Plant Biology 2011, 11:56http://www.biomedcentral.com/1471-2229/11/56
Page 11 of 15
number for ICPH 2438 and also identifies a set of diag-nostic markers for another pigeonpea hybrid ICPH2671. Moreover identification of different markergroups, especially the group of common markers(CcM0257, CcM1559, CcM1825 and CcM1895) for bothhybrids, for undertaking multiplex assays provides anadded value to enhance their utility for hybrid purityassessment.
ConclusionIn summary this study reports a large-scale developmentof SSR markers and construction of SSR based geneticmap in pigeonpea for the first time. In addition, a largenumber of informative SSR markers that can be used inmultiplexes for assessing the seed purity of two hybrids.It is anticipated that SSR markers and the genetic mapreported in this study should provide a referenceresource for construction and comparison of geneticmaps for new mapping populations, finger printing andcultivar identification, assessment of genetic diversityand gene flow among Cajanus species. New geneticmaps, to be devloped based on polymorphic markersidentified in this study, will facilitate trait mapping andmarker assisted selection. Furthermore, genomic SSRmarkers identified from BESs and integrated into geneticmaps provide a valuable resource for anchoring futurephysical map or whole genome sequence to the geneticmap.
MethodsPlant material and DNA extractionTwo pigeonpea genotypes namely ICP 28 and ICPL87119 ("Asha”) were employed for checking the amplifi-cation of SSR loci with newly designed primer pairs.To identify informative set of SSR markers, a set of 22genotypes was utilized for screening the polymorphism(Table 2). These genotypes represent parents of 13 map-ping populations which are segregating for various agro-nomical important traits.A F2 population of 79 individuals derived from an
inter-specific cross of ICP 28 (Cajanus cajan accession)and ICPW 94 (Cajanus scarabaeoides accession) wasused for development of a genetic map.For assessment of genetic purity of hybrids ICPH 2438
and ICPH 2671, a set of 183 and 174 seeds of two cytoplas-mic-nuclear male-sterility (CMS) based hybrids (obtainedfrom ICRISAT) were used respectively. Total genomicDNA from leaf tissue was isolated and purified accordingto protocol provided by Cuc and colleagues [49].
BAC-end sequence (BES) dataTwo BAC libraries were constructed by using HindIIIand BamHI restriction enzymes. The HindIII library wascomposed of 34,560 clones with an estimated average
insert size of 120,000 bp, while the BamHI library wascomposed of 34,560 clones with an estimated averageinsert size of 115,000 bp. These clones collectivelyrepresented ~11× coverage of the pigeonpea genome. Atotal of 50,000 BAC clones were attempted for end-sequencing. BAC clones were inoculated into LuriaBroth (LB) media containing appropriate antibiotic(chloramphenicol or kanamycin) and incubated in ashaking incubator. BAC-DNA was purified by alkalinelysis solutions. Big dye terminator chemistry was used toend sequence the BAC clones. Post reaction removal ofexcess dye was performed using a Sephadex G50 mini-column filter plate method. Sequences were analyzedwith an automated sequencer. Base calling and sequencetrimming were performed with PHRED software [50].The PHRED output was converted into FASTA formatand vector sequences were masked. Terminal vectorsequences were then trimmed and BESs shorter than100 bp were discarded and the remaining 88,860 BESswere then used for mining of SSRs.
Mining of SSRsBESs were used for mining the SSRs using Perl basedMIcroSAtellite (MISA) http://pgrc.ipk-gatersleben.de/misa[19] search module which is capable of identifyingperfect as well as compound SSRs. All BESs with aminimum size of 100 bp were arranged in a single textfile in FASTA format and this file was used as an inputfor MISA. The criteria used for the identification of trueSSRs included minimum ten repeats for mono (N)-, sixrepeats for di (NN)- and five repeats for tri (NNN)-,tetra (NNNN)-, penta (NNNNN)- and hexa (NNNNNN)- nucleotide repeat units. Two SSRs separated bymaximum 100 nucleotide bases were considered as partof a compound SSR. Sequence complementarity wasconsidered while classifying identified SSRs under differ-ent classes.
Primer designingFor generating the genetic markers, redundancy in theidentified SSRs from BESs was taken into account. Clus-ter analysis was done on the BESs to identify non-redundant sequences. In general, one SSR containingBES was selected from each cluster for designing theprimer pairs.Designing of primer pairs for identified SSRs was
done by using standalone Primer3 http://frodo.wi.mit.edu/ program using MISA generated Primer3 input file[19]. The criteria used for designing primer pairsincluded annealing tempeature (Tm) range of 57°C -60°C with an average of 59°C, amplicon size 100 - 280bp, primer length 20 ± 5 bp and GC% 50 ± 5. M13dye labeled primer pairs were synthesized for theselected SSRs.
Bohra et al. BMC Plant Biology 2011, 11:56http://www.biomedcentral.com/1471-2229/11/56
Page 12 of 15

Amplification and separation of SSR lociPolymerase chain reactions (PCRs) for amplification ofSSR loci were performed in a 5 μl reaction volume [0.5 μlof 10× PCR buffer, 1.0 μl of 15 mM MgCl2, 0.25 μl of2 mM dNTPs, 0.50 μl of 2 pM/μl primer anchored withM13-tail (MWG-Biotech AG, Bangalore, India), 0.1 U ofTaq polymerase (Bioline, London, UK), and 1.0 μl(5 ng/μl) of template DNA] in 96-well micro titre plate(ABgene, Rockford, IL, USA) using thermal cycler Gen-eAmp PCR System 9700 (Applied Biosystems, Foster City,CA, USA). A touch down PCR programme was used toamplify the DNA fragments: initial denaturation was for 5min at 95°C followed by 5 cycles of denaturation for20 sec at 94°C, annealing for 20 sec at 60°C (the annealingtemperature for each cycle being reduced by 1°C percycle) and extension for 30 sec at 72°C. Subsequently,35 cycles of denaturation at 94°C for 20 sec followed byannealing for 20 sec at 56°C and extension for 30 sec at72°C and 20 min of final extension at 72°C. PCR productswere checked for amplification on 1.2% agarose gel.Separation of amplified products on capillary electrophor-esis using GeneMapper software version 4.0 (Applied Bio-systems, Foster City, CA, USA) was undertaken.
Polymorphism information content (PIC)PIC value of all polymorphic SSR markers was calcu-lated as follows [51]
PIC = 1 −k∑
i=1
P2i
where k is the total number of alleles detected for agiven marker locus and Pi is the frequency of the ith
allele in the set of genotypes investigated.
Linkage mappingSegregation data obtained for polymorphic SSR markerson the F2 population were used for linkage mapping.Due to segregation distortion for some SSR loci, initiallya framework genetic map was prepared with normallysegregating markers at logarithm of odds (LOD) of 5with a minimum recombination threshold of 37.5 usingMAPMAKER/EXP 3.0 [52]. Initially ‘Group’ commandwas used to group markers in various linkage groups.Then ‘Compare’ and ‘Try’ commands were used tolocate the SSR markers within each linkage group. Theordered marker sequences were confirmed by the ‘Rip-ple’ command and finally the linkage groups were gen-erated by ‘Map’ command. Kosambi mapping functionwas used to convert recombination frequency into mapdistances [53]. The whole data set was then analyzedwith the help of JoinMap 3.0 software [54]. Linkagegroups were established at LOD ≥ 3 with other para-meters like recombination threshold of 0.40, ripple value
of 1 and jump threshold of 5. The framework maporder was fixed as ‘anchor’ using ‘fixed order’ commandand all the remaining markers including the distortedones were integrated because with JoinMap, the risk oferrors in the placement of distorted markers to a linkagegroup are minimized [55]. Final linkage maps weredrawn with the help of Mapchart version 2.2 [56].
Hybrid purity assessmentDNA extraction and PCR amplification of each seed ofhybrids was done as described previously. SSR alleledata for the hybrid seeds was recorded as “A” [allele ofmale- sterile parent (A- line)], “B” [allele of fertilityrestorer parent (R- line)] and “H” (alleles from both theparents “Hybrid”) format. Purity index for each markerwas calculated using scored data by applying the follow-ing formula:
Purity index (%) =Number of true hybrids (containing alleles of both the parents)
Total number of hybrid seeds tested×100
Additional material
Additional file 1: List of newly developed SSR markers isolatedfrom BESs of pigeonpea. List of newly developed BES-SSRs providingdetails on corresponding GenBank ID, SSR motif, primer sequences,product size and amplification status.
Additional file 2: Polymorphism status of SSR markers tested on 22parental genotypes. Detailed information on markers, exhibitingpolymorphism in at least one parental combination, along with their SSRmotifs, number of alleles and PIC values.
Additional file 3: Purity index of polymorphic SSR markers onpigeonpea hybrid ICPH 2671 individuals. List of polymorphic markersbetween parental lines (ICPA 2043 and ICPR 2671) and correspondingpurity percentage of designated hybrid.
Additional file 4: Purity index of polymorphic SSR markers onpigeonpea hybrid ICPH 2438 individuals. List of polymorphic markersbetween hybrid parents (ICPA 2039 and ICPR 2438) and percentage ofpurity assessed by these markers in designated hybrids.
AbbreviationsBAC: Bacterial artificial chromosome; BESs: BAC-end sequences; SSRs: Simplesequence repeats; PCRs: Polymerase chain reactions;PIC: Polymorphisminformation content; QTLs: Quantitative trait loci; CMS: Cytoplasmic-nuclearmale-sterility
AcknowledgementsAuthors are thankful to Indo-US Agricultural Knowledge Initiative (Indo-USAKI) of Indian Council of Agricultural Research (ICAR), National ScienceFoundation (NSF), USA and Generation Challenge Programme of CGIAR forsupporting this research. Thanks are also due to Mr Abdul Gafoor, Mr SRamesh and Ms K Himabindu for their excellent technical support.
Author details1International Crops Research Institute for the Semi-Arid Tropics (ICRISAT),Patancheru, Hyderabad, 502324, India. 2Department of Genetics, OsmaniaUniversity, Hyderabad 500007, India. 3Department of Biotechnology andBioinformatics Centre, Barkatullah University, Bhopal 462026, India.
Bohra et al. BMC Plant Biology 2011, 11:56http://www.biomedcentral.com/1471-2229/11/56
Page 13 of 15

4Department of Plant Pathology, University of California, Davis, CA 95616,USA. 5Department of Biotechnology, University of Agricultural Sciences(UAS), Bangalore 560065, India. 6Department of Plant Breeding and Genetics,CCS Haryana Agricultural University (CCSHAU), Hisar 125004, India. 7NationalCenter for Genome Resources (NCGR), Santa Fe, N M 87505, USA. 8NationalResearch Center on Plant Biotechnology (NRCPB), New Delhi 110012, India.9J. Craig Venter Institute (JCVI), Rockville, MD 20850, USA. 10GenerationChallenge Programme (GCP), c/o CIMMYT, 06600 Mexico DF, Mexico.
Authors’ contributionsAB and AD conducted SSR genetic mapping experiments, analyzed data andparticipated in preparing the first draft of the manuscript; GS and NKparticipated in marker polymorphism experiments, RK, KN, KBS, SR wereengaged in hybrid purity testing experiments; RVP, ADF, CDT, GDM, DRCand RKV contributed to construction of BAC-libraries, sequencing the BAC-ends and BES anaysis; HDU generated the mapping population; RG, DS, PBK,NKS, HDU, CDT, GDM together with DRC and RKV participated in dataanalysis and interepreting the results; RKV and DRC conceived this study,planned experiments and, together with AB and AD, finalized themanuscript. All authors have read the manuscript.
Received: 5 December 2010 Accepted: 29 March 2011Published: 29 March 2011
References1. Greilhuber J, Obermayer R: Genome size variation in Cajanus cajan
(Fabaceae): a reconsideration. Plant Syst Evol 1998, 212:135-141.2. van der Maesen LJG: Pigeonpea: origin, history, evolution and taxonomy.
In Pigeonpea. Edited by: Nene YL, Hall SD, Sheila VK. Wallingford: CABInternational; 1990:15-46.
3. Reddy LJ, Faris DG: A cytoplasmic male sterile line in pigeonpea.International Pigeonpea Newslett 1981, 1:16-17.
4. Marley PS, Hillocks RJ: Effect of root-knot nematodes (Meloidogyne spp.)on Fusarium wilt in pigeonpea (Cajanus cajan). Field Crop Res 1996,46:15-20.
5. Saxena KB, Sultana R, Mallikarjuna N, Saxena RK, Kumar RV,Sawargaonkar SL, Varshney RK: Male-sterility systems in pigeonpea andtheir role in enhancing yield. Plant Breed 2010, 129:125-134.
6. Varshney RK, Hoisington DA, Tyagi AK: Advences in cereal genomics andapplications in crop breeding. Trends Biotechnol 2006, 24:490-499.
7. Varshney RK, Thudi M, May GD, Jackson SA: Legume genomics andbreeding. Plant Breed Rev 2010, 33:257-304.
8. Jones N, Ougham H, Thomas H, Pasakinskiene I: Markers and mappingrevisited: finding your gene. New Phytol 2009, 183:935-966.
9. Gupta PK, Varshney RK: The development and use of microsatellitemarkers for genetic analysis and plant breeding with emphasis onbread wheat. Euphytica 2000, 113:163-185.
10. Burns MJ, Edwards KJ, Newbury HJ, Ford-Lloyd BR, Baggot CD:Development of simple sequence repeat (SSR) markers for theassessment of gene flow and genetic diversity in pigeonpea (Cajanuscajan). Mol Ecol Notes 2001, 1:283-285.
11. Odeny DA, Jayashree B, Ferguson M, Hoisington D, Cry LJ, Gebhardt C:Development, characterization and utilization of microsatellite markersin pigeonpea. Plant Breed 2007, 126:130-136.
12. Odeny DA, Jayashree B, Gebhardt C, Crouch J: New microsatellitemarkers for pigeonpea (Cajanus cajan (L.) Millsp.). BMC Research Notes2009, 2:35.
13. Saxena RK, Prathima C, Saxena KB, Hoisington DA, Singh NK, Varshney RK:Novel SSR markers for polymorphism detection in pigeonpea (Cajanusspp.). Plant Breed 2010, 129:142-148.
14. Varshney RK, Graner A, Sorrells ME: Genic microsatellite markers in plants:features and applications. Trends Biotechnol 2005, 23:48-55.
15. Varshney RK, Nayak SN, May GD, Jackson SA: Next generation sequencingtechnologies and their implications for crop genetics and breeding.Trends Biotechnol 2009, 27:522-530.
16. Mun JH, Kim DJ, Choi HK, Gish J, Debelle F, Mudge J, Denny R, Endre G,Saurat O, Dudez AM, Kiss GB, Roe B, Young ND, Cook D: Distribution ofmicrosatellites in the genome of Medicago truncatula: a resource ofgenetic markers that integrate genetic and physical maps. Genetics 2006,172:2541-2555.
17. Shultz JL, Samreen K, Rabia B, Jawaad AA, Lightfoot DA: The developmentof BAC-end sequence-based microsatellite markers and placement inthe physical and genetic maps of soybean. Theor Appl Genet 2007,114:1081-1090.
18. Schlueter JA, Lin JY, Schlueter SD, Vasylenko SIF, Deshpande S, Yi J,O’Bleness M, Roe BA, Nelson RT, Scheffler BE, Jackson SA, Shoemaker RC:Gene duplication and paleopolyploidy in soybean and the implicationsfor whole genome sequencing. BMC Genomics 2007, 8:330.
19. Varshney RK, Thiel T, Stein N, Langridge P, Graner A: In silico analysis onfrequency and distribution of microsatellites in ESTs of some cerealspecies. Cell Mol Biol Lett 2002, 7:537-546.
20. Temnykh S, DeClerck G, Lukashova A, Lipovich L, Cartinhour S, McCouch S:Computational and experimental analysis of microsatellites in rice (Oryzasativa L.): frequency, length variation, transposon associations, andgenetic marker potential. Genome Res 2001, 11:1441-1452.
21. Saxena RK, Saxena KB, Varshney RK: Application of SSR markers formolecular characterization of hybrid parents and purity assessment ofICPH 2438 hybrid of pigeonpea [Cajanus cajan (L.) Millspaugh]. Mol Breed2010, 26:371-380.
22. Saxena KB: Genetic improvement of pigeonpea-a review. Trop Plant Biol2008, 1:159-178.
23. Schlueter JA, Goicoechea JL, Collura K, Gill N, Lin JY, Yu Y, Vallejos E,Munoz M, Blair MW, Tohme J, Tomkins J, McClean P, Wing R,Jackson SA: BAC-end sequence analysis and a draft physical map ofthe common bean (Phaseolus vulgaris L.) genome. Trop Plant Biol2008, 1:40-48.
24. Budiman MA, Mao L, Wood TC, Wing RA: A deep coverage tomato BAClibrary and prospects toward development of an STC framework forgenome sequencing. Genome Res 2000, 10:129-136.
25. Lai CW, Yu Q, Hou S, Skelton RL, Jones MR, Lewis KL, Murray J, Eustice M,Guan P, Agbayani R, Moore PH, Ming R, Presting GG: Analysis of papayaBAC end sequences reveals first insights into the organization of a fruittree genome. Mol Genet Genomics 2006, 276:1-12.
26. Cheung F, Town CD: A BAC end view of the Musa acuminata genome.BMC Plant Biol 2007, 7:29.
27. Terol JM, Naranjo A, Ollitrault P, Talon M: Development of genomicresources for Citrus clementina: characterization of three deep-coverageBAC libraries and analysis of 46,000 BAC end sequences. BMC Genomics2008, 9:423.
28. Han Y, Korban SS: An overview of the apple genome through BAC endsequence analysis. Plant Mol Biol 2008, 67:581-588.
29. Hong CP, Piao ZY, Kang TW, Batley J, Yang TJ, Hur YK, Bhak J, Park BS,Edwards D, Lim YP: Genomic distribution of simple sequence repeats inBrassica rapa. Mol Cells 2007, 23:3 49-356.
30. Cardle L, Ramsay L, Milbourne D, Macaulay M, Marshall D, Waugh R:Characterization of physically clustered simple sequence repeats inplants. Genetics 2000, 156:847-854.
31. Morgante M, Hanafey M, Powell W: Microsatellites are preferentiallyassociated with nonrepetitive DNA in plant genomes. Nat Genet 2002,30:194-200.
32. Eustice M, Yu Q, Lai CW, Hou S, Thimmapuram J, Liu L, Alam M, Moore PH,Presting GG, Ming R: Development and application of microsatellitemarkers for genomic analysis of papaya. Tree Genet Genomes 2008,4:333-341.
33. Saxena RK, Saxena KB, Kumar RV, Hoisington DA, Varshney RK: Simplesequence repeat-based diversity in elite pigeonpea genotypes fordeveloping mapping populations to map resistance to Fusarium wiltand sterility mosaic disease. Plant Breed 2010, 129:135-141.
34. Sivaramakrishnan S, Seetha K, Rao AN, Singh L: RFLP analysis ofcytoplasmic male sterile lines in Pigeonpea (Cajanus cajan L. Millsp.).Euphytica 1997, 126:293-299.
35. Yang S, Pang W, Harper J, Carling J, Wenzl P, Huttner E, Zong X, Kilian A:Low level of genetic diversity in cultivated pigeonpea compared to itswild relatives is revealed by diversity arrays technology (DArT). TheorAppl Genet 2006, 113:585-595.
36. Nayak SN, Zhu H, Varghese N, Datta S, Choi H, Horres R, Jungling R, Singh J,Kavi Kishor PB, Sivaramakrishnan S, Hoisington DA, Kahl G, Winter P,Cook DR, Varshney RK: Integration of novel SSR and gene-based SNPmarker loci in the chickpea genetic map and establishment of newanchor points with Medicago truncatula genome. Theor Appl Genet 2010,120:1415-1441.
Bohra et al. BMC Plant Biology 2011, 11:56http://www.biomedcentral.com/1471-2229/11/56
Page 14 of 15

37. Cordoba JM, Chavarro C, Schlueter JA, Jackson SA, Blair MW: Integration ofphysical and genetic maps of common bean through BAC-derivedmicrosatellite markers. BMC Genomics 2010, 11:436.
38. Varshney RK, Penmetsa RV, Dutta S, Kulwal PL, Saxena RK, Datta S,Sharma TR, Rosen B, Carrasquilla-Garcia N, Farmer AD, Dubey A, Saxena KB,Gao J, Fakrudin B, Singh MN, Singh BP, Wanjari KB, Yuan M, Srivastava RK,Kilian A, Upadhyaya HD, Mallikarjuna N, Town CD, Bruening GE, He G,May GD, McCombie R, Jackson SA, Singh NK, Cook DR: Pigeonpeagenomics initiative (PGI): an international effort to improve cropproductivity of pigeonpea (Cajanus cajan L.). Mol Breed 2010, 26:393-408.
39. Beckmann JS, Soller M: Toward a unified approach to genetic mapping ofeukaryotes based on sequence tagged microsatellite sites. Nat Biotechnol1990, 8:930-932.
40. Kreike CM, Stiekema WJ: Reduced recombination and distortedsegregation in a Solanum tuberosum (2x) × S. spegazzinii (2x) hybrid.Genome 1997, 40:180-187.
41. Kianian SF, Quiros CF: Generation of a Brassica oleracea composite RFLPmap: linkage arrangements among various populations andevolutionary implications. Theor Appl Genet 1992, 84:544-554.
42. Elangovan M, Rai R, Dholakia BB, Lagu MD, Tiwari R, Gupta RK, Rao VS,Roder MS, Gupta VS: Molecular genetic mapping of quantitative trait lociassociated with loaf volume in hexaploid wheat (Triticum aestivum). JCereal Sci 2008, 47:587-598.
43. Yashitola J, Thirumurugan T, Sundaram RM, Naseerullah MK, Ramesha MS,Sarma NP, Stone RV: Assessment of purity of rice hybrids usingmicrosatellite and STS markers. Crop Sci 2002, 42:1369-1373.
44. Sundaram RM, Naveenkumar B, Biradar SK, Balachandran SM, Mishra B,IlyasAhmed M, Viraktamath BC, Ramesha MS, Sharma NP: Identification ofinformative SSR markers capable of distinguishing hybrid rice parentallines and their utilization in seed purity assessment. Euphytica 2008,163:215-224.
45. Asif M, Rahman MU, Zafar Y: Genotyping analysis of six maize (Zea maysL.) hybrid using DNA fingerprinting technology. Pakistan J Bot 2006,38:1425-1430.
46. Ali MA, Seyal MT, Awan SI, Niaz S, Ali S, Abbas A: Hybrid authentication inupland cotton through RAPD analysis. Aust J Crop Sci 2008, 2:141-149.
47. Mishra GP, Singh RK, Mohapatra T, Singh AK, Prabhu KV, Zaman FU,Sharma RK: Molecular mapping of gene for fertility restoration of wildabortive (WA) cytoplasmic male sterility using a basmati rice restorerline. J Plant Biochem Biot 2003, 12:37-42.
48. Nandakumar N, Singh AK, Sharma RK, Mohapatra T, Prabhu KV, Zaman FU:Molecular fingerprinting of hybrids and assessment of genetic purity ofhybrid seeds in rice using microsatellite markers. Euphytica 2004,136:257-264.
49. Cuc LM, Mace ES, Crouch JH, Quang VD, Long TD, Varshney RK: Isolationand characterization of novel microsatellite markers and theirapplication for diversity assessment in cultivated groundnut (Arachishypogaea). BMC Plant Biol 2008, 8:55.
50. Ewing B, Green P: Base-calling of automated sequencer traces usingPhred. II. Error probabilities. Genome Res 1998, 8:186-194.
51. Anderson JA, Churchill GA, Sutrique JE, Tanksley SD, Sorrells ME: Optimizingparental selection for genetic linkage maps. Genome 1993, 36:181-186.
52. Lander ES, Green P, Abrahamson J, Barlow A, Daly MJ, Lincoln SE,Newburg L: MAPMAKER: an interactive computer package forconstructing primary genetic linkage maps of experimental and naturalpopulations. Genomics 1987, 1:174-181.
53. Kosambi DD: The estimation of map distance from recombination values.Ann Eugen 1944, 12:172-175.
54. Van Ooijen JW, Voorrips RE: JoinMap 3.0, software for the calculation ofgenetic linkage maps. Plant Research International Wageningen, TheNetherlands 2001.
55. Dettori MT, Quarta R, Verde I: A peach linkage map integrating RFLPs,SSRs, RAPDs and morphological markers. Genome 2001, 44:783-790.
56. Voorrips RE: MapChart: software for the graphical presentation of linkagemaps and QTLs. J Hered 2002, 93:77-78.
doi:10.1186/1471-2229-11-56Cite this article as: Bohra et al.: Analysis of BAC-end sequences (BESs)and development of BES-SSR markers for genetic mapping and hybridpurity assessment in pigeonpea (Cajanus spp.). BMC Plant Biology 201111:56.
Submit your next manuscript to BioMed Centraland take full advantage of:
• Convenient online submission
• Thorough peer review
• No space constraints or color figure charges
• Immediate publication on acceptance
• Inclusion in PubMed, CAS, Scopus and Google Scholar
• Research which is freely available for redistribution
Submit your manuscript at www.biomedcentral.com/submit
Bohra et al. BMC Plant Biology 2011, 11:56http://www.biomedcentral.com/1471-2229/11/56
Page 15 of 15

BioMed Central publishes under the Creative Commons Attribution License (CCAL). Under the CCAL, authors
retain copyright to the article but users are allowed to download, reprint, distribute and /or copy articles in
BioMed Central journals, as long as the original work is properly cited.