Embed Size (px)
Citation preview

Analysis of Bench Crest Performance at the Yellowstone Mine: A Case Study
J. Whyatt1, M. MacLaughlin2 and S. Miller3
A case study is presented that relates statistical descriptions of joint sets to the distribution of local wedge failures along the crest of a catch bench at the Yellowstone Talc Mine. The fracture sets and bench width were mapped by teams of geological engineering students from Montana Tech under the direction of Dr. Mary MacLaughlin. The students analyzed the fracture data, conducted physical property tests, and used a beta version of a NIOSH program “Bwedge” to predict the distribution of surviving bench widths. In the course of this analysis the students developed evidence of software performance issues that, unfortunately, frustrated their analysis. These have now been addressed and a full analysis completed. The analysis confirms the validity of the student mapping program and provides insight into the effects of blasting and excavation practices on the bench. It also provides a tool for exploring the pattern of bench crest failure that would result from variations in both bench geometry and blasting practices.
I. Introduction This study was undertaken to demonstrate use of the Bwedge computer program in evaluation of bench crest failures in a mine pit slope. The Bwedge program provides a statistical estimate of wedge failures along the length of a bench crest. Results are expressed as a probability of retaining various usable bench widths. The effort included collection and analysis of geologic data, comparison of expected and observed bench crest performance, and sensitivity studies of fracture and bench design parameters. The initial phase of the study was conducted by a group of students in a graduate level slope design class at Montana Tech in cooperation with Luzenac America’s Yellowstone Mine and the National Institute for Occupational Safety and Health (NIOSH). The students discovered a number of flaws in a beta version of Bwedge. These flaws have been addressed and the study completed.
II. North Bench, Yellowstone Mine Luzenac America’s Yellowstone Mine is located southwest of Ennis, Montana along the east slope of the Ruby Mountain Range. Mining is conducted using two open pits approximately 90 m (300 ft) deep. The study focused on a 90 m (300 ft) section of a single bench within the north wall of the south pit in hydrothermally-altered dolomite of Precambrian age. This rock is overlain by Tertiary age Huckleberry ridge tuff. Severe fracturing of the dolomite appears to form at least four major sets (figure 1). Fractures are likely related, at least in part, to movement along a major fault that runs through the pit, striking N-NW with near vertical dip. This fault lies adjacent to the west end of the study scan line. The rock mass was classified as “Fair” for the RMR and “Very Poor” for the “Q” system (Appendix A). 1. Mining Engineer, Spokane Research Lab, NIOSH; email – [email protected] 2. Associate Professor, Geological Engineering, Montana Tech of the University of Montana 3. Professor, Geological Engineering, University of Idaho

Figure 1: Fractured rock on a bench face. The overall slope angle of the north wall was measured by Brunton compass at roughly 40°. Benches are 7.6 m (25 ft) high with an estimated intact bench width of 5.5 m (18 ft) and bench face dip of 62°. However, the students found that the bench crest was intact at only a handful of locations along the study bench section (figure 2). Widths measured along the study bench are plotted in figure 3. Narrower sections of bench were caused primarily by wedge failures of various sizes along the bench crest (figure 4). Wedges were formed by, and have slid upon, pre-existing fracture planes.
Figure 2: Students measuring the bench width and idealized cross section.
Base of Bench Face 4 m Wide
62°
Catch Bench 5.5 m Wide
Bench Crest Failure

Bench Width by Chainage
0
1
2
3
4
5
6
0 15 30 45 60 75 90
Location along study bench (m)
Ben
ch W
idth
(m)
measured
intact
Figure 3: A plot of measured bench widths by distance along the mapped section of the study bench.
Figure 4: Idealized wedge geometry showing left and right fracture planes.

A. Fracture Geometry Five representative wedge failures were mapped and described by Mike Cerino, the mine geologist. Descriptions included fracture orientations and conditions. Three of these wedges had clearly moved, but not by much. Remnants of two other wedges, that had failed completely, were not present. Examples of disturbed and failed wedges are described in Appendix C. Blast fractures and (apparently) blast-crushed caliche fracture infilling were noted near the bench face. Mr. Cerino interpreted these observations as evidence that “blasting released wedges that otherwise would have remained stable…” He mapped the apex of each of these steeply plunging wedges in the bench face and found they daylighted at distances of 4.3 m (14 ft), 6.1 m (20 ft), 6.7 m (22 ft), 4.6 m (15 ft) and 6.1 m (20 ft) below the bench crest (i.e. just above the next bench which is 7.6 m (25 ft) below the crest). In addition, he noted a number of potential wedges that do not daylight in the bench face (being steeper than the face). Two sets of fractures delineating these and similar wedges were mapped by student teams along a 90- m (300-ft) long scan line on the study bench, using tape and Brunton compass. The first of these fracture sets was labeled the “foliation” set. This set lies parallel to rock foliation with an average orientation of 018°/72° SE (strike/dip) and forms the left side of wedges (figure 4). The second and sparser of the sets is the “joint” set. It has an average orientation of 124°/52° SW (strike/dip) and forms the right side of these wedges. Line mapping fracture data for these sets is included as Appendices D and E, and individual fracture poles for these sets are plotted in figure 5. The highly fractured nature of the rock (including two other fracture sets that did not contribute to wedge failure) made mapping and discrimination of fractures sets difficult.
Figure 5: Stereonet plot of joint poles, joint set average orientations and pit slope.

A first cut analysis of wedge stability was developed as shown in figure 5. Bench slope, average fracture-set orientations and the wedge formed by “average” fractures were plotted to show that the wedge formed by set “average” fractures daylights in the bench face. The plunge of the fracture set intersection beneath this wedge was found to be steeper than a 35° friction angle circle, a typical joint friction angle. Thus, failure of such a wedge is likely. Plane failure on the joint set is also possible but its apparent dip in the bench cross section is flatter than the plunge of the wedge fracture plane intersection. Thus, wedge failure will be preferred where both are possible. This tendency is evident in the predominance of wedge failures observed in the field.
B. Fracture Strength and Rock Density A number of rock samples collected during the field mapping effort were tested to determine frictional strength of the fractures and rock density. Tilt tests of friction angle were conducted in the field using rock fragments found along the bench. These tests showed natural fractures had an average friction angle of 38.7°. Samples were also taken to the lab and cut to determine the friction angle of saw-cut surfaces. Laboratory tests on these surfaces showed an average friction angle of 30.7° (ranging 25° to 34°). Complete results from the field and lab tilt tests can be found in Appendix B. Rock samples were also taken back to the laboratory for density tests. The average density, based on tests on three rock fragments, was 2.76 grams per cubic centimeter. Results from individual density tests can be also be found in Appendix B.
III. Fracture Set Characteristics The characteristics of each fracture set have to be described statistically and geostatistically for analysis by the Bwedge program. The students developed a full set of parameters from the mapped fractures. These parameters describe the variability of fracture dip direction, dip, spacing, persistence and waviness. The defined fracture sets were not ideal for this purpose, including a wider range of orientations and fewer fractures (especially for the joint set) than would be desired for a full-blown characterization study. However, the data was sufficient for the students to estimate all the required parameters. These values are listed in Table 1. Table 1a: Foliation Joint Set Characteristics Parameter Mean Std. Dev. Nugget Range Dip Direction (deg) 108.7 11.70 80.00 16.56 Dip (deg) 72.35 8.35 62.08 18.92 Persistence (m) 2.63 1.82 2.54 17.62 Spacing (m) 1.16 1.21 1.05 6.20 Waviness (deg) Minimum - 1.0 Maximum – 12.0

Table 1b: Joint Set Characteristics Parameter Mean Std. Dev. Nugget Range Dip Direction (deg) 214.8 18.44 247.93 4.78 Dip (deg) 51.80 13.87 148.66 4.72 Persistence (m) 3.81 3.07 5.05 6.38 Spacing (m) 1.89 2.13 2.62 5.27 Waviness (deg) Minimum - 0.0 Maximum – 22.0
IV. Bwedge Analysis Initial Bwedge analyses run by the students failed to match results observed in the field and crashed the program for particular ranges of parameters. Identification of these problems led to discovery and elimination of a number of flaws in Bwedge. The analysis was then repeated, using the student-developed set of input parameters. Results for these input values overestimated retention of the bench crest, but correctly matched retention of portions of the bench further from the crest (figure 6). This result is surprisingly good, especially considering that it does not consider extensive disruption of the outer portion of the bench by blasting noted by Mike Cerino.
Figure 6. Estimated probability of stability at various depths into the bench crest based on (1) measurements, (2) a model using the student set of fracture parameters and (3) a set of weakened parameters.
Depth of Bench Failure
0 10 20 30 40 50 60 70 80 90
100
0 1 2 3 4 5 Distance from Crest (m)
Measured Student
weakened

An attempt was made to explore the effects of blasting on the bench model by weakening fracture strength. The friction angle was decreased from in situ to saw-cut values and the stabilizing influence of fracture waviness removed. Bwedge runs using these weaker values more closely fit observations for the outer bench, but also underestimate retention deeper into the bench – which is also more sheltered from blasting. This result suggests that the student set of parameters may well describe the fracturing in situ, prior to the influence of blasting. To the extent that this proves to be the case, the overall slope angle could be steepened, while preserving both bench face angle and effective bench width, through more careful blasting. If all blasting effects were removed, and a 90% probability of maintaining a minimum bench width was desired, benches could be narrowed by a full meter. The overall slope angle could be steepened by about 5°, to roughly 45°. Bwedge can also be used to explore how variations in bench face angle, bench height and initial bench width can influence the effective, usable width of resulting catch benches and the overall slope angle. For example, the depth of crest failure can be estimated for various bench face angles. Figure 7 is such a plot, developed with strong (intact) rock properties. As such, it is most relevant to considering steepening of the bench and the resulting extension of wedge failures deeper into the bench. Figure 8 is a similar plot for weakened (blast-impacted) properties relevant closer to the bench face.
Figure 7. Probability of stability estimated at various depths into the bench for various bench face angles. Curves for steepened slopes are, in sequence, below and to the right of the shaded interval which indicates the actual bench face angle. Curves were computed with Bwedge using the “strong” set of fracture properties.
Depth of Bench Failure by Bench Slope Angle - strong
0 10 20 30 40 50 60 70 80 90
100
0 1 2 3 4 5 Distance from Crest (m)
90 85 80 75 70 65 60 55 50 45 40 35 30

Figure 8. Plot of figure 7 recalculated for “weak” set of fracture properties. Given a desired surviving bench width, figures 7 and 8 can be used to estimate the additional bench width that should be developed to allow for local crest failures. That is, the design should consist of a “sacrificial” width that will likely fail, at least locally, and a deeper “protected” width that should have a high probability of survival as a functioning catch bench. Obviously, steepening the bench face increases the sacrificial width while cutting this angle back reduces it. However, it is clear from these figures that it is not possible to completely eliminate crest failure, only manage how much must be dealt with. For example, we can examine the current design for strong properties (figure 7) and a threshold probability of 90%. Recall that this chart is most relevant when failure extends into rock that is not weakened by blasting. For instance, when careful blasting practices are used or steepening of the bench face pushes failure deeper into the bench. With the current design, the sacrificial width is a little more than a meter. If the bench face were steepened to a vertical dip, the unreliable portion of bench width would increase to more than 3 m. The bench width would have to be increased by a similar amount to maintain the necessary catch bench width. The effect of bench face angle on the overall slope angle is determined by its effect on the total bench width or “footprint.” The footprint width of the bench can be broken into segments. The outermost segment underlies the bench slope. The middle segment underlies the sacrificial portion of bench width; that is, the width of bench likely to suffer crest failure. The remainder of the slope width is taken up by the protected (functional) width of the catch bench. Bench footprints can be calculated for a variety of face angles (and other parameters) and the results used to obtain an optimal overall slope angle. This tradeoff is illustrated for this case in figures 9 and 10. The absence of an inflection point in these curves shows that a vertical bench face is optimal, at least for the wedge bench crest failure mechanism.
Depth of Bench Failure by Bench Slope Angle - weak
0 10 20 30 40 50 60 70 80 90
100
0 1 2 3 4 5 Distance from Crest (m)
90 85 80 75 70 65 60 55 50 45 40 35 30
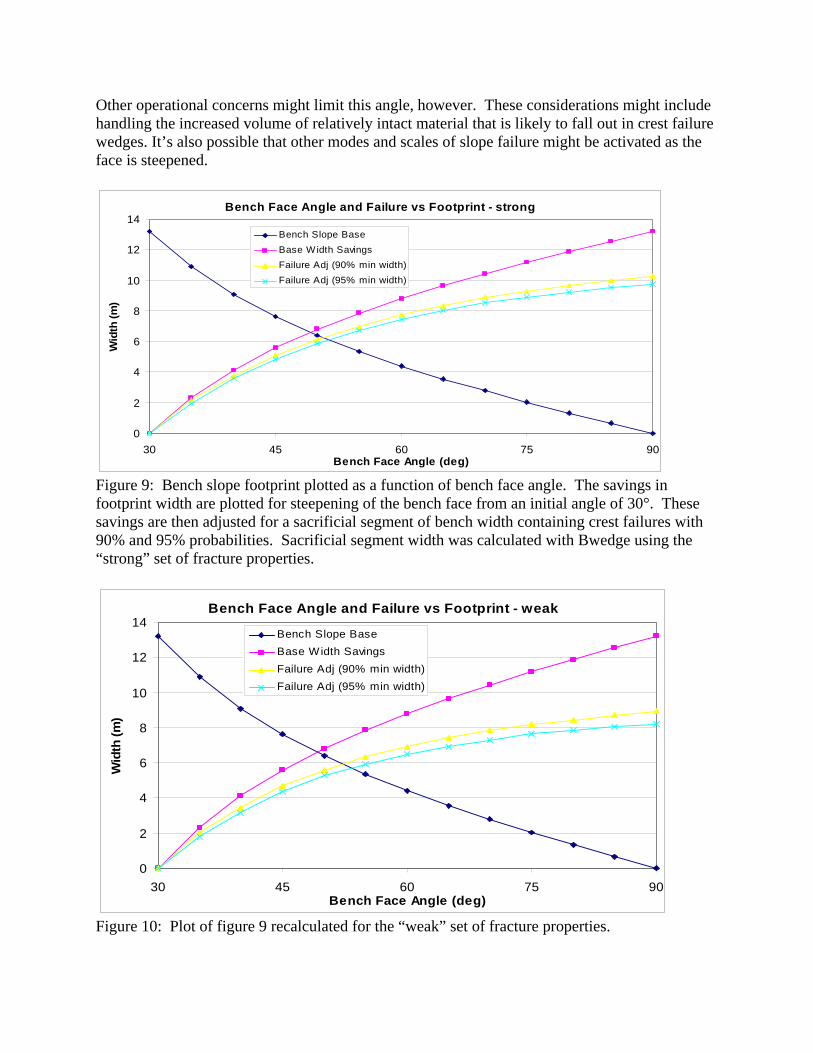
Other operational concerns might limit this angle, however. These considerations might include handling the increased volume of relatively intact material that is likely to fall out in crest failure wedges. It’s also possible that other modes and scales of slope failure might be activated as the face is steepened.
Bench Face Angle and Failure vs Footprint - strong
0
2
4
6
8
10
12
14
30 45 60 75 90Bench Face Angle (deg)
Wid
th (m
)
Bench Slope BaseBase Width SavingsFailure Adj (90% min width)Failure Adj (95% min width)
Figure 9: Bench slope footprint plotted as a function of bench face angle. The savings in footprint width are plotted for steepening of the bench face from an initial angle of 30°. These savings are then adjusted for a sacrificial segment of bench width containing crest failures with 90% and 95% probabilities. Sacrificial segment width was calculated with Bwedge using the “strong” set of fracture properties.
Bench Face Angle and Failure vs Footprint - weak
0
2
4
6
8
10
12
14
30 45 60 75 90Bench Face Angle (deg)
Wid
th (m
)
Bench Slope BaseBase Width SavingsFailure Adj (90% min width)Failure Adj (95% min width)
Figure 10: Plot of figure 9 recalculated for the “weak” set of fracture properties.

V. Discussion and Conclusions This example exercise demonstrates the utility of the Bwedge program in assessing the sensitivity of a catch bench designed in closely fractured rock to various rock, fracture, and design parameters. The Bwedge program generated estimates of effective bench widths from rock and fracture properties that provided insight into bench behavior and bounded observed bench failure. It also highlighted the importance of blasting practice in determining the extent of local failure within the first couple of meters of bench width. These results are a credit to the Montana Tech students that collected the source data, onsite and in the laboratory, and performed both the geostatistical analyses of the fracture data sets and sensitivity analyses with respect to their input parameters. The amount of time and extent of mapping was limited; much more so than would be desirable for a design study. Despite this, the distribution of modeled and measured bench widths showed good correlation. This result is also a testament to the growing robustness of the Bwedge program which benefited greatly from the students’ thorough testing. Finally, these results demonstrate the practical usefulness of the Bwedge program in optimizing catch bench design. It provides a means for assuring adequate catch benches while limiting the costs of over-design. The program, and its companions Bplane (plane failures) and Bstepp (step path failures), are available from the author and will soon be available on the NIOSH website as well. The widespread availability of geostatistical software and ongoing development of automated fracture mapping systems based on laser and/or photogrammetric instruments promise to make these types of analyses even more practical in the future.
Acknowledgements
Montana Tech’s GeoE 5150 Slope Stability Analysis & Design course incorporated a project involving field validation of the new NIOSH bench slope software suite during fall semesters of 2000, 2001, and 2002. During fall semesters 2001 and 2002, the students had the opportunity to collect data at Luzenac America’s Yellowstone Mine, an open pit talc mine near Cameron, Montana. Mike Cerino, Luzenac geologist enrolled in the course during fall semester 2001, provided the field site for this study and later collected supplementary geologic information. The other students in the fall semester 2001 course who participated in the project were Dean Brower, Russell Sheets, and Zachary St. Jean. The students in the fall semester 2002 course were Whit Adams, Kathryn Clapp, Jeremy Dierking, Meagan Duneman, Ben Johnston, Jennifer King, Renee Kockler, Tye Lasich, and Nate Majerus. The students contributed to collecting field data, analyzing results and identifying faults in the Bwedge program. These contributions were essential and central to the development of this paper, and are gratefully acknowledged.

VI. Appendices
Appendix A: Rock Mass Classification
Q-system RMR
RQD 25 1 15 Jn 12 2 3 Jr 1.5 3 15 Ja 2 4 25 Jw 1 5 12
SRF 5 persistence 2 separation 5
Q= 0.3125 roughness 3 infilling 2
weathering 3 rating/slopes -25 rating 60 class III Description: Very poor rock Description: Fair Rock
Appendix B: Laboratory Data
Field Tilt Test Data Laboratory Tilt Test Data Specific Gravity Tests Friction Angle Tan (Phi)
Friction Angle Tan (Phi) 2.71 g/cc
36 0.726543 25 0.466308 2.74 46 1.03553 30 0.57735 2.84 46 1.03553 41 0.869287 35 0.700208 25 0.466308 2.76 Average 35 0.700208 25 0.466308 40 0.8391 27 0.509525 35 0.700208 30 0.57735 41 0.869287 32 0.624869 45 1 34 0.674509 40 0.8391 35 0.700208 30 0.57735 34 0.674509 35 0.700208
38.67 0.810272 30.73 0.600594 Average 0.151461 0.125342 Standard Dev. 0.186926 0.208698 SD/mean

Appendix C: Observed Wedge Failures Wedge 1:
• Joint striking 132°, dips 53°, 6.1m (20 ft) long, cemented caliche infill up to 13 mm (½ inch) thick - broken in places and intact in others, waviness 26 cm (14 inches) amplitude over a 3 m (10 ft) wavelength.
• Foliation fracture striking 15°, dips 72°, 3.7 m (12 ft) long, infill broken, planar. • Apex of partially failed wedge daylights 4.3 m (14 ft) from crest (photo below). (Note:
4.3 m (14 ft) depth of apex is longer than the foliation fracture, because of rubble on top of the wedge. The actual fracture length was likely longer than 3.7 m (12 ft) before blasting.)

Wedge 2:
• Joint striking 113°, dips 51°, 6.1 m (20 ft) long, cemented caliche infill with steps, waviness 2 cm (¾ inch) amplitude over a 15 cm (6 inch) wavelength.
• Foliation fracture striking 20°, dips 70°, 6.1 m (20 ft) long, open fracture with caliche infill.
• Failed wedge apex daylights 6.1 m (20 ft) from crest (photo below). Arrow traces apex of steeply dipping wedge and lines illustrate sliding planes. Bench crest is near the top of the picture.

Appendix D: Fracture Set 1 – Foliation Fracture # Strike Dip Persistence (m) Spacing* (m) Waviness (deg)
1 36 63 6.10 0.24 5 2 0 72 0.91 0.52 14 3 28 70 0.30 2.62 2 4 7 61 4.57 0.61 2 5 10 69 0.61 1.31 2 6 24 53 6.10 1.58 8 7 30 68 3.66 4.27 6 8 10 72 4.57 1.74 7 9 19 76 6.10 0.30 4
10 35 60 5.49 0.30 17 11 0 76 0.61 0.98 4 12 5 56 1.22 0.55 2 13 7 80 4.57 0.94 12 14 9 72 6.10 0.61 10 15 13 72 3.05 2.80 17 16 21 69 4.57 3.75 15 17 22 73 4.57 1.37 14 18 28 90 1.83 3.75 11 19 35 70 2.13 0.30 7 20 15 70 1.98 2.74 10 21 25 76 1.52 0.91 7 22 26 64 1.37 0.76 6 23 8 71 1.37 0.46 26 24 35 71 1.07 0.46 13 25 28 74 1.22 0.61 23 26 42 66 4.27 0.46 7 27 22 90 1.07 4.57 7 28 28 62 1.98 3.05 8 29 34 70 4.57 0.46 12 30 22 73 3.05 0.25 14 31 37 86 1.22 0.84 5 32 8 90 0.91 0.41 6 33 28 76 1.83 0.61 16 34 18 68 1.83 0.33 4 35 6 69 1.83 0.71 10 36 4 77 3.05 0.30 8 37 11 80 0.91 0.28 3 38 8 84 0.61 0.61 1 39 22 74 0.61 0.61 12 40 6 70 0.91 0.66 8 41 8 80 3.05 0.25 20 42 6 76 3.05 0.30 4
*Estimated true spacing to the next fracture measured along a normal from the intersection of the scan line with the current fracture.

Appendix E: Fracture Set 2 – Joints Fracture # Strike Dip Persistence (m) Spacing* (m) Waviness (deg)
1 115 49 0.91 0.61 0.75 2 88 54 2.13 0.58 25 3 136 49 1.52 3.96 4 4 118 67 3.05 0.30 4 5 152 53 1.52 6.10 2 6 170 50 3.05 2.26 3 7 129 54 9.14 0.61 13 8 160 55 9.14 3.05 3 9 106 61 9.14 1.52 4
10 123 25 2.74 0.30 9 11 133 50 0.23 1.52 8 12 90 36 2.44 1.52 5 13 125 31 3.66 0.99 5 14 132 47 1.22 0.76 2 15 118 30 4.27 3.66 8 16 108 83 3.05 0.30 0 17 129 78 6.10 0.63 13 18 124 43 1.52 1.22 0 19 119 37 1.22 0.41 22 20 114 50 6.10 0.76 16 21 111 56 2.13 4.57 15 22 131 54 0.91 0.43 0 23 130 56 1.83 0.55 4 24 127 57 9.14 2.44 3 25 132 70 9.14 8.84 0
*Estimated true spacing to the next fracture measured along a normal from the intersection of the scan line with the current fracture.