Embed Size (px)
Citation preview
ORIGINAL RESEARCHpublished: 30 April 2020
doi: 10.3389/fphys.2020.00324
Frontiers in Physiology | www.frontiersin.org 1 April 2020 | Volume 11 | Article 324
Edited by:
Wenchang Tan,
Peking University, China
Reviewed by:
Vicky Y. Wang,
The University of Auckland,
New Zealand
Joakim Sundnes,
Simula Research Laboratory, Norway
*Correspondence:
Xiaoyu Luo
Specialty section:
This article was submitted to
Computational Physiology and
Medicine,
a section of the journal
Frontiers in Physiology
Received: 19 October 2019
Accepted: 20 March 2020
Published: 30 April 2020
Citation:
Li W, Lazarus A, Gao H,
Martinez-Naharro A, Fontana M,
Hawkins P, Biswas S, Janiczek R,
Cox J, Berry C, Husmeier D and Luo X
(2020) Analysis of Cardiac Amyloidosis
Progression Using Model-Based
Markers. Front. Physiol. 11:324.
doi: 10.3389/fphys.2020.00324
Analysis of Cardiac AmyloidosisProgression Using Model-BasedMarkersWenguang Li 1, Alan Lazarus 1, Hao Gao 1, Ana Martinez-Naharro 2, Marianna Fontana 2,
Philip Hawkins 2, Swethajit Biswas 3, Robert Janiczek 3, Jennifer Cox 3, Colin Berry 4,
Dirk Husmeier 1 and Xiaoyu Luo 1*
1 School of Mathematics and Statistics, University of Glasgow, Glasgow, United Kingdom, 2Centre for Amyloidosis and Acute
Phase Proteins, University College London, London, United Kingdom, 3GlaxoSmithKline plc, Stevenage, United Kingdom,4 British Heart Foundation Glasgow Cardiovascular Research Centre, University of Glasgow, Glasgow, United Kingdom
Deposition of amyloid in the heart can lead to cardiac dilation and impair its pumping
ability. This ultimately leads to heart failure with worsening symptoms of breathlessness
and fatigue due to the progressive loss of elasticity of the myocardium. Biomarkers linked
to the clinical deterioration can be crucial in developing effective treatments. However, to
date the progression of cardiac amyloidosis is poorly characterized. There is an urgent
need to identify key predictors for disease progression and cardiac tissue function. In
this proof of concept study, we estimate a group of new markers based on mathematical
models of the left ventricle derived from routine clinical magnetic resonance imaging and
follow-up scans from the National Amyloidosis Center at the Royal Free in London. Using
mechanical modeling and statistical classification, we show that it is possible to predict
disease progression. Our predictions agree with clinical assessments in a double-blind
test in six out of the seven sample cases studied. Importantly, we find that multiple
factors need to be used in the classification, which includes mechanical, geometrical
and shape features. No single marker can yield reliable prediction given the complexity
of the growth and remodeling process of diseased hearts undergoing high-dimensional
shape changes. Our approach is promising in terms of clinical translation but the results
presented should be interpreted with caution due to the small sample size.
Keywords: cardiac amyloidosis, left ventricle, model-based markers, classification, strain and stress, shape
analysis, MRI
1. INTRODUCTION
Amyloidosis occurs when proteins that take abnormal forms known as amyloid deposits buildup in the tissues. These deposits are composed of abnormal protein fibers that accumulate morequickly than they are cleared away, and thus interfere with the structure and function of affectedorgans throughout the body. These include the heart, liver, skin, lungs, kidneys, and nervoussystem (Gertz et al., 2013). When amyloid fibrils infiltrate in myocardium, the ventricles will showimpaired contraction and relaxation. This is known as cardiac amyloidosis. The most prevalentforms of cardiac amyloidosis are known as Transthyretin-related (ATTR) and immunoglobulinlight chain (AL) amyloidosis (formerly known as primary amyloidosis). Untreated cardiac amyloid,particularly the AL type, can be life-threatening, the median survival of patients is half a year fromthe onset of heart failure (Grogan et al., 2017).

Li et al. Predicting Amyloidosis Progression
The left ventricle (LV) with amyloid becomes firm, rubberyand stiff, similar to hypertrophic cardiomyopathy (Kholova andNiessen, 2005). Further, the ventricular wall is thickened (Carrollet al., 1982; Kholova and Niessen, 2005; Quarta et al.,2012; Martinez-NaharrO et al., 2018), particularly in theinterventricular septum (Frenzel et al., 1986), but the ventricularcavity does not dilate much (Kholova and Niessen, 2005). Hence,the functional defect in amyloidosis is associated to the “stiffheart” syndrome, with the LV end-diastolic pressure rising to atleast 10 mmHg higher than normal subjects (Chew et al., 1975;Swanton et al., 1977). As a result, the amyloidosis myocardiummaterial properties also altered (Petre et al., 2005).
With effective treatments, it is hoped that amyloid depositscan gradually diminish in patients. However, although variousanti-amyloid drugs are being researched, none has beenintroduced into routine clinical practice. A standing challengein developing anti-amyloid drugs is the difficulty of reliablyassessing the disease progression non-invasively and within in ashort follow-up duration, because subtle changes inside tissueswith reduced amyloid deposits are not always visible in clinicalimages, such as cardiac magnetic resonance (CMR) imaging.
Using Doppler echocardiography, Koyama et al. found thatthe early impairment in systolic function of a cardiac amyloidosisheart can be reflected by changed longitudinal strain and strainrate (Koyama et al., 2003). Both circumferential and longitudinalstrains are found to be substantially lower in an amyloidosisLV, compared with a normal, or hypertrophic cardiomyopathyLV (Sun et al., 2009; Buss et al., 2012). CMR images are usedto diagnose cardiac amyloid with late gadolinium enhancement(LGE) (Vogelsberg et al., 2008; Liu et al., 2013; Dungu et al.,2014) or delayed enhancement (White et al., 2014). Based onCMR basal and apical short-axis images, White et al. showedthat the peak LV twist rate and untwist rates are significantlylower in patients with cardiac amyloid LV (White et al., 2014).Nucifora et al. (2014) measured the circumferential strain of 61amyloidosis patients using tagging CMR and found the peakcircumferential strain could be a potential clinical biomarker.
In previous studies, strain and material stiffness were foundto be associated with cardiac amyloidosis. However, there ismuch to be done on understanding the disease progression ofcardiac amyloid. Needless to say, finding a reliable classificationbased on suitable biomarkers is crucially important in assessingthe effectiveness of amyloidosis treatments and any clinicaltrials for new drugs. Despite major research development ofcomputational cardiac models, which can provide a rich set ofbiomarkers, it is perhaps surprising that very little modelingeffort has focused on cardiac amyloidosis (Chapelle et al., 2015),and no studies considered the relation to amyloidosis diseaseprogression.
The aim of this work is to carry out an image-derivedmechanical and statistical modeling approach for LVs withamyloidosis progression. We systemically checked multiplefactors, including the strains, stresses, p-V curve, LV shape,and volume of a group of amyloidosis patients before and aftertreatment. The biomechanical modeling analysis was blind to theclinical assessment, and the classification based on the multiplefactors compares favorably with the clinical observation. To
the best of the authors’ knowledge, this is the first time thatcardiac amyloidosis progression has been studied in a combinedmechanical and statistical approach, based on longitudinalimages of real patients during treatments.
2. METHODS
2.1. CMR-Based LV Model Construction2.1.1. CMR ImagingThe study consists of CMR images from seven cardiacamyloidosis patients before treatment (baseline) and at 6 or 9months after the treatment (follow-up). The information of allpatients is in Table 1. Each patient has been clinically classifiedas recovery, worsening, and stable (no obvious change). Theassessment was based on the clonal response to chemotherapyand progression/regression on the extracellular volume. Thebiomechanical modeling analysis in this paper is blind to theclinical assessment and the CMR imaging acquisition, brieflysummarized in Appendix A.1, has been described in detailelsewhere (Fontana et al., 2015).
2.1.2. Ventricular Model ReconstructionA prolate spherical coordinate system is used to reconstruct theLV geometry following the steps in Liu et al. (2009). Short-axis and long-axis cine images (Figure A1) at a total of 13time instants in diastole are used to warp the LV geometry.The LV wall boundaries are manually segmented using an in-house Matlab code (Gao et al., 2017), and all short-axis LVwall boundaries are aligned to the images of the horizontal longaxis, the vertical long axis, and the left ventricular outflow tract,respectively. In order to align the LV geometries along the long-axis at different times, we first determine the distance betweenthe most-basal short-axis image and the mitral annulus ring,denoted as dt at time t. Following this, the most-basal short-axis image is moved toward the annuls ring along the longaxis with a distance of dt − min(di), (i = 1, ...13, representingthe ith short axis image at diastole). Note that the long axis isdefined by connecting the center of the LV base and the apex.In order to align the LV geometries circumferentially, the anglesof right ventricular insertion points are defined in the basal plane(corresponding to the most-basal short-axis image), v1 near the
TABLE 1 | Cardiac amyloidosis patients and treatment details.
Case Age Sex Weight
(kg)
Blood pressure
(mmHg)
Gadolinium
dosage (mL)
Baseline Baseline Baseline Follow-up Baseline Follow-up
1 62 M 110 79/42 96/61 22 17.8
2 55 F 78.9 106/71 131/80 15.8 16
3 54 F 75 115/68 108/71 16.2 15
4 70 M 67.8 94/62 96/61 13.6 13.1
5 65 M 57 111/69 107/71 11.4 12.3
6 59 F 87.8 112/69 129/83 17.6 21
7 72 M 75.4 106/66 108/71 15.1 11.5
Frontiers in Physiology | www.frontiersin.org 2 April 2020 | Volume 11 | Article 324
Li et al. Predicting Amyloidosis Progression
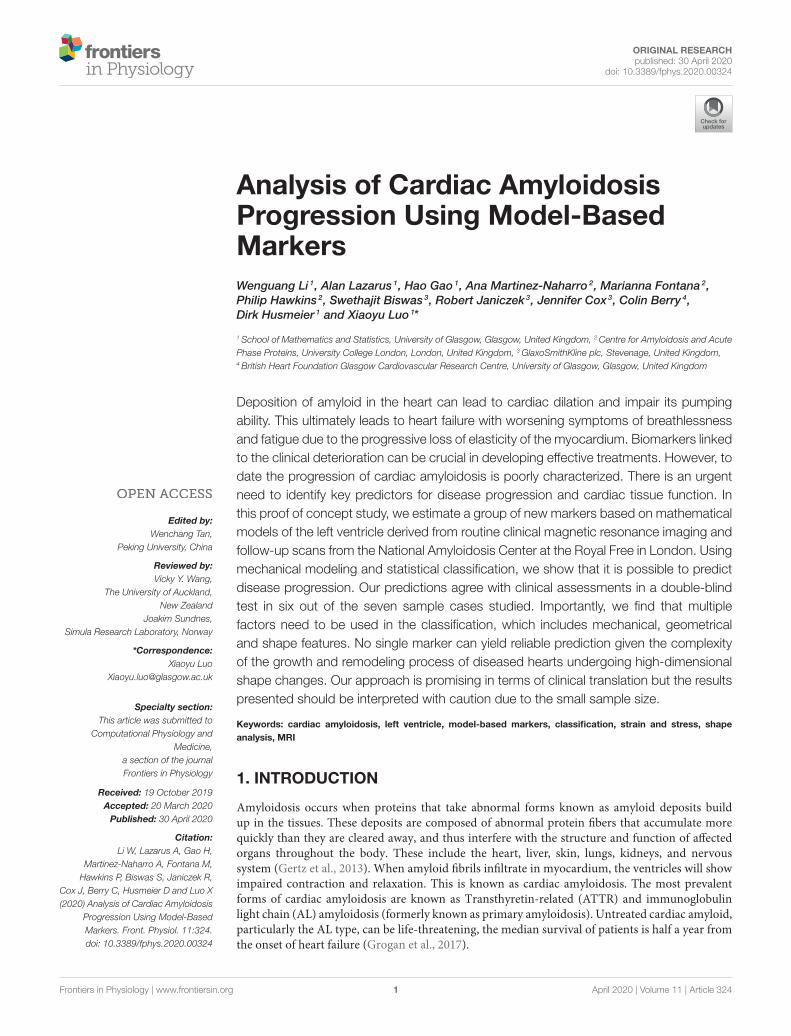
inferior segment, and v2 near the anterior segment, as shown inFigure 1 at two different time instances. Then, for LV geometriesat different times, the basal plane is aligned by matching theinsertion points at v1, and the same number of elements areassigned to the septum circumferentially when generating thelayered hexhedron mesh. Figure 2 shows the reconstructed LVat early-diastole, right after isovolumetric relaxation when themitral valve just opens and the ventricular pressure is the lowest,for all patients both before and after treatment. This choice ofreference configuration has been used in the literature (Genetet al., 2014; Gao et al., 2017).
A rule-based approach (Potse et al., 2006) is adopted togenerate myofiber structure within the LV wall, with fibers variedlinearly from−60o at the epicardium to 60o at the endocardium,and the sheet angle from −45o at the epicardium to 45o atthe endocardium (see Figure 3A). Because the reconstructed LVgeometries are fitted to one standard template mesh after long-axis and circumferential alignment, we may reasonably assumethat elements with the same index from LV models at differenttimes are co-registered. As shown in Figure 3B, three short-axis planes are further defined for extracting strains. Withineach selected plane, 20 regions distributed equally along thecircumferential direction are selected to obtain regional-averagestrains. In total, 60 circumferential strains are measured fromCMR derived LV models.
Since each LV geometry has the same mesh connectivity, afterco-registration of all LV geometries, a mapping can be establishedfor every element of the LV geometry at different time frames.The deformation gradient related to the first time frame (atearly-diastole) can be readily calculated as F =
∂x∂X , where X
and x are position vectors at the first and later time frames,respectively. We further obtain the circumferential direction (c)locally with respect to the long axis, and the transmural direction(r) pointing from endocardium to epicardium, and then the locallongitudinal direction l = r × c, which follows local geometricalcurvature (Gao et al., 2014a). This enables us to compute thecircumferential and longitudinal strains as Ecc = c·( 12 (F
TF−I) c)
and Ell = l · ( 12 (FTF − I) l), in which I is the identity matrix.
Note the reference state for strain calculation is early-diastole, notend-diastole which is usually adopted in clinics.
2.2. Personalized Biomechanical LV Model2.2.1. Constitutive LawWe use the Holzapfel-Ogden strain energy function to describemyocardial passive properties (Holzapfel and Ogden, 2009),
9 =a
2bexp(b(I1 − 3))+
∑
i=f,s
ai
2bi[exp(bi(max(I4i, 1)− 1)2)− 1]
+afs
2bfs[exp(bfsI
28fs − 1)] (1)
FIGURE 1 | Definition of right ventricular insertion points at the basal plane in order to align LV geometries circumferentially at different time instances.
FIGURE 2 | Generated LV geometrical models based on the CMR images and their meshes at early-diastole of seven patients in baseline and follow-up scans.
Frontiers in Physiology | www.frontiersin.org 3 April 2020 | Volume 11 | Article 324

Li et al. Predicting Amyloidosis Progression
FIGURE 3 | Schematic illustration of myofiber orientation (A) and selected three layers in the LV wall (B).
where a, b, af, bf, as, bs, afs, bfs are patient-dependent materialparameters, and Ij (j = 1, 4f, 4s) are invariants of the rightCauchy-Green tensor. A more detailed description of the model(1) can be found in Holzapfel and Ogden (2009) and itsapplications in LV modeling should be referred to Göktepe et al.(2011), Wang et al. (2013), Gao et al. (2014b), and Wang et al.(2014). Differentiation of the strain energy function (1) withrespect to the displacements and applying constraints related tovarious conservation laws leads to a set of equations that definethe cardiac dynamics. These equations are solved numericallyusing finite element discretization, implemented in ABAQUSsoftware 6.11.
2.2.2. Boundary ConditionsEarly-diastole is used as the reference configuration. Thefollowing boundary conditions are applied at the most basalplane (see Figure 3B),
uedgex (t) = uCMR
x (t), uedgey (t) = uCMR
y (t),
uedgez (t) = 0, on the epicardial edge
ubasez (t) = 0, excluding the epicardial edge
(2)
where uedgex , u
edgey , uCMR
x , uCMRy are the displacements in the x and
y directions determined from the model and the CMR images atthe epicardial edge in the most basal plane (see Figure 3B).
The diastolic pressure profile is assumed to be linear betweenzero at early-diastole (t = 0 s) and PED at end-diastole(t = 1 s), following (Steendijk et al., 2004). t here is apseudo simulation time. The values of PED should be patient-specific. However, as the pressure measurements are invasive,this information is not available from in vivo studies. On theother hand, the literature suggests that all amyloidosis patientshave increased wall thickness and higher pressure comparedwith normal subjects (Kholova and Niessen, 2005; Quarta et al.,2012; Martinez-NaharrO et al., 2018). Hence, we assume PED isproportional to scaled LV wall volume as follows:
TABLE 2 | Wall volume ratio and estimated end-diastolic pressure of the
amyloidosis patients.
Vwall/vLV PED (mmHg)
Case Baseline Follow-up Baseline Follow-up
1 2.2066 2.4505 17.38 15.65
2 1.5379 1.8881 10.91 13.39
3 2.7021 3.8163 19.17 27.07
4 1.9746 1.6576 14.01 11.76
5 2.2003 2.6155 15.57 18.55
6 3.2463 3.196 23.03 22.67
7 3.5 5.0283 24.83 35.67
PED
PEDm=
Vwall/VLV
(Vwall/VLV)m, (3)
where PEDm is the mean end-diastolic pressure, taken to be19mmHg based on measurements in Plehn et al. (1992) andBoufidou et al. (2010). Vwall/VLV is the ratio of the LV wallvolume to the LV chamber volume. Its mean value (Vwall/VLV)
m
at early-diastole before treatment is 2.678. The scaled PED foreach patient is listed in Table 2. This range of pressure valuesseems to be consistent with clinical observations of amyloidosispatients (Bhuiyan et al., 2011).
2.2.3. Parameter InferenceFor each amyloidosis patient, the material parameters inEquation (1) are inferred by using an optimization algorithmthrough minimizing an objective function (the differencebetween the model and imaged-derived P-V curve andcircumferential strains). Sensitivity analysis in our previousstudy (Gao et al., 2015) shows the ranking order of theparameters, from the most significant to the least, is
a > afs > af > bf > b≫ bfs > as ≈ bs. (4)
Frontiers in Physiology | www.frontiersin.org 4 April 2020 | Volume 11 | Article 324

Li et al. Predicting Amyloidosis Progression
This allows us to divide the parameters in Equation (1) into twogroups, the first group includes a, b, af, bf, afs, and the secondgroup involves as, bs, bfs. The first group may be determinedwith higher accuracy than the second group because of the highersensitivity to clinical measurements, although this may not betrue all the time as the material model is strongly nonlinear. Assuch, a two-step approach is used. In the first step, parametersof the first group are determined by minimizing the followingobjective function with the parameters in the second grouptaking the values from Gao et al. (2015) for healthy volunteersestimated at PEDm = 8 mmHg (as = 0.5426 kPa, bs = 1.5998,bfs = 3.3900):
FVE = FV + FE
FV = wv
ntime∑
i=1[(VFEA
i − VCMRi )/VCMR
i ]2
FE =wE
nlayer nreg
nlayer∑
k=1
nreg∑
j=1
ntime∑
i=1(EccFEA
i,j,k− EccCMR
i,j,k)2
(5)
where nlayer is the number of layers considered, nlayer = 3indexed by k; ntime is the number of time steps, ntime =
13 indexed by j; nreg is the number of regions in each layer
considered, nreg = 20 indexed by i; VFEAi , VCMR
i are the LVchamber volumes from the FEA and CMR images, respectively;EccFEA
i,j,k, EccCMR
i,j,kare the mean circumferential strains in 20
regions from the FEA and CMR images, respectively; wv, wE
are the weights. Note we do not include the longitudinal strainsin our objective function because the uncertainty of estimatinglongitudinal strains is much larger than the circumferentialstrains. This is because the simplified long-axial alignment weuse does not account for the out-of-plane motion along the longaxis. We are unable to quantify the out-of-plane motion due tothe lack of necessary features in cine images. 3D strain imagingsuch as tagging allows one to include longitudinal strains (Nikouet al., 2016) or the displacement fields (Asner et al., 2016) in theobjective function, but it is not used routinely in clinics. It isfor this reason many published studies using in vivo cine imagesmainly used measured volume (Genet et al., 2014; Palit et al.,2018), or regional circumferential strains along with measuredvolume in the objective function (Gao et al., 2015).
After obtaining the optimal five constants in the first group,we proceed to infer all parameters but found as, bs, and bfs areinsensitive to the optimization. Therefore we first focus on theratios of parameters: as/afs, af/as, bs/bfs, bf/bs. A range of valuesfor these ratios can be found from the literature (Gao et al., 2015;Palit et al., 2018) from which we derive the linear regressions,
{
as/afs = 1.72 af/as − 3.65
bs/bfs = −0.43 bf/bs + 1.61. (6)
The first equation of (6) shows that as is the only unknown afterthe first optimization step,
as =1
2
[
1.72afs +√
(3.65 afs)2 + 4× 1.72 afafs]
. (7)
In the second equation of (6), two unknowns remain, bs bfs. Letξ = bf/bfs, we write
{
bs = bf/ξ
bfs =bf
ξ (1.61−0.43ξ )
. (8)
It is easy to see that ξ ∈ [1.44, 2.96] from data in Gao et al.(2015) and Palit et al. (2018). Thus in the second step, ξ isoptimized by minimizing the objective function FE in Equation(5).
The flowchart of the two-step optimization method andthe inferred parameters are given in Appendix A.2. Theuncertainties of these parameters are evaluated using the residualbootstrap method (Efron and Tibshirani, 1986), as describedin Appendix A.2.
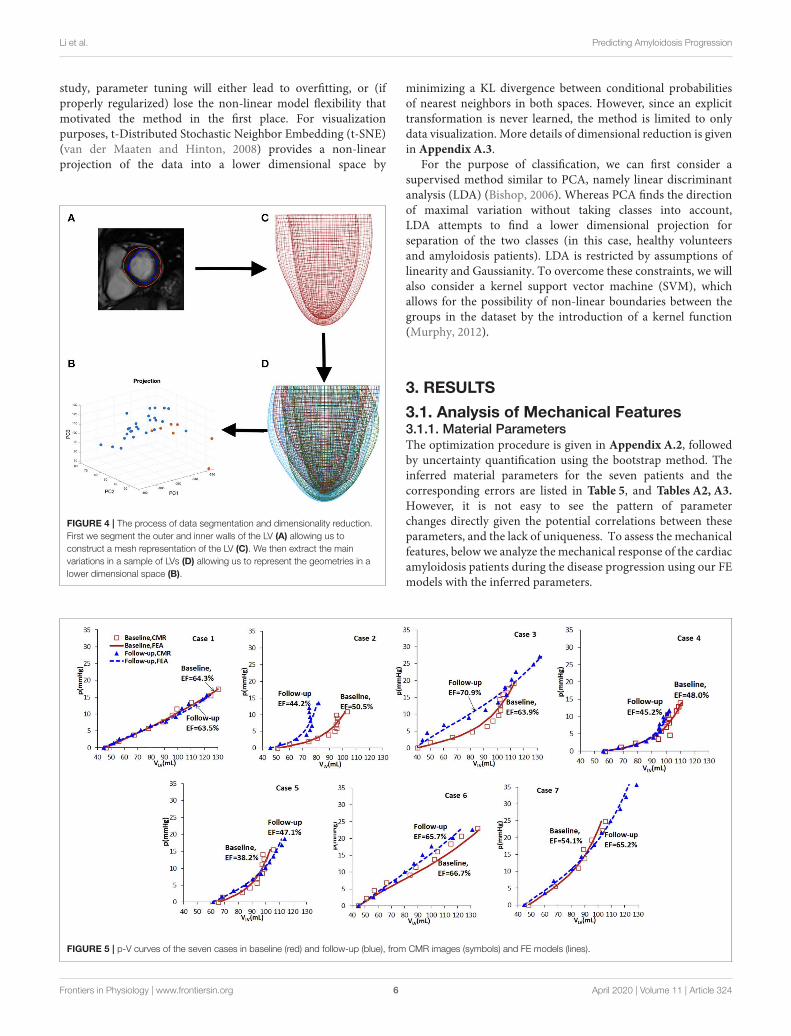
2.3. Shape Analysis and StatisticalClassificationFor feature comparison between the amyloidosis patients andcontrol, we make use of the LV geometries of 26 healthy subjectsfrom our previous study (Gao et al., 2017). Basic characteristicsfor the healthy volunteers are: ages: 45±15, sex (male: female):15 : 11, systolic blood pressure (mmHg): 145.6 ± 31.4, diastolicblood pressure (mmHg): 83 ± 15, LV EF(%):57 ± 5, LV end-diastolic-volume (mL): 126 ± 21, LV end-systolic-volume (mL):55±14. Geometry reconstruction follows the same procedureas for the amyloidosis patients (see section 2.1.2). All the LVgeometries are fitted to one template LV mesh, with 5,792vertices from the endocardial and epicardial surfaces, extractedfrom CMR images with the same imaging orientation as shownin Figure 4 (i.e., the chest wall in the left side of the short-axis images). Note the vertices inside the ventricular wall areexcluded, and each vertex has three coordinate components.Thus, a Cartesian coordinate representation lies in the 17,376dimensional space, necessitating the use of dimensionalityreduction techniques for consideration of the geometry in thecontext of classification and data visualization (see Figure 4).
To analyse the LV shape change, we first need to representthe LV in a low dimensional space. Principal componentanalysis (PCA) relies on, successively, finding the principaldirections of variation in the data where the amount of variationexplained by the eigenvectors (principal components) can bequantified using the corresponding eigenvalues (Bishop, 2006).If we begin with data in n dimensions, then projecting ontothe first m < n principal components provides us with alower dimensional representation of the data while preservingvariations in the data captured by these first m principalcomponents. By construction, PCA assumes a linear mappinginto the lower dimensional space and constrains the principaldirections of variation to be orthogonal to one another (Shlens,2014). Similarly, there is an implicit assumption of Gaussianitysince we assume that dependence between data points isfully specified by the first two moments (mean and variance).These limitations of PCA can be overcome by considering amore flexible, non-linear, dimensionality reduction technique.Methods such as an autoencoding neural network could beconsidered however, for sparse data sets, as available in our
Frontiers in Physiology | www.frontiersin.org 5 April 2020 | Volume 11 | Article 324
Li et al. Predicting Amyloidosis Progression
study, parameter tuning will either lead to overfitting, or (ifproperly regularized) lose the non-linear model flexibility thatmotivated the method in the first place. For visualizationpurposes, t-Distributed Stochastic Neighbor Embedding (t-SNE)(van der Maaten and Hinton, 2008) provides a non-linearprojection of the data into a lower dimensional space by
FIGURE 4 | The process of data segmentation and dimensionality reduction.
First we segment the outer and inner walls of the LV (A) allowing us to
construct a mesh representation of the LV (C). We then extract the main
variations in a sample of LVs (D) allowing us to represent the geometries in a
lower dimensional space (B).
minimizing a KL divergence between conditional probabilitiesof nearest neighbors in both spaces. However, since an explicittransformation is never learned, the method is limited to onlydata visualization. More details of dimensional reduction is givenin Appendix A.3.
For the purpose of classification, we can first consider asupervised method similar to PCA, namely linear discriminantanalysis (LDA) (Bishop, 2006). Whereas PCA finds the directionof maximal variation without taking classes into account,LDA attempts to find a lower dimensional projection forseparation of the two classes (in this case, healthy volunteersand amyloidosis patients). LDA is restricted by assumptions oflinearity and Gaussianity. To overcome these constraints, we willalso consider a kernel support vector machine (SVM), whichallows for the possibility of non-linear boundaries between thegroups in the dataset by the introduction of a kernel function(Murphy, 2012).
3. RESULTS
3.1. Analysis of Mechanical Features3.1.1. Material ParametersThe optimization procedure is given in Appendix A.2, followedby uncertainty quantification using the bootstrap method. Theinferred material parameters for the seven patients and thecorresponding errors are listed in Table 5, and Tables A2, A3.
However, it is not easy to see the pattern of parameterchanges directly given the potential correlations between theseparameters, and the lack of uniqueness. To assess the mechanicalfeatures, below we analyze the mechanical response of the cardiacamyloidosis patients during the disease progression using our FEmodels with the inferred parameters.
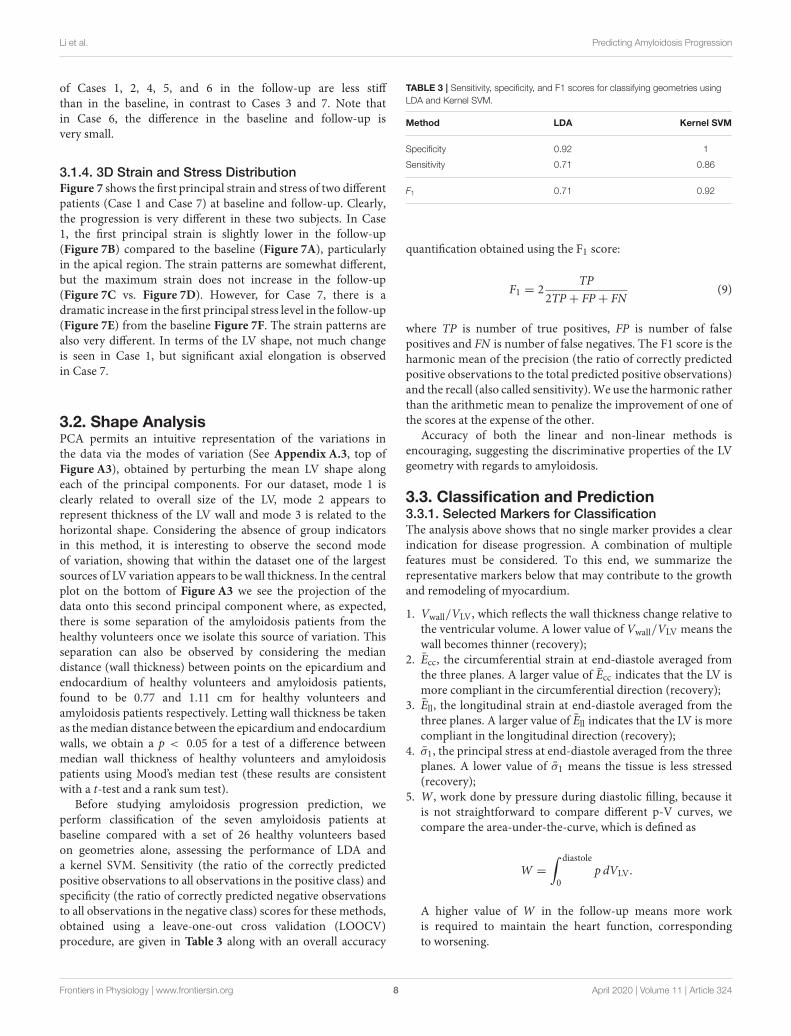
FIGURE 5 | p-V curves of the seven cases in baseline (red) and follow-up (blue), from CMR images (symbols) and FE models (lines).
Frontiers in Physiology | www.frontiersin.org 6 April 2020 | Volume 11 | Article 324

Li et al. Predicting Amyloidosis Progression
3.1.2. p-V CurveBased on the wall-thickness scaled PED, the p-V curves estimatedfrom the FE models are shown in Figure 5, which are comparedwith the corresponding results when the volume is estimateddirectly from CMR images. Figure 5 shows that there are littlechanges in the p-V curves of Cases 1, 4, 5, 7 from baselineto follow-up, but dramatic changes for Cases 2, 3, 6. The end-diastolic volumes of Cases 3, 5, and 7 increased compared tothe baseline values, suggesting a ventricular dilation, while the
end-diastolic volumes of Cases 1, 2, 4, and 6 decreased, especiallyfor Case 2.
3.1.3. Stress-Stretch ResponseThe myocardium stress-stretch response along the myofiberdirection for each patient can now be obtained from a pseudouni-axial test of the myocardium using the material parametersestimated with perfectly aligned myofibers in one direction.The results are plotted in Figure 6. The stress-stretch curves
FIGURE 6 | The stress-stretch responses of the patients at the baseline (red) and follow-up (blue).
FIGURE 7 | The first principal stress contours at baseline (A,E) and follow-up (B,F). The corresponding (logarithmic) strain contours are shown in (C,D,G,H). (A–D)
are for Case 1, (E–H) are for Case 7. The unit of the stresses is kPa.
Frontiers in Physiology | www.frontiersin.org 7 April 2020 | Volume 11 | Article 324
Li et al. Predicting Amyloidosis Progression
of Cases 1, 2, 4, 5, and 6 in the follow-up are less stiffthan in the baseline, in contrast to Cases 3 and 7. Note thatin Case 6, the difference in the baseline and follow-up isvery small.
3.1.4. 3D Strain and Stress DistributionFigure 7 shows the first principal strain and stress of two differentpatients (Case 1 and Case 7) at baseline and follow-up. Clearly,the progression is very different in these two subjects. In Case1, the first principal strain is slightly lower in the follow-up(Figure 7B) compared to the baseline (Figure 7A), particularlyin the apical region. The strain patterns are somewhat different,but the maximum strain does not increase in the follow-up(Figure 7C vs. Figure 7D). However, for Case 7, there is adramatic increase in the first principal stress level in the follow-up(Figure 7E) from the baseline Figure 7F. The strain patterns arealso very different. In terms of the LV shape, not much changeis seen in Case 1, but significant axial elongation is observedin Case 7.
3.2. Shape AnalysisPCA permits an intuitive representation of the variations inthe data via the modes of variation (See Appendix A.3, top ofFigure A3), obtained by perturbing the mean LV shape alongeach of the principal components. For our dataset, mode 1 isclearly related to overall size of the LV, mode 2 appears torepresent thickness of the LV wall and mode 3 is related to thehorizontal shape. Considering the absence of group indicatorsin this method, it is interesting to observe the second modeof variation, showing that within the dataset one of the largestsources of LV variation appears to be wall thickness. In the centralplot on the bottom of Figure A3 we see the projection of thedata onto this second principal component where, as expected,there is some separation of the amyloidosis patients from thehealthy volunteers once we isolate this source of variation. Thisseparation can also be observed by considering the mediandistance (wall thickness) between points on the epicardium andendocardium of healthy volunteers and amyloidosis patients,found to be 0.77 and 1.11 cm for healthy volunteers andamyloidosis patients respectively. Letting wall thickness be takenas themedian distance between the epicardium and endocardiumwalls, we obtain a p < 0.05 for a test of a difference betweenmedian wall thickness of healthy volunteers and amyloidosispatients using Mood’s median test (these results are consistentwith a t-test and a rank sum test).
Before studying amyloidosis progression prediction, weperform classification of the seven amyloidosis patients atbaseline compared with a set of 26 healthy volunteers basedon geometries alone, assessing the performance of LDA anda kernel SVM. Sensitivity (the ratio of the correctly predictedpositive observations to all observations in the positive class) andspecificity (the ratio of correctly predicted negative observationsto all observations in the negative class) scores for these methods,obtained using a leave-one-out cross validation (LOOCV)procedure, are given in Table 3 along with an overall accuracy
TABLE 3 | Sensitivity, specificity, and F1 scores for classifying geometries using
LDA and Kernel SVM.
Method LDA Kernel SVM
Specificity 0.92 1
Sensitivity 0.71 0.86
F1 0.71 0.92
quantification obtained using the F1 score:
F1 = 2TP
2TP + FP + FN(9)
where TP is number of true positives, FP is number of falsepositives and FN is number of false negatives. The F1 score is theharmonic mean of the precision (the ratio of correctly predictedpositive observations to the total predicted positive observations)and the recall (also called sensitivity).We use the harmonic ratherthan the arithmetic mean to penalize the improvement of one ofthe scores at the expense of the other.
Accuracy of both the linear and non-linear methods isencouraging, suggesting the discriminative properties of the LVgeometry with regards to amyloidosis.
3.3. Classification and Prediction3.3.1. Selected Markers for ClassificationThe analysis above shows that no single marker provides a clearindication for disease progression. A combination of multiplefeatures must be considered. To this end, we summarize therepresentative markers below that may contribute to the growthand remodeling of myocardium.
1. Vwall/VLV, which reflects the wall thickness change relative tothe ventricular volume. A lower value of Vwall/VLV means thewall becomes thinner (recovery);
2. Ecc, the circumferential strain at end-diastole averaged fromthe three planes. A larger value of Ecc indicates that the LV ismore compliant in the circumferential direction (recovery);
3. Ell, the longitudinal strain at end-diastole averaged from thethree planes. A larger value of Ell indicates that the LV is morecompliant in the longitudinal direction (recovery);
4. σ1, the principal stress at end-diastole averaged from the threeplanes. A lower value of σ1 means the tissue is less stressed(recovery);
5. W, work done by pressure during diastolic filling, because itis not straightforward to compare different p-V curves, wecompare the area-under-the-curve, which is defined as
W =
∫ diastole
0p dVLV.
A higher value of W in the follow-up means more workis required to maintain the heart function, correspondingto worsening.
Frontiers in Physiology | www.frontiersin.org 8 April 2020 | Volume 11 | Article 324

Li et al. Predicting Amyloidosis Progression
6. The average slope f of the stress-stretch curve σ −λ. A steeperσ − λ in the follow-up indicates the myocardium becomesstiffer (worsening).
7. Shape features, obvious shape changes compared to controlindicate worsening.
The markers used for follow-up cardiac amyloidosis statusprediction are divided into three classes: (1) geometrical markers(features 1–3), (2) biomechanical markers (features 4–6), and(3) LV shape markers (feature 7). Geometrical markers includenormalized LV wall thickness, which has been applied clinically.Biomechanical markers are discussed in section 3.2.
3.3.2. Shape Classification and PredictionWe first study the amyloidosis patient recovery using shapefeatures. As we do not know what is a “healthier” shape for LV,we make use of the control data from our previous study (Gaoet al., 2017). The analysis is conducted by projecting the sevenpatients onto LDA components and measuring distances fromthe group of healthy volunteers before and after treatment. Pre-processing with PCA is necessary, removing collinearity andpreventing singularities in the LDA calculations (this is theresult of all meshes being formed by the same base LV mesh).Figure 8 presents these distances where a negative gradient isa sign of movement toward healthy volunteers. Only patients1, 5, 6, and 7 appear to improve as a result of the treatment.This analysis is performed using leave-one-out-cross-validationwhere in each case one amyloidosis patient is left out of thetraining set. These movements toward or away from healthyvolunteers provide the shape marker in Table 4 where values ofthe six markers in the previous section are also provided. Furtherdetails on computation of the first six markers are provided inAppendix A.2.
FIGURE 8 | Shape analysis of the amyloidosis patients. This plot was
produced using LDA during an initial analysis of the data, before any patient
recovery labels were known. The y-axis provides a measure of distance from
the group of healthy volunteers and the x-axis provides two timepoints: before
and after treatment.
Now that we have quantified the shape features, we cansummarize the changes of all the markers from our model inTable 4. The original values of these markers at the baseline andfollow up as well as the uncertainty quantification are providedin Appendix A.4.
4. DISCUSSION
Using a modeling approach, we have studied the predictivepower of the mechanical and geometric markers with respectto amyloidosis classification. Of great interest is the relation ofamyloidosis progression with thesemarkers, andwhich ones havegreater predictive power. We find that, due to the complexity ofthe LV disease, no single marker can provide the whole pictureof the disease progression. Indeed, as shown in Table 4, somemarkers give opposite predictions for the same case. To overcomethis issue, we made use of the recovery score for each patientbased on the predictions of all the markers studied.
Table 5 summarizes the results of predicting recovery ofamyloidosis patients. The recovery score refers to a classificationdone based on Table 4, which was found before the patientlabels were made available. The recovery score is obtained as theproportion of “better” predictions in Table 4. In other words, wetake the number of recovery scores and divide by the total soif a patient is said to recover by 3 out of 7 markers, then therecovery score is 3/7. The small sample size here severely limitssignificance of these results, but by consulting a committee ofweak classifiers we seek to obtain more conclusive results. Allpatients were diagnosed with heart failure and all of them hadNYHA class 2 at presentation. However, some cases (e.g., Case1) became class 1 after treatment, and others (e.g., case number7) became class 3 on the second follow up. Hence, the clinicalassessments can bemade. This is used to compare to our recoveryscore in Table 4, with a good overall agreement, particularly incases (1, 3, 4, 6, 7). Notice that although we have computedthe recovery scores, we do not know the corresponding rangeof recovery scores to the clinical statuses (of recovery, stable orworsening). If we declare all scores above 0.5 correspond to stableor recovery, then 6 out of 7 predictions are accurate. Case 2 ispredicted wrong, but the score is almost at the boundary.
Despite the encouraging results from the double blind testshown in Table 5, limitations of our work must be discussed.This is a proof of concept study in the goal of classifyingdisease progression after treatment in amyloidosis patients. Thus,although the concept of the approach is deemed to be ratherpromising, it is important to exercise caution when interpretingthe statistical results presented in this paper, as the lack of datareduces significance of the statistical analysis, as well as thedimensionality reduction results.
There are two issues that can impact the stress values weestimate. The first is that it is known that the eight parametersin the HO model are coupled and not independent. Therefore,each parameter may not be uniquely determined. However, it isnot the individual change of the parameters that we look for, butthe collective effects of all the parameters. For example, it hasbeen shown that the stress-strain curves can be more robustly
Frontiers in Physiology | www.frontiersin.org 9 April 2020 | Volume 11 | Article 324

Li et al. Predicting Amyloidosis Progression
TABLE 4 | Classification for the amyloidosis patients based on various markers.
Marker Vwall/VLV Ecc Ell W σ1 f Shape
Case (Follow-up − Baseline)/Baseline×100%
1 11.05 10.66 (0.06) −10.72 (0.092) −18.86 (0.05) −18.20 (0.11) −33.86 (0.12) down
2 22.77 25.24 (0.10) −51.86 (0.12) −13.51 (0.03) −38.59 (0.18) −92.69 (0.09) up
3 41.2 −4.77 (0.03) 65.03 (0.16) 168.22 (0.06) 39.79 (0.31) 428.19 (2.26) up
4 −16.05 2.65 (0.10) −10.63 (0.11) −30.70 (0.11) −6.53 (0.07) −40.92 (0.69) up
5 18.87 70.20 (0.18) 7.26 (0.18) 108.82 (0.09) −8.50 (0.07) −93.09 (0.08) down
6 −1.55 −29.86 (0.03) 0.74 (0.06) −14.37 (0.04) 13.36 (0.03) 193.59 (1.52) down
7 43.67 9.33 (0.08) 83.90 (0.14) 154.70 (0.15) 42.12 (0.17) 168.10 (2.45) down
Better: 4,6 1,2,4,5,7 3,5,6,7 1,2,4,6 1,2,4,5 1,2,4,5 1,5,6,7
Worse: 1,2,3,5,7 3,6 1,2,4 3,5,7 3,6,7 3,6,7 2,3,4
The criterion for improvement for the first 6 markers is based on physiology, as described in section 3.3.1. The criterion for improvement for “shape” (last column) is based on the
statistical analysis described in section 3.3.2. The uncertainty intervals for the biomechanical markers (columns 5–7) are obtained from the residual bootstrap analysis described in
Appendix A.2, A.4. Note the sign of the values does not change when taking this uncertainty into account.
TABLE 5 | Model predication vs. clinical assessment.
Patient 1 2 3 4 5 6 7
Recovery
score
0.71 0.57 0.14 0.57 0.71 0.71 0.43
Clinical
assessment
Recovery Worsening Worsening Stable Stable Recovery Worsening
The higher the score, the more likely is the recovery, and vice versa.
estimated despite the inter-correlations of the parameters, asshown in our previous study (Gao et al., 2015), for differentmeasurement noise levels or initial values. To quantify theparameter uncertainty in our paper, we have carried out aresidual bootstrap analysis (Efron and Tibshirani, 1986). Ouruncertainty quantification follows a three-tier approach. At thebottom tier, we apply the residual bootstrap analysis to estimatethe estimation uncertainty of the biomechanical parameters,which are defined below Equation (1). The methodologicaldetails are described in Appendix A.2. Note that the bootstrapanalysis takes two effects into consideration: intrinsic uncertaintyas a consequence of measurement noise, and algorithmicuncertainty as a consequence of potential convergence of theoptimization algorithm to local optima of the objective function.At the middle tier, we use the bootstrap distributions of thebiomechanical parameter estimates from the bottom tier toobtain the corresponding distributions of the biomechanicalmarkers, which were introduced in section 3.3.1. The resultscan be found in Appendix A.4. At the highest tier, we usethe uncertainty of the biomechanical markers to determine theuncertainty of the recovery scores. The methodological detailscan be found in Appendix A.4, and the results are in Table 4.
The second issue is the significant assumption we made on theend-of-diastole pressure for the patients since invasive pressuremeasurements are not available. We assumed that there is aproportional relationship between the pressure and wall volume,inspired by data from the literature. This assumption increasedthe uncertainty of the final stress values we computed. However,
we would like to state that it is not the absolute stress values,but the relative change (follow up vs. acute), that matters inour evaluations. Clearly, Table 4 shows that the recovery scoresare not affected by the uncertainty intervals since, within theinterval provided by the uncertainty propagation outlined inAppendix A.4, the recovery indicator does not change. Wealso estimated the recovery scores based on markers from theimage-based strain and shape analysis alone, and found thatthe prediction is not as good, in that two cases (1 and 7)are predicted wrong if we exclude the stresses related markers.However, we noted that some of the individual scores givenearly opposite results. For example, in Table 4, two strain andshape indicators show that case 7 is getting better, but the threestress and wall thickness indicators show it is getting worse.Hence, not all indicators give a positive contribution to theoverall score. This highlights the complexity of the pathologicalsystem, and indicates that no single biomarker studied is able topredict the amyloidosis progression. We tentatively suggest thatcompeting mechanisms may be in play during patients’ recovery.For instance, the increased strains (showing recovering) in Case 7are accompanied by the increased stresses (showing worsening).This may imply that the more stiffened myocardium over-weights the benefits of the smaller strains. Therefore, it seemsthat multiple markers are required to give a balanced view forthe overall picture. We remark again that our observations needto be supported by a larger sample size, as with a small samplesize it is difficult to distinguish systematic effects from randomfluctuations.
Other modeling limitations should also be mentioned. In thispaper, amyloidosis LV is regarded as homogeneous material.The loaded early diastolic configuration is used as the referenceconfiguration which excludes the effect of residual stresses. Ouralignment of LV geometries at different times is based on asimplified linear registration approach. Nonlinear methods, suchas deformable registration approaches (Rueckert et al., 1999), thelarge deformation deformetric metric mapping (Durrleman et al.,2014), may provide more accurate geometry co-registrations.These issues need to be addressed in future work.
Frontiers in Physiology | www.frontiersin.org 10 April 2020 | Volume 11 | Article 324

Li et al. Predicting Amyloidosis Progression
5. CONCLUSION
A proof of concept analysis of cardiac amyloidosisprogression has been obtained by projecting a group ofamyloidosis patients onto linear discriminant analysiscomponents and measuring distances from the group ofhealthy volunteers before and after treatment. Extensivemechanical, geometrical, and shape markers are includedin the analysis for the first time for cardiac amyloidosispatients. A promising agreement with clinical observationis achieved in predicting disease progression followingmedical treatments in a double blind test. Although theseresults should be interpreted with caution due to a smallsample size, the methodology of using statistical analysisand multiple markers, in particular the shape analysis, canplay a powerful role in clinical translation in the futurewhen used in large samples with new and automatic imagesegmentation methods.
DATA AVAILABILITY STATEMENT
All datasets generated for this study are included in thearticle/Supplementary Material.
ETHICS STATEMENT
Ethical approval was obtained from the Joint University CollegeLondon/University College London Hospitals Research EthicsCommittee (REC reference: 07/H0715/101). All research-related procedures were performed in accordance withlocal guidelines and regulations. The patients/participants
provided their written informed consent to participate inthis study.
AUTHOR CONTRIBUTIONS
XL, HG, and DH designed the study. WL and AL developed themechanical and statistical models. AM-N, MF, and PH acquiredthe CMR scans. SB, RJ, and JC initiated the research idea andhelped with image analysis. CB provided clinical insight. Allparticipated in writing the manuscript.
FUNDING
This research was supported by the Engineering and PhysicalSciences Research Council (EP/N014642/1, EP/S030875,EP/S020950/1), the British Heart Foundation Grant (ProjectGrant PG/14/64/31043, PG/11/2/28474), the National HealthService, and the Chief Scientist Office, and the British HeartFoundation Centre of Research Excellence Award (CoERE/186134217). DH was supported by a grant from the RoyalSociety of Edinburgh, award no. 62335.
ACKNOWLEDGMENTS
We thank the patients who participated in this study.
SUPPLEMENTARY MATERIAL
The Supplementary Material for this article can be foundonline at: https://www.frontiersin.org/articles/10.3389/fphys.2020.00324/full#supplementary-material
REFERENCES
Asner, L., Hadjicharalambous, M., Chabiniok, R., Peresutti, D., Sammut, E., Wong,
J., et al. (2016). Estimation of passive and active properties in the human
heart using 3D tagged MRI. Biomech. Model. Mechanobiol. 15, 1121–1139.
doi: 10.1007/s10237-015-0748-z
Bhuiyan, T., Helmke, S., Patel, A. R., Ruberg, F. L., Packman, J., Cheung, K.,
et al. (2011). Pressure-volume relationships in patients with transthyretin
(ATTR) cardiac amyloidosis secondary to V122I mutations and wild-
type transthyretin: Transthyretin cardiac amyloid study (TRACS).
Circulation 4, 121–128. doi: 10.1161/CIRCHEARTFAILURE.109.
910455
Bishop, C. M. (2006). Pattern Recognition and Machine Learning (Information
Science and Statistics). Berlin; Heidelberg: Springer-Verlag.
Boufidou, A., Mantziari, L., Paraskevaidis, S., Karvounis, H., Nenopoulou, E.,
Manthou, M.-E., et al. (2010). An interesting case of cardiac amyloidosis
initially diagnosed as hypertrophic cardiomyopathy. Hellenic J. Cardiol. 51,
552–557. Available online at: https://www.hellenicjcardiol.org/archive/full_
text/2010/6/2010_6_552.pdf
Buss, S. J., Emami, M., Mereles, D., Korosoglou, G., Kristen, A. V., Voss,
A., et al. (2012). Longitudinal left ventricular function for prediction of
survival in systemic light-chain amyloidosis: incremental value compared
with clinical and biochemical markers. J. Am. Coll. Cardiol. 60, 1067–1076.
doi: 10.1016/j.jacc.2012.04.043
Carroll, J. D., Gaasch, W. H., and McAdam, K. P. (1982). Amyloid
cardiomyopathy: characterization by a distinctive voltage/mass relation. Am.
J. Cardiol. 49, 9–13. doi: 10.1016/0002-9149(82)90270-3
Chapelle, D., Felder, A., Chabiniok, R., Guellich, A., Deux, J.-F., and Damy, T.
(2015). “Patient-specific biomechanical modeling of cardiac amyloidosis–a case
study,” in International Conference on Functional Imaging and Modeling of the
Heart (Maastricht: Springer), 295–303. doi: 10.1007/978-3-319-20309-6_34
Chew, C., Ziady, G. M., Raphael, M. J., and Oakley, C. M. (1975). The functional
defect in amyloid heart disease: the “stiff heart” syndrome. Am. J. Cardiol. 36,
438–444. doi: 10.1016/0002-9149(75)90891-7
Dungu, J. N., Valencia, O., Pinney, J. H., Gibbs, S. D., Rowczenio, D., Gilbertson,
J. A., et al. (2014). CMR-based differentiation of AL and ATTR cardiac
amyloidosis. JACC 7, 133–142. doi: 10.1016/j.jcmg.2013.08.015
Durrleman, S., Prastawa, M., Charon, N., Korenberg, J. R., Joshi, S.,
Gerig, G., et al. (2014). Morphometry of anatomical shape complexes
with dense deformations and sparse parameters. NeuroImage 101, 35–49.
doi: 10.1016/j.neuroimage.2014.06.043
Efron, B., and Tibshirani, R. (1986). Bootstrap methods for standard errors,
confidence intervals, and other measures of statistical accuracy. Stat. Sci. 1,
54–75. doi: 10.1214/ss/1177013815
Fontana, M., Pica, S., Reant, P., Abdel-Gadir, A., Treibel, T. A., Banypersad, S. M.,
et al. (2015). Prognostic value of late gadolinium enhancement cardiovascular
magnetic resonance in cardiac amyloidosis. Circulation 132, 1570–1579.
doi: 10.1161/CIRCULATIONAHA.115.016567
Frenzel, H., Schwartzkopff, B., Kuhn, H., Lösse, B., Thormann, J., Hort, W.,
et al. (1986). Cardiac amyloid deposits in endomyocardial biopsies: light
microscopic, ultrastructural, and immunohistochemical studies. Am. J. Clin.
Pathol. 85, 674–680. doi: 10.1093/ajcp/85.6.674
Gao, H., Aderhold, A., Mangion, K., Luo, X., Husmeier, D., and Berry, C.
(2017). Changes and classification in myocardial contractile function in the left
Frontiers in Physiology | www.frontiersin.org 11 April 2020 | Volume 11 | Article 324

Li et al. Predicting Amyloidosis Progression
ventricle following acute myocardial infarction. J. R. Soc. Interface 14:20170203.
doi: 10.1098/rsif.2017.0203
Gao, H., Carrick, D., Berry, C., Griffith, B. E., and Luo, X. (2014a). Dynamic finite-
strain modelling of the human left ventricle in health and disease using an
immersed boundary-finite element method. IMA J. Appl. Math. 79, 978–1010.
doi: 10.1093/imamat/hxu029
Gao, H., Li, W., Cai, L., Berry, C., and Luo, X. (2015). Parameter estimation in
a holzapfel–ogden law for healthy myocardium. J. Eng. Math. 95, 231–248.
doi: 10.1007/s10665-014-9740-3
Gao, H., Wang, H., Berry, C., Luo, X., and Griffith, B. E. (2014b). Quasi-
static image-based immersed boundary-finite element model of left ventricle
under diastolic loading. Int. J. Numer. Methods Biomed. Eng. 30, 1199–1222.
doi: 10.1002/cnm.2652
Genet, M., Lee, L. C., Nguyen, R., Haraldsson, H., Acevedo-Bolton, G., Zhang, Z., et
al. (2014). Distribution of normal human left ventricular myofiber stress at end
diastole and end systole: a target for in silico design of heart failure treatments.
J. Appl. Physiol. 117, 142–152. doi: 10.1152/japplphysiol.00255.2014
Gertz, M., Dispenzieri, A., Grogan, M., Kumar, S., Leung, N., Maurer, M., et al.
(2013). Amyloidosis Awareness. Amyloidosis Support Groups.
Göktepe, S., Acharya, S., Wong, J., and Kuhl, E. (2011). Computational modeling
of passive myocardium. Int. J. Numer. Methods Biomed. Eng. 27, 1–12.
doi: 10.1002/cnm.1402
Grogan, M., Dispenzieri, A., and Gertz, M. A. (2017). Light-chain cardiac
amyloidosis: strategies to promote early diagnosis and cardiac response. Heart
103, 1065–1072. doi: 10.1136/heartjnl-2016-310704
Holzapfel, G. A., and Ogden, R. W. (2009). Constitutive modelling of passive
myocardium: a structurally based framework for material characterization.
Philos. Trans. R. Soc. Lond. A Math. Phys. Eng. Sci. 367, 3445–3475.
doi: 10.1098/rsta.2009.0091
Kholova, I., and Niessen, H. (2005). Amyloid in the cardiovascular system: a
review. J. Clin. Pathol. 58, 125–133. doi: 10.1136/jcp.2004.017293
Koyama, J., Ray-Sequin, P. A., and Falk, R. H. (2003). Longitudinal myocardial
function assessed by tissue velocity, strain, and strain rate tissue doppler
echocardiography in patients with al (primary) cardiac amyloidosis.Circulation
107, 2446–2452. doi: 10.1161/01.CIR.0000068313.67758.4F
Liu, D., Hu, K., Niemann, M., Herrmann, S., Cikes, M., Störk, S., et al. (2013).
Impact of regional left ventricular function on outcome for patients with al
amyloidosis. PLoS ONE 8:e56923. doi: 10.1371/journal.pone.0056923
Liu, Y., Wen, H., Gorman, R. C., Pilla, J. J., Gorman, J. H. III, Buckberg, G., et
al. (2009). Reconstruction of myocardial tissue motion and strain fields from
displacement-encoded MR imaging. Am. J. Physiol. Heart Circul. Physiol. 297,
H1151–H1162. doi: 10.1152/ajpheart.00074.2009
Martinez-NaharrO, A., Hawkins, P. N., and Fontana, M. (2018). Cardiac
amyloidosis. Clin. Med. 18, s30–s35. doi: 10.7861/clinmedicine.18-2-s30
Murphy, K. P. (2012). Machine Learning: A Probabilistic Perspective. The MIT
Press.
Nikou, A., Dorsey, S. M., McGarvey, J. R., Gorman, J. H., Burdick, J. A., Pilla, J. J.,
et al. (2016). Computational modeling of healthy myocardium in diastole. Ann.
Biomed. Eng. 44, 980–992. doi: 10.1007/s10439-015-1403-7
Nucifora, G., Muser, D., Morocutti, G., Piccoli, G., Zanuttini, D., Gianfagna, P., et
al. (2014). Disease-specific differences of left ventricular rotational mechanics
between cardiac amyloidosis and hypertrophic cardiomyopathy. Am. J. Physiol.
Heart Circul. Physiol. 307, H680–H688. doi: 10.1152/ajpheart.00251.2014
Palit, A., Bhudia, S. K., Arvanitis, T. N., Turley, G. A., and Williams, M. A. (2018).
In vivo estimation of passive biomechanical properties of human myocardium.
Med. Biol. Eng. Comput. 56, 1615–16317. doi: 10.1007/s11517-017-1768-x
Petre, R. E., Quaile, M. P., Wendt, K., Houser, S. R., Wald, J., Goldman, B. I., et
al. (2005). Regionally heterogeneous tissue mechanics in cardiac amyloidosis.
Amyloid 12, 246–250. doi: 10.1080/13506120500386824
Plehn, J. F., Southworth, J., and Cornwell III, G. G. (1992). Atrial systolic
failure in primary amyloidosis. N. Engl. J. Med. 327, 1570–1573.
doi: 10.1056/NEJM199211263272205
Potse, M., Dubé, B., Richer, J., Vinet, A., and Gulrajani, R. M. (2006). A comparison
of monodomain and bidomain reaction-diffusion models for action potential
propagation in the human heart. IEEE Trans. Biomed. Eng. 53, 2425–2435.
doi: 10.1109/TBME.2006.880875
Quarta, C., Kruger, J., and Falk, R. (2012). Cardiac amyloidosis. Clin. Med. 126,
e178–e182. doi: 10.1161/CIRCULATIONAHA.111.069195
Rueckert, D., Sonoda, L. I., Hayes, C., Hill, D. L., Leach, M. O., and
Hawkes, D. J. (1999). Nonrigid registration using free-form deformations:
application to breast MR images. IEEE Trans. Med. Imaging 18, 712–721.
doi: 10.1109/42.796284
Shlens, J. (2014). A Tutorial on Principal Component Analysis.
Steendijk, P., Tulner, S. A., Wiemer, M., Bleasdale, R. A., Bax, J. J., van der Wall,
E. E., et al. (2004). Pressure–volume measurements by conductance catheter
during cardiac resynchronization therapy. Eur. Heart J. Suppl. 6(Suppl. D),
D35–D42. doi: 10.1016/j.ehjsup.2004.05.012
Sun, J. P., Stewart, W. J., Yang, X. S., Donnell, R. O., Leon, A. R., Felner,
J. M., et al. (2009). Differentiation of hypertrophic cardiomyopathy and
cardiac amyloidosis from other causes of ventricular wall thickening by two-
dimensional strain imaging echocardiography. Am. J. Cardiol. 103, 411–415.
doi: 10.1016/j.amjcard.2008.09.102
Swanton, R. H., Brooksby, A. I., Davies, M. J., Coltart, D. J., Jenkins, B. S., and
Webb-Peploe, M. M. (1977). Systolic and diastolic ventricular function in
cardiac amyloidosis: studies in six cases diagnosed with endomyocardial biopsy.
Am. J. Cardiol. 39, 658–664. doi: 10.1016/S0002-9149(77)80125-2
van der Maaten, L., and Hinton, G. (2008). Visualizing data using t-SNE. JMLR 9,
2579–2605.
Vogelsberg, H., Mahrholdt, H., Deluigi, C. C., Yilmaz, A., Kispert, E. M., Greulich,
S., et al. (2008). Cardiovascular magnetic resonance in clinically suspected
cardiac amyloidosis: noninvasive imaging compared to endomyocardial
biopsy. J. Am. Coll. Cardiol. 51, 1022–1030. doi: 10.1016/j.jacc.2007.
10.049
Wang, H., Gao, H., Luo, X., Berry, C., Griffith, B., Ogden, R., et al. (2013).
Structure-based finite strain modelling of the human left ventricle in diastole.
Int. J. Numer. Methods Biomed. Eng. 29, 83–103. doi: 10.1002/cnm.2497
Wang, H., Luo, X., Gao, H., Ogden, R., Griffith, B., Berry, C., et al. (2014). A
modified holzapfel-ogden law for a residually stressed finite strain model of
the human left ventricle in diastole. Biomech. Model. Mechanobiol. 13, 99–113.
doi: 10.1007/s10237-013-0488-x
White, J. A., Kim, H. W., Shah, D., Fine, N., Kim, K.-Y., Wendell, D. C., et al.
(2014). CMR imaging with rapid visual T1 assessment predicts mortality
in patients suspected of cardiac amyloidosis. JACC Cardiovasc. Imaging 7,
143–156. doi: 10.1016/j.jcmg.2013.09.019
Conflict of Interest: RJ and JC were employed by the company GlaxoSmithKline,
plc, UK. The University of Glasgow holds research and/or consultancy agreements
with Siemens Healthcare and GlaxoSmithKline plc for work done by XL, CB,
and others.
Copyright © 2020 Li, Lazarus, Gao, Martinez-Naharro, Fontana, Hawkins, Biswas,
Janiczek, Cox, Berry, Husmeier and Luo. This is an open-access article distributed
under the terms of the Creative Commons Attribution License (CC BY). The
use, distribution or reproduction in other forums is permitted, provided the
original author(s) and the copyright owner(s) are credited and that the original
publication in this journal is cited, in accordance with accepted academic practice.
No use, distribution or reproduction is permitted which does not comply with these
terms.
Frontiers in Physiology | www.frontiersin.org 12 April 2020 | Volume 11 | Article 324


![Uncharted waters: rare and unclassified cardiomyopathies ... · without a loading condition such as hypertension or valvular disease [7]. Cardiac amyloidosis Cardiac amyloidosis describes](https://img.pdfslide.net/doc/110x75/5f7f117d3a4eb942540eb802/uncharted-waters-rare-and-unclassified-cardiomyopathies-without-a-loading-condition.jpg)