Embed Size (px)
Citation preview
i
ANALYSIS OF COMMON BEAN (Phaseolus vulgaris L) CROSS-BORDER TRADE AND
MARKET EFFICIENCY IN EAST AFRICA: A CASE STUDY OF KENYA
ODERA EMMA VIVIAN
A Thesis Submitted to the Graduate School in Partial Fulfillment of the requirements for
the Award of the Master of Science Degree in Agricultural and Applied Economics of
Egerton University.
EGERTON UNIVERSITY
May 2016
ii
DECLARATION AND RECOMMENDATION
Declaration
I declare that this thesis is my original work and has not been submitted in any university for the
award of a degree.
Signature: ………………….………… Date: …………………………
Odera Emma Vivian
KM17/3003/11
Recommendation
This thesis has been submitted with our approval as University supervisors.
Signature: …………………………… Date: ………………………….
Prof. Patience Mshenga (PhD)
Department of Agricultural Economics and Agribusiness Management, Egerton University.
Signature: …………………………… Date: ……………………………
Dr. Eliud Birachi (PhD)
Market value chain specialist with the International Center for Tropical Agriculture (CIAT),
Kenya
iii
COPYRIGHT
© 2015 Emma Odera
No part or whole of this thesis may be reproduced, stored in a retrieval system or transmitted in
any form or means such as electronic, mechanical or photocopying without the prior written
permission of Egerton University on behalf of the author.
All rights reserved

iv
DEDICATION
I dedicate this thesis to Dennis Ochieng for his unconditional love, support and for being an
inspiring husband. My beloved sons Isaiah Paul Otieno, Jesse Otieno Otieno and my mum and
siblings, thanks for your support.

v
ACKNOWLEDGEMENT
I would like to thank God for giving me strength, good health and courage during my entire
study period.
I give my sincere gratitude to the entire staff of AGEC/AGBM department for their steadfast
support and providing a favorable learning environment. I gratefully acknowledge the support
and guidance from my supervisors Prof. Mshenga and Dr. Birachi. Their constant guidance and
comments were of great importance in making this work a success.
Sincere gratitude to the Collaborative Masters in Applied and Agricultural Economics Program
for financial support during my research work. Material support from International Center for
Tropical Agriculture team, enumerators and the traders during data collection along the Kenya
border points is acknowledged.
Special thanks to my family for their support, prayers and love throughout the study period. The
contribution and positive critiques from other individuals and friends will not also go
unmentioned.
To God be the glory.
vi
ABSTRACT
East Africa region has imbalances in the supply and demand of common bean. This can be offset
by improving marketing infrastructure. The objectives of the study were to determine the
characteristics of common bean traders, to determine the constraints to the observed trade in
common bean varieties and finally to assess the extent to which markets have integrated in key
selected markets. Multi-stage sampling technique was used to obtain a sample of 240
respondents (120 traders from the border points and 120 traders from key selected markets). The
four border points (Busia, Malaba, Isebania, and Namanga) were purposively selected due to the
extent of activities, nature of trade and the volumes of common beans that they handled. The
three key markets (Nairobi, Mombasa, and Nakuru) were also purposively selected because of
high potential demand and supply for common beans. Snow balling method was used to select
the traders. Descriptive statistics were used to address characteristics of common bean traders in
key selected border points and markets (objective 1) and constraints to the observed trade in the
selected border points and markets (objective 2) and co-integration analysis was used to address
the extent to which markets of common bean are integrated in key selected markets (objective 3).
The findings revealed that a greater proportion of the traders were women, majority being
retailers. The women traders also had more years of experience on average in the retail business
compared to the men. Results also indicated that the major constraints to bean trade were high
transportation costs, heavy rains, and irregularities in bean supply. Nyayo and Wairimu bean
varieties were the most traded varieties in the markets whereas Saitoti variety was the least
traded. The co-integration tests established that Nairobi- Mombasa and Nakuru- Mombasa
Rosecoco markets and Nairobi- Nakuru and Nakuru- Mombasa Mwitemania markets were co-
integrated. The study recommends that, in order to increase the degree of market integration, the
government and private sector should improve marketing infrastructure especially the roads to
enable easy flow of the product between the markets. There is also need to zero rate agricultural
produce being imported in the country to tackle the issue of bribery at the border points, this in
return will enable traders not take advantage of increased production to lower returns accruing to
farmers thus enhancing degree of market integration.

vii
TABLE OF CONTENTS
DECLARATION AND RECOMMENDATION ........................................................................ii
DEDICATION............................................................................................................................... iv
ACKNOWLEDGEMENT ............................................................................................................. v
ABSTRACT ................................................................................................................................... vi
LIST OF FIGURES ....................................................................................................................... x
ACRONYMS AND ABBREVIATIONS ..................................................................................... xi
CHAPTER ONE ........................................................................................................................... 1
INTRODUCTION......................................................................................................................... 1
1.1 Background information ....................................................................................................... 1
1.1.1 Common bean (Phaseolus vulgaris L) production in the world .................................... 2
1.1.2 Common bean consumption in East Africa .................................................................... 3
1.2 Statement of the problem ...................................................................................................... 4
1.3 Objectives of the study .......................................................................................................... 4
1.3.1 General objective ............................................................................................................ 4
1.3.2 Specific objectives .......................................................................................................... 4
1.4 Research questions ................................................................................................................ 5
1.5 Justification of the study ....................................................................................................... 5
1.6 Scope and limitation of the study .......................................................................................... 5
1.7 Definition of terms ................................................................................................................ 6
1.8 Outline of the thesis............................................................................................................... 6
CHAPTER TWO .......................................................................................................................... 7
LITERATURE REVIEW ............................................................................................................ 7
2.1 Common bean varieties produced in East Africa .................................................................. 7
2.2 Common bean trade in East Africa ....................................................................................... 8
2.3 Market integration analysis ............................................................................................. 11
2.4 Price analysis ................................................................................................................... 14
2.6 Conceptual framework ........................................................................................................ 16
CHAPTER THREE .................................................................................................................... 19
METHODOLOGY ..................................................................................................................... 19
3.1 Study Areas ......................................................................................................................... 19
3.2 Respondents ........................................................................................................................ 20
3.3 Sampling procedure and sample size .................................................................................. 20

viii
3.4 Data Types and Sources ...................................................................................................... 21
3.5 Data analysis ....................................................................................................................... 21
CHAPTER FOUR ....................................................................................................................... 25
RESULTS AND DISCUSSIONS ............................................................................................... 25
4.1 Descriptive Analysis ........................................................................................................... 25
4.1.1 Characteristics of common bean traders .......................................................................... 25
4.1.2 Common bean varieties traded in key selected markets and border points ..................... 30
4.1.3 Constraints to common bean trade ................................................................................... 31
4.2 Results of Integration Analysis ........................................................................................... 33
4.2.1 Price trends ................................................................................................................... 33
4.2.2 Unit root test results ...................................................................................................... 36
4.2.3 Co-integration test results ............................................................................................. 38
CHAPTER FIVE ........................................................................................................................ 42
SUMMARY, CONCLUSION AND RECOMMENDATIONS .............................................. 42
5.1 Summary and Conclusions .................................................................................................. 42
5.2 Recommendations ............................................................................................................... 43
5.3 Suggestions for further research .......................................................................................... 44
REFERENCES ............................................................................................................................ 45
APPENDICES ............................................................................................................................. 46
APPENDIX ONE: INTERVIEW SCHEDULE FOR TRADERS AND TRANSPORTERS
................................................................................................................................................... 46
APPENDIX TWO: INTERVIEW SCHEDULE FOR CUSTOMS OFFICIALS ............. 55

ix
LIST OF TABLES
Table 1: Eastern Africa common bean production in tons ............................................................. 2
Table 2: Cross border yearly volumes for common bean for the Year 2012 in metric tons ......... 11
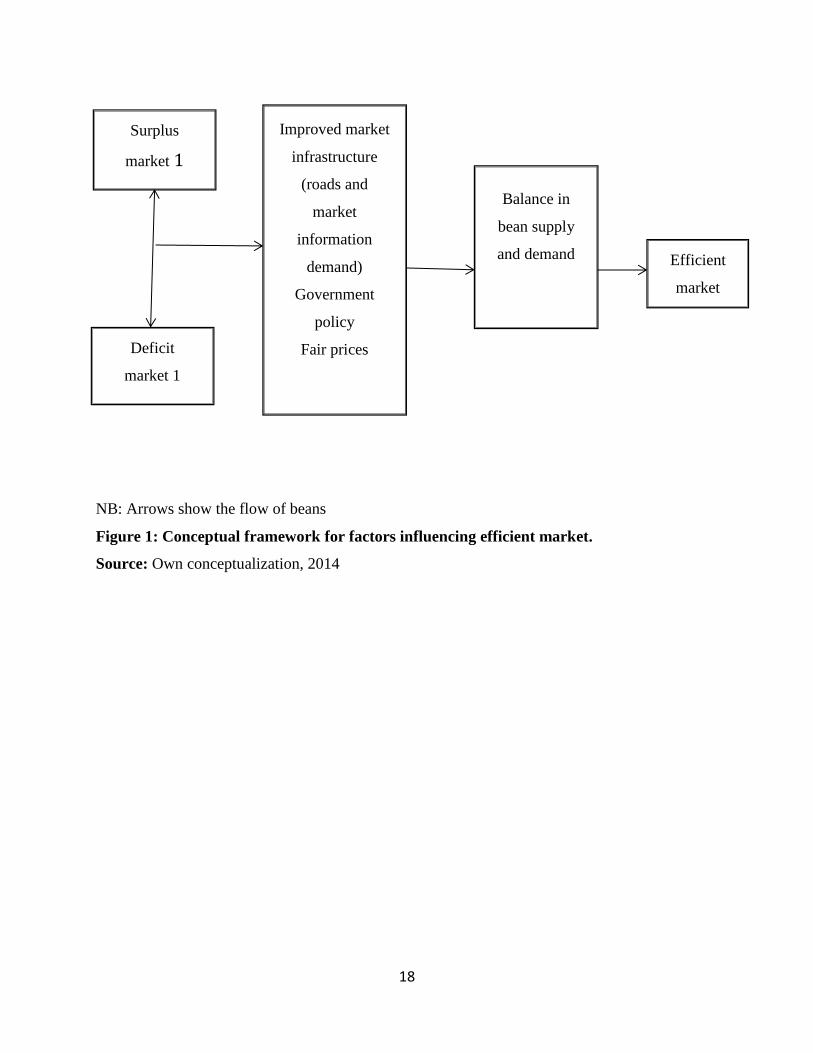
Table 3: Border points studied ...................................................................................................... 20
Table 4: Variables used in co-integration model .......................................................................... 24
Table 5: Age and Experience of common bean traders ................................................................ 26
Table 6: Types of common bean traders ....................................................................................... 28
Table 7: Category of common bean traders by gender ................................................................. 29
Table 8: Common bean varieties traded at the border points and key markets ............................ 31
Table 9: Constraints faced by traders............................................................................................ 32
Table 10: Unit Roots Test for Rosecoco Bean.............................................................................. 37
Table 11: Unit Roots Test for Mwezi moja Bean ......................................................................... 37
Table 12: Unit Roots Test for Mwitemania Bean ......................................................................... 38
Table 13: Cointegration tests between Nairobi and Mombasa and Nakuru for Rosecoco ........... 39
Table 14: Cointegration test between Nairobi and Nakuru markets for Mwezi Moja. ................. 40
Table 15: Cointegration tests between Nairobi, Mombasa and Nakuru markets for Mwitemania.
....................................................................................................................................................... 40

x
LIST OF FIGURES
Figure 1: Conceptual framework for factors influencing efficient market. .................................. 18
Figure 2: Overall level education level ......................................................................................... 27
Figure 3: Level of education by gender ........................................................................................ 28
Figure 4: Seasonal variation of Rosecoco bean prices in Nairobi, Mombasa and Nakuru ........... 34
Figure 5: Seasonal variation of Mwezi moja bean prices in Nairobi and Nakuru ........................ 35
Figure 6: Seasonal variation of Mwitemania bean prices in Nairobi, Mombasa and Nakuru ...... 36
xi
ACRONYMS AND ABBREVIATIONS
CIAT International Center for Tropical Agriculture
CGIAR Consultative Group on International Agricultural Research
COMESA Common Market for Eastern and Southern Africa
EAC East African Community
EABC East Africa Business Council
FAO Food and Agriculture Organization
FAOSTAT Food and Agriculture Organization Statistics
FEWSNET Famine Early Warning Systems Network
KEPHIS Kenya Plant Health Inspectorate Service
Kg Kilogram
Kshs Kenya shillings
RATIN Regional Agricultural Trade Intelligence Network
USD United States dollars

1
CHAPTER ONE
INTRODUCTION
1.1 Background information
The global economy is integrating rapidly through trade such that exports from developing
countries are becoming increasingly diversified. In turn, these countries have become less
dependent on agricultural exports than they were in the past. Currently, developing countries are
becoming their own best markets for agricultural products. This is as a result of countries trading
with each other. In order to facilitate trade in Africa, it’s important to remove bottlenecks that
hinder cross border trade such as; bribery, long custom procedures, and complex import/export
requirements. The Common Market for Southern and Eastern Africa (COMESA) and the East
African Community (EAC) are some of the regional bodies that facilitate trade. These trading
blocs harmonize and standardize trade procedures as well as the administration of border
controls. For example, the major role of the EAC Customs Union is to deepen the integration
process through liberalization and promotion of regional commercial integration through intra-
regional trade (EABC, 2008).
Trade in East Africa involves all types of goods such as agricultural commodities and
manufactured goods. Agricultural commodities flowing across the borders include staple food
commodities such as maize, beans, rice, fish, groundnuts and banana. Manufactured consumer
goods traded are shoes, textile, medicine, vehicles and bicycle parts (Uganda Bureau of
Statistics, 2007). It is estimated that 26% of Kenya’s exports to the EAC are evenly distributed in
Uganda, Tanzania and Rwanda. On the other hand, Kenya is a significant destination for
Tanzania’s exports estimated at 44% while Uganda’s exports to Tanzania are approximately 25%
(EABC, 2008). Of the agricultural goods traded in East Africa, common bean is the major staple
food that is traded across the borders (RATIN, 2011). In recent years, trade opportunities in
common bean for both exports within the Eastern and Southern Africa region have increased.
Kenya and Malawi show a huge potential for import market of common beans which can be
tapped by their neighbors, particularly Tanzania, Uganda and the great lakes region (Katungi et
al., 2009). Some of the bean corridors according to Pan-Africa Bean Research Alliance
(PABRA) are around North West Tanzania, Burundi, Rwanda and Eastern DRC into Kenya ;
2
South west Uganda, Northern Rwanda and Eastern DRC into Kenya; Northern Tanzania into
Kenya and Ethiopia including the rift valley destined to Kenya.
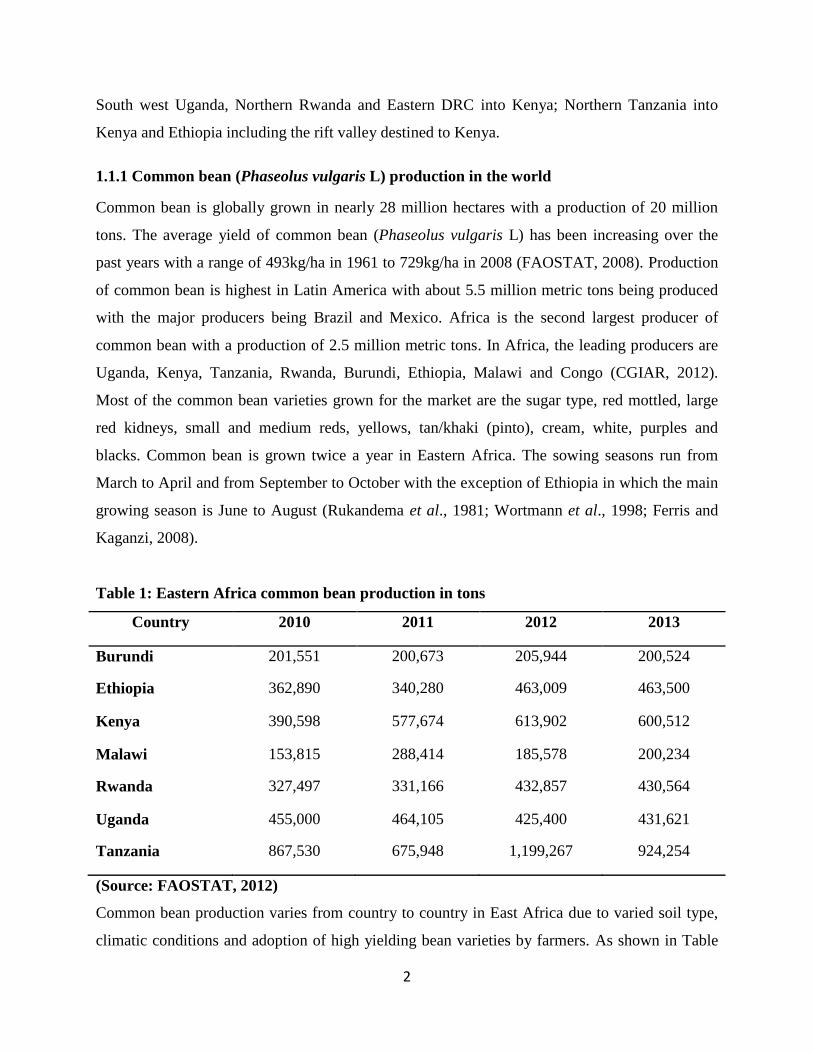
1.1.1 Common bean (Phaseolus vulgaris L) production in the world
Common bean is globally grown in nearly 28 million hectares with a production of 20 million
tons. The average yield of common bean (Phaseolus vulgaris L) has been increasing over the
past years with a range of 493kg/ha in 1961 to 729kg/ha in 2008 (FAOSTAT, 2008). Production
of common bean is highest in Latin America with about 5.5 million metric tons being produced
with the major producers being Brazil and Mexico. Africa is the second largest producer of
common bean with a production of 2.5 million metric tons. In Africa, the leading producers are
Uganda, Kenya, Tanzania, Rwanda, Burundi, Ethiopia, Malawi and Congo (CGIAR, 2012).
Most of the common bean varieties grown for the market are the sugar type, red mottled, large
red kidneys, small and medium reds, yellows, tan/khaki (pinto), cream, white, purples and
blacks. Common bean is grown twice a year in Eastern Africa. The sowing seasons run from
March to April and from September to October with the exception of Ethiopia in which the main
growing season is June to August (Rukandema et al., 1981; Wortmann et al., 1998; Ferris and
Kaganzi, 2008).
Table 1: Eastern Africa common bean production in tons
Country 2010 2011 2012 2013
Burundi 201,551 200,673 205,944 200,524
Ethiopia 362,890 340,280 463,009 463,500
Kenya 390,598 577,674 613,902 600,512
Malawi 153,815 288,414 185,578 200,234
Rwanda 327,497 331,166 432,857 430,564
Uganda 455,000 464,105 425,400 431,621
Tanzania 867,530 675,948 1,199,267 924,254
(Source: FAOSTAT, 2012)
Common bean production varies from country to country in East Africa due to varied soil type,
climatic conditions and adoption of high yielding bean varieties by farmers. As shown in Table

3
1, the production of common bean in Kenya has been increasing over the past years. Uganda's
common bean production has been steady with a slight drop in the year 2012 while in Tanzania
there has been a fluctuation in the four years with the highest production being in 2012. This is
due to increased acreage in Kenya, Uganda and Tanzania thus increase in productivity.
1.1.2 Common bean consumption in East Africa
Common bean provides dietary protein for over 100 million people in both the rural and poor
urban areas. Studies have shown that there is a high per capita consumption of common bean in
developing countries (13-40 kg per year) especially with low income families in urban and rural
areas (Singh, 1999). The per capita consumption of common bean is high in poor countries such
as Nicaragua (22.5 kg per capita per year) and in poorer regions of higher income countries such
as Northeast Brazil (18.5 kilogram per capita per year) (CIAT, 2012). Eastern Africa has the
highest per capita consumption in the world that ranges from 50 to 60kg (ISAR, 2011). The per
capita consumption of common bean in Kenya is estimated at 14 kg per year (Spilsbury et al.,
2004; Buruchara, 2007). Consumption of common bean in Karagwe district in Tanzania is higher
than the national average and is estimated at 13 Kg per year (Xavery et al., 2005). In Uganda the
per capita consumption of common bean is over 58 kg (Soniia, 1999).
Apart from the pulse being an important food source, common bean has the potential to generate
incomes if key markets are harnessed through contracts from other countries for the overall
development of the economies. In addition, production of common bean contributes to the
inputs, transport, processing, retailing, packaging and the formal and informal trade sector.
However, the importance of regional trade of bean appears underestimated with focus on
consumption and export markets. The improved bean varieties are not well known among most
smallholder farmers in Kenya thus the need to promote these varieties. This is because the
varieties developed in the 1980s that are low yielding and susceptible to diseases have been
passed from farmer to farmer and saved from season to season. According to the Ministry of
Agriculture Kenya (2009), the consumption of beans between 2004 and 2008 was approximately
464, 000 metric tons while the production was 357, 000 metric tons which resulted in a deficit of
107, 000 metric tons.
4
Over the last few years in Kenya, the price per ton of common bean has considerably increased,
from USD 760 in 2010, to USD 837.5 in 2011 then USD 866.1 in 2012 (FAOSTAT, 2013). This
price change significantly affects the purchasing power of poor people in both rural and urban
areas and also points to possible inefficiencies in grain distribution system between surplus and
deficit areas. According to Kibiego et al. (2003), common bean deficit in Kenya suggests an
apparent market failure to stimulate production. The deficit is caused by seasonal price
fluctuation and lack of statistical data on bean marketing. To ensure production of different
common bean varieties in the market at affordable prices, quantity and quality, an efficient
marketing system is required.
1.2 Statement of the problem
East African region produces most of the common bean in Africa and Kenya is a major
consumer of the bean. Despite increased regional trade and increased common bean production
in Kenya over the past years, demand still outweighs supply and consequently prices have
increased significantly. The constraints to common bean trade and effectiveness of the
marketing systems are not yet clearly known. Past studies have looked into the issue of market
information systems in the region with a view to strengthening it so as to correct supply and
demand imbalances. However, integration of bean markets has received less attention therefore it
is not known to which extent the border and major bean markets are integrated in the region to
facilitate steady product flows across markets. This knowledge would help stabilize bean prices
as well as increase its availability and consumption thereby contributing to food security and
nutrition at household level.
1.3 Objectives of the study
1.3.1 General objective
The broad objective of the study was to contribute to improved livelihoods of actors in common
bean trade through efficient marketing of beans across the borders.
1.3.2 Specific objectives
1. To determine the characteristics of common bean traders in key selected border points
and markets.

5
2. To determine the constraints to the observed trade in the selected border points and
markets.
3. To assess the extent to which markets of common bean are integrated in key selected
markets.
1.4 Research questions
1. What are the characteristics of common bean traders at key border points and markets?
2. What are the constraints to the observed trade in common bean?
3. What is the extent of market integration in key selected bean markets?
1.5 Justification of the study
One of the major policy needs in East Africa is to curb food insecurity and promote regional
trade. To attain this, the East African Community should aim at facilitating agricultural trade
among its members by eliminating some of the bottlenecks to cross border trade. This will
become increasingly important in linking food surplus areas to food deficit areas especially as
development is driven by increased population and activities in towns and cities. Thus, this study
sought to generate valuable information on most traded bean varieties and market integration
which can be used to develop the efficiency of trade in East Africa. Information on market flow
of common bean enables improvement of policies to increase marketing efficiencies and also to
maintain quality of varieties being developed by monitoring their movement across the borders.
Farmers will be able to produce bean varieties that are highly demanded in the market. Traders
will also benefit from the knowledge of the most traded varieties to trade in and which are the
best markets to trade in to increase their profit margin. The government will be able to formulate
policies to assist in promoting new drought tolerant and disease resistant bean varieties.
1.6 Scope and limitation of the study
This study focused on traders, transporters, crop inspectorate officials and customs officials at
the border points of which the sampling unit was from the key selected border points and
markets in Kenya. Reliance on memory recall of those traders and transporters who did not keep
records affected precision of the data collected but the study supplemented the information
through records kept by the customs officials at the border points. The study also utilized
secondary data on the monthly average prices for three bean varieties (Mwitemania, Rosecoco
6
and Mwezi moja) collected from the Ministry of Agriculture covering a period of three years
(2011 to 2013) because prices for different varieties were incomplete in earlier years.
1.7 Definition of terms
Common bean: It is used in this study interchangeably with bean and scientifically known as
Phaseolus vulgaris L.
Food security: The state in which the food demands of people are met at all times.
Cross border trade: The buying and selling of commodities with the seller being in one country
and the buyer being in another country.
Market performance: This study adopted the definition of market performance from Harris
(1993) as representation of economic results of the structure and conduct, in particular the
relationship between distributive margins and the costs of production and marketing services.
Market efficiency: This study adopted the definition of market efficiency from Barrett and Li
(2002) as the transfer of excess demand from one market to another, manifested in the physical
flow of the commodity, the transmission of price shocks from one market to another or both.
Market: Refers to a place where willing buyers and sellers exchange money for commodities.
Market integration: This is the flow of commodities from surplus to deficit markets and
transmission of price shocks from one market to another.
1.8 Outline of the thesis
This thesis is organized in five chapters. Chapter one gives the background of the research
problem addressed in this study. Chapter two describes the literature reviewed, conceptual and
theoretical frameworks. Chapter three describes the study area, sampling procedure and data
collection strategies used.
The results from this thesis are presented in chapter four whereby descriptive statistics results are
presented and discussed on the characteristic of traders and constraints to bean trade. Chapter
four analyzed market integration of Rosecoco, Mwitemania and Mwezi moja in the key selected
markets using co-integration model. Summary, conclusion and implications are represented in
chapter five.

7
CHAPTER TWO
LITERATURE REVIEW
2.1 Common bean varieties produced in East Africa
Preferences for common bean varieties vary among farmers, traders and consumers.
Furthermore, common bean varieties vary in their adaptation to diverse environments including
the biotic and abiotic stress factors (Chirwa et al., 2007). Bean varieties can be classified into
nine major classes according to color and size as follows: pure large reds, medium and small reds
and red mottled, purple, yellow and tans, cream, navy/white and black. The red and the red
mottled are the most common types due to market preference (Wortmann et al., 1998). Further,
literature notes that, a wide range of seed colors and sizes is acceptable in many common bean
production areas in Africa (Van Rheenen, 1979; Grisley and Mwesigwa, 1991a; Voysest and
Dessert, 1991; Grisley and Munene, 1992). The large and the medium sized seeds are mostly
preferred but also small seeds are acceptable.
Tanzania's production of common bean includes both local and improved varieties which differ
by color, shape, size and properties such as cooking time and digestibility (Wortmann et al.,
1998 and Fulgence et al. 2009). The most common varieties grown in Tanzania are the
Lyamungu 85 and the large red/brown Calima, or Rosecoco. This is because of their relatively
high and stable productivity under moderately good growing conditions and the high market
preference in Kenya (Wortmann et al., 1998). Other studies done by Kweka et al. (1998) and;
Nkonya et al. (1998) found the Lyamungu 85 was rapidly adopted than Canadian wonder in
Northern Tanzania because it cooked fast and its palatability is better than Canadian wonder.
Other varieties include Soya 4 and 5, Canadian wonder, Tikyakuponza and Lyamungu 90. Soya is
preferred by urban consumers in towns of Northern zone and some of the coastal towns like
Tanga, Dar es Salaam and Zanzibar and it also fetches high prices in the market (Katungi et al.,
2009). The purples locally known as Mwezi moja in Tanzania are preferred in Dar es Salaam
because it cooks quickly, is tasty and produces a reddish broth (Wortmann et al., 1998).
According to Korir et al. (2005), majority of retailers in northern Tanzania preferred Soya (a
local, medium sized, purple bean) to other varieties because it sells faster, has low flatulence,
cooks faster and is very sweet.
8
In Kenya the common bean varieties grown are the large red kidney beans, medium and small
reds, the creams, pinto sugars, browns and the purples. Some of the multiple bean varieties
grown are AFR708, G2333, KATX56, KATB1, and RWR719 which are of good color, liked by
many sellers and are of good taste (Buruchara, 2007). A different study found out that the most
commonly grown and marketed varieties in Kenya are GLP-2 (Rosecoco), GLP-24 (Canadian
wonder), GLP-x-92 (Mwitemania), GLP-585 (red haricot) and GLP-1004 (Mwezi moja)
(Munene and Grisley, 1992; Mbugua and Munene, 1997). KATX56 is the most preferred variety
for production because it has a stable yield even in stress conditions and also high yielding in
favorable situations. In contrast to Tanzania retailers, the majority of Kenya retailers preferred
Nyayo (Korir et al., 2005). According to Grisley and Munene (1992), the Calima (or Rosecoco)
has a high market preference in Kenya. According to Korir et al. (2005), Kenya residents in
Githuria have a preference for the Red Harricot beans because of the strong red color that
blended with maize when cooked together. On the other hand, Mwitemania was preferred by
residents in Taita Taveta.
The major bean varieties in Uganda include: large seeded red-mottled, the purple, red type and
the pale and white colors. The large red-mottled varieties comprise traditional types such as K20,
a variety developed by the national research programme in the 1960's (Rubaihayo et al., 1981)
and the semi climbers NABE 4 (locally known as Nambale). Other local grain types available in
the country are medium size types such as red-medium type (Kayinja) and the brown-red oval
(Kanyebwa). In Northern Uganda, there is the small-seeded (locally known as Lango) and are
usually black or creamed colored bush bean varieties. In addition, there are some new improved
varieties by the national research organization (NARO) and other partners and these varieties
have received high market reception especially K131, K132 and NABE 2 (Kalyebara, 2008).
K132 and NABE 4 are preferred for their large seed size, desired market qualities, short cooking
time and shorter maturity period.
2.2 Common bean trade in East Africa
Most recent studies have shown that there exist two types of trade in the East African region that
is, the formal and informal trade. Informal cross border trade is more dominant in East Africa
due to a number of factors including: traders’ tendency to evade the previously high export taxes
9
and import duties, bureaucratic licensing, registration requirements and market failures as a
result of poor policies adopted by countries and poor infrastructure (Tchale, 2002).
According to Mauyo et al. (2011), the participants involved in the common bean marketing
business in Kenya and Uganda are farmers, middlemen, upcountry assemblers, long distance
wholesalers, agents, wholesalers based in each country, exporters, retailers and consumers. In
Tanzania, those involved in cross border common beans trade are traders, agents, transporters
and consumers. The traders consist of wholesalers, retailers and informal hawkers/dealers (Ogutu
and Echessah, 1998). The agents buy common beans at the farm gate where they can either sell
in small quantities directly to consumers from their stores or sell them to large traders during
peak periods. Travelling traders collect sufficient volumes from the agents and are always
individual operators whereas the transporters simply transport common beans from large traders
into the major urban centers. Wholesalers role in the commons beans trade is to provide large
storage facilities to bulk commodities and send them to urban retailers, export houses or cross
border traders. On the other hand, retailers directly sell to consumers in small amounts and they
are the participants who add the highest margin to common beans. The exporters in common
beans are specialized operators involved in large scale procurement, cleaning, grading and
rebagging.
In Uganda most traders sell beans by weighing in kilograms with a few in 2kg tins while in
Kenya most traders sell in 2kg tins. In addition, traders arrive at uniform prices of beans by
agreeing among themselves on the prices to sell depending on the demand and the supply of
beans. In farmsteads located in areas with limited access to commercial motor vehicles, people
use bicycles to transport common beans from farms to rural markets or to the stores of the
commission or market agents. When moderate quantities are involved, pick-ups are used with
respect to transporting from rural to urban areas while lorries are used to transport large
quantities of common beans to final destination especially outside the country. Traders of
common beans experience problems of high cost of transportation during rainy seasons due to
poor road condition as compared to dry seasons (Mauyo et al., 2010).

10
Tchale (2002) analyzed the informal cross border trade of beans in Eastern and Southern Africa.
He concluded that cross border markets provide a niche market that can ensure income and food
security to millions of small scale bean producers in the region. In addition, informal movement
of bean varieties has implication on the quality of the varieties released by the bean breeding and
dissemination programs. Tchale (ibid) also suggests that, informal markets should be encouraged
in order to improve the benefits to small scale farmers resulting from increased bean trade in the
region. Furthermore, opportunities offered through cross border markets should be explored as
these markets provide an important outlet for producers who may not have access to domestic
markets due to poor infrastructure and internal marketing inefficiencies.
Mauyo et al. (2011) analyzed cross border trade between Kenya and Uganda using both primary
and secondary data. Using the concentration model, they indicated that, at the wholesale level,
the bean structure was moderately concentrated with competitive fringe in both Uganda and
Kenya. At the retail level, the markets in both Kenya and Uganda were well dispersed with a
number of traders controlling only small amount of beans in each market. They concluded that,
high quality beans fetched higher prices in both Uganda and Kenyan markets. Furthermore, they
found out that majority of traders in Uganda sorted their beans and on the contrary, majority of
these traders in Kenya did not sort/grade their beans. In addition the study found that, pricing of
common beans was determined by the market forces and that uniform prices were arrived at by
traders who agreed among themselves on the prices that they were to sell depending on supply
and demand of each day. Kenya has been importing beans from Ethiopia, Uganda and Tanzania
despite being the seventh largest producer in the world. For the period 2004-2008, the country’s
total value of bean imports amounted to about US$ 5.3 million while total value of exports
estimated at US$ 624, 000 over the same period. This shows that Kenya imported of beans 10
times what it exported (USAID, 2010).
The studies clearly show that Kenya is the major importer of common beans in East Africa.
Katungi et al. (2009), states that some of the factors that contribute to high demand of common
beans in Kenya are high population growth rate, weather turbulence and declining to stagnant
yields. Therefore to offset this demand, Kenya has to import common beans from neighboring

11
countries. As shown in Table 2, a lot of common beans were destined to Kenya from Uganda and
Tanzania through various border points.
Table 2: Cross border yearly volumes for common bean for the Year 2012 in metric tons
Border Vol (MT) Source Destination
Busia 119,332.00 Uganda Kenya
Gatuna 2,420.40 Rwanda Uganda
Lwakhakha 1,311.92 Uganda Kenya
Malaba 2,561.05 Uganda Kenya
Mutukula 2,388.00 Tanzania Uganda
Namanga 519.35 Tanzania Kenya
Oloitoktok 226.00 Tanzania Kenya
Source: Regional Agricultural Trade Intelligence Network (RATIN 2011)
The findings of EASSI (2012), on the paradox of women cross border traders indicated that,
majority of cross border trade; especially the informal is conducted by women who run small
businesses. The challenges the women faced included travel security risk, poor infrastructure that
increases the cost of transporting goods across the borders, discrimination and harassment by
border officials, complexities of cross border trade regulations and lack of market information.
2.3 Market integration analysis
Market integration is an important determinant of food flow, availability, accessibility and price
stability. The extent to which markets make food available and accessible, and keeps prices
stable depends on the degree of market integration across the region (Nyange, 1999). Barrett and
Li (2002) consider market integration to be most usefully defined as the tradability or
contestability between markets. This implies the transfer of excess demand from one market to
another, manifest in the physical flow of the commodity, the transmission of price shocks from
one market to another or both. A different study states that market integration is associated with
price transmission, which measures the speed of traders’ response in moving food to deficit
zones (WFP, 2007).
12
According to Mushtaq, Gafoor and Dad (2008), markets that are not integrated could result in the
inefficient allocation of resources. Kose, Prasad and Terrones (2003), state that, markets that are
integrated perform better in improving per capita income and standards of living. Market
integration is a tool that ensures that regional balance is maintained between food deficit and
food surplus regions and that food will always move to where there is high demand and where
the prices are also high. Markets that are integrated need to share the same traded good and the
same long run information. The information does not have to be processed simultaneously but
the markets need to be connected by trade and long run information either directly or indirectly
(Gonzalez-Rivera and Helfand, 2001).
Over the last few decades, market integration studies have had a wide application. In agriculture
for instance, it has been used to determine the overall performance of the market. Various
authors have applied different methods and techniques in studying market integration.
Correlation and co-integration analysis are the most used but have failed to account for
transaction costs and non-linearity (Moser et al., 2009). The correlation analysis of market
integration has been used widely. Price series correlation is regarded as convenient indicator of
market integration (Basu, 2006). Two variables are correlated if a change in one variable brings
about a change in another. The variables will be perfectly negatively correlated if they have a co-
efficient of negative one. They will not be correlated if the correlation is close to zero
(Boisseleau and Hewicker, 2002). This method has methodological flaws such as: failure to
recognize common exogenous trend, seasonality or autocorrelated and heteroskedastic residuals
in the regression with non-stationary price data (Basu, 2006). In addition, correlation cannot
account for many real world complexities (Vollrath, 2003).
Meyers (2008) studied long run and short run integration of maize in six markets in Malawi
using the co-integration approach within the vector autoregressive modeling framework. He used
monthly maize retail prices for period January 2000 to May 2008 and found out that nine out of
the fifteen market pairs were integrated in the long run and short run market integration was low
implying slow price transmission. Mayaka (2013) assessed market integration of dry beans in
four markets in Kenya using price data from the periods 1994 to 2011. The study found out that
all the four markets were co integrated and the Granger causality test confirmed independent
13
causality with only one market link showing bi-directional causality leading to symmetric price
adjustment between Kitale and Nairobi market. However this study only generalized dry beans
and did not take into consideration the different varieties.
Barrett and Li (2002) incorporated the effect of transaction costs in the co-integration analysis
which is considered as a major problem that affects continuous trade and the direction of trade
flow. They introduced a mixture distribution model which takes into account transfer costs and
trade flows. The model considers the correlation between trade flows; price spread and cost
transfers to explain the four potential market conditions that exist: perfect integration, segmented
equilibrium, imperfect integration and segmented disequilibrium. Wim et al. (2010) used co-
integration analysis and vector error correction model to analyze market integration and utilized
wholesale weekly rice prices over a period of between January 2004 to November 2006. They
found out that there existed at least three co-integrating vectors implying that, rice markets in
Bangladesh during the study period were moderately linked together and that the long run
equilibrium was stable. They also found out that the speed of price transmission between the
divisional markets were weak.
Mumbeya (2011) analyzed value chain and market integration of cassava in the Democratic
Republic of Congo. He used co-integration techniques, an error correction mechanism and an
index of market connection. The study established that among the eleven pairs of markets, six of
them were segmented implying that price changes in the reference markets were fully
transmitted to the regional market. Du Preez (2011) analyzed market integration within the
potato industry in eight selected markets in South Africa and used weekly data ranging from
January 1999 to June 2009. The study determined market integration by applying the threshold
vector error correction model and based on the results, there existed long run relation between all
the markets and the markets were not integrated in the short run.
Studies in East Africa and especially Kenya have concentrated on dry beans in general and have
not taken into account the different varieties. This study therefore analyzed market integration of
key major bean varieties.
14
2.4 Price analysis
To help judge the extent of efficiency of the marketing system, price movement analysis in
varietal commodities in corresponding and linked markets is used. The observed trends in price
changes over years in the long run are associated with developments in technology of production
input, supply and infrastructure. Time series of prices and quantities can be analyzed using
various methodologies ranging from simple graphs, regression or autoregressive integrated
moving average (ARIMA) model. Time series has been decomposed by the classical model into
different components such as trend (T), cyclic (C), seasonal (S) and random (E) indices (Goetz
and Weber, 1986).
The variations in market prices can be classified as temporal variation and spatial variation.
Temporal variation is as a result of mixtures associated with cyclical, seasonal and irregular
components. The seasonal component is the most important. Spatial price variation is the
variation in the prices observed in different markets and they occur due to the differences in the
location of production and consumption centers. Inter relationship between prices movements in
different markets mostly depends on nature and extent of competition, dissemination of market
information and the attitude of market functionaries. The degree to which wholesale prices of a
commodity in different markets are related to one another determines the efficiency of any
marketing system.
Kohls and Uhls (1998) are of the opinion that, pricing signals guide and regulate production,
consumption and marketing decisions over time, form and place. Price relationships between
spatially separated competitive markets depend on the size of transaction cost. As price
differences between different markets exceed transaction costs, arbitrage opportunities are
created which make profit seeking participants to exploit this opportunity by purchasing
commodities from low price surplus market and transferring them to higher price deficit areas.
According to Tomek and Robinson (1990), arbitrage opportunities occur only when the deviation
in price is substantial enough for potential profit to exceed the cost of trading. This then raises
prices in the surplus region and reduces them in the deficit region.

15
Tomek and Robinson (1990) further state that, the principle underlying the differences between
regions in a competitive market structure with homogenous commodities is that price differences
between any two regional markets that trade with each other should equal transaction cost. In a
situation of autarky price differences will be less than or equal to transaction costs. According to
Negassa, Myers and Gabre-Madhin (2003), price relationships between spatially separated
markets are generally analyzed within the framework of spatial price equilibrium theory
developed by Enke (1951), Samuelson (1964) and Takayama and Judge (1964). The key
assumption underpinning spatial price equilibrium theory is that price relationships between
spatially separated competitive markets depend on the size of transaction costs. Prices are an
important tool in the economic analyses of markets (Oladapo and Momoh, 2008). The overall
functioning of the market can be better understood by analyzing the vertical or spatial price
transmission between markets. The level of market competitiveness can be determined by
studying the extent and speed with which shocks in prices are transmitted within the marketing
chain (Serra and Goodwin, 2002a).
Vollrath (2003) extends the law of one product to international markets stating that, prices will
equalize across freely trading areas. In addition homogenous goods will sell for the same prices
in different countries taking the exchange rate into account. If two markets are integrated, a
shock in any of the markets in either demand or supply and ultimately price should be
transmitted to the other market (Barrett, 1996; McNew and Fackler, 1997; Boisseleau and
Hewicker, 2002; Negessa et al., 2003; Mushtaq et al., 2008). Markets that are normally
integrated exhibit long run relationship between their prices (Balke and Fomby, 1997; Vollrath,
2003; Negassa et al., 2003). In the short run spatial prices can deviate from each other but still be
integrated (Vollrath, 2003).
2.5 Theoretical framework
Market integration can be vertical, spatial or inter-temporal. Vertical integration involves
different stages in marketing and processing channel. In spatial integration, spatially distinct
markets have prices that move together and price signals and information are transmitted
smoothly. Finally, inter-temporal market integration refers to arbitrage across a period of time.
Spatial market integration is the long run relationship of prices. It is the smooth transmission of
16
price signals and information across spatially separated markets (Golletti, Ahmed and Farid,
1995; Ghosh, 2000).
The idea of spatial market integration is always expressed as the law of one price. Market
integration depends on trade action and its operational environment, which is determined by
transportation and communication infrastructure availability and the policies that affect price
transmission (Gilletti et al., 1995). Fackler and Godwin (2001), point out that, although majority
of authors have focused on whether or not markets exhibit spatial integration, only a number of
them have explicitly evaluated the determinants of market integration.
If geographically separated markets are integrated, then there exists an equilibrium relationship
(Goodwin and Schroeder 1991 Sexton et al., 1991). Co-integration model in market integration
is usually performed to determine whether price of a commodity in a local market is related to
change in the central market (Ghoshray, 2009; Ravaillion, 1986). The long run equilibrium
relationship for analyzing market integration is as follows:
Yt = α + βXt + Ut…………………………….………………………….. ……………… (1)
Where; Yt and Xt = commodity prices of a homogenous good (common beans in this case), in
two different markets at time t, and α and β are parameters to be estimated. If two markets are
perfectly spatially integrated, then β =1. If this holds, then price changes in one market are fully
reflected in alternative market. When β ≠ 1 (i.e. β< 1 or β> 1), then the degree of integration may
be evaluated by investigating how far the deviation of α1 is from unity.
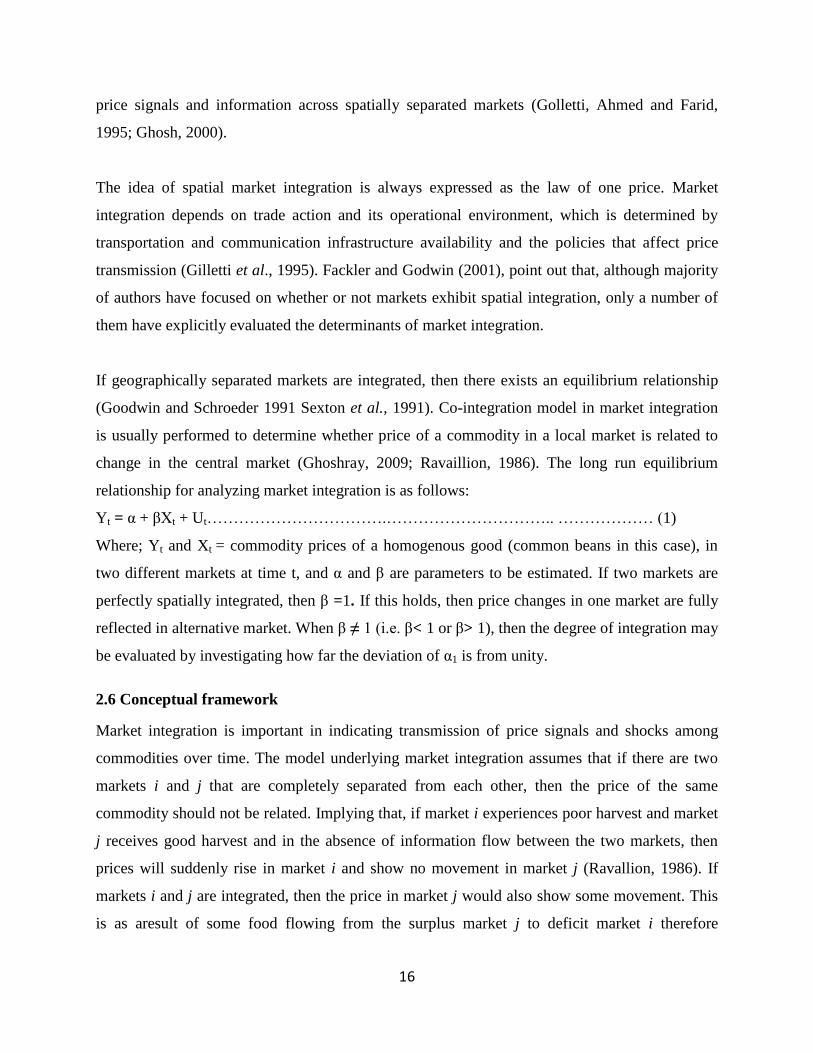
2.6 Conceptual framework
Market integration is important in indicating transmission of price signals and shocks among
commodities over time. The model underlying market integration assumes that if there are two
markets i and j that are completely separated from each other, then the price of the same
commodity should not be related. Implying that, if market i experiences poor harvest and market
j receives good harvest and in the absence of information flow between the two markets, then
prices will suddenly rise in market i and show no movement in market j (Ravallion, 1986). If
markets i and j are integrated, then the price in market j would also show some movement. This
is as aresult of some food flowing from the surplus market j to deficit market i therefore

17
decreasing the food supply in market j. The prices in market i would go down because of the
increased supply from market j. The co-movement of prices gives a degree of market integration.
The conceptual framework below shows that an efficient market or integrated market depends on
balance in trade which is brought about by improved market infrastructure, government policies
and fair prices in the market. If the marketing costs are high then the volume, price, variety and
quality of bean that is supplied in the market will be low to meet the rising demand in the market.
Government policies which bring about the trading regimes and constraints or challenges such as
bribery, long custom procedures and high fee charges at the market that are faced by both the
transporters and the traders play a major role in influencing the adequacy of the volumes and
quality of bean that is traded between the surplus and deficit market. Rigid trading regimes
discourage traders and transporters from trading in large volumes of beans which also impacts on
the prices received by consumers and the quality and variety of beans in the market. The
characteristics of the bean trade in terms of traders characteristics such as age, gender, education
level, distance to the market or border point, years in education and the nature of business all
have an impact on the volumes, varieties and prices of common bean that is traded.
18
NB: Arrows show the flow of beans
Figure 1: Conceptual framework for factors influencing efficient market.
Source: Own conceptualization, 2014
Surplus
market 1
Deficit
market 1
Efficient
market
Balance in
bean supply
and demand
Improved market
infrastructure
(roads and
market
information
demand)
Government
policy
Fair prices

19
CHAPTER THREE
METHODOLOGY
3.1 Study Areas
This study involved selection of key border points within East Africa. There are about ten border
points in Kenya. The study covered four major border points namely Busia, Malaba, Isebania
and Namanga: These border points were purposively selected due to the extent of bean activities,
nature of trade and the volumes of common beans that they handled.
Busia border is mainly an exit point for goods destined for Uganda from Kenya and vice versa.
There is substantial trade that goes on between Kenya and Uganda however; the trade in
agricultural commodities is in favor of Uganda. Imports from Uganda are mainly maize, beans,
bananas, tomatoes, dried cassava chips, water melon and pineapples. The exports to Uganda are
mainly Irish potatoes and cabbages but in small quantities. Trade in common beans mainly takes
place between the months of May to August.
Malaba border point is mainly for goods on transit, with small imports that pass for local
consumption. The main imports through this border are cereals, beans, water melon, bananas and
mangoes. Exports are mainly passion fruits and onions which are in small quantities.
Isebania border point is located in Kuria district bordering Tanzania. This point has a district
agricultural officer stationed permanently here in collaboration with an officer from KEPHIS.
Imports from Tanzania mainly include beans, cotton seed cake, rice bran, rice, oranges,
tomatoes, green grams, water melons, sweet potato and maize. It handles relatively high amounts
of common bean.
Namanga is one of the busiest borders between Kenya and Tanzania. It serves as an entry point
for commodities destined to the Nairobi market and the transit goods to other countries through
the Jomo Kenyatta International Airport (JKIA). It is also the entry point for commodities
destined to other parts of the country. It handles commodities such as dry maize, oranges,
watermelon, livestock, onions and beans. Common beans are traded throughout the year.
20
Table 3: Border points studied
Province/border
name
Neighboring
countries
Isebania Tanzania
Busia Uganda
Malaba Uganda
Namanga Tanzania
The study also involved three selected key markets in Kenya. The criteria for selecting the
markets was generally based on their position from the selected border points i.e. whether they
are surplus or deficit region and the potential demand for common bean. These markets were
purposively selected due to the following reasons: Nakuru is a major cosmopolitan town and a
production zone with relatively high demand for common bean. Nairobi is a consumption zone
with a high real and potential demand for bean and most of the common bean from the border
points is destined to Nairobi. Mombasa also a consumption zone and the largest town in the
coastal region for both retail and wholesale market for common bean which is served by
Namanga border point.
3.2 Respondents
Respondents interviewed included traders and transporters of common beans to get information
on their characteristics and the constraints they face in the common bean trade. Customs officials
at the border points or crop inspectorate officers were also interviewed on the quantity of both
formal and informal trade of common bean and the varieties of common bean crossing the
borders.
3.3 Sampling procedure and sample size
A multistage sampling technique was used in this study to arrive at a sample of 240 traders. The
four border points and three key markets were purposively selected. The second step involved
snowballing to determine the traders. At least two transporters were interviewed and one
Kephis/customs official was interviewed from each border point.
In determining the sample size for traders, the formula as developed by Groebner and Shanon
(2005) was used as follows:
21
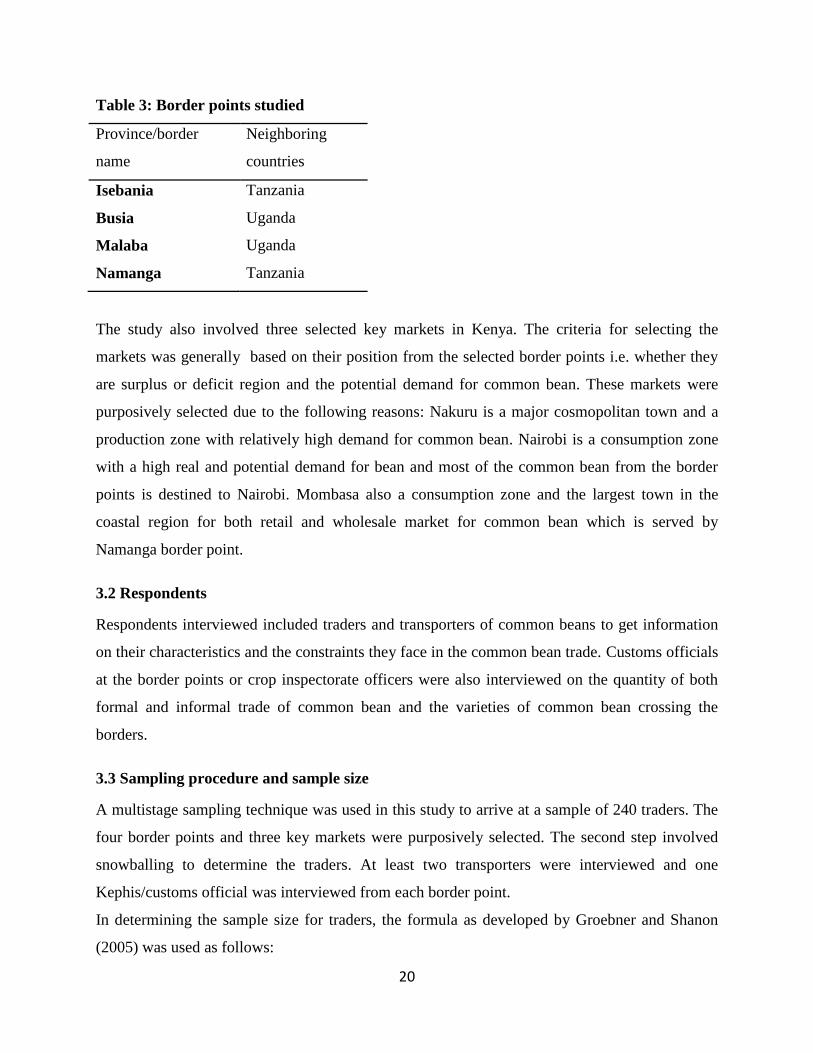
𝑛 = (𝑧2 𝑝𝑞)/𝑒2 ………………………………………………………………… (2)
Where:
n = sample size
p = proportion of the population of interest
q = 1-P (the weighting variable)
z = standard variate at confidence level ( = 0.05)
e = margin of error
The area under the normal curve corresponding to 95% confidence interval is 1.96 (z value in the
statistical tables). Using a p value of 0.5 and acceptable error of 8.95%, a sample size of 120 was
obtained. This was replicated for both the border points and key markets. The sample was then
proportionately disaggregated as follows for the four the four border points and three key
markets based on the proportion of bean traders in each market. Busia (68), Namanga (32),
Malaba (5), Isebania (15), Nairobi (60), Nakuru (30) and Mombasa (30).
3.4 Data Types and Sources
This study utilized both primary and secondary data. The secondary data consisted of common
bean monthly average prices for the years 2011 to 2013 collected from the Ministry of
Agriculture Kilimo House Nairobi in the Agribusiness and Marketing department. Primary data
was collected from the common bean traders and transporters using a structured interview
schedule. Data collected included characteristics of traders, different types of common beans
traded, prices of common beans, place where beans are bought and sold, frequency of trade per
month, mode of transport, challenges traders and transporters face and market information.
3.5 Data analysis
Objective one: Characteristics of common bean traders at key border points and markets.
Descriptive statistics (mean, frequencies, standard deviation and graphic representation of the
results in charts) was used to establish the following parameters; gender, age, level of education,
number of years in business and category of trade (transportation, wholesale and retail).
Objective two: Determination of constraints to the observed trade.
22
Descriptive statistics were used in the comparisons of the quantity of different common bean
varieties traded and the constraints traders faced. This included the use of frequencies, mean,
cross tabulation and percentages.
Objective three: Assessing extent of market integration for common bean.
This analysis provided important information on the product movement mechanisms and
technical information on spatial prices behavior. Relationship among prices in key markets was
checked using co-integration analysis. A long run linear relationship exists if different price
series are co-integrated. If geographically separated markets are integrated, then there exists an
equilibrium relationship (Goodwin and Schroeder 1991 Sexton et al., 1991). Co-integration
model in market integration is usually performed to determine whether the price of a commodity
in a local market is related to change in a central market (Ghoshray, 2009; Ravaillion, 1986). The
long run equilibrium relationship for analyzing market integration is as follows:
Yt = α+ βXt + Ut…………………………….………………………….. ……………… (3)
Where; Yt and Xt = commodity prices of a homogenous good (common beans in this case), in
two different markets at time t, and α and β are parameters to be estimated. If two markets are
perfectly spatially integrated, then β =1. If this holds, then price changes in one market are fully
reflected in alternative market. When β ≠ 1 (i.e. β< 1 or β> 1), then the degree of integration may
be evaluated by investigating how far the deviation of α1 is from unity.
A two-step model by Engel and Granger (1987) was used since price time series are usually non-
stationary and because standard statistical models do not allow explicit determination of α and β.
The first step was to determine the order of integration of each price series by checking for
stationarity. A time series (say Yt) is stationary if the joint distribution of Yt and Yt + t is
independent of time (t). Augmented Dickey-Fuller test was used to determine the order of
integration. This was achieved by regressing ∆Yt on Yt-1 and several lags of ∆Yt (enough to avoid
auto correlated disturbances).
The model was specified as:
∆Yt = α0+ α1 Yt-1 + Σ αk+t ∆Yt+k + ε t……………………………………………………(4)
Where: ∆Yt is the first difference of prices in market Y, Yt-1 is the lagged price of common beans
in market Y, α0 and α1 are parameters to be estimated, ε t is the error term.
23
The t-statistic on the estimated coefficient of Yt-1 was used to test the hypothesis that:
Ho: Yt ~ I(1) Vs H1: Yt ~ I(0)
If the null (Ho) above cannot be rejected then Yt cannot be stationary, it can be integrated of order
one or even higher. To find out the order of integration the test was repeated with ∆Yt in place of
Yt thus regressing ∆∆Yt on a constant ∆Yt-1 and several lags of ∆∆Yt. ADF test was then used
to test the hypothesis that:
Ho: ∆Yt ~ I(1) Vs; H1: ∆Yt ~ I(0)
i.e Ho: Yt ~ I(2) VS; H1: Yt ~ I(1)
This process was continued until the order of integration was established. The second step
involved testing for co-integration based on the idea that if two time series (eg. Yt and Xt) are
each ~ I (1), then their residual (say Ut) was integrated of order zero (stationary). Where Ut = Yt
– α – βXt. The residual (Ut) was then tested for stationarity. The ADF tests applied to these
residuals should yield statistics which are large and negative so as to reject the null hypothesis of
I (1) in favor of stationarity.
If the first step shows that each time series is integrated of order one, and if the second step
results to a stationary residual, then the two time series are said to be co-integrated. This implies
that long run equilibrium relationship exists between the two sets of prices. To have a distinction
between short-run and long-run integration, an Error Correction Model (ECM) was used. This
allowed for derivation of the speed of price transmission from one border point/market to
another.
The error term in the co-integration was treated as the equilibrium error. To tie the short run
behavior of Yt to its long run value, the ECM will be specified as:
∆Yt = α0+ α1 ∆Xt+ α2Ut-1 + ε t ………………………………………………………… (5)
Where; ∆ = first difference operator, ε t = random error term and Ut-1 = (Yt-1 – α – βXt-1)
ECM states that ∆Yt depends on ∆Xt and also on equilibrium error term, while absolute values of
α2 decide how quickly equilibrium will be restored (speed of adjustment).

24
Table 4: Variables used in co-integration model
Variable Description Measurement Expected sign
NrbPr Price of common bean in Nairobi Kenya shillings +
NkrPr Price of common bean in Nakuru Kenya shillings +
MsaPr Price of common bean in Mombasa Kenya shillings +

25
CHAPTER FOUR
RESULTS AND DISCUSSIONS
This chapter presents the findings from the study of common bean cross border trade. The
chapter is divided into two sections. The first section presents the descriptive results comprising
types of traders, age, gender, experience, level of education of traders, varieties traded and
constraints to bean trade. The second section of the chapter discusses empirical results of market
integration of the three selected markets in Kenya.
4.1 Descriptive Analysis
4.1.1 Characteristics of common bean traders
The results in Table 5 show that the mean age of all sampled traders was 38.97 with the mean
age for women and men traders being 40.79 and 36.34 respectively. This shows that female
traders were older than the male traders. This could be due to the fact that women began trading
in beans at an older age due to family obligations. Some of the women respondents mentioned
that they had to take care of the young children until they reached a certain age before they could
venture into trade. It was also found that, the mean trading experience for all sampled traders was
7.64 years. Women traders averaged more years in trading than their men counterparts (7.9 years
versus 7.2 years for men). As shown in Table 5, majority of women traders had more experience
in the bean trade with the maximum experience being 47 years in bean trade and minimum
experience being 6 years. The highest number of years that men stayed in the trade was 25 years
and the minimum being a year. The results show that all the variables tested had p>0.05
indicating that there was no significant difference between the women and men traders in terms
of age and experience.

26
Table 5: Age and Experience of common bean traders
Aggregate t-value p- value Women Men
Age Mean 38.97 40.79 36.34
Std.
deviation 0.71 -0.67 0.50
1.01 0.89
Experience Mean 7.64 0.13 0.90 7.86 7.21
Std.
deviation 6.69
7.62 5.16
Min 6.00 1.00
Max 47.00 25.00
Women traders= 141; men= 99
Education level of common bean traders
The findings showed that more than half (57.58%) of traders had secondary school education.
Majority of them felt that it was valuable to be educated to secondary school level as it gave
them an advantage on record keeping, credit access, getting information of sources of bean
supply and knowing their customer needs over those who did not reach secondary school level
(see figure 2 below). Masinjila (2009) also found similar results that majority of traders felt it
was advantageous to be educated to secondary school level to engage in meaningful cross border
trade. From the results, 28.13% of the traders had attained primary education while those without
formal education constituted 7.36%. Those traders who attained post-secondary school education
and secondary long cycle accounted for 3.03% each and they outnumbered those traders who had
reached early childhood education (0.87%).

27
Figure 2: Overall education level of common bean traders
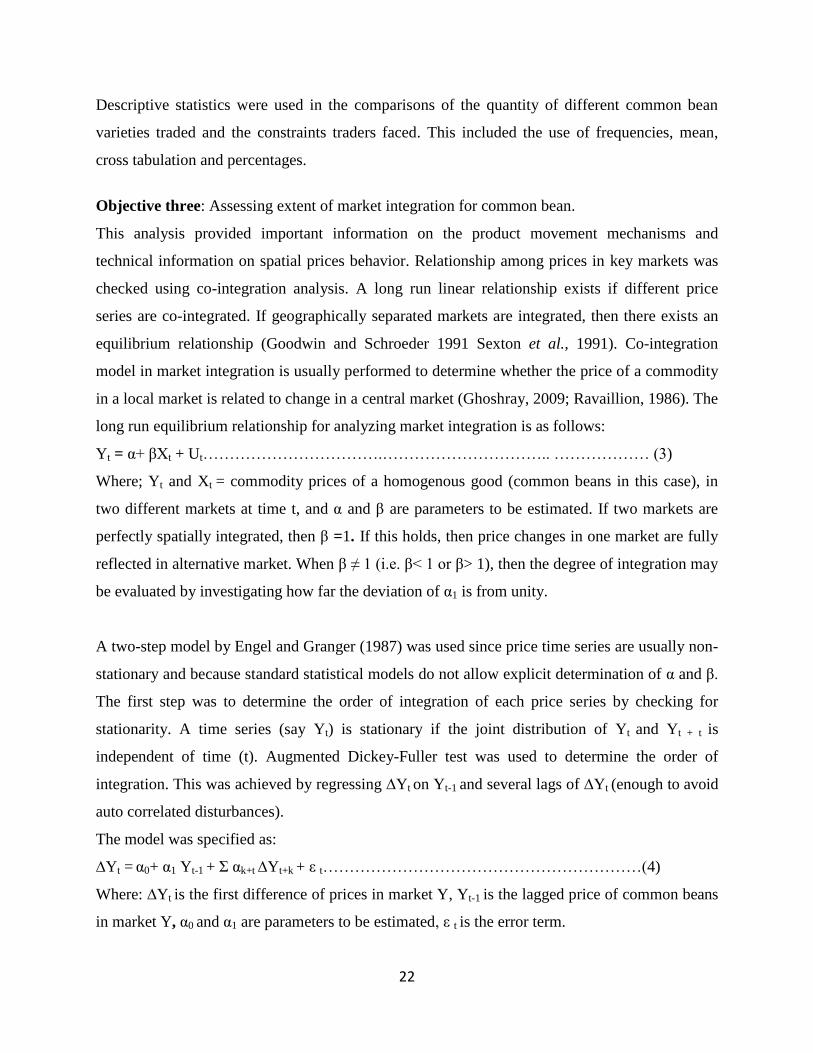
Figures 3 (a) and (b) show the level of education by gender. These findings reveal that male
traders tend to be more educated than women traders. The results show that most traders had
attained secondary education in which 64.21% were men while 52.94% were women traders.
30.15% of women traders and 25.26% of men traders had achieved primary level education.
About 11.03% of the women traders had no formal education. In contrast, only 2.11% of men
traders had no formal education. The relative high level of women traders with no education is
an indication of poor human capital of women which increases their probability to participate in
the informal sector as observed by Njikam and Tchouassi (2011). With regard to those traders
who had attained post-secondary education, 2.21% were women while 4.21% were men. In
addition, the results also show that, 2.21% of women traders and 4.21% of men traders
completed secondary long cycle.
0.87% 3.03% 3.03%
7.36%
28.13% 57.58%
Adult alphabetization
Post secondary
Secondary school longcycle
No formal education
Primary school
Secondary school -4 years
Early childhood education
28
Figure 3: Level of education by gender of common bean traders
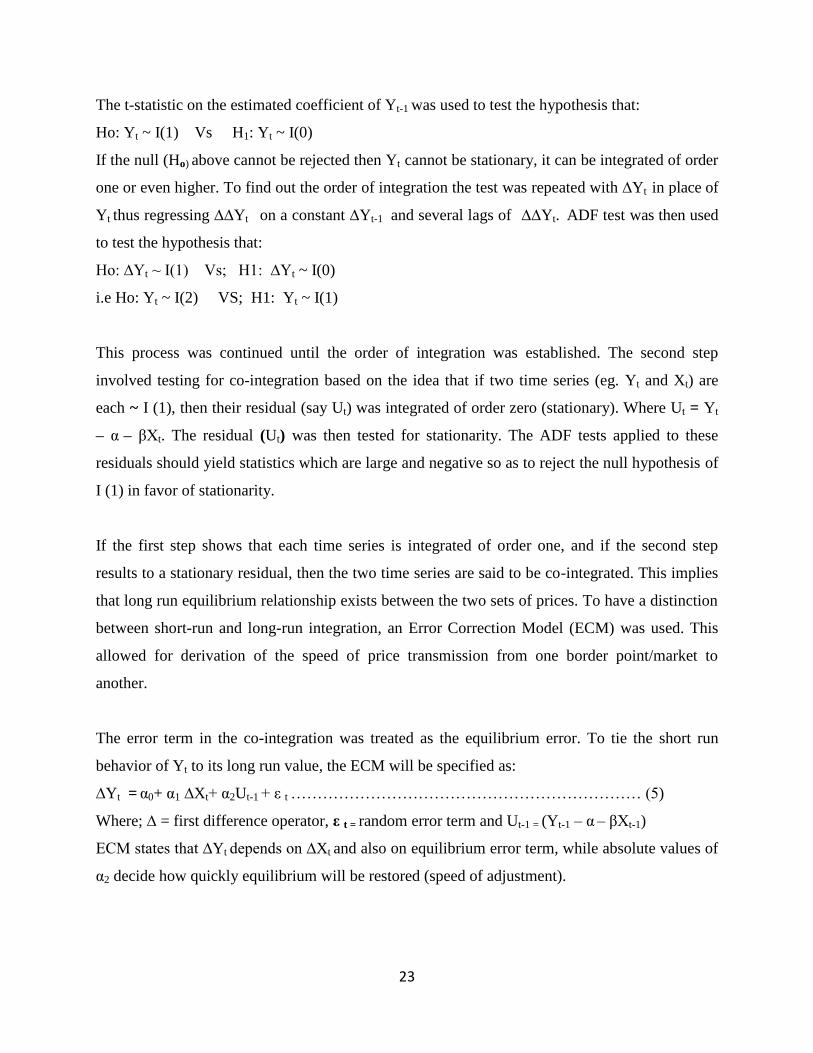
The sample consisted of 41.8% retailers, 39.2% wholesalers, 9.7% both wholesalers and retailers
and only 9.3% transporters as shown in Table 6. The reason for most traders being in retail bean
trade could be attributed to the fact that other categories of trade require more capital to start and
maintain. Odhiambo et al. (2006) noted that lack of capital is a serious constraint for entry into
bean trade in Nairobi.
Table 6: Types of common bean traders
Type Frequency Percentage
Transporters 23 9.3
Wholesaler 94 39.2
Retailer 99 41.8
Both wholesale and retail 24 9.7
Total 240 100.00
The results in Table 7 show that 59.1% of sampled traders were women while 40.9% were men.
This indicates that women are more active in bean trade than men. The findings are consistent
with Kibiego et al. (2003) who observed that, majority of common bean traders in Kenyan
markets were women who constituted long distance wholesalers, wholesalers/retailers, agents
and retailers operating in shops, market stalls and open air. This difference in gender can be
52.94% 30.15%
11.03%
2.21%
2.21% 1.47%
Sec sch-4yrs
Primary sch
No formaleduc
Sec sch-longcycle
Post sec sch
Adult alphabet
64.21%
25.26%
2.11%
4.21% 4.21%
Sec sch-4yrs
Primary sch
No formaleduc
Sec sch-longcycle
Post sec sch
(a)Women (b) Men
Early childhood education

29
attributed to the fact that women traders have defied the belief that trade is a men dominated
economic venture. This also goes against the belief that women in most African societies have
been perceived as delicate and their duty is to stay at home and take care of the family since men
are considered to be bread winners in the family. Currently, more women are participating in
trade so as to minimize increasing family costs.
Table 7: Category of common bean traders by gender
Trade involved in Women Men Total Chi-square
Transporters Count 6 16 22
% 27.3 72.7 100
Wholesaler Count 48 45 93
% 51.6 48.4 100
Retailer Count 74 25 99
% 74.8 25.3 100
Both wholesale and
retail
Count 12 11 23
% 52.2 47.8 100
Total 141 99 240
59.1 40.9 100 21.8560***
*** indicates significance at 99 percent confidence level.
Of the sampled common bean transporters, 72.7% were men while 27.3% were women. This
could be because truck driving or transportation is considered a masculinity venture. From the
study, it was also observed that women wholesalers constituted 51.6% while men wholesalers
constituted 48.4%. In addition, there were 74.8% women retailers and 25.3% men retailers.
Among traders who participated both in retail and wholesale bean trade, women traders
comprised 52.2% while men traders were 47.8%. The results in Table 7 also reveal that women
dominated in the three trade categories. The Chi square results revealed that there were no
differences among the women and men traders in relation to category of trade. This can be
attributed to the fact that the common bean traders share same market customers and
opportunities and are exposed to similar constraints in bean trade.

30
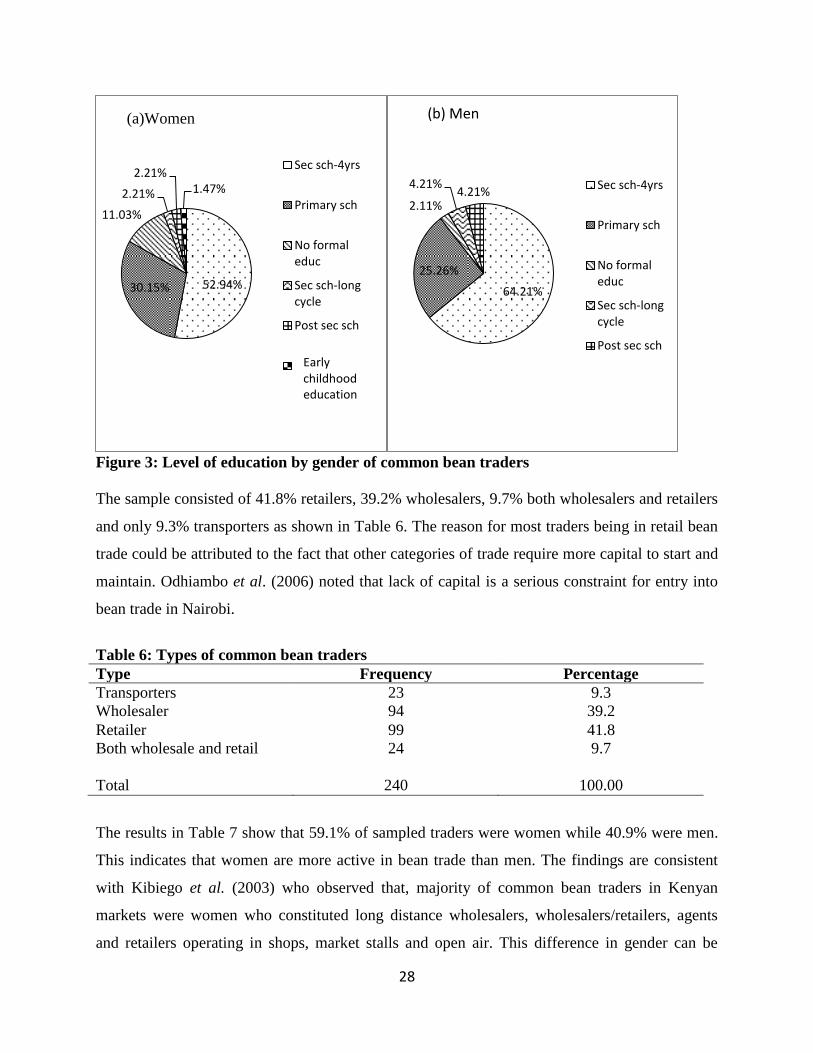
4.1.2 Common bean varieties traded in key selected markets and border points
Regarding the common bean varieties among the traders, Nyayo bean was popular and was sold
by 35.0% of the traders while 23.5% of the traders sold Wairimu bean variety as shown in Table
8. This could be because these two varieties sell faster in the market due to consumers’
preference and low prices. These findings are similar to that of Korir et al. (2005), who found
that farmers preferred to grow the Nyayo variety since it was very marketable at retail level in
Kenya. About 15.5% of traders sold Mwitemania variety with 10.2% of traders stocking mixed
bean while 8.8% of the traders sold Rosecoco. The least traded bean varieties were Yellow bean
and Saitoti which were sold by 4.8% and 2.0% of traders respectively.
Nyayo variety was highly traded in the key selected markets and sold by 40.8% of the traders
followed by 35.9% of the traders in Busia. In Namanga, 15.5% of traders sold Nyayo bean
variety while in Isebania 7.8% of the traders sold the same variety and no trader sold Nyayo in
Malaba border point (see Table 8). This could be because Malaba border point is a transit point
and minimal trade is carried out at this point. Other than Malaba, 35.7% traders in Namanga,
28.6% traders in Isebania, 21.4% traders in Busia and 14.3% traders in key markets sold yellow
bean. Among the sampled traders, 66.7% in Busia sold Saitoti variety while another 33.3% in the
key selected markets traded in Saitoti bean. This could probably be because Saitoti bean shares
similar features with Nyayo. Saitoti is rather smaller in size than Nyayo making Nyayo the most
preferred by traders to sell among the two varieties. Mwitemania variety was sold in the key
selected markets, Busia and Namanga by 56.5%, 39.1% and 4.3% of the traders respectively. Of
all the bean varieties traded, it was only Wairimu that was sold in all the markets. It was highly
traded in the key selected markets (39.1%) and least traded in Malaba (7.3%). This could be
attributed to the fact that Wairimu variety is relatively cheaper and preferred by most consumers.
There are more than 10 varieties traded in the Kenyan market and the most popular among
traders and with a big market share are Nyayo, Wairimu and Rosecoco (Spursby et al., 2004;
Katungi et al., 2010).
31
Table 8: Common bean varieties traded at the border points and key markets
Common bean
varieties
Busia Malaba Namanga Isebania Key selected
mkts
Total
Nyayo 37
(35.9)
16
(15.5)
8
(7.8)
42
(40.8)
103
(35.0)
Wairimu 13
(18.8)
5
(7.3)
17
(24.6)
7
(10.1)
27
(39.1)
69
(23.5)
Mwitemania 18
(39.1)
2
(4.3)
26
(56.5)
46
(15.7)
Mixed 10
(33.3)
2
(6.7)
1
(3.3)
17
(56.7)
30
(10.2)
Rosecoco 13
(50)
2
(7.7)
3
(11.5)
8
(30.8)
26
(8.8)
Yellow bean 3
(21.4)
5
(35.7)
4
(28.6)
2
(14.3)
14
(4.8)
Saitoti 4
(66.67)
2
(33.3)
6
(2.04)
Numbers in Parenthesis are percentages
4.1.3 Constraints to common bean trade
From the interviews on constraints faced by the traders, 33.3% of the bean traders indicated that
poor roads was a constraint, 32.5% gave high transport cost as a constraint while 21.9% gave the
constraint of seasons (heavy rains). The high transport costs were common during the rainy
season due to poor road conditions compared to the dry seasons (Mauyo et al., 2010). Traders
expressed that high transport costs which is majorly caused by poor road infrastructure
constrained them from purchasing beans from source markets. Heavy rains also affected the
supply of beans which later translated to low margins for the traders.
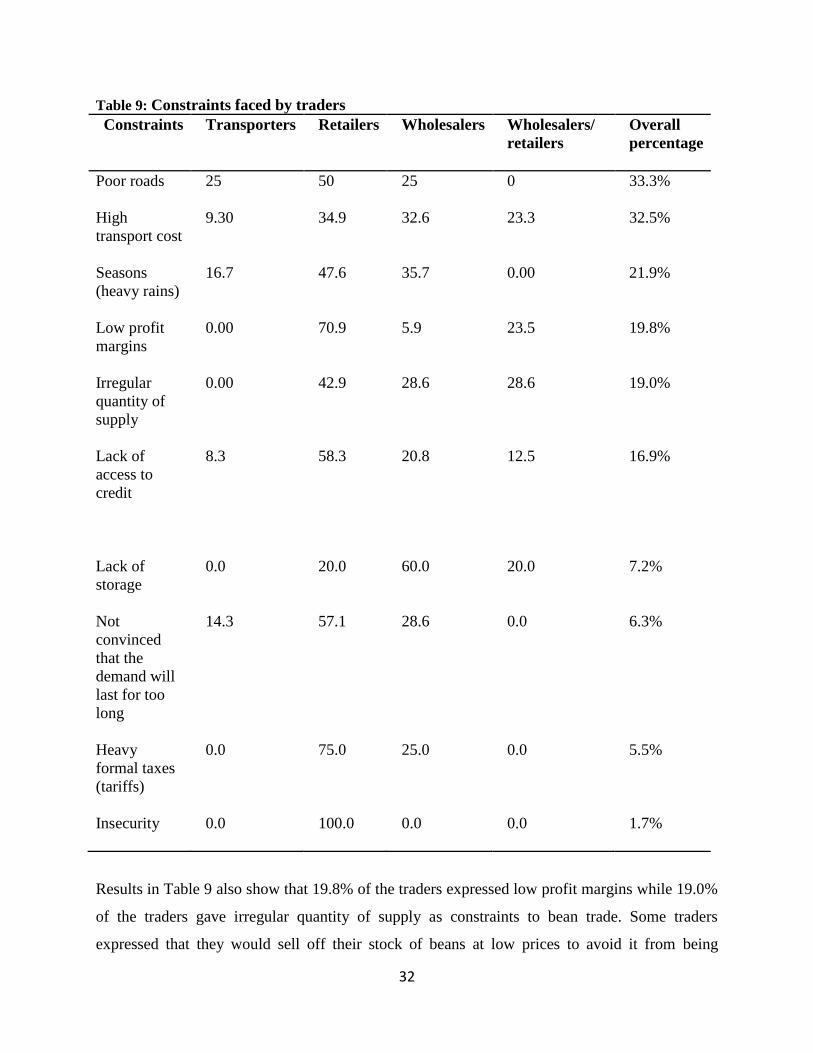
32
Table 9: Constraints faced by traders
Constraints Transporters Retailers Wholesalers Wholesalers/
retailers
Overall
percentage
Poor roads 25 50 25 0 33.3%
High
transport cost
9.30 34.9 32.6 23.3 32.5%
Seasons
(heavy rains)
16.7 47.6 35.7 0.00 21.9%
Low profit
margins
0.00 70.9 5.9 23.5 19.8%
Irregular
quantity of
supply
0.00 42.9 28.6 28.6 19.0%
Lack of
access to
credit
8.3 58.3 20.8 12.5 16.9%
Lack of
storage
0.0 20.0 60.0 20.0 7.2%
Not
convinced
that the
demand will
last for too
long
14.3 57.1 28.6 0.0 6.3%
Heavy
formal taxes
(tariffs)
0.0 75.0 25.0 0.0 5.5%
Insecurity 0.0 100.0 0.0 0.0 1.7%
Results in Table 9 also show that 19.8% of the traders expressed low profit margins while 19.0%
of the traders gave irregular quantity of supply as constraints to bean trade. Some traders
expressed that they would sell off their stock of beans at low prices to avoid it from being
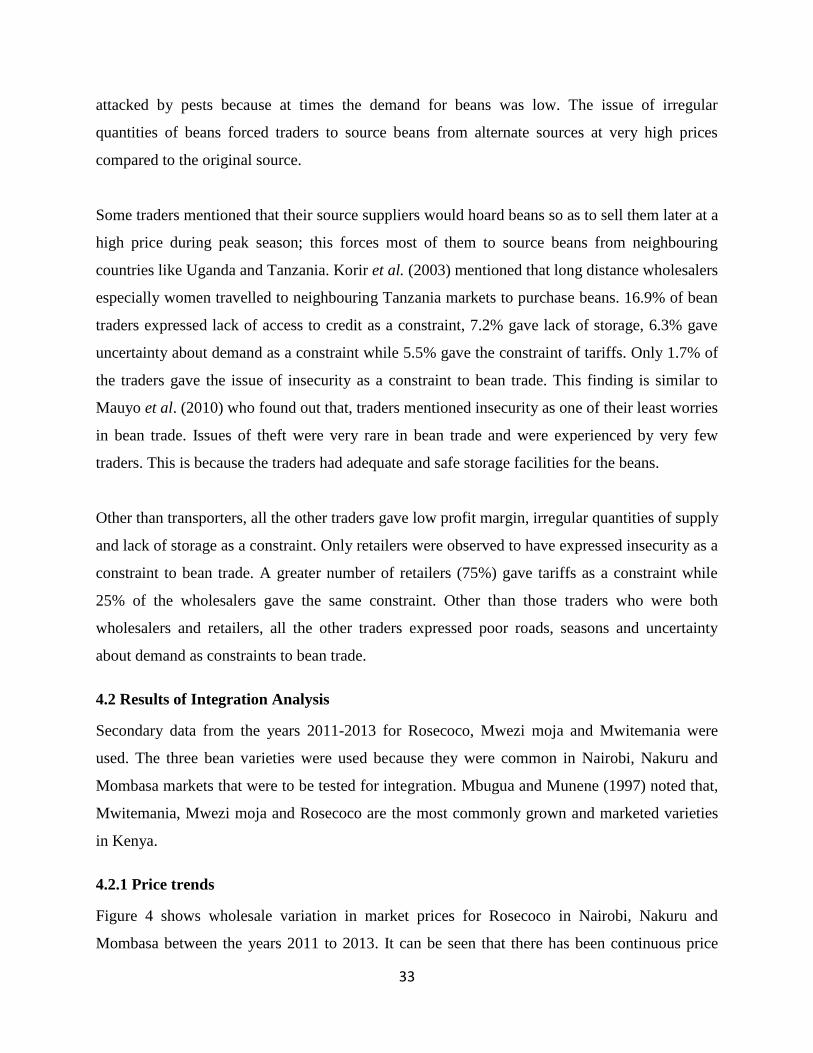
33
attacked by pests because at times the demand for beans was low. The issue of irregular
quantities of beans forced traders to source beans from alternate sources at very high prices
compared to the original source.
Some traders mentioned that their source suppliers would hoard beans so as to sell them later at a
high price during peak season; this forces most of them to source beans from neighbouring
countries like Uganda and Tanzania. Korir et al. (2003) mentioned that long distance wholesalers
especially women travelled to neighbouring Tanzania markets to purchase beans. 16.9% of bean
traders expressed lack of access to credit as a constraint, 7.2% gave lack of storage, 6.3% gave
uncertainty about demand as a constraint while 5.5% gave the constraint of tariffs. Only 1.7% of
the traders gave the issue of insecurity as a constraint to bean trade. This finding is similar to
Mauyo et al. (2010) who found out that, traders mentioned insecurity as one of their least worries
in bean trade. Issues of theft were very rare in bean trade and were experienced by very few
traders. This is because the traders had adequate and safe storage facilities for the beans.
Other than transporters, all the other traders gave low profit margin, irregular quantities of supply
and lack of storage as a constraint. Only retailers were observed to have expressed insecurity as a
constraint to bean trade. A greater number of retailers (75%) gave tariffs as a constraint while
25% of the wholesalers gave the same constraint. Other than those traders who were both
wholesalers and retailers, all the other traders expressed poor roads, seasons and uncertainty
about demand as constraints to bean trade.
4.2 Results of Integration Analysis
Secondary data from the years 2011-2013 for Rosecoco, Mwezi moja and Mwitemania were
used. The three bean varieties were used because they were common in Nairobi, Nakuru and
Mombasa markets that were to be tested for integration. Mbugua and Munene (1997) noted that,
Mwitemania, Mwezi moja and Rosecoco are the most commonly grown and marketed varieties
in Kenya.
4.2.1 Price trends
Figure 4 shows wholesale variation in market prices for Rosecoco in Nairobi, Nakuru and
Mombasa between the years 2011 to 2013. It can be seen that there has been continuous price

34
fluctuation in the three markets since beans are normally harvested in August and December.
Bean prices generally decline immediately after harvest and are at their lowest around August to
September and December to February due to bounty supply. The prices then gradually increase
and reach their peak around April to July (Katungi et al., 2010). This is because during the
months of April to July, beans are still in the field and the demand increases due to minimal
supply hence increased prices in the market.
Figure 4: Seasonal variation of Rosecoco bean prices in Nairobi, Mombasa and Nakuru
It is evident that the wholesale prices have been fluctuating over the three years with the highest
average price being in Nairobi especially in the months of June and September followed by
Mombasa and then Nakuru with the lowest. This could be because both Nairobi and Mombasa
are consumption zones for Rosecoco. Nakuru is a production zone for Rosecoco making the
prices relatively cheaper as compared to the other two markets.
4500
5000
5500
6000
6500
7000
P
rice
in K
ES
of
Rose
coco
per
90k
g b
ag
June 2011 Sept 2011 Dec 2011 Mar 2012 June 2012 Sept 2012 Dec 2012 Mar 2013 Date (Monthly)
Nairobi Mombasa Nakuru

35
Figure 5 shows wholesale market price trends for Mwezi Moja bean in Nairobi and Nakuru
between the years 2011 to 2013. The wholesale prices reached peak in April in both markets.
This is because the planting season for beans is in April and so there is less beans in the market
which causes supply shortage in the market thus increase in prices. In the month of October, the
wholesale prices were low in Nakuru but very high in Nairobi. The difference of prices in these
two markets may be explained by the fact that in October beans are probably still in the field and
are yet to be harvested. Nairobi is not a production area for beans therefore has to be supplied by
other markets thus high prices in the month of October.
Figure 5: Seasonal variation of Mwezi moja bean prices in Nairobi and Nakuru
Figure 6 shows wholesale market price trends for Mwitemania in Nairobi, Nakuru and Mombasa
between the years 2011 to 2013. The trends in the three markets have varied and fluctuated
between the three years and this could be due to either bumper harvest or poor harvest caused by
variation in weather conditions or resistance and susceptibility to pests and diseases.
Mwitemania prices are highest in Mombasa followed by Nairobi and Nakuru. The monthly
4000
4500
5000
5500
6000
P
rice
of
Mw
ezim
oja
Bea
n o
n K
ES
per
90k
g b
ag
Jul 2011 Oct 2011 Jan 2012 Apr 2012 Jul 2012 Oct 2012 Jan 2013 Time (monthly)
Nairobi Nakuru

36
average prices reach their peak in the month of April and are slightly low in the month of
January possibly because April is a planting season while January is a harvesting season.
`
Figure 6: Seasonal variation of Mwitemania bean prices in Nairobi, Mombasa and Nakuru
4.2.2 Unit root test results
Table 10 shows unit root test for Rosecoco bean and the first difference of the selected markets.
Prices were converted to logarithm and it was found that price series for Nairobi were not
stationary as the test statistic (-2.792) is less than the 5 percent critical value. Differenced price
series for Nairobi (D1. Nairobi) was stationary as the test statistic (5.317) is greater than the 1
percent critical value (3.75) in absolute terms meaning we reject the null hypothesis that the
series are not stationary. Differenced price series for Nakuru and Mombasa were stationary as
the test statistics were greater than the 1 percent critical value. This implies that prices of the
previous period for Rosecoco in the three markets influenced the current prices. This means that
the price series for Nairobi, Nakuru and Mombasa Rosecoco bean are integrated of order one I
(1). When price series are integrated once, this makes it stationary and integrated of order one
process, denoted as I (1) as observed by Odipo et al. (2014).
30
00
40
00
50
00
60
00
70
00
Pri
ce o
f M
wit
em
ania
bea
ns
in K
ES
per
90
kg b
ag
Jul 2011 Oct 2011 Jan 2012 Apr 2012 Jul 2012 Oct 2012 Jan 2013 Time (monthly)
Nairobi Mombasa Nakuru
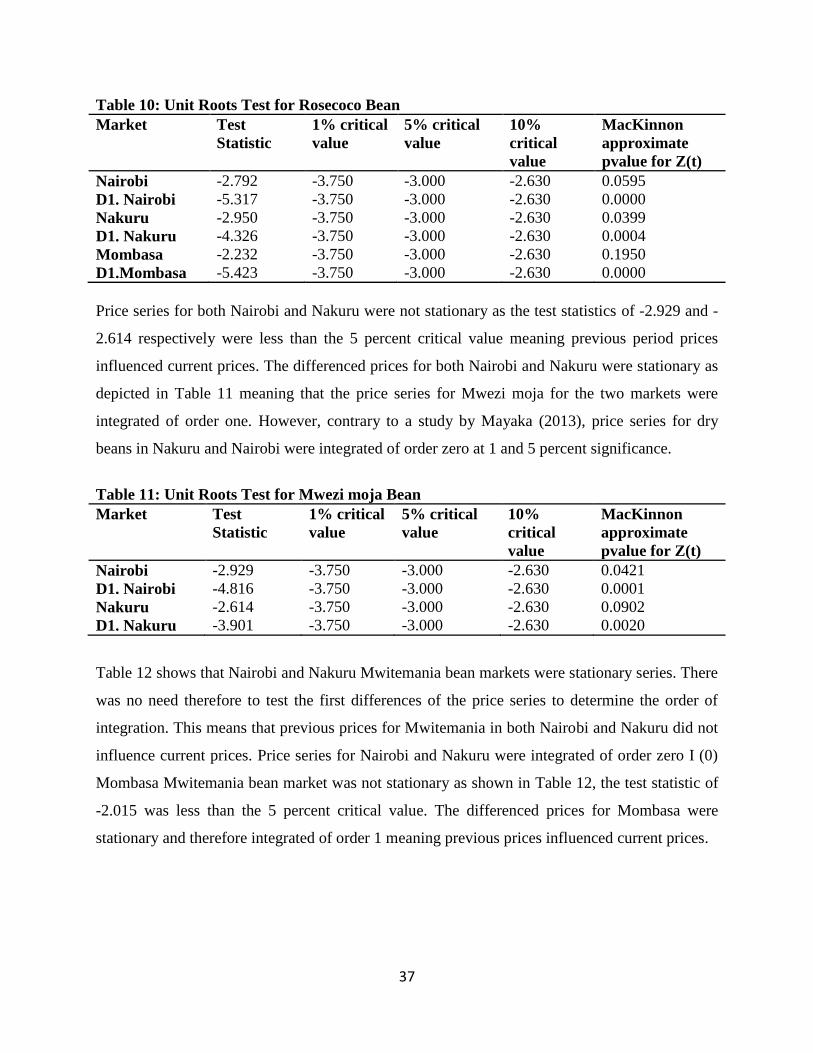
37
Table 10: Unit Roots Test for Rosecoco Bean
Market Test
Statistic
1% critical
value
5% critical
value
10%
critical
value
MacKinnon
approximate
pvalue for Z(t)
Nairobi -2.792 -3.750 -3.000 -2.630 0.0595
D1. Nairobi -5.317 -3.750 -3.000 -2.630 0.0000
Nakuru -2.950 -3.750 -3.000 -2.630 0.0399
D1. Nakuru -4.326 -3.750 -3.000 -2.630 0.0004
Mombasa -2.232 -3.750 -3.000 -2.630 0.1950
D1.Mombasa -5.423 -3.750 -3.000 -2.630 0.0000
Price series for both Nairobi and Nakuru were not stationary as the test statistics of -2.929 and -
2.614 respectively were less than the 5 percent critical value meaning previous period prices
influenced current prices. The differenced prices for both Nairobi and Nakuru were stationary as
depicted in Table 11 meaning that the price series for Mwezi moja for the two markets were
integrated of order one. However, contrary to a study by Mayaka (2013), price series for dry
beans in Nakuru and Nairobi were integrated of order zero at 1 and 5 percent significance.
Table 11: Unit Roots Test for Mwezi moja Bean
Market Test
Statistic
1% critical
value
5% critical
value
10%
critical
value
MacKinnon
approximate
pvalue for Z(t)
Nairobi -2.929 -3.750 -3.000 -2.630 0.0421
D1. Nairobi -4.816 -3.750 -3.000 -2.630 0.0001
Nakuru -2.614 -3.750 -3.000 -2.630 0.0902
D1. Nakuru -3.901 -3.750 -3.000 -2.630 0.0020
Table 12 shows that Nairobi and Nakuru Mwitemania bean markets were stationary series. There
was no need therefore to test the first differences of the price series to determine the order of
integration. This means that previous prices for Mwitemania in both Nairobi and Nakuru did not
influence current prices. Price series for Nairobi and Nakuru were integrated of order zero I (0)
Mombasa Mwitemania bean market was not stationary as shown in Table 12, the test statistic of
-2.015 was less than the 5 percent critical value. The differenced prices for Mombasa were
stationary and therefore integrated of order 1 meaning previous prices influenced current prices.
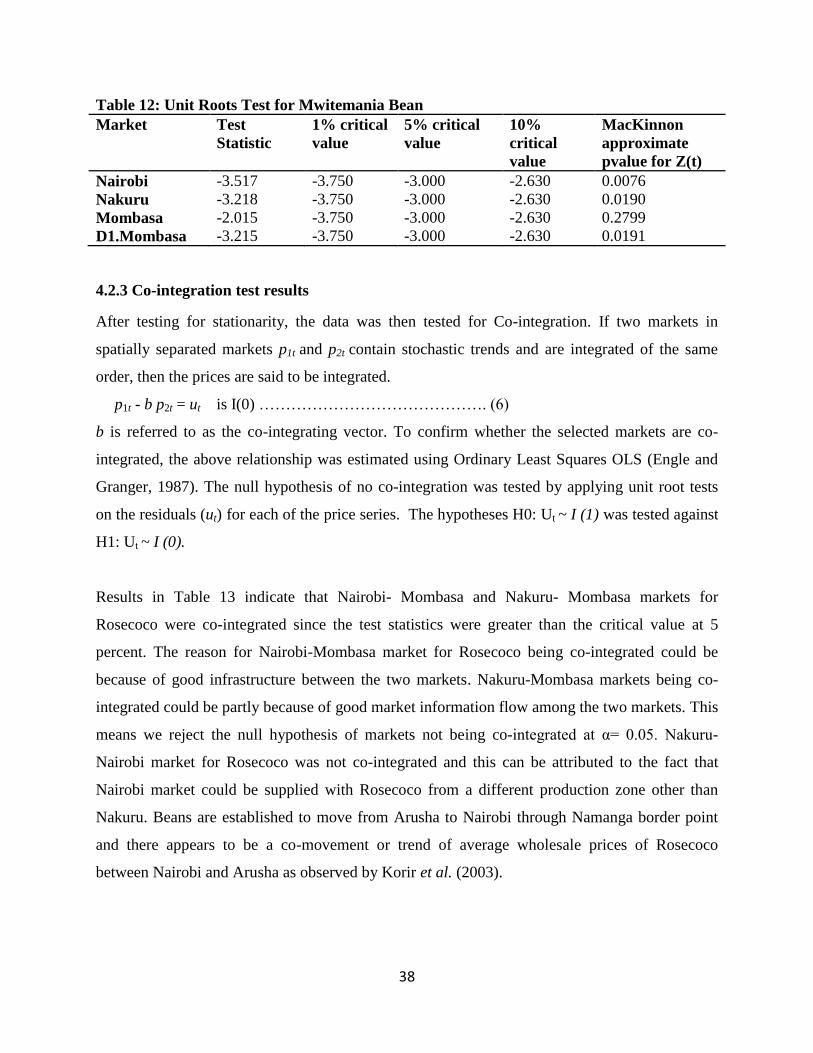
38
Table 12: Unit Roots Test for Mwitemania Bean
Market Test
Statistic
1% critical
value
5% critical
value
10%
critical
value
MacKinnon
approximate
pvalue for Z(t)
Nairobi -3.517 -3.750 -3.000 -2.630 0.0076
Nakuru -3.218 -3.750 -3.000 -2.630 0.0190
Mombasa -2.015 -3.750 -3.000 -2.630 0.2799
D1.Mombasa -3.215 -3.750 -3.000 -2.630 0.0191
4.2.3 Co-integration test results
After testing for stationarity, the data was then tested for Co-integration. If two markets in
spatially separated markets p1t and p2t contain stochastic trends and are integrated of the same
order, then the prices are said to be integrated.
p1t - b p2t = ut is I(0) ……………………………………. (6)
b is referred to as the co-integrating vector. To confirm whether the selected markets are co-
integrated, the above relationship was estimated using Ordinary Least Squares OLS (Engle and
Granger, 1987). The null hypothesis of no co-integration was tested by applying unit root tests
on the residuals (ut) for each of the price series. The hypotheses H0: Ut ~ I (1) was tested against
H1: Ut ~ I (0).
Results in Table 13 indicate that Nairobi- Mombasa and Nakuru- Mombasa markets for
Rosecoco were co-integrated since the test statistics were greater than the critical value at 5
percent. The reason for Nairobi-Mombasa market for Rosecoco being co-integrated could be
because of good infrastructure between the two markets. Nakuru-Mombasa markets being co-
integrated could be partly because of good market information flow among the two markets. This
means we reject the null hypothesis of markets not being co-integrated at α= 0.05. Nakuru-
Nairobi market for Rosecoco was not co-integrated and this can be attributed to the fact that
Nairobi market could be supplied with Rosecoco from a different production zone other than
Nakuru. Beans are established to move from Arusha to Nairobi through Namanga border point
and there appears to be a co-movement or trend of average wholesale prices of Rosecoco
between Nairobi and Arusha as observed by Korir et al. (2003).

39
Table 13: Cointegration tests between Nairobi and Mombasa and Nakuru for Rosecoco
Market Test
Statistic
1% critical
value
5% critical
value
10%
critical
value
MacKinnon
approximate
pvalue for Z(t)
Nairobi vs
Mombasa
-3.490 -3.750 -3.000 -2.630 0.0083
Nairobi vs
Nakuru
-2.627 -3.750 -3.000 -2.630 0.0876
Nakuru vs
Mombasa
-4.735 -3.750 -3.000 -2.630 0.0001
An Error Correction Model (ECM) was used to distinguish between short-run and long-run price
relationships amongst Rosecoco markets in Nairobi, Mombasa and Nakuru. ECM was only
carried out on the market pairs that were co-integrated. ECM accounts for both short and long
run adjustment to disequilibrium in the markets and the time it takes to eliminate disequilibrium
as noted by Mushtaq et al. (2008). Once a number of variables were found to be co-integrated,
then there existed a corresponding error correction representation which indicated that changes in
the dependent variable are a function of the level of disequilibrium in the co-integrating
relationship as well as changes in other variables as noted by Engle and Granger (1987).
𝛥𝑁𝑡 = −0.087 + 0.659∆𝑀𝑡−1 + 0.724𝑒𝑡−1……………………………… (7)
Where; 𝛥 = first difference operator, et = random error term
Nt is Rosecoco prices in Nairobi while Mt is Rosecoco prices in Mombasa.
Equation 7 indicates ECM for Nairobi and Mombasa. The error correction mechanism as
indicated by the lagged residual is significant and positive meaning that short run prices diverge
away from the long run equilibrium and are unstable. Mombasa prices for Rosecoco appear to
have significant long term effect on Nairobi prices. A 1 percent increase in Mombasa prices
causes a 0.65 percent rise in Nairobi prices. Besides, Acquah and Owusu (2012) also observed
that wrong sign (positive) on the estimate of error correction coefficient of Accra plantain market
showed that, short run price movement along the long run equilibrium path may be unstable.
𝛥𝑀𝑡 = 0.002 + 0.522∆𝑁𝐾𝑡−1 + 0.556𝑒𝑡−1……………………………. (8)
Equation 8 indicates ECM for Mombasa and Nakuru which shows that short run prices diverge
away from long run equilibrium since the coefficient on the error correction term is positive. The
positive sign on the coefficient of the error correction term may be an indication of instability in

40
the short run price movements along the long run equilibrium. A 1 percent increase in Nakuru
Rosecoco prices causes a 0.52 percent rise in Mombasa prices.
Table 14 shows that Nairobi- Nakuru markets for Mwezi Moja were not co-integrated since the
test statistic was less than the critical value at 5 percent. This is partly attributed to the fact that
Nairobi market could be supplied by other markets other than Nakuru hence the market is
already supplied with Mwezi moja bean variety.
Table 14: Cointegration test between Nairobi and Nakuru markets for Mwezi Moja.
Market Test
Statistic
1% critical
value
5% critical
value
10%
critical
value
MacKinnon
approximate
pvalue for Z(t)
Nairobi vs
Nakuru
-2.889 -3.750 -3.000 -2.630 0.0467
Nairobi- Nakuru and Nakuru- Mombasa markets for Mwitemania were co-integrated since the
test statistics are greater than the critical value at 5 percent as shown in Table 14. This is
probably because the marketing infrastructure in these three markets is good therefore low
transaction cost. This means we reject the null hypothesis of markets not being integrated at α=
0.05. As also observed by Mayaka (2013), improving market infrastructure such as roads and
communication facilities can greatly reduce transaction costs and improve price transmission and
market efficiency hence increasing market integration across markets. Mombasa- Nairobi market
for Mwitemania was not integrated.
Table 15: Cointegration tests between Nairobi, Mombasa and Nakuru markets for
Mwitemania.
Market Test
Statistic
1% critical
value
5% critical
value
10%
critical
value
MacKinnon
approximate
pvalue for Z(t)
Nairobi vs
Nakuru
-4.177 -3.750 -3.000 -2.630 0.0007
Nairobi vs
Mombasa
-2.519 -3.750 -3.000 -2.630 0.1110
Nakuru vs
Mombasa
-3.689 -3.750 -3.000 -2.630 0.0043
𝛥𝑁𝑡 = −0.004 + 0.37∆𝑁𝐾𝑡−1 − 0.94𝑒𝑡−1………………………… (9)
41
Equation 9 indicates that Mwitemania price changes in Nairobi are dependent on price changes
in Nakuru. The coefficient of the error correction term is negative and significant showing that
short run price movements converge towards long run equilibrium path and may be stable. The
results are consistent with Mukhtar and Rasheed (2010) who noted that correct sign (negative) on
the coefficient of the error correction term is an indication of stability of the system. Absolute
value of α2 (0.94) indicates that when prices are not in equilibrium, they would be restored in a
period of less than half a month. This speed at which 94 percent of the disequilibria of the
previous month shock is adjusted back to equilibrium is very fast implying high degree of co-
integration amongst Nairobi and Nakuru markets for Mwitemania bean. Mwangi et al. (2014)
also found similar findings on French beans, where they observed that negative sign on error
correction indicated direction of correction towards the long run relationship and that French
beans export adjusted rapidly to correct long run disequilibrium in a period of one month.
𝛥𝑀𝑡 = −0.003 + 0.14∆𝑁𝐾𝑡−1 + 0.32𝑒𝑡−1………………………… (10)
Equation 10 indicates ECM for Nakuru and Mombasa. The error correction mechanism as
indicated by the lagged residual is significant and positive meaning that short run price
movement along the long run equilibrium path may be unstable. A 1 percent increase in Nakuru
prices causes a 0.14 percent rise in Nairobi prices.
42
CHAPTER FIVE
SUMMARY, CONCLUSION AND RECOMMENDATIONS
5.1 Summary and Conclusions
The main objective of this study was to contribute to improved livelihoods of actors in common
bean trade through efficient marketing of beans across the borders. The focus was to assess the
extent of common bean market integration between deficit and surplus markets, thus ascertaining
whether Nairobi, Nakuru and Mombasa markets for Rosecoco, Mwitemania and Mwezi moja are
integrated and to know the constraints and characteristics of traders in the selected bean markets.
The research questions answered in this study were; what are the characteristics of common bean
traders? What are the constraints to observed trade in common bean? and, to what extent are
bean deficit and surplus markets in Kenya integrated?
Time series data obtained from the Ministry of Agriculture was used to analyze market
integration. Augmented Dickey Fuller test was used to test if the price series was stationary and
the results revealed that all the markets were integrated of order one I(1). Co-integration tests
revealed that Nairobi-Mombasa Rosecoco markets and Nairobi-Nakuru and Nakuru-Mombasa
Mwitemania markets were co-integrated.
This study established that majority of retailers and wholesalers who play an important role in
the bean trade are women. These traders had knowledge on the most preferred varieties in the
market by the consumers making them able to supply them at all times by sourcing the beans
from their original or alternate source within and outside the country. Traders armed with market
information on the prices and bean varieties exploited the market to their advantage. High
transport cost was a major constraint for the traders. This was caused by poor roads and heavy
rains and this would at times translate to inefficiencies in the supply of beans to the markets. As
a result, the demand in the market exceeded the supply given the irregular supply of beans in the
market. The key to enhancing integration of common bean markets is to improve the marketing
infrastructure. Study findings show that the most traded varieties by the traders were Nyayo and
Wairimu while Saitoti and Yellow bean were the least traded by the traders.

43
The results indicated that prices of Rosecoco, Mwitemania and Mwezi moja varieties tended to
fluctuate over time due to variation in planting and harvesting seasons. Co-integration and error
correction model results revealed Cointegration of Nairobi- Mombasa and Nakuru- Mombasa
Rosecoco markets and Nairobi- Nakuru and Nakuru- Mombasa Mwitemania markets. The study
concluded that a supply shock in one region can enhance integration of spatially located markets
as shock can easily be transmitted from one market to the other. If common bean traders can
have information concerning price changes in different markets (price shocks), this would enable
them to access better paying markets.
5.2 Recommendations
In context of bean traders in Kenyan markets, there is need for the government together with the
private sectors to sensitive bean traders on the importance of engaging in common bean trade as
a way of contributing to their daily incomes. There is need to enhance market information by
both farmers and traders freely for better price transmission and knowledge of the best bean
markets to trade in. this could boost competitiveness and consequently increase market
integration.
This study recommends that the government together with the private sector should improve
infrastructure such as transport and communication services in order to enhance market
integration in Kenya. Improved transport system lowers transaction costs thus farmers will
produce more beans and in turn traders purchase the required quantity of beans to meet the
market demand without exploiting the consumers. The government needs to make key
commitments to maintain the roads in Kenya in order to lower the transport cost of beans as this
was a major hindrance in the efficiency and flow of beans from one market to the other.
The government together with the private sector should make efforts at promoting different bean
varieties in all the regions to both farmers and traders. This would increase market demand and
availability of different bean varieties in the market. Additionally, Kenya needs to zero rate
agricultural produce being imported to allow traders import more common beans into the country
in times of deficit. This will also help bean traders to penetrate the market in East Africa as there

44
is huge and growing market potential in the region. This would help reduce irregularity in bean
supply and thus increase profit margin for the traders.
The results show that, there is integration between deficit and surplus markets justifying price
transmission between urban and rural markets in Kenya. Price transmission from high producer
markets to consumer markets. Therefore, it was concluded that, if markets are integrated, they
form an incentive for farmers to produce in surplus as they are assured of efficient markets and
the fact that traders would not take advantage of increased production to lower farmer’s benefits.
This will foster competition, increase returns accruing to producers and decrease transaction
costs between urban and rural markets.
5.3 Suggestions for further research
The study focused on market integration of three common bean varieties in Kenya. However
more research should be conducted to document other bean varieties in key markets other than
looking at common beans in general to allow a clear distinction between different varieties in the
same markets. This would help in formulating market policies that encourage production and
supply of diverse varieties in different markets.
45
REFERENCES
Ackello-Ogutu, C. (1996). Methodologies for Estimating Informal Cross-Border Trade in
Eastern and Southern Africa, USAID Technical Paper No. 29, USAID Africa Bureau,
Washington.
Ardeni, P.G. (1989). Does the Law of one price really hold for commodity prices? American
Journal of Agricultural Economics, 71(3): 661-669.
Barrett, C.B. (1996). Market Analysis Methods: Are our Enriched Tool Kits well suited to
Enlivened Markets? American Journal of Agricultural Economics, 78: 825-829.
Barrett, C.B., and Li, J.R. (2002). Distinguishing between equilibrium and integration in spatial
price analysis. American Journal of Agricultural Economics. 84:292-307.
Barret, C.B., and Mutambatsere, E. (2005). Agricultural markets in developing countries, In
Lawrence E. Blume and Steven N. Durlauf, The New Palgrave, 2nd
Edition.
Barrett, C.B. (2008). Smallholder market participation: Concepts and Evidence from Eastern and
Southern Africa. Food policy, 33(4): 299-317.
Basu, J.P. (2006). Co-integration and Market Integration: An application to the Potato Markets in
Rural West Bengal, India, Presented at the International Association of Agricultural
Economists conference. Gold Coast, Australia.
Baulch, B. (1997). Transfer Costs, Spatial Arbitrage, and Testing for Food Market Integration,
American Journal of Agricultural Economics, 79: 477-487.
Bernstein, H., and Amin. (1995). The Political Economy of Maize filiere. The Journal of Peasant
Studies. 23(2/3) 120-145.
Boisseleau, F., and Hewicker, C. (2002). European Electricity and its Impact on Market
Integration, KEMA Consulting, Germany.
Buruchara, R. (2007). Background information on Common Beans (Phaseolus vulgaris L.) in
Biotechnology, Breeding and Seed Systems for African Crops.
http://www.africancrops.net/rockeffeller/crops/beans/index.htm.
Chan, F.T.S. (2003). Performance measurement in a supply chain. International Journal of
Advanced Manufactural Technology, 42(13): 534-548.
Cramer, G.L., and Jensen, W. (1982). Agricultural Economics and Agribusiness, 2nd
Edition.
McGraw Hill Book Company, USA. 222p.

46
De Toni, A., and Tonchia, S. (2001). Performance measurement systems models, characteristics
and measures. International Journal of Operations and Production Management,
21(1/2): 46-70.
Du Preez, L. (2011). A Study on the Integration of Potato Markets in South Africa. Unpublished
Thesis. University of the Free State, Bloemfontein.
Engle, R.F., and Granger, C.W.J. (1987). Co-integration and Error Correction: Representation
and Testing, Econometrica, 55: 251-276.
Fackler, P.L., and Tastan, H. (2008). Estimating the Degree of Market Integration, American
Journal of Agricultural Economics, 87(3): 717-734.
Fafchamps, M., and Hill, R. V. (2005). Selling at farmgate or travelling to market. American
Journal of Agricultural Economics, 87(3): 717. 734.
FAO, (2012). Statistical database of the Food and Agriculture Organization of the United
Nations, Rome, Italy. http://faostat.fao.org
FAOSTAT Food and Agriculture Organization at www.fao.org
Fulgence, J.M., Anna, A.T., and Joan. F. (2009). Drivers of Common Bean Trade in Tanzania: A
marketing Perspective. Staff paper 09-02.
Ghosh, M. (2000). Cointegration Tests and Spatial Integration of Rice Markets in India, India
Journal of Agricultural Economics, 55, No. 4, October- December, Pp. 616-625.
Ghoshray, A. (2009). Price dynamics for different qualities of coffee:
http://rmi.saeprint.com/sgi/content/refs/111/113.
Goodwin, B.K., and Schroeder T.C. (1991). Co-integration Test and Spatial Price Linkages in
Regional Cattle Markets. American Journal of Agricultural Economics. 73(2): 452-64.
Goetz, S., and Weber M.T. Fundamentals of price Analysis in Developing Countries’ Food
Systems: Training manual to accompany the Computer Software Program MSTAT.
Michigan State University International Development Paper. Working Paper No. 29,
(1986).
Goletti, F., Ahmed, R., and Farid, N. (1995). Structural Determinants of Market Integration: The
case of Rice in Bangladesh, The Development Economics, XXXIII-2.
Grisley, W., and Mwesigwa, D. (1991a). Consumer preferences for fresh and dry beans in
Uganda: implication for bean breeders. CIAT, Kampala, Uganda.

47
Grisley, W., and Munene, S. (1992). Dry beans sold at retail markets in Kenya: cultivars, grain
types, prices and sources. CIAT, Kampala, Uganda.
Groebner, D.F., and Shannon, P.W. (2005). Business Statistics. A decision Making Approach.
Pentice Hall.
Harris, B. (1993).There is a Method in my Madness: or is it Vice Versa? Measuring Agricultural
Marketing Performance. John Abbott(ed). Agricultural and Food Marketing in
Developing Countries, UK.
ISAR, (2011). Bean Program, Rwanda Agricultural Research Institute. http://www.isar.rw/spip.
Article45Nations.
Katungi, E., Farrow, A., Chianu, J., Sperling, L., and Beebe, S. (2009). Common bean in Eastern
and Southern Africa: a situation and outlook analysis. CIAT, Kampala, Uganda.
http://www.icrisat.org/what-we-do/impi/projects/t12-publications/regional-situation-
outlookreports/rso-common-bean-esa.pdf.
Kibiego, M.B., Odhiambo, M.O., and Kimani, P.M. (2003). Analysis of bean marketing system
in urban areas of Kenya. African Crop Science Society, 6: 587-590.
Kohls, R.L., and Uhl J.N. (1998). Marketing of agricultural products. Fifth Edition, Macmillan,
New York.
Korir, M.K. (2005). Cross Border Bean Marketing Between the Northern Zone of Tanzania and
Nairobi, Kenya. M.Phil. Thesis. Moi University. Eldoret.
Kose, M.A., Prasad, E.S., and Terrones, M.E. (2003). Financial Integration and Macroeconomic
Volatility, IMF Staff Papers, 50: 119-142.
Kotler, P. (1997). Marketing Management Analysis, Planning, Implementation, and Control, 9th
Edition. Upper Saddle River, NJ: Prentice Hall International.
Kweka, S.O., Ndakidemi, P.A., Mushi, C.S., Nkonya, E., and David, S. (1998). Adoption of
Lyamungu 85 Bean Variety in the Medium-Altitude Zone of Tanzania.
Magrath, P. (1992). Methodologies for studying Agricultural marketing in developing Countries.
Marketing series 2, Chart ham, UK: Natural resource Institute.
Masinjila, M. (2009). Gender Dimensions of Cross Border Trade in the East African
Community- Kenya/Uganda and Rwanda Burundi Border.
48
Mauyo, L.W., Chianu, J.N., Nassiuma, B.K., and Musebe, R.O. (2010). Cross-Border Bean
Market Performance in Western Kenya and Eastern Uganda:
http://www.SciRP.org/journal/jssm.
Mauyo, L.W., Webukhulu, R., Musebe, R.O., Kirkby, R.A., and Buruchara, R. (2011). Structure
and Conduct of Cross-Border Bean (Phaseolus Vulgaris) Marketing in East Africa: The
case of Western Kenya and Eastern Uganda. Journal of Emerging Trends in Economics
and Management Sciences, 2(6): 478-482.
Mayaka, K. V. (2013). An Assessment of Dry Beans Market Integration in Selected Markets in
Kenya. Unpulished Thesis Egerton University, Njoro.
Mbugua, G., and Munene, S. (1997). Determination of Dry Bean Varieties grown by farmers in
Kenya’s major bean producing areas. A paper presented at the First East and Central
Africa Bean Research Network (ECABREN).
McNair, M.P., and Harry, L. (1956). Readings in Marketing, 2nd –ed. McGraw-Hill Company,
Inc. New York.
McNew, K. (1996). Spatial market integration: definition, theory and evidence. Agricultural and
Resource Economic Review, 25: 1-11.
Mendoza, G. (1995). A Primer on marketing channels and margins. Lyme Rimer Publishers.
Meyers, J. R. (2008). The Effectiveness of Spatial Maize Price Transmission in Malawi.
Department of Agriculture Food and Resource Economics. Michigan State University.
East Lansing, MI 48906.
Minde, I., and T.O. Nakhumwa. (1996). Unrecorded cross-border trade between Malawi and her
neighbours: implications on food security. Technoserve Inc.
Ministry of Agriculture (MoA). (2008). Strategic Plan. Government Printers, Nairobi.
Minten, B., and Kyle, S. (1999). The effect of distance and road quality on food collection,
marketing margins, and traders’ wages: Evidence from the former Zaire. Journal of
Development Economics, 60 (1999): 467-495.
Moser, C., Barrett, C., and Minten, B. (2009). Spatial Integration at Multiple Scales: Rice
Markets in Madagascar, Agricultural Economics, 40: 281-294.
Mukhtar, T., and Rasheed, S. (2010). Testing Long run Relationship between Exports and
Imports: Evidence from Pakistan. Journal of Economic Cooperation and Development,
31(1): 41-58.
49
Mushtaq, K., Gafoor, A., and Dad, M. (2008). Apple Market Integration: Implications for
Sustainable Agricultural Development, The Lahore Journal of Economics, 13: 129-138.
Mwangi, C. S., Mbatia, E.L.O., and Nzuma, M. J. (2014). Effects of Export Rate Volatility on
French Beans Exports in Kenya. Journal of Agricultural Economics, Extension and Rural
Development, (1)1:001-012.
Mwita , J. K., and Audi, P.O. (1981). The farming system of lowland Machakos District, Kenya.
Report of farm survey results from Mwala location. Technical report No.1.
Negassa, A.,Myers, R., and Gabre-Madhin, E. (2003). Analyzing the Grain Market Efficiency in
Developing Countries: Review of Existing Methods and Extensions to the Parity Bound
Model, Market trade and institutions division, Discussion paper, No. 63.
Njikam ,O., and Tchouassi, G. (2011). Women in Informal Cross-border Trade: Evidence from
Cameroon. International Journal of Economics and Finance, 3(3): 202-213
Nyange, A.D. (1999). Estimation of inter-regional maize market integration in Tanzania and its
determinants.
http://www.foodnet.cgiar.org/post%20harvest/papers/market%20integration.David%20N
yange.htm.
Odipo, O.T., Bett, K. H., Lagat, K. J., and Sigei, K. G. (2014). Analysis of Market Integration: A
Case of Sugar in Selected Markets in Kenya. Journal of Economics and Sustainable
Development, 5(2): 2222-1700.
Oladapo, M.O., and Momoh, S. (2008). Price transmission and market integration in Oyo state,
Nigeria. Journal compilation, African Development Bank, London: Blackwell publishing.
Pomeroy, R. S., and Trinidad A.C. (1995). Industrial Organization of Market Analysis: Fish
marketing. Prices, products and people: Analyzing Agricultural Markets in Developing
Countries. International Potato Center.
RATIN- Regional Agricultural trade Intelligance Network (2011). Food Situation analysis in
East Africa. In service of the Eastern African Grain Council.
RATIN- Regional Agricultural trade Intelligance Network (2012). Food Situation analysis in
East Africa. In service of the Eastern African Grain Council.
Ravallion, M. (1986). “Testing Market Integration.” American Journal of Agricultural
Economics, 68 (1986): 88-109.

50
Samuelson, P. (1964). Spatial equilibrium and linear programming. The American Economic
Review, 42(3): 283-303.
Scarborough, V., and Kydd, J., (1992). Economic analysis of Agricultural Markets. A manual
marketing series 5, chartham UK: Natural resource.
Serra, T., and Goodwin, B.K. (2002a). price Transmission and Asymmetric Adjustment in the
Spanish Dairy Sector.
Sexton, R.J., Kling C.L., and Carman H.F. (1991). Market Integration, Efficiency of Arbitrage,
and Imperfect Competition: Methodology and Application to U.S. Celery. American
Journal of Agricultural Economics, 73(3): 568-580.
Singh, S.P. (1999). Common Bean Improvement for the Twenty-First Century. Kluwer Acad.
Publ., Dordrecht, Germ.
Soniia, D., and Sperling, L. (1999). Improving technology delivery mechanisms: Lessons from
bean seed systems research in eastern and central Africa. Agriculture and Human Values
16:381-388.
Spilsbury, J., Jagwe. J., and Wanda, K. (2004). Evaluating the Marketing Opportunities for beans
and its products in the principle beans growing countries of ASARECA, draft regional
report compiled by International Institute of Tropical Agriculture and Food net.
Stern, L.W., Ansary, A.I.E., and Coughlan, A.T. (1996). Marketing Channels, 5th Edition, Upper
Saddle River, NJ: Prentice Hall International.
Tchale, H. (2002). Informal cross-border trade: The case of beans in Eastern and Southern
Africa-implications on bean seed multiplication, dissemination entrepreneurship and
quality. In proceedings of a bean seed workshop held January 12-14 at Arusha, Tanzania,
by bean/cowpea collaborative research support program-East Africa.
UBOS (Uganda Bureau of Statistics). (2007), Uganda National Household Survey 2005/2006,
Agricultural Module. 214pp. Website: www.ubos.org
USAID (United States Agency for International Development), (2010). Staple Food Value Chain
Analysis in Kenya. Chemonics International Inc.
USAID (United States Agency for International Development), (1995) “Policy Determination
No. 19” Bureau for Program and Policy Co-ordination, USAID, Washington DC.
Van Campenhout, B. (2007). Modeling Trends in Food Market Integration; Method and an
Application to Tanzanian Maize Markets, Food policy, 32: 112-127.

51
Van Rheenen, H.A. (1979). Diversity of food beans in Kenya. Econ Bot 33:448-454.
Vollrath, T.L. (2003). North American Agricultural Market Integration and its Impact on the
Food and Fiber System, Agricultural Information Bulletin No. 784, Washington, DC.
Voysest, O., and Dessert M. (1991).Bean cultivars, classes and commercial seed types. A;
Voysest O, eds. Common beans: research for crop improvement. CAB International and
CIAT, Wallingford, UK. Pp. 119-162.
WFP/PDPE, (2007). Market analysis tool: Market integration. Working paper 7, 2007. World
Bank 2009.
Wim, V., and Mohammad, I. H. (2010). Evaluation of Rice Markets Integration in Bangladesh.
Lahore Journal of Economics 26: 77-96
Wortmann, C.S., Kirkby R.A., Eledu C.A. and Allen D.J. (1998). Atlas of common bean
(Phaseolus vulgaris L) in Africa. Cali, Colom. (Publication No. 297).
Xavery, P. R., Kalyebara, C., and F. Ngulu (2005). The impact of improved bean varieties in
Northern Tanzania. Selian Agricultural Research Institute (SARI) Tanzania in
collaboration with the Pan-African Bean Research alliance (PABRA) and the
International Center for Tropical Agriculture (CIAT).
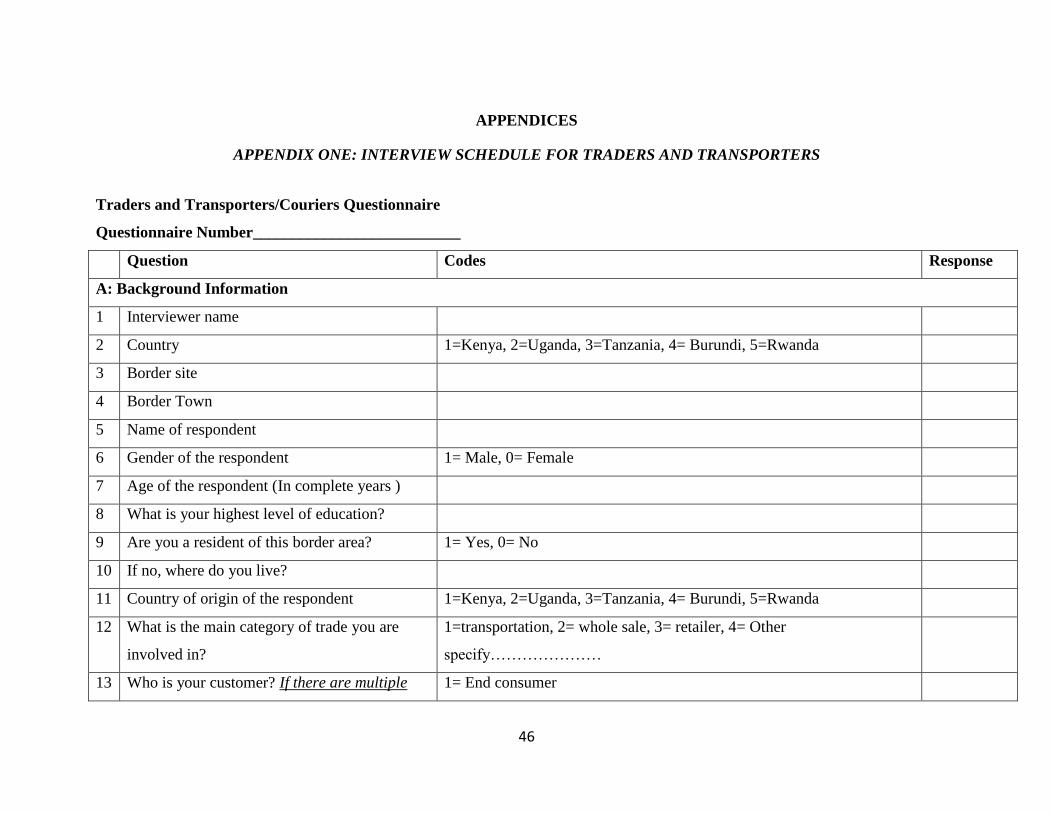
46
APPENDICES
APPENDIX ONE: INTERVIEW SCHEDULE FOR TRADERS AND TRANSPORTERS
Traders and Transporters/Couriers Questionnaire
Questionnaire Number__________________________
Question Codes Response
A: Background Information
1 Interviewer name
2 Country 1=Kenya, 2=Uganda, 3=Tanzania, 4= Burundi, 5=Rwanda
3 Border site
4 Border Town
5 Name of respondent
6 Gender of the respondent 1= Male, 0= Female
7 Age of the respondent (In complete years )
8 What is your highest level of education?
9 Are you a resident of this border area? 1= Yes, 0= No
10 If no, where do you live?
11 Country of origin of the respondent 1=Kenya, 2=Uganda, 3=Tanzania, 4= Burundi, 5=Rwanda
12 What is the main category of trade you are
involved in?
1=transportation, 2= whole sale, 3= retailer, 4= Other
specify…………………
13 Who is your customer? If there are multiple 1= End consumer

47
customers, please rank them in order of
importance
2= Retailer
3= Middleman/aggregator (actually purchases)
4= Wholesaler
5= Broker/fixer (only trades)
6= Transporter who wholesales
7= Processor/Miller
8= Any other, please specify
14 Number of years in the started business
15 Compared to five years ago, how did the
number of customers, change? (Only ask if
business is more than five years old
1= Increased
2= Decreased
3= No Change
16 Do you participate in informal cross border
trade
1= Yes, 0= No
17 Percentage of the trade
18 Is informal cross border trade your main
source of employment?
19 Give reasons why you participate in informal
cross border trade?
B: Volumes and values of beans trade

48
20 Local
name
Trad
e in
it
[1=
Yes;
0=
No]
Loca
l
Nam
es
Sourc
e
(coun
try
and
locali
ty
name
)
Alternat
e source
of
supply
(country
and
locality
name)
What types of units
do you buy at?
1 = Kilos, 2 = 50
kilo bags, 3 = 90
kilo bag, 4 = 110
kilo bags, 5 = tons,
6= big tins/debes
Any other, please
specify
Purchas
ing
quantit
y per
month
Purch
ase
price
Sell
ing
pric
e
Time
taken
to sell
Place to
where
they are
sold
(country
and
locality
name)
Packa
ging
Quanti
ty
declar
ed
(%)
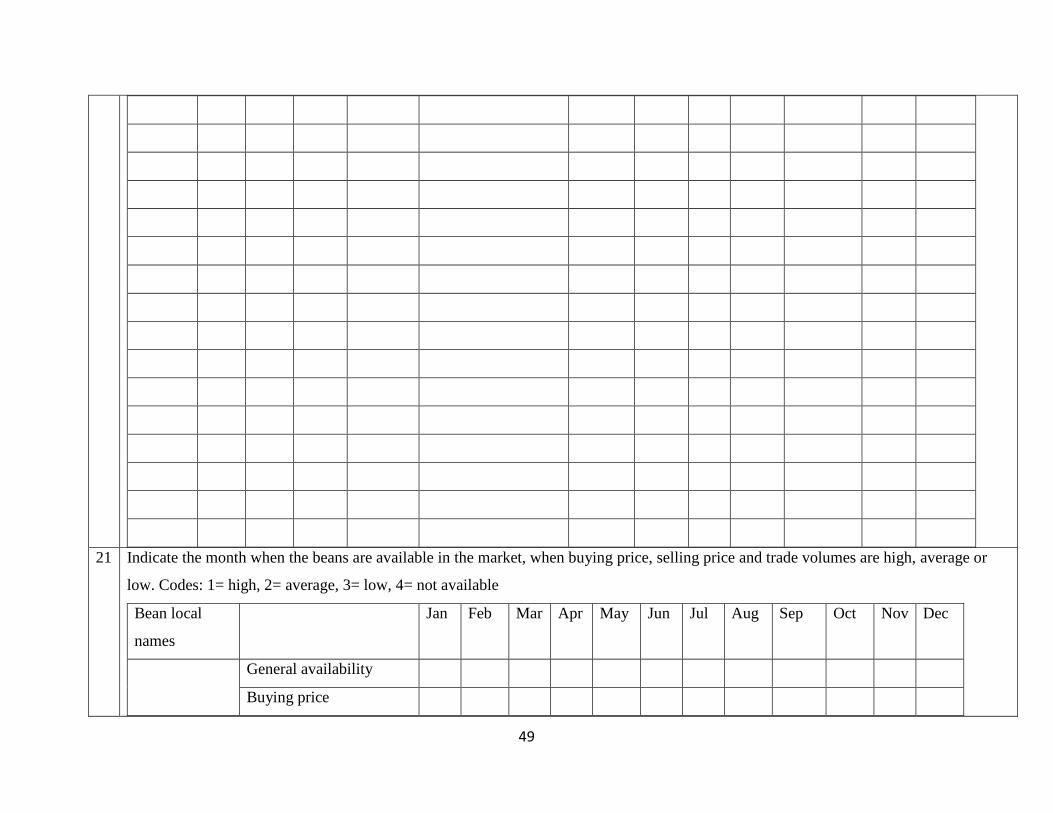
49
21 Indicate the month when the beans are available in the market, when buying price, selling price and trade volumes are high, average or
low. Codes: 1= high, 2= average, 3= low, 4= not available
Bean local
names
Jan Feb Mar Apr May Jun Jul Aug Sep Oct Nov Dec
General availability
Buying price
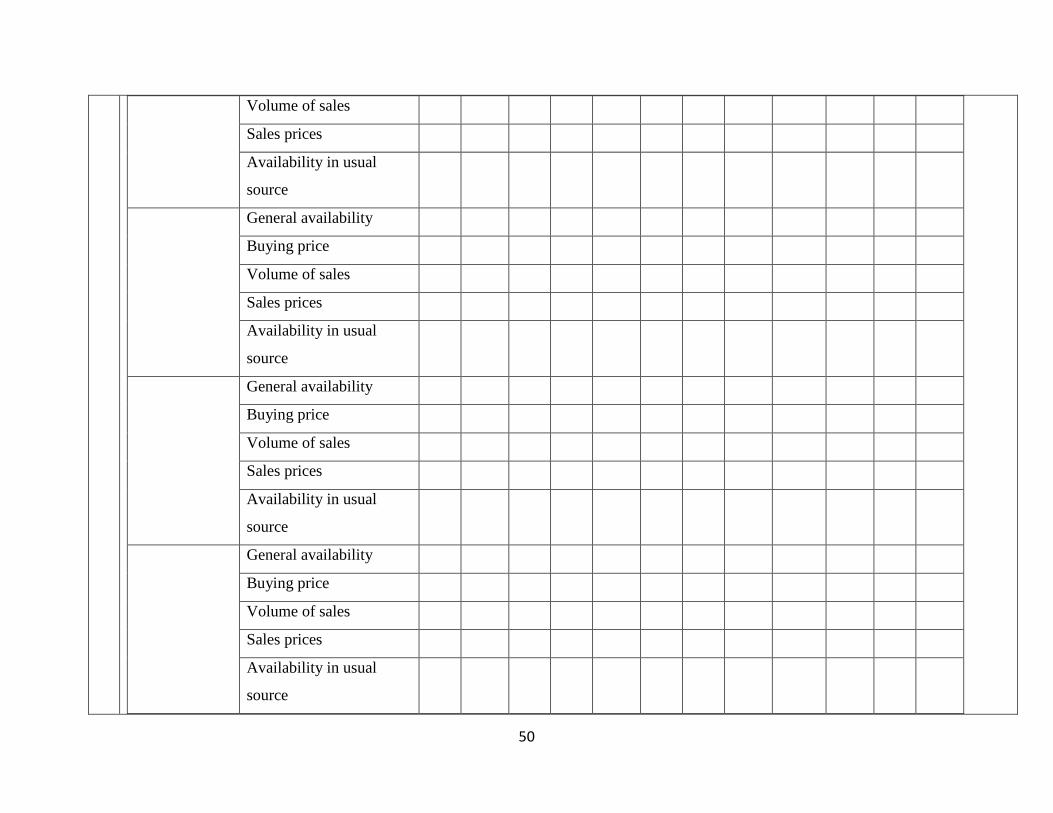
50
Volume of sales
Sales prices
Availability in usual
source
General availability
Buying price
Volume of sales
Sales prices
Availability in usual
source
General availability
Buying price
Volume of sales
Sales prices
Availability in usual
source
General availability
Buying price
Volume of sales
Sales prices
Availability in usual
source

51
General availability
Buying price
Volume of sales
Sales prices
Availability in usual
source
General availability
Buying price
Volume of sales
Sales prices
Availability in usual
source
General availability
Buying price
Volume of sales
Sales prices
Availability in usual
source
General availability
Buying price
Volume of sales
Sales prices

52
Availability in usual
source
22 Are the bean varieties normally mixed 1=Yes 2=N0
23 If mixed do you sort them or market as they are 1=sort 2= minimal sorting 3=No sorting
24 What are the reasons for sorting (e.g what market requires, differential price)
25 Mode of transport 1= 7 ton truck (Cantor), 2= 12 ton truck , 3= 28 ton truck, 4= Land-
cruiser taxis, 5= Pick-ups (Hilux), 6= Vans (owned or rented), 7=
Matatus/buses/public transport, 8= Carts (donkeys/cows), 9= Cycles,
10= On animals (camels/cows/donkeys), 11= Wheelbarrows, 12=
Humans, 13= Any other please specify
26 What are the 3 main constraints to transporting
commodities to you/your clients? Please rank
them in order of importance
Use codes in Q 24
27 Do you have access to market information? 1= Yes, 0= No
28 If, yes, what kind of Market Information do you
get?
1= On price, 2= On volume of the commodity, 3= On Quality of the
commodity, 4= On Transport costs, 5= On Storage price, 6= On what
the competition is doing, 7= Any other, please specify
29 Main constraints and challenges in bean trade 1= Seasons (heavy rains, etc), 2= Lack of access to credit, 3= Irregular
quantities of supply by wholesalers/suppliers/producers, 4= Lack of
storage, 5= High transport costs, 6= Lack of good roads, 7= Low profit
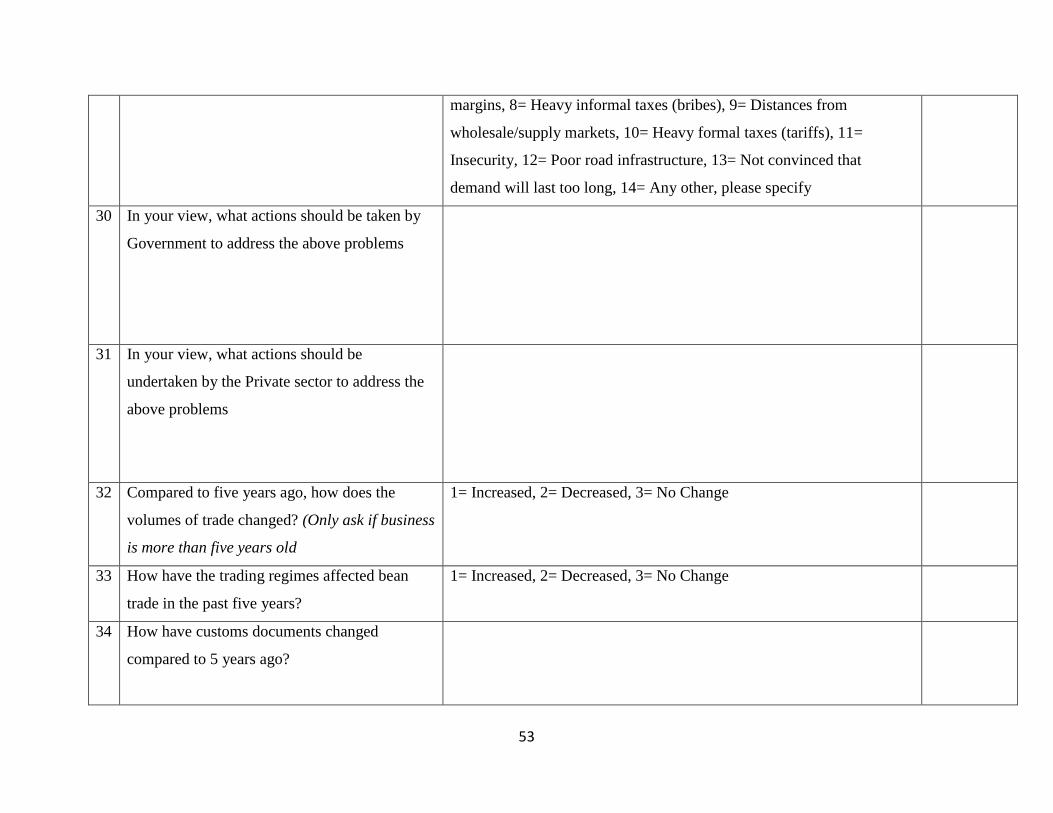
53
margins, 8= Heavy informal taxes (bribes), 9= Distances from
wholesale/supply markets, 10= Heavy formal taxes (tariffs), 11=
Insecurity, 12= Poor road infrastructure, 13= Not convinced that
demand will last too long, 14= Any other, please specify
30 In your view, what actions should be taken by
Government to address the above problems
31 In your view, what actions should be
undertaken by the Private sector to address the
above problems
32 Compared to five years ago, how does the
volumes of trade changed? (Only ask if business
is more than five years old
1= Increased, 2= Decreased, 3= No Change
33 How have the trading regimes affected bean
trade in the past five years?
1= Increased, 2= Decreased, 3= No Change
34 How have customs documents changed
compared to 5 years ago?
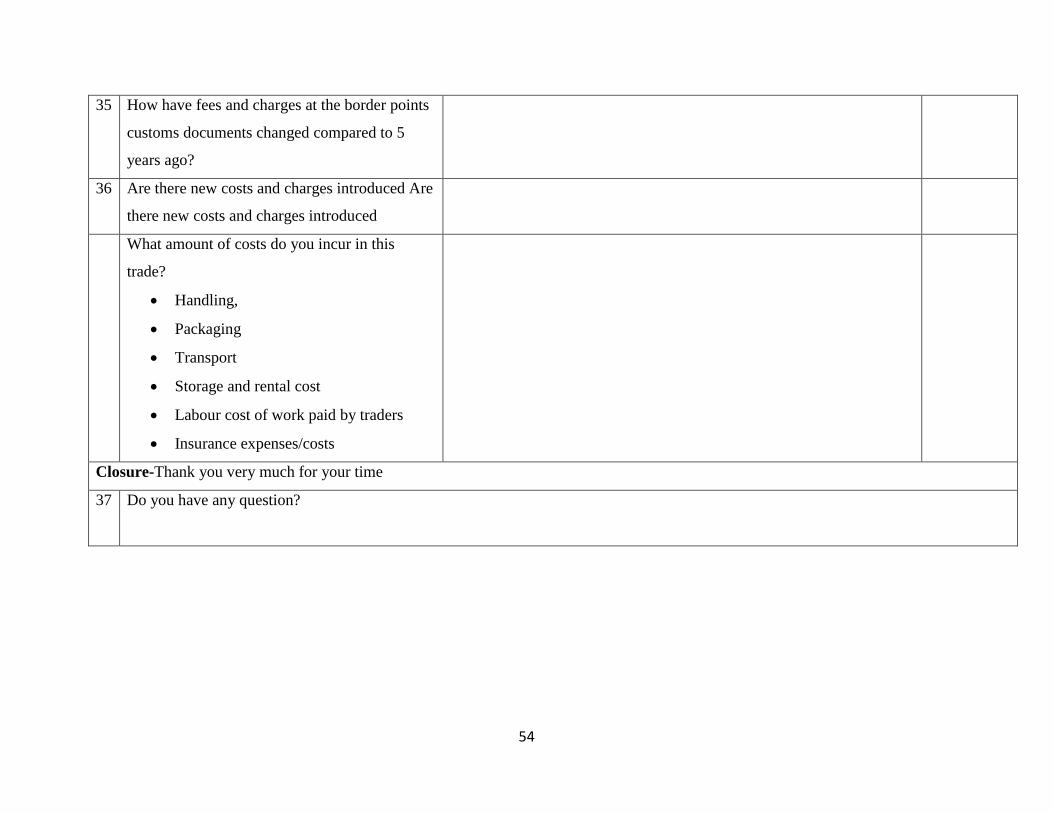
54
35 How have fees and charges at the border points
customs documents changed compared to 5
years ago?
36 Are there new costs and charges introduced Are
there new costs and charges introduced
What amount of costs do you incur in this
trade?
Handling,
Packaging
Transport
Storage and rental cost
Labour cost of work paid by traders
Insurance expenses/costs
Closure-Thank you very much for your time
37 Do you have any question?
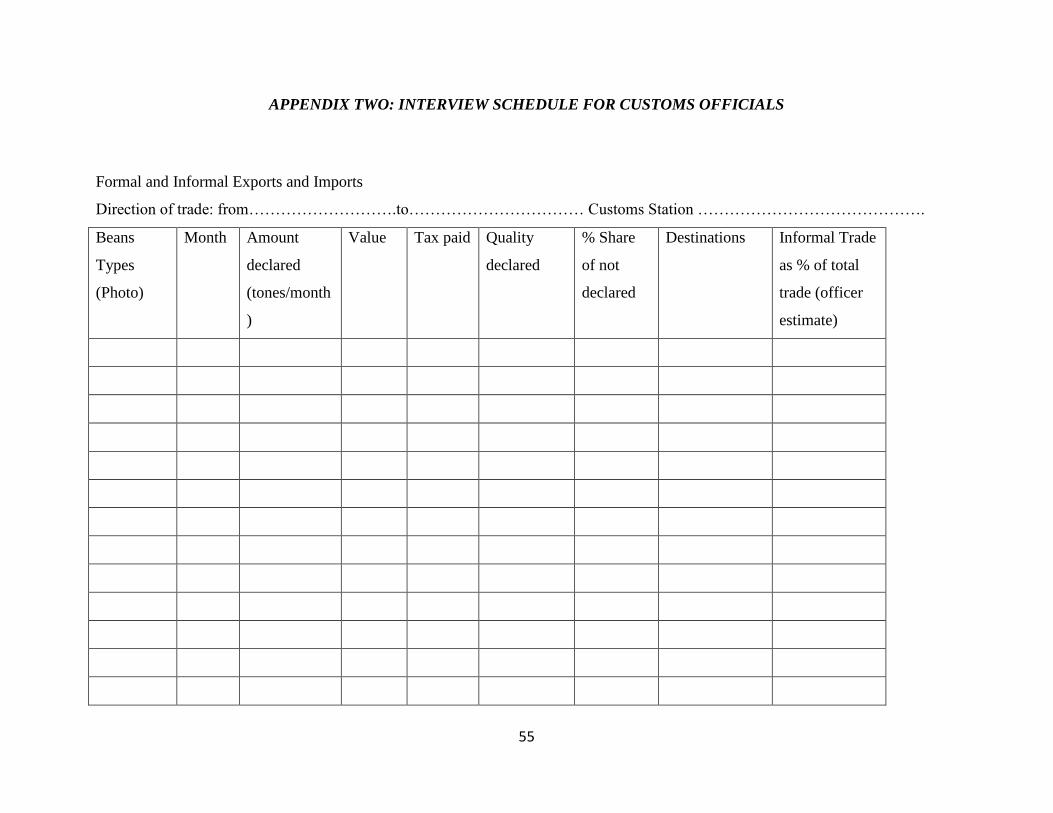
55
APPENDIX TWO: INTERVIEW SCHEDULE FOR CUSTOMS OFFICIALS
Formal and Informal Exports and Imports
Direction of trade: from……………………….to…………………………… Customs Station …………………………………….
Beans
Types
(Photo)
Month Amount
declared
(tones/month
)
Value
Tax paid Quality
declared
% Share
of not
declared
Destinations
Informal Trade
as % of total
trade (officer
estimate)
56


![Developmental Pleiotropy Shaped the Roots of the Domesticated Common Bean (Phaseolus ... · Developmental Pleiotropy Shaped the Roots of the Domesticated Common Bean (Phaseolus vulgaris)1[OPEN]](https://img.pdfslide.net/doc/110x75/60ee2fed3bf8310ac958c6f5/developmental-pleiotropy-shaped-the-roots-of-the-domesticated-common-bean-phaseolus.jpg)