Embed Size (px)
Citation preview
Prepared for:
THE RENEWABLE FUELS FOUNDATION
Prepared by:
July 2011
ANALYSIS OF CORN, COMMODITY, AND CONSUMER
FOOD PRICES
ANALYSIS OF CORN, COMMODITY, AND CONSUMER FOOD PRICES
© i
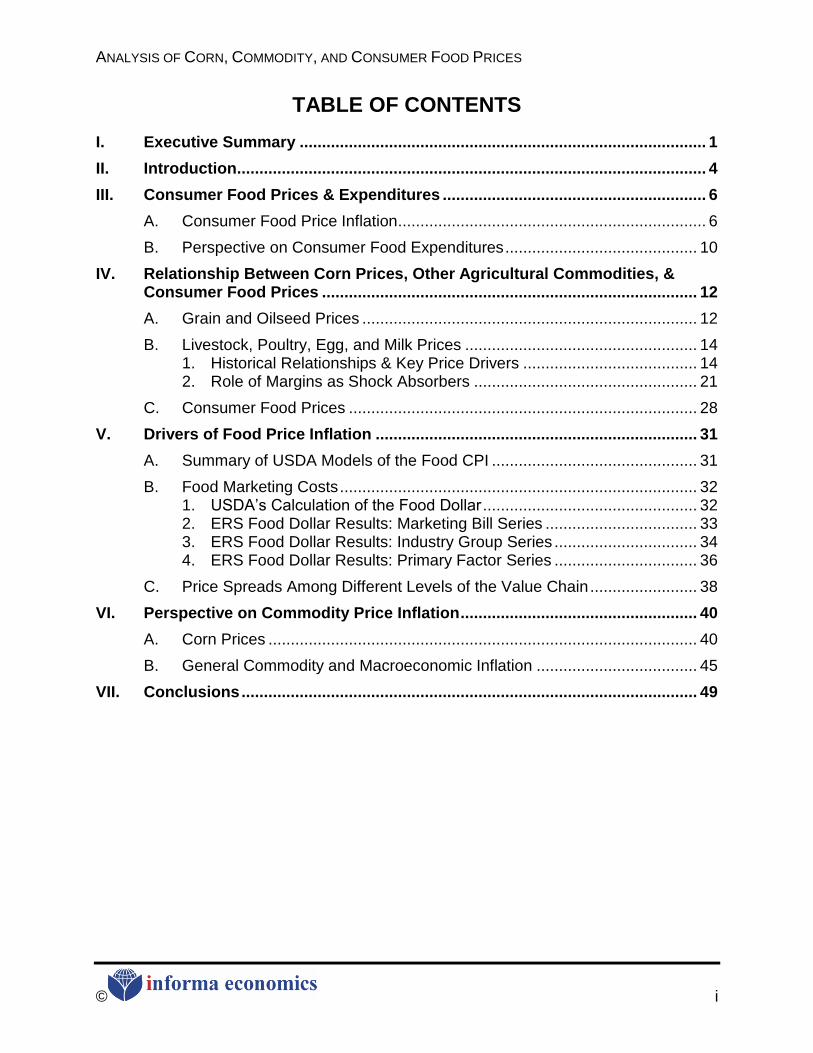
TABLE OF CONTENTS
I. Executive Summary ........................................................................................... 1
II. Introduction ......................................................................................................... 4
III. Consumer Food Prices & Expenditures ........................................................... 6
A. Consumer Food Price Inflation ..................................................................... 6
B. Perspective on Consumer Food Expenditures ........................................... 10
IV. Relationship Between Corn Prices, Other Agricultural Commodities, & Consumer Food Prices .................................................................................... 12
A. Grain and Oilseed Prices ........................................................................... 12
B. Livestock, Poultry, Egg, and Milk Prices .................................................... 14 1. Historical Relationships & Key Price Drivers ....................................... 14 2. Role of Margins as Shock Absorbers .................................................. 21
C. Consumer Food Prices .............................................................................. 28
V. Drivers of Food Price Inflation ........................................................................ 31
A. Summary of USDA Models of the Food CPI .............................................. 31
B. Food Marketing Costs ................................................................................ 32 1. USDA‘s Calculation of the Food Dollar ................................................ 32
2. ERS Food Dollar Results: Marketing Bill Series .................................. 33 3. ERS Food Dollar Results: Industry Group Series ................................ 34
4. ERS Food Dollar Results: Primary Factor Series ................................ 36
C. Price Spreads Among Different Levels of the Value Chain ........................ 38
VI. Perspective on Commodity Price Inflation ..................................................... 40
A. Corn Prices ................................................................................................ 40
B. General Commodity and Macroeconomic Inflation .................................... 45
VII. Conclusions ...................................................................................................... 49
ANALYSIS OF CORN, COMMODITY, AND CONSUMER FOOD PRICES
© ii
LIST OF TABLES
Table 1: U.S. Exports of Shell Eggs and Egg Products, 2000 - 2010 ............................ 17 Table 2: Corn/Cattle Price Correlation Coefficients ....................................................... 19 Table 3: Corn/Hog Price Correlation Coefficients .......................................................... 19 Table 4: Corn/Broiler Price Correlation Coefficients ...................................................... 20
Table 5: Corn/Egg Price Correlation Coefficients .......................................................... 21 Table 6: Corn/Milk Price Correlation Coefficients .......................................................... 21 Table 7: Broiler Production Costs and Impact of Higher Corn Price .............................. 27 Table 8: Egg Cost of Production Model ......................................................................... 27 Table 9: Relationship Between Annual Crop-Year Changes in Food CPI Sub-
Indices and Corn Price Changes .......................................................................... 30 Table 10: U.S. Corn Balance Sheet .............................................................................. 44
ANALYSIS OF CORN, COMMODITY, AND CONSUMER FOOD PRICES
© iii
LIST OF FIGURES
Figure 1: Historical Evolution of the Consumer Price Index for Food ............................. 6 Figure 2: Historical Year-to-Year Change in the Food CPI Compared to the Core
CPI .......................................................................................................................... 7 Figure 3: Historical Year-to-Year change in Consumer Food Price Inflation: At-
Home Versus Away-From-Home ............................................................................ 8 Figure 4: Consumer Price Indices ................................................................................... 9 Figure 5: Consumer Food Expenditures: Percent of Disposable Income Spent on
Food at Home vs. Away from Home ..................................................................... 10 Figure 6: Percent of Total Food Expenditures Spent at Home vs. Away from
Home .................................................................................................................... 11 Figure 7: Historical Grain and Oilseed Prices (January 1985 - April 2011) ................... 12
Figure 8: Corn, Livestock, Poultry, and Egg Prices, 1998/99 – 2009/10 ....................... 15 Figure 9: Corn Price Comparison to the Milk Price ....................................................... 15 Figure 10: Growth in World Milk Product Demand ........................................................ 18 Figure 11: Cattle-Feeding Margins ................................................................................ 22
Figure 12 : Net Packer Margins, Based on Weighted Cutout ........................................ 23 Figure 13: Farrow-to-Finish Margins ............................................................................. 24
Figure 14: Broiler Margins ............................................................................................. 26 Figure 15: Milk Production Margins ............................................................................... 28 Figure 16: Yearly Changes in Food CPI as a Function of Corn Price Changes ............ 29
Figure 17: Marketing Bill Series - Farm and Marketing Bill Share of Food Dollar, 1993-2008 ............................................................................................................ 34
Figure 18: Industry Group Series - Food Dollar by Industry Group, 1993-2008 ............ 35
Figure 19: Industry Group Series - Share of Food Dollar by Industry Group, 2008 ....... 36
Figure 20: Primary Factor Series - Share of Food Dollar by Primary Factor, 1997-2008 ...................................................................................................................... 37
Figure 21: Primary Factor Series - Share of Food Dollar by Primary Factor, 2008 ....... 37 Figure 22: Farm-to-Retail Price Spreads ....................................................................... 38 Figure 23: Beef Price Spreads ...................................................................................... 39
Figure 24: Pork Price Spreads ...................................................................................... 39 Figure 25: Corn Supply/Demand Dynamics, Crop Years 2004/05 – 2010/11 ............... 43 Figure 26: Monthly Average Reuters/Jeffries CRB Futures Index, January 1970 –
March 2011 ........................................................................................................... 45
Figure 27: Reuters/Jeffries CRB Futures Index vs. NYMEX Crude Oil Futures, August 1999 to April 2011 .................................................................................... 46
Figure 28: U.S. Dollar Exchange Rate vs. the Euro ...................................................... 47
Figure 29: Year-Over-Year Percent Changes in the Reuters/Jeffries CRB and CPI Indexes, 1970 – March 2011 ......................................................................... 48
ANALYSIS OF CORN, COMMODITY, AND CONSUMER FOOD PRICES
© 1
I. EXECUTIVE SUMMARY
Public debate has intensified over the extent to which the expansion of the ethanol industry has resulted in higher agricultural commodity prices and, more importantly, whether and to what extent there has been an impact on consumer food prices. This debate has largely been fueled by anecdotal information. Given that this issue has bearing on major policy decisions with respect to agriculture and renewable energy, it is imperative that an objective, fact-based assessment be available to public policymakers. The Renewable Fuels Foundation (―RFF‖) commissioned Informa Economics, Inc. (―Informa‖) to update a previously conducted study, and the results are contained in this report.
Key Findings Statistical evidence does not support a conclusion that the growth in the ethanol
industry is driving consumer food prices higher. It can be concluded that no single factor is the driver of consumer food prices over time, but rather, there is a complex and interrelated set of factors that contribute to food prices.
Ethanol has not been the only factor influencing corn prices; other supply and demand factors have also been at play.
Corn prices have a relatively weak correlation with food prices, as the farm share is a relatively small portion of the overall retail food dollar and for many products corn is only a portion of the farm value. The prices of other components in the marketing bill have also been increasing and general inflationary pressures have also impacted food prices. Increases in these other marketing bill components are contributing to food price increases, as reflected in the growing farm-to-retail price spread for many food categories. Additionally, to put this all in perspective, the share of disposable income spent on food has been decreasing.
An analysis was performed to quantify the historical price relationships between corn prices and livestock, poultry, egg, and milk prices, and the results showed relatively weak correlations. With these low correlations, it is statistically unsupported to suggest that high and/or rising corn prices are the only or even the main reason behind high and rising retail meat, egg and milk product prices. Moreover, the upward trend in cattle, hog and poultry prices began in the late 1990s, well before the corn price began to increase significantly. For many of these commodities, notably dairy and eggs, strong export demand has played a key role in strengthening prices.
More generally, there has historically been very little relationship between annual changes in corn prices and consumer food prices. The corn price would be considered a statistically insignificant variable in determining what drives the food CPI.
ANALYSIS OF CORN, COMMODITY, AND CONSUMER FOOD PRICES
© 2
Given the weak correlation between corn prices and consumer food prices, it can be hypothesized that a considerable proportion of the impact of corn price changes is absorbed by participants in the value chains for meats, poultry and other corn-based food products. This does not necessarily mean that margins within the value chain are low or negative, but rather that they are lower than they would be in the absence of higher corn prices. Additionally, the price spread between the farm value and the retail dollar is widening, implying that rising costs within the marketing bill are contributing to the food price increases.
Consumer food prices have been increasing at a relatively steady pace over the last two decades. While food prices have increased, a portion of this increase can be attributed to general inflationary pressures. Over the 1985-2010 time period, the average annual inflation rate of the core CPI (all items less food and energy) has been 2.88%, which is very close to the 2.98% average food CPI growth rate. Food CPI inflation was notably higher in 2007 and 2008, reaching a peak historical (1986-2010) differential of 3.22% in 2008, but this differential between the core CPI inflation and food CPI inflation has since come back in line.
To provide context to an analysis of consumer food prices, it is useful to consider the role of food expenditures in the average American‘s budget. The proportion of the average American‘s disposable income that is spent on food has declined steadily over the last half-century, from 21% of disposable income in 1950 to below 10% by 2000; in 2009 this share was estimated at 9.5%.
The ―farm value‖ of commodity raw materials used in foods accounts for 16% (20081) of total U.S. food costs, a proportion that has declined significantly from 37% in 1973. For food products where corn is only one of several farm-produced inputs, the proportion of the total product cost attributable to the cost of corn is even less than 16%. The remaining portion of total retail food costs is known as the marketing bill. The marketing bill includes the costs of labor, packaging, transportation, energy, profits, advertising, depreciation, rent, interest, repairs, business taxes and other costs not attributable to basic agricultural commodities. The marketing bill has a higher correlation with the consumer price index (CPI) for food then does corn, although there is a notable long-term upward trend to both the marketing bill and the food CPI. Within the overall marketing bill, the costs of energy and transportation have increased considerably over the last several years, with crude oil prices surging from just under $60 per barrel in fall 2006, reaching above $100 per barrel in the first half of 2008, falling back down during the economic recession and again breaking $100 per barrel in 2011, roughly the same periods during which corn prices have increased.
Corn prices have been influenced by a combination of factors – not just ethanol demand. The following briefly explains some of the key corn price drivers over the past five years.
1 Last date reported
ANALYSIS OF CORN, COMMODITY, AND CONSUMER FOOD PRICES
© 3
o A combination of a reduction in supply and an increase in demand from
both the ethanol industry and the export market led to corn prices moving higher, starting in fall 2006.
o In 2007/08, corn prices were not able to fall as would have been expected given the size of the crop due to strong corn demand. In 2007/08, corn usage in feed and ethanol production increased and exports increased further. One of the factors behind the strong export demand growth had to do with drought conditions in other key grain production countries, particularly the key wheat producing country of Australia. Additionally, the decline in the U.S. dollar has also helped strengthen world grain demand.
o In 2008/09 and 2009/10 corn prices receded despite continued growth in
the ethanol industry, as the corn usage for feed and corn exports were 88% and 79% of 2007/08 level.
o The corn futures price rose again in the 2010/11 crop year. However,
unlike the price increase in 2006/07 and 2007/08, 2010/11 did not coincide with a significant increase in ethanol production. In fact ethanol production increases have been flattening out as capacity approaches the 15 billion gallon per year mandate level for 2015. The price increase in 2010/11 is largely a combination of strong export demand, unfavorable August weather, and a run-up in petroleum prices that increase production costs and soybean prices, for which corn competes with for acreage.
ANALYSIS OF CORN, COMMODITY, AND CONSUMER FOOD PRICES
© 4
II. INTRODUCTION
Public debate has recently intensified over the extent to which the expansion of the ethanol industry has resulted in higher agricultural commodity prices and, more importantly, whether and to what extent there has been an impact on consumer food prices. This debate has been fueled mainly by anecdotal information. Given that this issue has bearing on major policy decisions with respect to agriculture and renewable energy, it is imperative that an objective, fact-based assessment be available to public policymakers. The Renewable Fuels Foundation (―RFF‖) commissioned Informa Economics, Inc. (―Informa‖) to update a previously conducted study, and the results are contained in this report. In 2007, Informa conducted an analysis of potential causes of consumer food price inflation. Through this analysis the key findings resulted in little evidence of such simplistic cause-and-effect linkages between consumer food prices being driven higher by an ethanol-induced increase in corn prices. In reality, a complex set of factors drive the food CPI. Additionally the statistical evidence did not support a conclusion that there is a strict ―food-versus-fuel‖ tradeoff. In light of recent corn price increases and the re-emergence of the food versus fuel debate, the purpose of this analysis is to take a current look at the linkage taking into account updated data. As a result of the confluence of several factors that are explained in Section VI.A of this report, nearby corn futures increased to an average of $3.54 per bushel during the 2006/2007 crop-marketing year, which was a substantial increase from the $2.09 per bushel that were experienced at the beginning of the crop year in August 2006. Similarly, it was considerably higher than the $2.23 per bushel average experienced during the 2005/06 crop year. However, other costs incurred in the production and distribution of food products were moving higher as well. Transportation costs were also increasing during this timeframe, propelled higher partly by increasing fuel prices and partly by capacity tightness relative to strengthening demand for transportation services. The price of crude oil (West Texas Intermediate) hovered just below $60 per barrel in fall 2006, then increased to the $60-$70 per barrel range in the spring and early summer of 2007 and further to the $70-$80 per barrel range in the late summer and early fall of 2007. By the first half of 2008, the price had surged to above $100 per barrel. Corn prices spiked again in 2010/11, with an expected corn futures average price of $6.35 per bushel. However, unlike in 2006 and 2007, 2010 did not coincide with a significant increase in ethanol production. In fact, ethanol production increases have been flattening out as capacity approaches the 15 billion gallon per year mandate level. Thus, the 2010 price increase cannot be wholly attributed to increased demand on the part of the ethanol industry. The price increase in 2010 is largely a combination of strong export demand, unfavorable August weather which resulted in lower crop yield, and a run-up in petroleum prices that increase production costs and soybean prices, for which corn competes with for acreage.
ANALYSIS OF CORN, COMMODITY, AND CONSUMER FOOD PRICES
© 5
As will be discussed in this report, ethanol production is not the only factor influencing corn price movements, and corn price movements are not the sole factor driving consumer food prices. No single factor is the driver of consumer food prices, but rather there is a complex and interrelated set of factors that contribute to food price inflation. Corn is only part of the farm value of food, and the farm value is only a small portion of the overall retail food dollar. Other marketing costs incurred to transport and transform the farm product to the retail product are large influencers of the ultimate retail food price.
ANALYSIS OF CORN, COMMODITY, AND CONSUMER FOOD PRICES
© 6
III. CONSUMER FOOD PRICES & EXPENDITURES
A. CONSUMER FOOD PRICE INFLATION
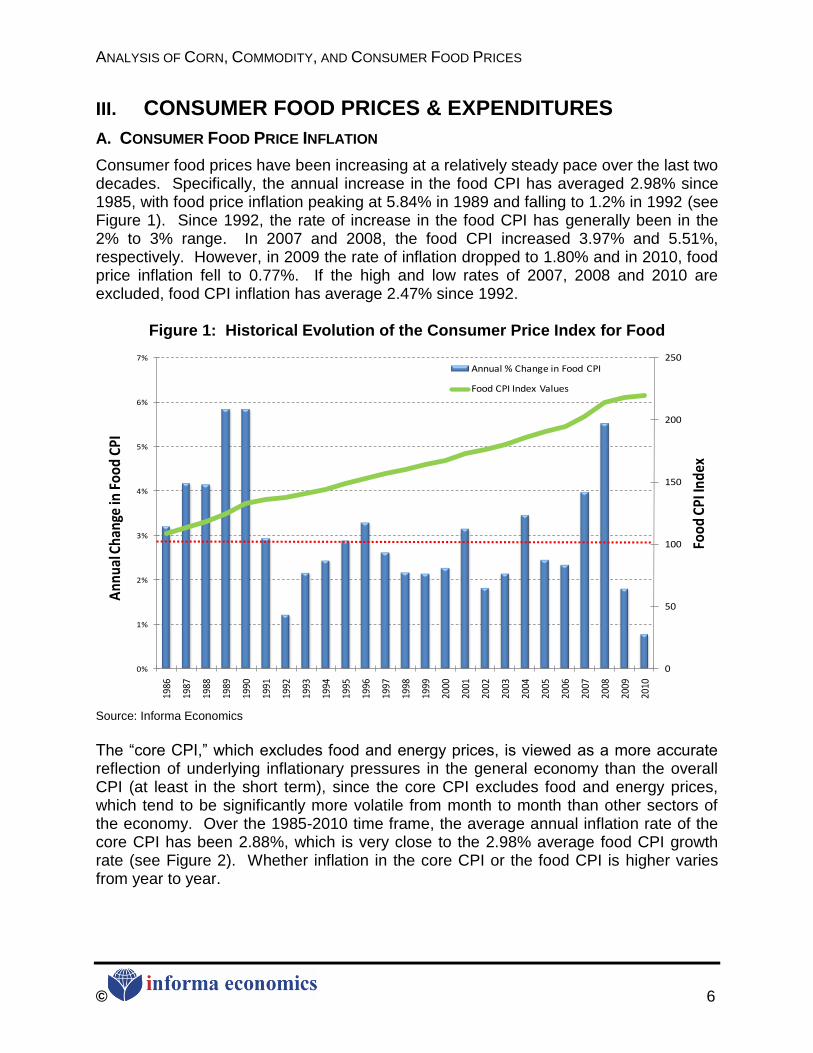
Consumer food prices have been increasing at a relatively steady pace over the last two decades. Specifically, the annual increase in the food CPI has averaged 2.98% since 1985, with food price inflation peaking at 5.84% in 1989 and falling to 1.2% in 1992 (see Figure 1). Since 1992, the rate of increase in the food CPI has generally been in the 2% to 3% range. In 2007 and 2008, the food CPI increased 3.97% and 5.51%, respectively. However, in 2009 the rate of inflation dropped to 1.80% and in 2010, food price inflation fell to 0.77%. If the high and low rates of 2007, 2008 and 2010 are excluded, food CPI inflation has average 2.47% since 1992.
Figure 1: Historical Evolution of the Consumer Price Index for Food
0
50
100
150
200
250
0%
1%
2%
3%
4%
5%
6%
7%
1986
1987
1988
1989
1990
1991
1992
1993
1994
1995
1996
1997
1998
1999
2000
2001
2002
2003
2004
2005
2006
2007
2008
2009
2010
Food
CPI
Inde
x
Ann
ual C
hang
e in
Foo
d CP
I
Annual % Change in Food CPI
Food CPI Index Values
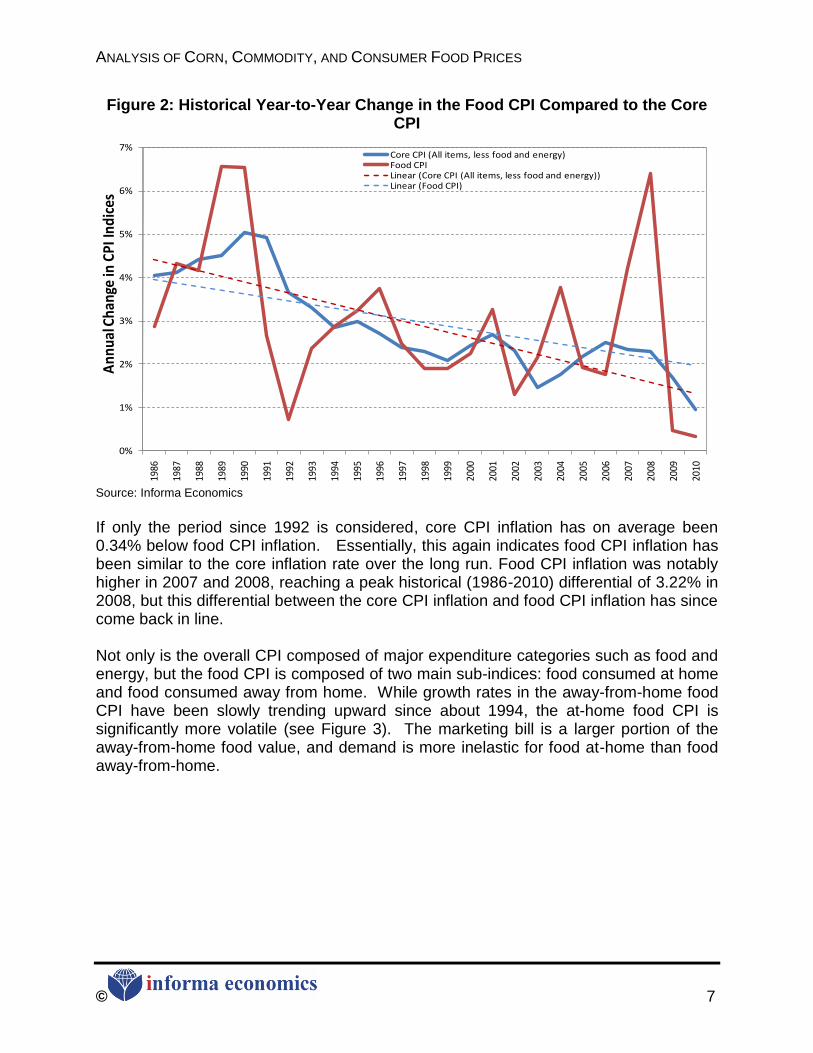
Source: Informa Economics The ―core CPI,‖ which excludes food and energy prices, is viewed as a more accurate reflection of underlying inflationary pressures in the general economy than the overall CPI (at least in the short term), since the core CPI excludes food and energy prices, which tend to be significantly more volatile from month to month than other sectors of the economy. Over the 1985-2010 time frame, the average annual inflation rate of the core CPI has been 2.88%, which is very close to the 2.98% average food CPI growth rate (see Figure 2). Whether inflation in the core CPI or the food CPI is higher varies from year to year.
ANALYSIS OF CORN, COMMODITY, AND CONSUMER FOOD PRICES
© 7
Figure 2: Historical Year-to-Year Change in the Food CPI Compared to the Core CPI
0%
1%
2%
3%
4%
5%
6%
7%19
86
1987
1988
1989
1990
1991
1992
1993
1994
1995
1996
1997
1998
1999
2000
2001
2002
2003
2004
2005
2006
2007
2008
2009
2010
Ann
ual C
hang
e in
CPI
Indi
ces
Core CPI (All items, less food and energy)Food CPILinear (Core CPI (All items, less food and energy))Linear (Food CPI)
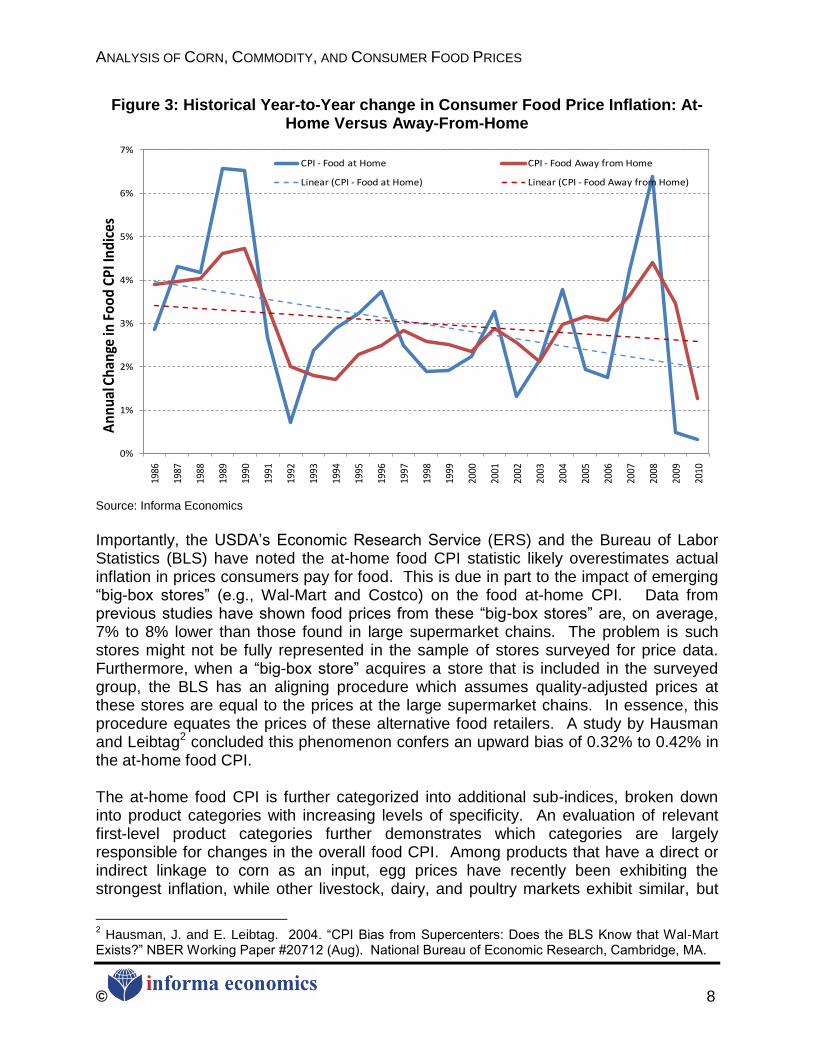
Source: Informa Economics If only the period since 1992 is considered, core CPI inflation has on average been 0.34% below food CPI inflation. Essentially, this again indicates food CPI inflation has been similar to the core inflation rate over the long run. Food CPI inflation was notably higher in 2007 and 2008, reaching a peak historical (1986-2010) differential of 3.22% in 2008, but this differential between the core CPI inflation and food CPI inflation has since come back in line. Not only is the overall CPI composed of major expenditure categories such as food and energy, but the food CPI is composed of two main sub-indices: food consumed at home and food consumed away from home. While growth rates in the away-from-home food CPI have been slowly trending upward since about 1994, the at-home food CPI is significantly more volatile (see Figure 3). The marketing bill is a larger portion of the away-from-home food value, and demand is more inelastic for food at-home than food away-from-home.
ANALYSIS OF CORN, COMMODITY, AND CONSUMER FOOD PRICES
© 8
Figure 3: Historical Year-to-Year change in Consumer Food Price Inflation: At-Home Versus Away-From-Home
0%
1%
2%
3%
4%
5%
6%
7%19
86
1987
1988
1989
1990
1991
1992
1993
1994
1995
1996
1997
1998
1999
2000
2001
2002
2003
2004
2005
2006
2007
2008
2009
2010
Ann
ual C
hang
e in
Foo
d CP
I Ind
ices
CPI - Food at Home CPI - Food Away from Home
Linear (CPI - Food at Home) Linear (CPI - Food Away from Home)
Source: Informa Economics Importantly, the USDA‘s Economic Research Service (ERS) and the Bureau of Labor Statistics (BLS) have noted the at-home food CPI statistic likely overestimates actual inflation in prices consumers pay for food. This is due in part to the impact of emerging ―big-box stores‖ (e.g., Wal-Mart and Costco) on the food at-home CPI. Data from previous studies have shown food prices from these ―big-box stores‖ are, on average, 7% to 8% lower than those found in large supermarket chains. The problem is such stores might not be fully represented in the sample of stores surveyed for price data. Furthermore, when a ―big-box store‖ acquires a store that is included in the surveyed group, the BLS has an aligning procedure which assumes quality-adjusted prices at these stores are equal to the prices at the large supermarket chains. In essence, this procedure equates the prices of these alternative food retailers. A study by Hausman and Leibtag2 concluded this phenomenon confers an upward bias of 0.32% to 0.42% in the at-home food CPI. The at-home food CPI is further categorized into additional sub-indices, broken down into product categories with increasing levels of specificity. An evaluation of relevant first-level product categories further demonstrates which categories are largely responsible for changes in the overall food CPI. Among products that have a direct or indirect linkage to corn as an input, egg prices have recently been exhibiting the strongest inflation, while other livestock, dairy, and poultry markets exhibit similar, but
2 Hausman, J. and E. Leibtag. 2004. ―CPI Bias from Supercenters: Does the BLS Know that Wal-Mart
Exists?‖ NBER Working Paper #20712 (Aug). National Bureau of Economic Research, Cambridge, MA.
ANALYSIS OF CORN, COMMODITY, AND CONSUMER FOOD PRICES
© 9
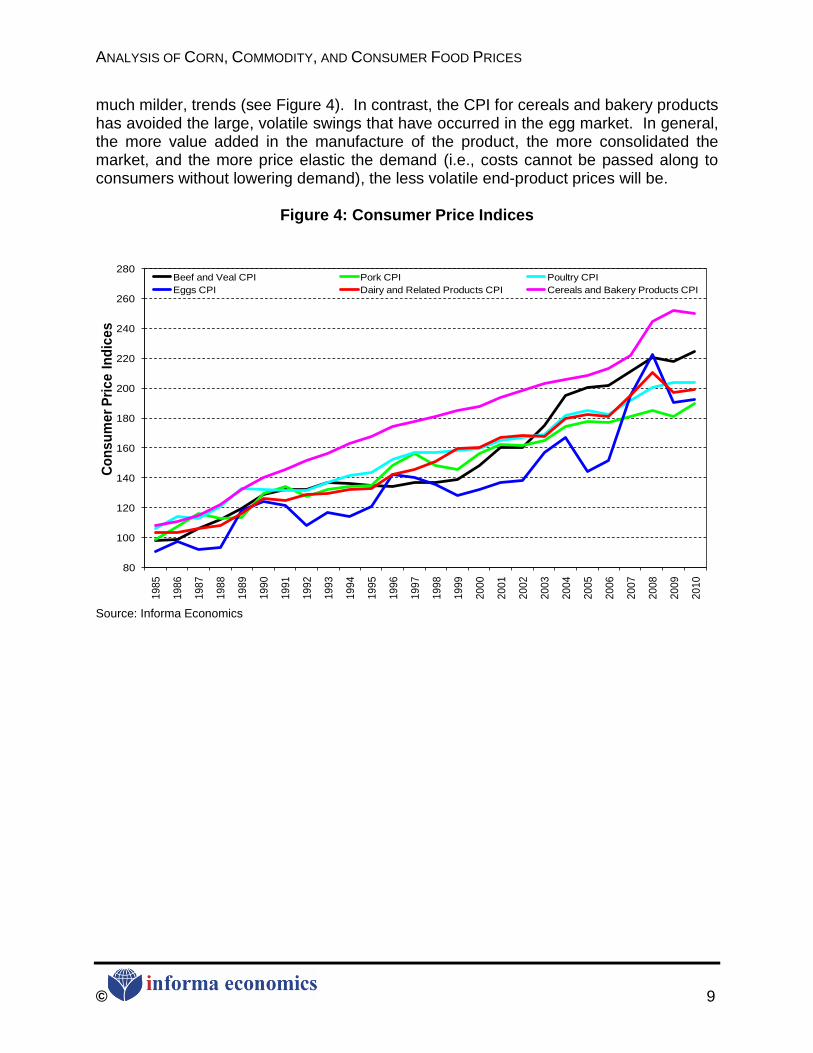
much milder, trends (see Figure 4). In contrast, the CPI for cereals and bakery products has avoided the large, volatile swings that have occurred in the egg market. In general, the more value added in the manufacture of the product, the more consolidated the market, and the more price elastic the demand (i.e., costs cannot be passed along to consumers without lowering demand), the less volatile end-product prices will be.
Figure 4: Consumer Price Indices
80
100
120
140
160
180
200
220
240
260
280
19
85
19
86
19
87
19
88
19
89
19
90
19
91
19
92
19
93
19
94
19
95
19
96
19
97
19
98
19
99
20
00
20
01
20
02
20
03
20
04
20
05
20
06
20
07
20
08
20
09
20
10
Co
ns
um
er
Pri
ce
In
dic
es
Beef and Veal CPI Pork CPI Poultry CPI
Eggs CPI Dairy and Related Products CPI Cereals and Bakery Products CPI
Source: Informa Economics
ANALYSIS OF CORN, COMMODITY, AND CONSUMER FOOD PRICES
© 10
B. PERSPECTIVE ON CONSUMER FOOD EXPENDITURES
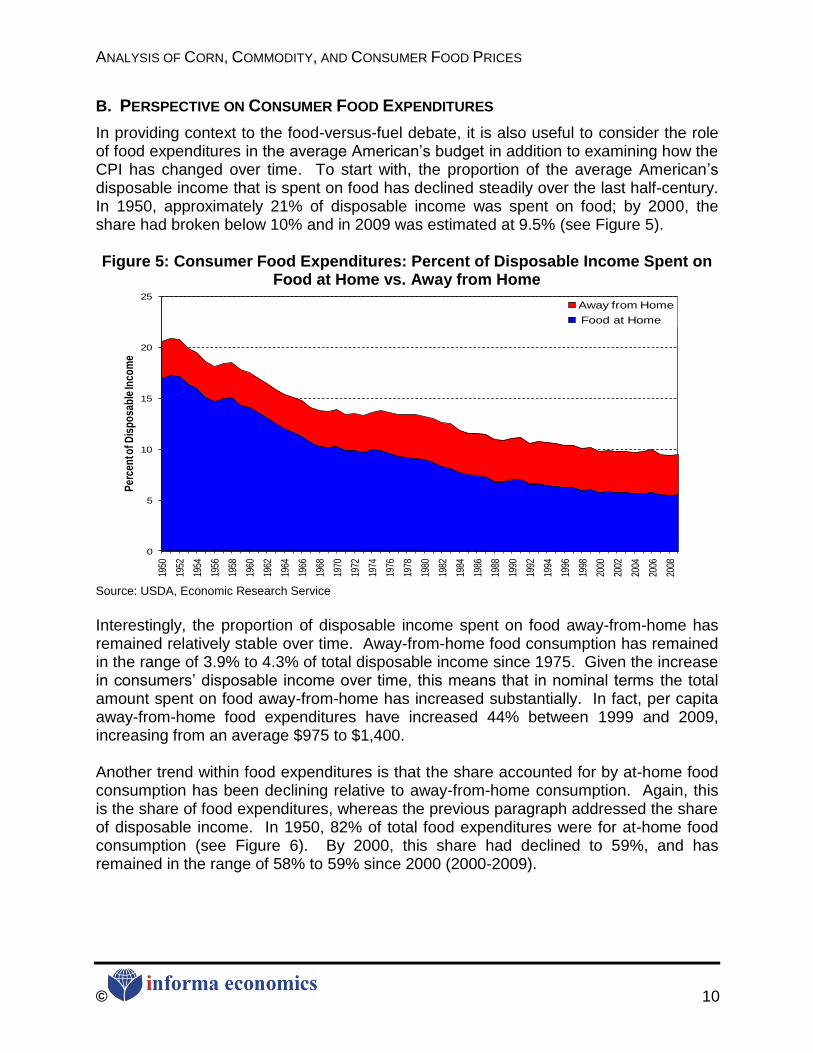
In providing context to the food-versus-fuel debate, it is also useful to consider the role of food expenditures in the average American‘s budget in addition to examining how the CPI has changed over time. To start with, the proportion of the average American‘s disposable income that is spent on food has declined steadily over the last half-century. In 1950, approximately 21% of disposable income was spent on food; by 2000, the share had broken below 10% and in 2009 was estimated at 9.5% (see Figure 5). Figure 5: Consumer Food Expenditures: Percent of Disposable Income Spent on
Food at Home vs. Away from Home
0
5
10
15
20
25
1950
1952
1954
1956
1958
1960
1962
1964
1966
1968
1970
1972
1974
1976
1978
1980
1982
1984
1986
1988
1990
1992
1994
1996
1998
2000
2002
2004
2006
2008
Per
cen
t of D
isp
osa
ble
Inco
me
Away from Home
Food at Home
Source: USDA, Economic Research Service
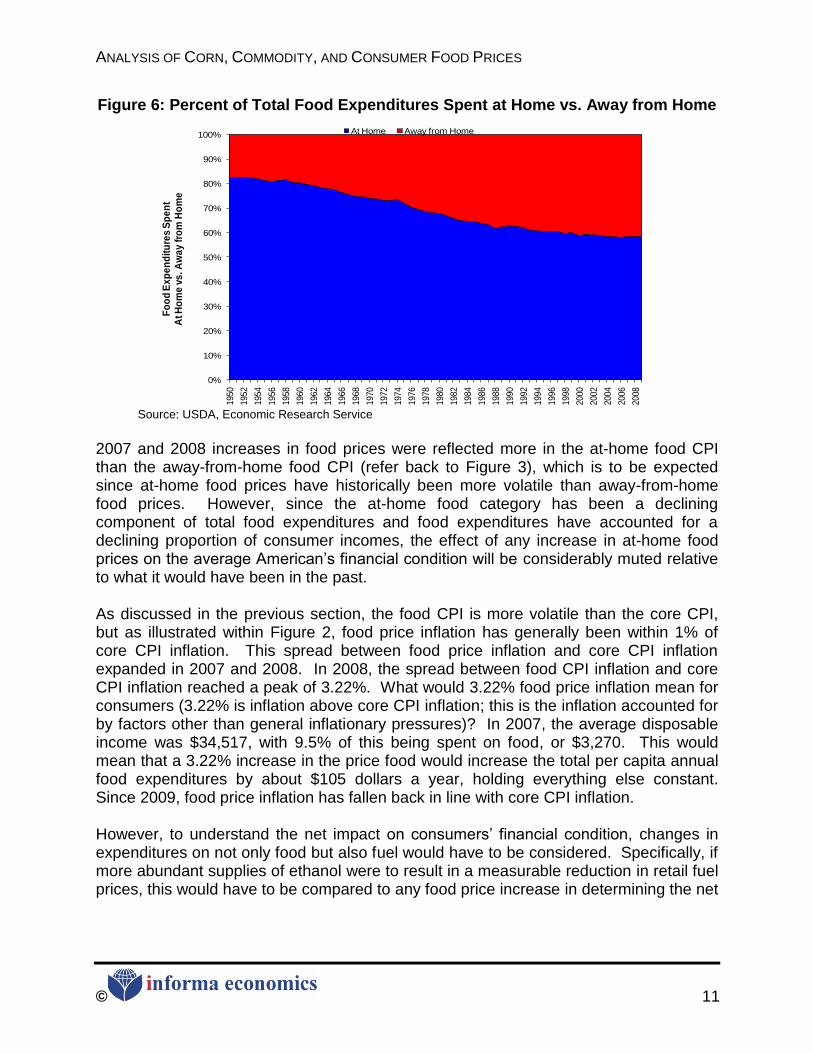
Interestingly, the proportion of disposable income spent on food away-from-home has remained relatively stable over time. Away-from-home food consumption has remained in the range of 3.9% to 4.3% of total disposable income since 1975. Given the increase in consumers‘ disposable income over time, this means that in nominal terms the total amount spent on food away-from-home has increased substantially. In fact, per capita away-from-home food expenditures have increased 44% between 1999 and 2009, increasing from an average $975 to $1,400. Another trend within food expenditures is that the share accounted for by at-home food consumption has been declining relative to away-from-home consumption. Again, this is the share of food expenditures, whereas the previous paragraph addressed the share of disposable income. In 1950, 82% of total food expenditures were for at-home food consumption (see Figure 6). By 2000, this share had declined to 59%, and has remained in the range of 58% to 59% since 2000 (2000-2009).
ANALYSIS OF CORN, COMMODITY, AND CONSUMER FOOD PRICES
© 11
Figure 6: Percent of Total Food Expenditures Spent at Home vs. Away from Home
0%
10%
20%
30%
40%
50%
60%
70%
80%
90%
100%
1950
1952
1954
1956
1958
1960
1962
1964
1966
1968
1970
1972
1974
1976
1978
1980
1982
1984
1986
1988
1990
1992
1994
1996
1998
2000
2002
2004
2006
2008
Fo
od
Ex
pe
nd
itu
res
Sp
en
t A
t H
om
e v
s. A
wa
y f
rom
Ho
me
At Home Away from Home
Source: USDA, Economic Research Service
2007 and 2008 increases in food prices were reflected more in the at-home food CPI than the away-from-home food CPI (refer back to Figure 3), which is to be expected since at-home food prices have historically been more volatile than away-from-home food prices. However, since the at-home food category has been a declining component of total food expenditures and food expenditures have accounted for a declining proportion of consumer incomes, the effect of any increase in at-home food prices on the average American‘s financial condition will be considerably muted relative to what it would have been in the past. As discussed in the previous section, the food CPI is more volatile than the core CPI, but as illustrated within Figure 2, food price inflation has generally been within 1% of core CPI inflation. This spread between food price inflation and core CPI inflation expanded in 2007 and 2008. In 2008, the spread between food CPI inflation and core CPI inflation reached a peak of 3.22%. What would 3.22% food price inflation mean for consumers (3.22% is inflation above core CPI inflation; this is the inflation accounted for by factors other than general inflationary pressures)? In 2007, the average disposable income was $34,517, with 9.5% of this being spent on food, or $3,270. This would mean that a 3.22% increase in the price food would increase the total per capita annual food expenditures by about $105 dollars a year, holding everything else constant. Since 2009, food price inflation has fallen back in line with core CPI inflation. However, to understand the net impact on consumers‘ financial condition, changes in expenditures on not only food but also fuel would have to be considered. Specifically, if more abundant supplies of ethanol were to result in a measurable reduction in retail fuel prices, this would have to be compared to any food price increase in determining the net
ANALYSIS OF CORN, COMMODITY, AND CONSUMER FOOD PRICES
© 12
impact to consumers. The effect of ethanol on retail fuel prices is not addressed in this study3.
IV. RELATIONSHIP BETWEEN CORN PRICES, OTHER AGRICULTURAL COMMODITIES, & CONSUMER FOOD PRICES
This section analyzes the relationships among the prices of corn, other agricultural commodities, and consumer food prices. It examines whether there is a sufficient relationship between corn prices and other commodity and food prices to substantiate whether an increase in corn prices – regardless of the reason for the increase in corn prices – would cause an increase in the prices consumers pay for food.
A. GRAIN AND OILSEED PRICES
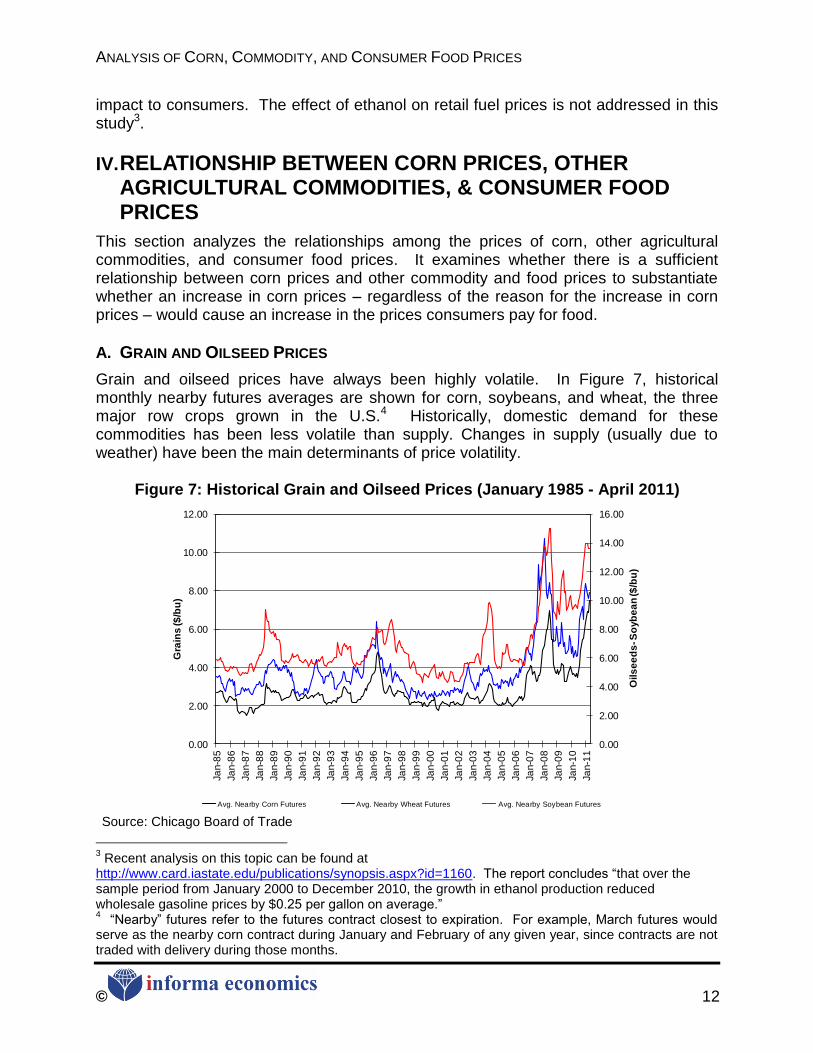
Grain and oilseed prices have always been highly volatile. In Figure 7, historical monthly nearby futures averages are shown for corn, soybeans, and wheat, the three major row crops grown in the U.S.4 Historically, domestic demand for these commodities has been less volatile than supply. Changes in supply (usually due to weather) have been the main determinants of price volatility.
Figure 7: Historical Grain and Oilseed Prices (January 1985 - April 2011)
0.00
2.00
4.00
6.00
8.00
10.00
12.00
14.00
16.00
0.00
2.00
4.00
6.00
8.00
10.00
12.00
Ja
n-8
5
Ja
n-8
6
Ja
n-8
7
Ja
n-8
8
Ja
n-8
9
Ja
n-9
0
Ja
n-9
1
Ja
n-9
2
Ja
n-9
3
Ja
n-9
4
Ja
n-9
5
Ja
n-9
6
Ja
n-9
7
Ja
n-9
8
Ja
n-9
9
Ja
n-0
0
Ja
n-0
1
Ja
n-0
2
Ja
n-0
3
Ja
n-0
4
Ja
n-0
5
Ja
n-0
6
Ja
n-0
7
Ja
n-0
8
Ja
n-0
9
Ja
n-1
0
Ja
n-1
1
Oils
ee
ds
-S
oyb
ea
n ($
/bu
)
Gra
ins
($
/bu
)
Avg. Nearby Corn Futures Avg. Nearby Wheat Futures Avg. Nearby Soybean Futures Source: Chicago Board of Trade
3 Recent analysis on this topic can be found at
http://www.card.iastate.edu/publications/synopsis.aspx?id=1160. The report concludes ―that over the sample period from January 2000 to December 2010, the growth in ethanol production reduced wholesale gasoline prices by $0.25 per gallon on average.‖ 4 ―Nearby‖ futures refer to the futures contract closest to expiration. For example, March futures would
serve as the nearby corn contract during January and February of any given year, since contracts are not traded with delivery during those months.
ANALYSIS OF CORN, COMMODITY, AND CONSUMER FOOD PRICES
© 13
While these three commodities have only limited substitutability for each other, conditions in one market can influence the prices in another. This section provides a brief overview of the complex historical relationships among these three markets. Price Relationships among Corn, Wheat and Soybeans
As was shown above in Figure 7, a general price relationship exists among these three crops. In 1995, the early frost that affected corn production also led to spikes in soybean and wheat prices. Just as the corn price increases were compounded by strong export demand, the wheat price increase was also compounded by other factors. These included low stocks that year and world supply issues, as production and export subsidies in the U.S. and EU were curtailed under the Uruguay Round of the General Agreement on Tariffs and Trade (now called the World Trade Organization, WTO). However, a weather problem for one crop does not necessarily always mean a supply problem for the other. A prime example of this is the drought of 2003, which affected the soybean crop but left the other two crops relatively unscathed. While weather plays a key role in explaining the relationship between these three commodities, it is not the only factor. Each market has its own set of supply and demand factors that can either exacerbate the problems in another market or help to mitigate potential price increases. Higher corn prices can influence wheat prices, but typically the reverse has not been true. This is because as corn prices move higher, wheat prices will be pulled higher to keep wheat from being used as a feed. However, the record wheat prices of 2007 are very much a result of supply-side issues. U.S. wheat supplies were reduced by adverse weather, including a spring freeze and unseasonably heavy rainfall around harvest. To add to the global supply problems, Australia‘s wheat production had fallen significantly due to drought. Eastern Europe, Ukraine, and to some extent Canada – all of which are large-scale wheat producers – were also experiencing supply issues. The recent wheat price increase in 2010/11 also reflects the negative impact of weather. U.S. wheat production was affected by floods and continued rain. Drought conditions again hit Western Australia and less than favorable conditions have been reported in some European Union countries. In general, the demand bases for wheat and corn are quite different since the crops‘ end-product uses are generally different, with corn mainly used as a feed grain and wheat mainly used as a food grain. Usually, the global wheat supply has a modest impact on corn exports, although for countries where wheat and barley are the primary feed grains, a weather problem can necessitate increased usage of other feed grains, including imported corn. Although there can be some linkage between the wheat and corn markets in such a case, corn futures prices were remaining at high levels in fall 2010 in order for corn to ―compete‖ against high-priced soybeans for acres to be planted in spring 2011; this competition is mainly with soybeans as opposed to wheat, since wheat is typically grown in areas that are not necessarily best suited for corn.
ANALYSIS OF CORN, COMMODITY, AND CONSUMER FOOD PRICES
© 14
This competition between corn and soybean acres has affected the price relationship between these two commodities over the last few years. For example, in the spring of 2006, futures prices provided a net revenue premium to grow soybeans compared to corn, and soybean acres expanded at the expense of corn. In 2007, the reverse was true, and corn acreage increased substantially. After the 2007 crop was made, the market realized that the pace of usage would bring soybean inventories to low levels at the end of the 2007/08 crop year, and if a larger soybean crop were not realized next year, the inventory situation would become particularly acute by the end of the 2008/09 crop year. This led to inflation in the corn price over what it would have been had it not had to compete with soybean acreage. While part of the increase in soybean prices can be attributed to the shift of some soybean acres to corn in 2007, it can be argued that the price of soybeans would not have gone quite so high had it not been for the price of crude oil (petroleum). The same can be said with the more recent run-up in soybean prices exhibited in 2010/11. In 2010/11, corn acreage expanded about 2.5% but soybean acreage stayed relatively stable. While the increase in soybean prices in 2010/11 may have helped subdue the corn acreage expansion relative to what would have been if soybean prices were lower, corn acreage gained primarily as a result of the low stocks-to-use ratio.
B. LIVESTOCK, POULTRY, EGG, AND MILK PRICES
1. Historical Relationships & Key Price Drivers
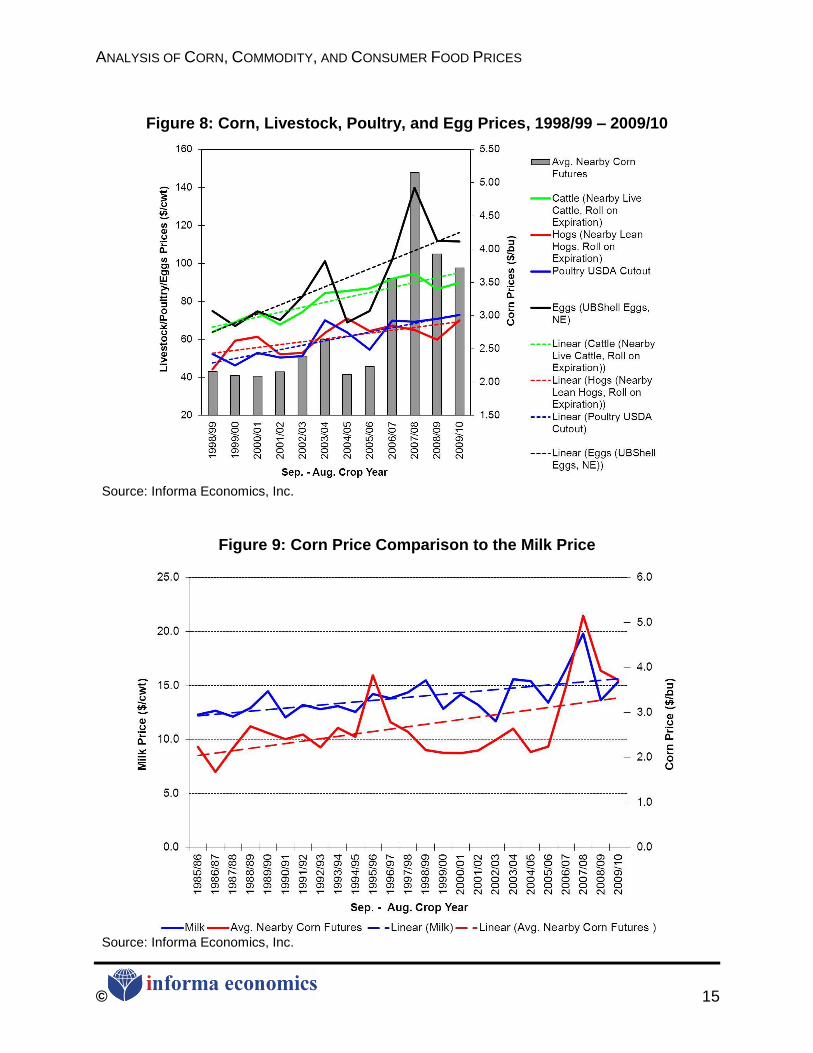
Figure 8 and Figure 9 provide a visual indication that while there does appear to be a relationship between corn prices and livestock, poultry, egg and milk prices, this relationship may not be as tight as some might expect, but rather, there are many other factors influencing livestock price movements. Feed costs are only one component, and feed costs affect the various livestock sectors differently depending on their reliance on corn, the demand elasticity for the derived livestock product and the industry structure. It is also evident the upward trend in cattle, hog and poultry prices began in the late 1990s, well before the corn price began to increase significantly in 2006/07. The closest relationship between corn prices and livestock product prices appears to be with eggs.
ANALYSIS OF CORN, COMMODITY, AND CONSUMER FOOD PRICES
© 15
Figure 8: Corn, Livestock, Poultry, and Egg Prices, 1998/99 – 2009/10
Source: Informa Economics, Inc.
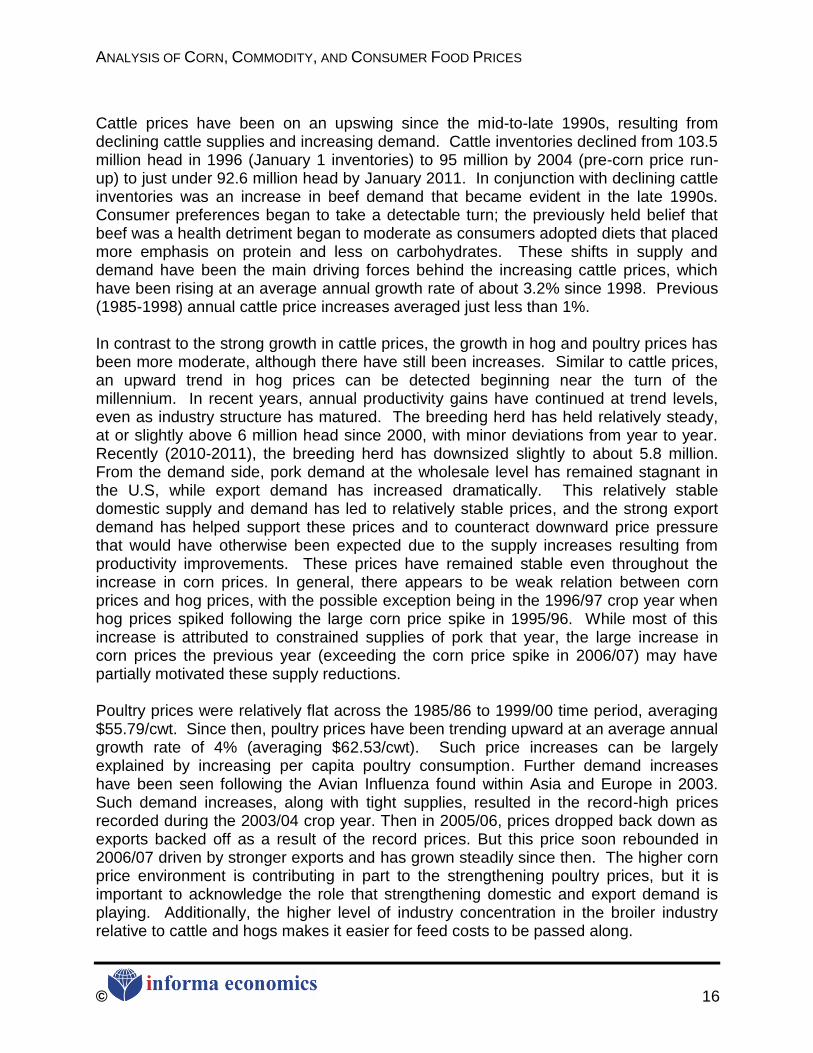
Figure 9: Corn Price Comparison to the Milk Price
Source: Informa Economics, Inc.
ANALYSIS OF CORN, COMMODITY, AND CONSUMER FOOD PRICES
© 16
Cattle prices have been on an upswing since the mid-to-late 1990s, resulting from declining cattle supplies and increasing demand. Cattle inventories declined from 103.5 million head in 1996 (January 1 inventories) to 95 million by 2004 (pre-corn price run-up) to just under 92.6 million head by January 2011. In conjunction with declining cattle inventories was an increase in beef demand that became evident in the late 1990s. Consumer preferences began to take a detectable turn; the previously held belief that beef was a health detriment began to moderate as consumers adopted diets that placed more emphasis on protein and less on carbohydrates. These shifts in supply and demand have been the main driving forces behind the increasing cattle prices, which have been rising at an average annual growth rate of about 3.2% since 1998. Previous (1985-1998) annual cattle price increases averaged just less than 1%. In contrast to the strong growth in cattle prices, the growth in hog and poultry prices has been more moderate, although there have still been increases. Similar to cattle prices, an upward trend in hog prices can be detected beginning near the turn of the millennium. In recent years, annual productivity gains have continued at trend levels, even as industry structure has matured. The breeding herd has held relatively steady, at or slightly above 6 million head since 2000, with minor deviations from year to year. Recently (2010-2011), the breeding herd has downsized slightly to about 5.8 million. From the demand side, pork demand at the wholesale level has remained stagnant in the U.S, while export demand has increased dramatically. This relatively stable domestic supply and demand has led to relatively stable prices, and the strong export demand has helped support these prices and to counteract downward price pressure that would have otherwise been expected due to the supply increases resulting from productivity improvements. These prices have remained stable even throughout the increase in corn prices. In general, there appears to be weak relation between corn prices and hog prices, with the possible exception being in the 1996/97 crop year when hog prices spiked following the large corn price spike in 1995/96. While most of this increase is attributed to constrained supplies of pork that year, the large increase in corn prices the previous year (exceeding the corn price spike in 2006/07) may have partially motivated these supply reductions. Poultry prices were relatively flat across the 1985/86 to 1999/00 time period, averaging $55.79/cwt. Since then, poultry prices have been trending upward at an average annual growth rate of 4% (averaging $62.53/cwt). Such price increases can be largely explained by increasing per capita poultry consumption. Further demand increases have been seen following the Avian Influenza found within Asia and Europe in 2003. Such demand increases, along with tight supplies, resulted in the record-high prices recorded during the 2003/04 crop year. Then in 2005/06, prices dropped back down as exports backed off as a result of the record prices. But this price soon rebounded in 2006/07 driven by stronger exports and has grown steadily since then. The higher corn price environment is contributing in part to the strengthening poultry prices, but it is important to acknowledge the role that strengthening domestic and export demand is playing. Additionally, the higher level of industry concentration in the broiler industry relative to cattle and hogs makes it easier for feed costs to be passed along.
ANALYSIS OF CORN, COMMODITY, AND CONSUMER FOOD PRICES
© 17
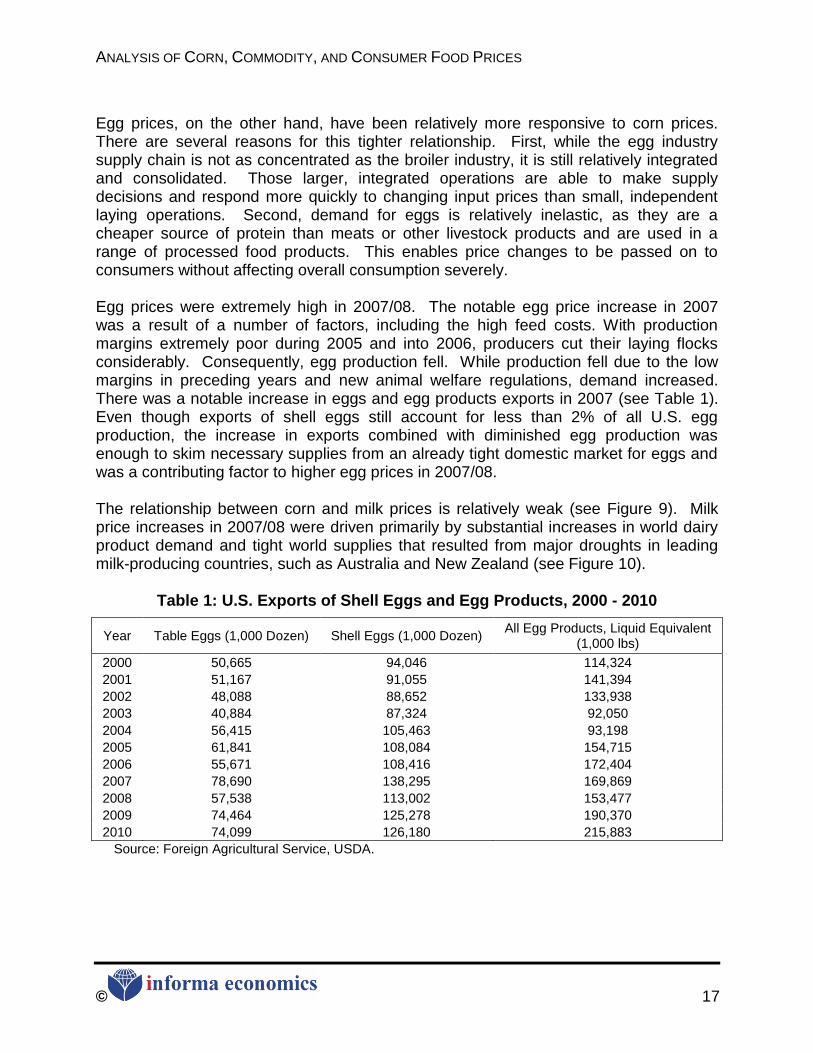
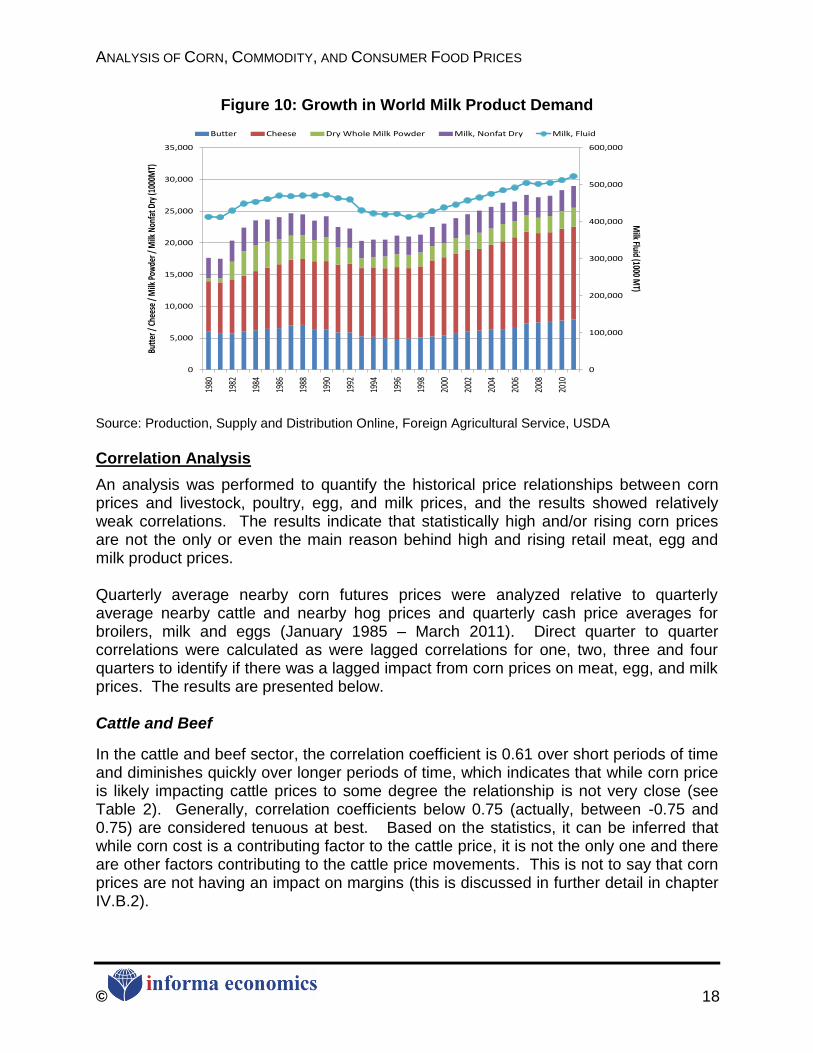
Egg prices, on the other hand, have been relatively more responsive to corn prices. There are several reasons for this tighter relationship. First, while the egg industry supply chain is not as concentrated as the broiler industry, it is still relatively integrated and consolidated. Those larger, integrated operations are able to make supply decisions and respond more quickly to changing input prices than small, independent laying operations. Second, demand for eggs is relatively inelastic, as they are a cheaper source of protein than meats or other livestock products and are used in a range of processed food products. This enables price changes to be passed on to consumers without affecting overall consumption severely. Egg prices were extremely high in 2007/08. The notable egg price increase in 2007 was a result of a number of factors, including the high feed costs. With production margins extremely poor during 2005 and into 2006, producers cut their laying flocks considerably. Consequently, egg production fell. While production fell due to the low margins in preceding years and new animal welfare regulations, demand increased. There was a notable increase in eggs and egg products exports in 2007 (see Table 1). Even though exports of shell eggs still account for less than 2% of all U.S. egg production, the increase in exports combined with diminished egg production was enough to skim necessary supplies from an already tight domestic market for eggs and was a contributing factor to higher egg prices in 2007/08. The relationship between corn and milk prices is relatively weak (see Figure 9). Milk price increases in 2007/08 were driven primarily by substantial increases in world dairy product demand and tight world supplies that resulted from major droughts in leading milk-producing countries, such as Australia and New Zealand (see Figure 10).
Table 1: U.S. Exports of Shell Eggs and Egg Products, 2000 - 2010
Year Table Eggs (1,000 Dozen) Shell Eggs (1,000 Dozen) All Egg Products, Liquid Equivalent
(1,000 lbs)
2000 50,665 94,046 114,324
2001 51,167 91,055 141,394
2002 48,088 88,652 133,938
2003 40,884 87,324 92,050
2004 56,415 105,463 93,198
2005 61,841 108,084 154,715
2006 55,671 108,416 172,404
2007 78,690 138,295 169,869
2008 57,538 113,002 153,477
2009 74,464 125,278 190,370
2010 74,099 126,180 215,883
Source: Foreign Agricultural Service, USDA.
ANALYSIS OF CORN, COMMODITY, AND CONSUMER FOOD PRICES
© 18
Figure 10: Growth in World Milk Product Demand
0
100,000
200,000
300,000
400,000
500,000
600,000
0
5,000
10,000
15,000
20,000
25,000
30,000
35,000
1980
1982
1984
1986
1988
1990
1992
1994
1996
1998
2000
2002
2004
2006
2008
2010
Milk Fluid (1000 M
T)
Butt
er /
Chee
se /
Milk
Pow
der /
Milk
Non
fat D
ry (1
000M
T)
Butter Cheese Dry Whole Milk Powder Milk, Nonfat Dry Milk, Fluid
Source: Production, Supply and Distribution Online, Foreign Agricultural Service, USDA
Correlation Analysis
An analysis was performed to quantify the historical price relationships between corn prices and livestock, poultry, egg, and milk prices, and the results showed relatively weak correlations. The results indicate that statistically high and/or rising corn prices are not the only or even the main reason behind high and rising retail meat, egg and milk product prices. Quarterly average nearby corn futures prices were analyzed relative to quarterly average nearby cattle and nearby hog prices and quarterly cash price averages for broilers, milk and eggs (January 1985 – March 2011). Direct quarter to quarter correlations were calculated as were lagged correlations for one, two, three and four quarters to identify if there was a lagged impact from corn prices on meat, egg, and milk prices. The results are presented below. Cattle and Beef
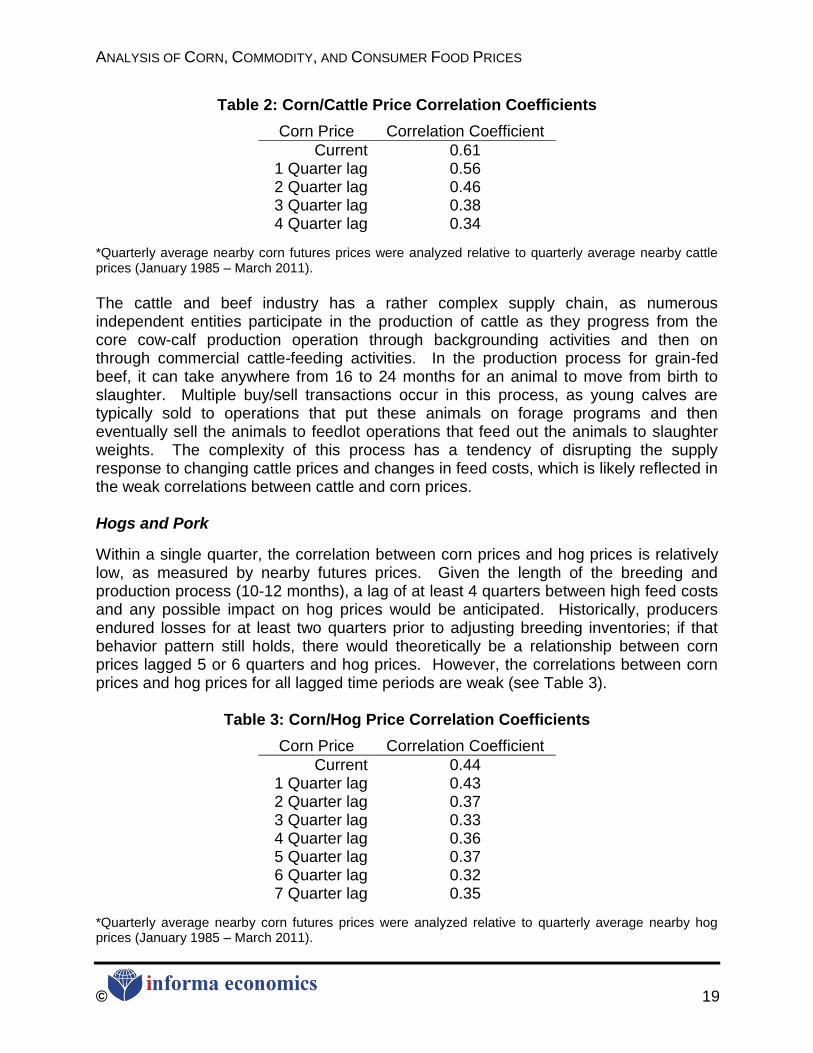
In the cattle and beef sector, the correlation coefficient is 0.61 over short periods of time and diminishes quickly over longer periods of time, which indicates that while corn price is likely impacting cattle prices to some degree the relationship is not very close (see Table 2). Generally, correlation coefficients below 0.75 (actually, between -0.75 and 0.75) are considered tenuous at best. Based on the statistics, it can be inferred that while corn cost is a contributing factor to the cattle price, it is not the only one and there are other factors contributing to the cattle price movements. This is not to say that corn prices are not having an impact on margins (this is discussed in further detail in chapter IV.B.2).
ANALYSIS OF CORN, COMMODITY, AND CONSUMER FOOD PRICES
© 19
Table 2: Corn/Cattle Price Correlation Coefficients
Corn Price Correlation Coefficient
Current 0.61 1 Quarter lag 0.56 2 Quarter lag 0.46 3 Quarter lag 0.38 4 Quarter lag 0.34
*Quarterly average nearby corn futures prices were analyzed relative to quarterly average nearby cattle prices (January 1985 – March 2011).
The cattle and beef industry has a rather complex supply chain, as numerous independent entities participate in the production of cattle as they progress from the core cow-calf production operation through backgrounding activities and then on through commercial cattle-feeding activities. In the production process for grain-fed beef, it can take anywhere from 16 to 24 months for an animal to move from birth to slaughter. Multiple buy/sell transactions occur in this process, as young calves are typically sold to operations that put these animals on forage programs and then eventually sell the animals to feedlot operations that feed out the animals to slaughter weights. The complexity of this process has a tendency of disrupting the supply response to changing cattle prices and changes in feed costs, which is likely reflected in the weak correlations between cattle and corn prices. Hogs and Pork
Within a single quarter, the correlation between corn prices and hog prices is relatively low, as measured by nearby futures prices. Given the length of the breeding and production process (10-12 months), a lag of at least 4 quarters between high feed costs and any possible impact on hog prices would be anticipated. Historically, producers endured losses for at least two quarters prior to adjusting breeding inventories; if that behavior pattern still holds, there would theoretically be a relationship between corn prices lagged 5 or 6 quarters and hog prices. However, the correlations between corn prices and hog prices for all lagged time periods are weak (see Table 3).
Table 3: Corn/Hog Price Correlation Coefficients
Corn Price Correlation Coefficient
Current 0.44 1 Quarter lag 0.43 2 Quarter lag 0.37 3 Quarter lag 0.33 4 Quarter lag 0.36 5 Quarter lag 0.37 6 Quarter lag 0.32 7 Quarter lag 0.35
*Quarterly average nearby corn futures prices were analyzed relative to quarterly average nearby hog prices (January 1985 – March 2011).
ANALYSIS OF CORN, COMMODITY, AND CONSUMER FOOD PRICES
© 20
Even with a 4-quarter lag on corn prices, the correlation of 0.36 is still weak, not sufficient to conclude that higher corn prices result in higher hog prices. Once again, if higher corn prices were going to have an impact on pork supply and prices, such impacts would be expected at least a year from when corn prices rise. However, the correlation coefficients with further lags (5, 6, and 7 quarters) are still low, even lower than that within 1 quarter. Broilers
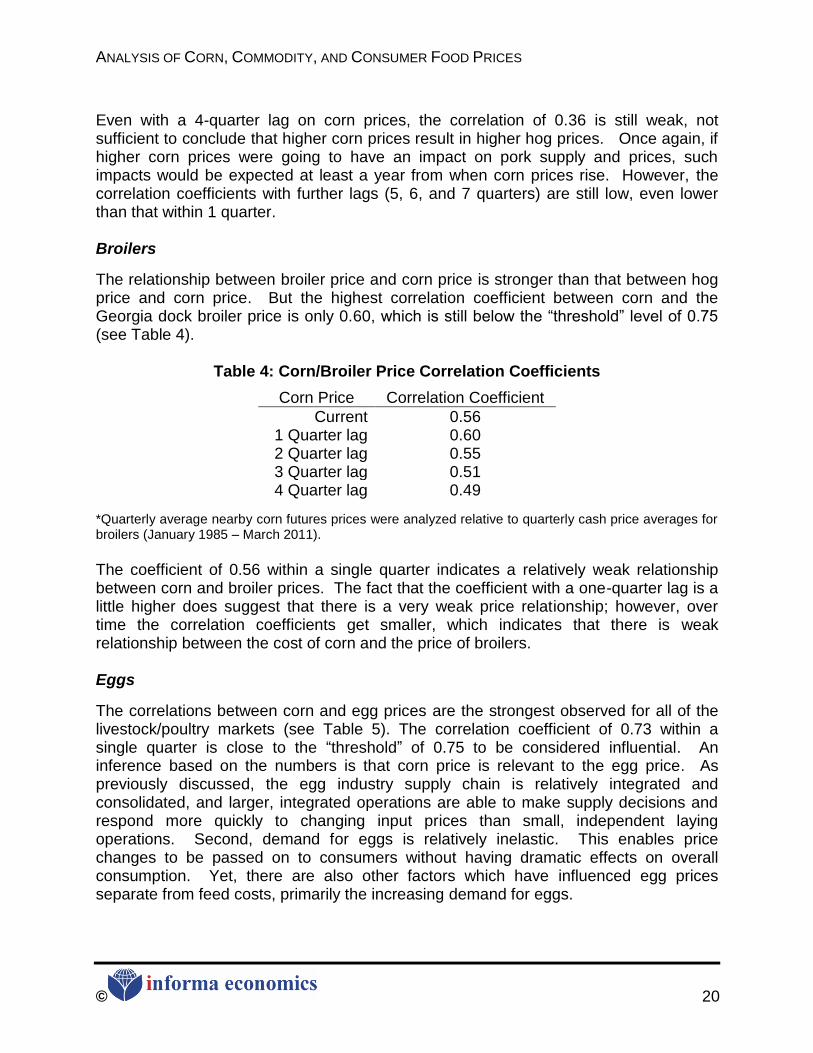
The relationship between broiler price and corn price is stronger than that between hog price and corn price. But the highest correlation coefficient between corn and the Georgia dock broiler price is only 0.60, which is still below the ―threshold‖ level of 0.75 (see Table 4).
Table 4: Corn/Broiler Price Correlation Coefficients
Corn Price Correlation Coefficient
Current 0.56 1 Quarter lag 0.60 2 Quarter lag 0.55 3 Quarter lag 0.51 4 Quarter lag 0.49
*Quarterly average nearby corn futures prices were analyzed relative to quarterly cash price averages for broilers (January 1985 – March 2011).
The coefficient of 0.56 within a single quarter indicates a relatively weak relationship between corn and broiler prices. The fact that the coefficient with a one-quarter lag is a little higher does suggest that there is a very weak price relationship; however, over time the correlation coefficients get smaller, which indicates that there is weak relationship between the cost of corn and the price of broilers. Eggs
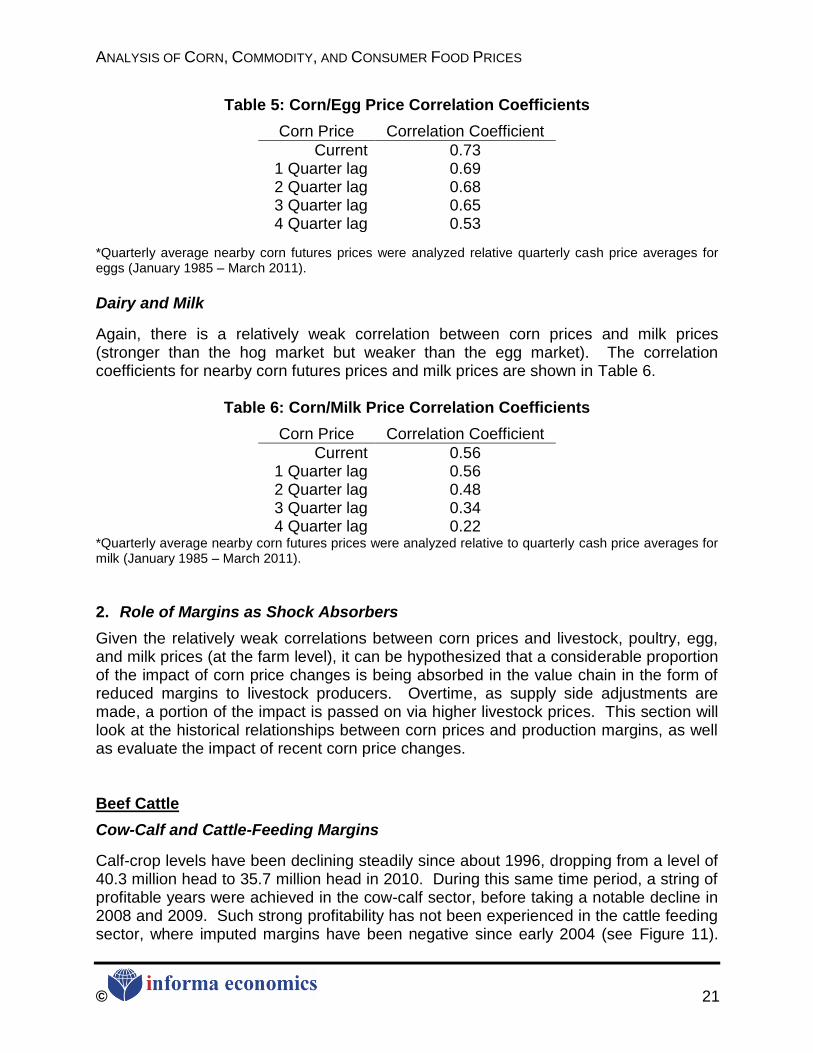
The correlations between corn and egg prices are the strongest observed for all of the livestock/poultry markets (see Table 5). The correlation coefficient of 0.73 within a single quarter is close to the ―threshold‖ of 0.75 to be considered influential. An inference based on the numbers is that corn price is relevant to the egg price. As previously discussed, the egg industry supply chain is relatively integrated and consolidated, and larger, integrated operations are able to make supply decisions and respond more quickly to changing input prices than small, independent laying operations. Second, demand for eggs is relatively inelastic. This enables price changes to be passed on to consumers without having dramatic effects on overall consumption. Yet, there are also other factors which have influenced egg prices separate from feed costs, primarily the increasing demand for eggs.
ANALYSIS OF CORN, COMMODITY, AND CONSUMER FOOD PRICES
© 21
Table 5: Corn/Egg Price Correlation Coefficients
Corn Price Correlation Coefficient
Current 0.73 1 Quarter lag 0.69 2 Quarter lag 0.68 3 Quarter lag 0.65 4 Quarter lag 0.53
*Quarterly average nearby corn futures prices were analyzed relative quarterly cash price averages for eggs (January 1985 – March 2011).
Dairy and Milk
Again, there is a relatively weak correlation between corn prices and milk prices (stronger than the hog market but weaker than the egg market). The correlation coefficients for nearby corn futures prices and milk prices are shown in Table 6.
Table 6: Corn/Milk Price Correlation Coefficients
Corn Price Correlation Coefficient
Current 0.56 1 Quarter lag 0.56 2 Quarter lag 0.48 3 Quarter lag 0.34 4 Quarter lag 0.22
*Quarterly average nearby corn futures prices were analyzed relative to quarterly cash price averages for milk (January 1985 – March 2011).
2. Role of Margins as Shock Absorbers
Given the relatively weak correlations between corn prices and livestock, poultry, egg, and milk prices (at the farm level), it can be hypothesized that a considerable proportion of the impact of corn price changes is being absorbed in the value chain in the form of reduced margins to livestock producers. Overtime, as supply side adjustments are made, a portion of the impact is passed on via higher livestock prices. This section will look at the historical relationships between corn prices and production margins, as well as evaluate the impact of recent corn price changes. Beef Cattle
Cow-Calf and Cattle-Feeding Margins
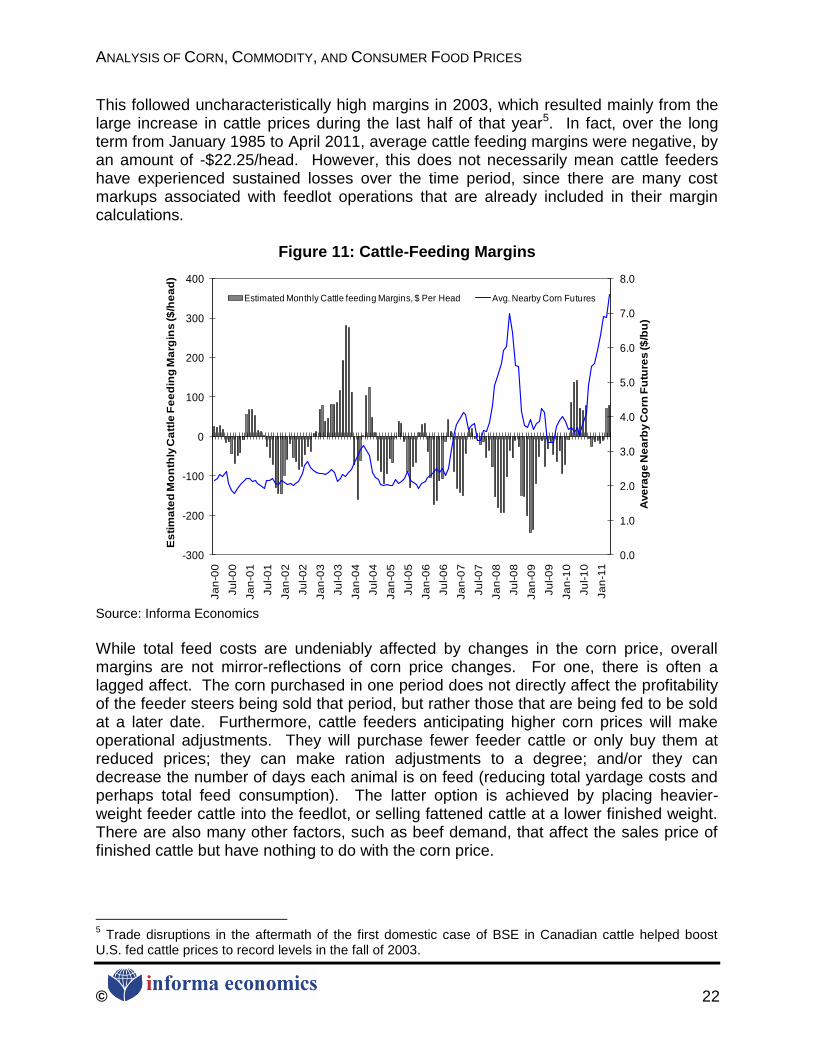
Calf-crop levels have been declining steadily since about 1996, dropping from a level of 40.3 million head to 35.7 million head in 2010. During this same time period, a string of profitable years were achieved in the cow-calf sector, before taking a notable decline in 2008 and 2009. Such strong profitability has not been experienced in the cattle feeding sector, where imputed margins have been negative since early 2004 (see Figure 11).
ANALYSIS OF CORN, COMMODITY, AND CONSUMER FOOD PRICES
© 22
This followed uncharacteristically high margins in 2003, which resulted mainly from the large increase in cattle prices during the last half of that year5. In fact, over the long term from January 1985 to April 2011, average cattle feeding margins were negative, by an amount of -$22.25/head. However, this does not necessarily mean cattle feeders have experienced sustained losses over the time period, since there are many cost markups associated with feedlot operations that are already included in their margin calculations.
Figure 11: Cattle-Feeding Margins
0.0
1.0
2.0
3.0
4.0
5.0
6.0
7.0
8.0
-300
-200
-100
0
100
200
300
400
Ja
n-0
0
Ju
l-0
0
Ja
n-0
1
Ju
l-0
1
Ja
n-0
2
Ju
l-0
2
Ja
n-0
3
Ju
l-0
3
Ja
n-0
4
Ju
l-0
4
Ja
n-0
5
Ju
l-0
5
Ja
n-0
6
Ju
l-0
6
Ja
n-0
7
Ju
l-0
7
Ja
n-0
8
Ju
l-0
8
Ja
n-0
9
Ju
l-0
9
Ja
n-1
0
Ju
l-1
0
Ja
n-1
1
Ave
rag
e N
ea
rby C
orn
Fu
ture
s ($
/bu
)
Es
tim
ate
d M
on
thly
Ca
ttle
Fe
ed
ing
Ma
rgin
s ($
/he
ad
)
Estimated Monthly Cattle feeding Margins, $ Per Head Avg. Nearby Corn Futures
Source: Informa Economics
While total feed costs are undeniably affected by changes in the corn price, overall margins are not mirror-reflections of corn price changes. For one, there is often a lagged affect. The corn purchased in one period does not directly affect the profitability of the feeder steers being sold that period, but rather those that are being fed to be sold at a later date. Furthermore, cattle feeders anticipating higher corn prices will make operational adjustments. They will purchase fewer feeder cattle or only buy them at reduced prices; they can make ration adjustments to a degree; and/or they can decrease the number of days each animal is on feed (reducing total yardage costs and perhaps total feed consumption). The latter option is achieved by placing heavier-weight feeder cattle into the feedlot, or selling fattened cattle at a lower finished weight. There are also many other factors, such as beef demand, that affect the sales price of finished cattle but have nothing to do with the corn price.
5 Trade disruptions in the aftermath of the first domestic case of BSE in Canadian cattle helped boost
U.S. fed cattle prices to record levels in the fall of 2003.
ANALYSIS OF CORN, COMMODITY, AND CONSUMER FOOD PRICES
© 23
Another mitigating factor has been the ability of feedlots to incorporate distillers grains into their feed rations. For each bushel of corn ground to make ethanol, almost one-third of the material ends up as distillers grains, and according to industry sources, approximately 41% of the distillers grains consumed in the U.S. in 2010 were used in beef cattle rations. Distillers grains are a high-energy, high-protein feed source that can be used as a feed substitute for corn. In fact, many recent feeding trials suggest feeding wet distillers grains with solubles actually increases feed efficiency relative to corn. Packer Margins
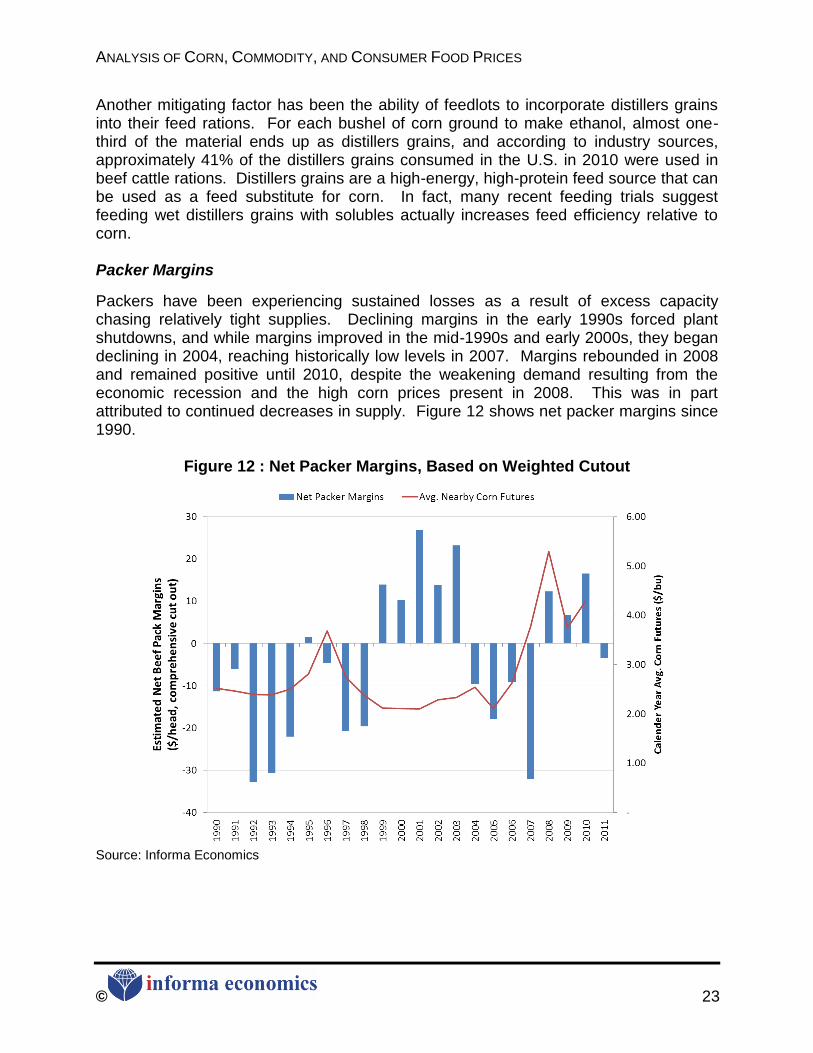
Packers have been experiencing sustained losses as a result of excess capacity chasing relatively tight supplies. Declining margins in the early 1990s forced plant shutdowns, and while margins improved in the mid-1990s and early 2000s, they began declining in 2004, reaching historically low levels in 2007. Margins rebounded in 2008 and remained positive until 2010, despite the weakening demand resulting from the economic recession and the high corn prices present in 2008. This was in part attributed to continued decreases in supply. Figure 12 shows net packer margins since 1990.
Figure 12 : Net Packer Margins, Based on Weighted Cutout
Source: Informa Economics
ANALYSIS OF CORN, COMMODITY, AND CONSUMER FOOD PRICES
© 24
Hogs
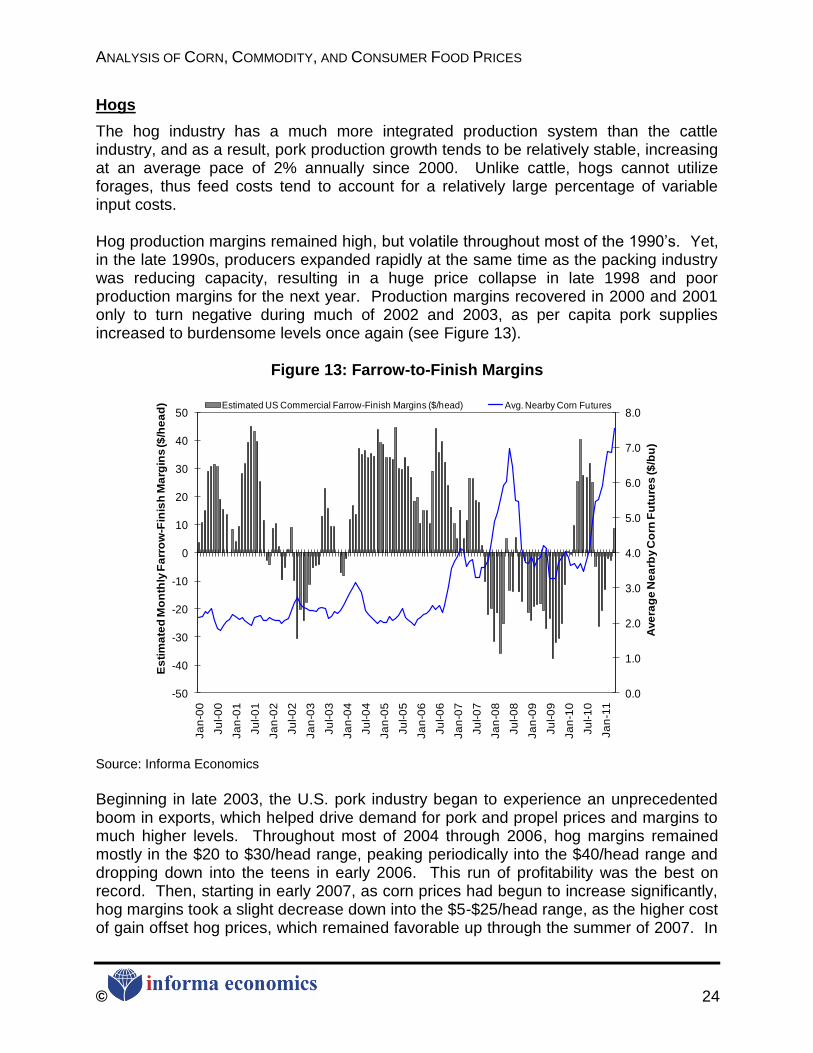
The hog industry has a much more integrated production system than the cattle industry, and as a result, pork production growth tends to be relatively stable, increasing at an average pace of 2% annually since 2000. Unlike cattle, hogs cannot utilize forages, thus feed costs tend to account for a relatively large percentage of variable input costs. Hog production margins remained high, but volatile throughout most of the 1990‘s. Yet, in the late 1990s, producers expanded rapidly at the same time as the packing industry was reducing capacity, resulting in a huge price collapse in late 1998 and poor production margins for the next year. Production margins recovered in 2000 and 2001 only to turn negative during much of 2002 and 2003, as per capita pork supplies increased to burdensome levels once again (see Figure 13).
Figure 13: Farrow-to-Finish Margins
0.0
1.0
2.0
3.0
4.0
5.0
6.0
7.0
8.0
-50
-40
-30
-20
-10
0
10
20
30
40
50
Ja
n-0
0
Ju
l-0
0
Ja
n-0
1
Ju
l-0
1
Ja
n-0
2
Ju
l-0
2
Ja
n-0
3
Ju
l-0
3
Ja
n-0
4
Ju
l-0
4
Ja
n-0
5
Ju
l-0
5
Ja
n-0
6
Ju
l-0
6
Ja
n-0
7
Ju
l-0
7
Ja
n-0
8
Ju
l-0
8
Ja
n-0
9
Ju
l-0
9
Ja
n-1
0
Ju
l-1
0
Ja
n-1
1
Ave
rag
e N
ea
rby C
orn
Fu
ture
s ($
/bu
)
Es
tim
ate
d M
on
thly
Fa
rro
w-F
inis
h M
arg
ins ($
/he
ad
) Estimated US Commercial Farrow-Finish Margins ($/head) Avg. Nearby Corn Futures
Source: Informa Economics
Beginning in late 2003, the U.S. pork industry began to experience an unprecedented boom in exports, which helped drive demand for pork and propel prices and margins to much higher levels. Throughout most of 2004 through 2006, hog margins remained mostly in the $20 to $30/head range, peaking periodically into the $40/head range and dropping down into the teens in early 2006. This run of profitability was the best on record. Then, starting in early 2007, as corn prices had begun to increase significantly, hog margins took a slight decrease down into the $5-$25/head range, as the higher cost of gain offset hog prices, which remained favorable up through the summer of 2007. In
ANALYSIS OF CORN, COMMODITY, AND CONSUMER FOOD PRICES
© 25
the fall of 2007, on large production increases, hog production margins finally began to turn negative, ending the longest uninterrupted run of profits on record for the industry. In addition to the high feed costs, the negative margins experienced by the hog sector in early 2008 were exacerbated by excess supplies. As feed costs continued to climb, a bearish outlook in early hog reports and lack of aggressive herd culling and high productivity led to excess supplies dragging down hog and pork markets. To some extent, producers appeared to be in denial about the extent to the over production problem. Later in 2008, following a surge in exports which helped to tighten up domestic pork supplies, many U.S. hog operations regained a profitable position and margins began to increase, that is until feed costs spiked again around June following severe flooding in the Midwest. Despite feed costs falling back down in 2009, over supply from the previous year and a decline in exports following the Olympics kept margins at low levels. Then, strong hog prices in the first half of 2010 began to support positive margins. Yet, as hog prices started to erode and feed costs continued to increase, margins turned abruptly negative by the end of year. Poultry: Broilers and Eggs
Broilers
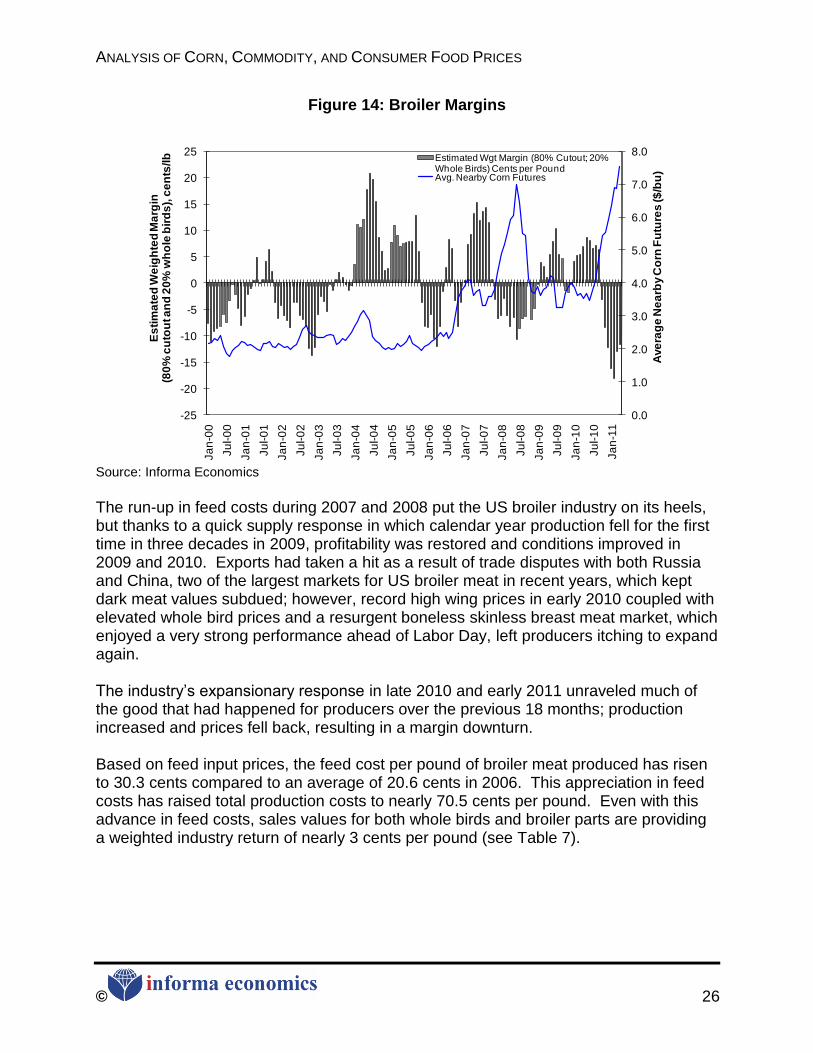
The broiler industry is a highly integrated and concentrated industry with the top 25 production operations accounting for a large percentage of industry output. Since the decision making at the production level is consolidated into few hands, the broiler industry has the capability of making rather quick and meaningful production adjustment decisions. There appears to be relatively little correlation between historical poultry margins and the price of corn (see Figure 14). In fact, when corn prices were at their lowest in early 2006, poultry margins were negative, and as corn prices began to take off, poultry margins climbed up, until mid-2007 when margins turned negative. In early 2003, poultry margins took a swing from negative to positive, despite relatively stagnant corn prices. This was a direct result from a cutback in production taken after the margin losses in 2002 and 2003. This cutback in production along with record high prices in late 2003 and early 2004 led to record high margins by mid-2004. Then, as exports dropped off due to the high poultry prices, margins began to decline.
ANALYSIS OF CORN, COMMODITY, AND CONSUMER FOOD PRICES
© 26
Figure 14: Broiler Margins
0.0
1.0
2.0
3.0
4.0
5.0
6.0
7.0
8.0
-25
-20
-15
-10
-5
0
5
10
15
20
25
Ja
n-0
0
Ju
l-0
0
Ja
n-0
1
Ju
l-0
1
Ja
n-0
2
Ju
l-0
2
Ja
n-0
3
Ju
l-0
3
Ja
n-0
4
Ju
l-0
4
Ja
n-0
5
Ju
l-0
5
Ja
n-0
6
Ju
l-0
6
Ja
n-0
7
Ju
l-0
7
Ja
n-0
8
Ju
l-0
8
Ja
n-0
9
Ju
l-0
9
Ja
n-1
0
Ju
l-1
0
Ja
n-1
1
Ave
rag
e N
ea
rby C
orn
Fu
ture
s ($
/bu
)
Es
tim
ate
d W
eig
hte
d M
arg
in
(80
% c
uto
ut a
nd
20
% w
ho
le b
ird
s),
ce
nts
/lb Estimated Wgt Margin (80% Cutout; 20%
Whole Birds) Cents per PoundAvg. Nearby Corn Futures
Source: Informa Economics
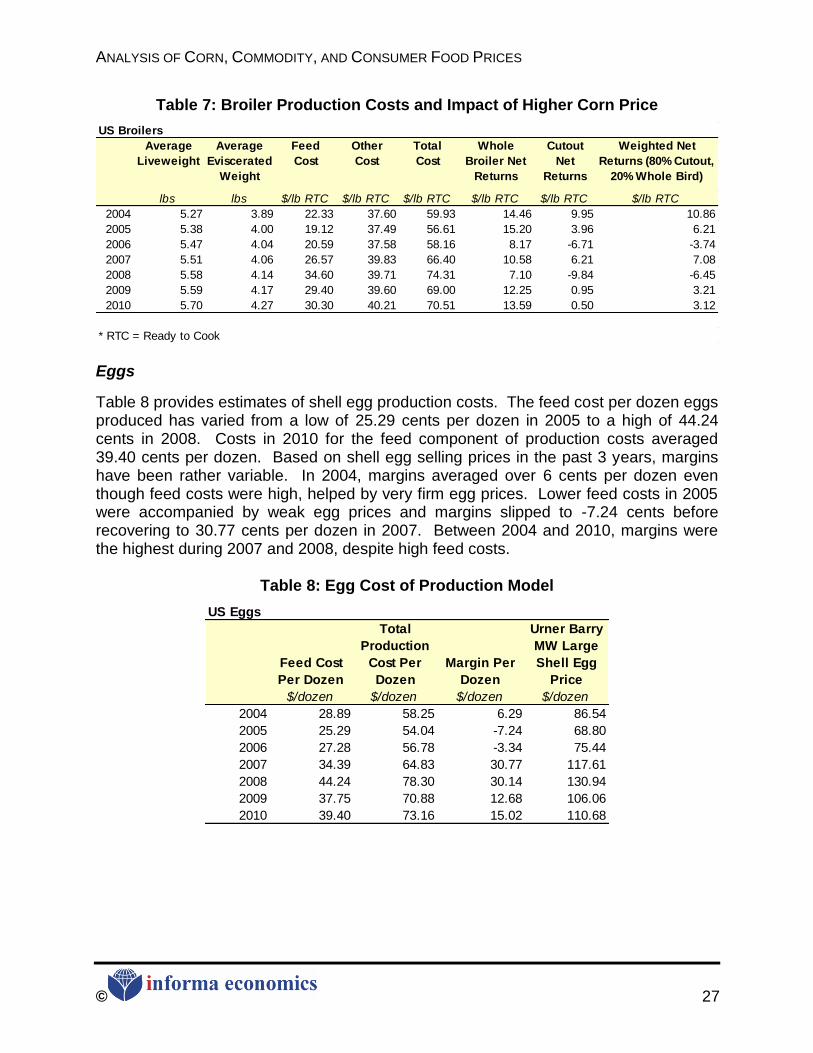
The run-up in feed costs during 2007 and 2008 put the US broiler industry on its heels, but thanks to a quick supply response in which calendar year production fell for the first time in three decades in 2009, profitability was restored and conditions improved in 2009 and 2010. Exports had taken a hit as a result of trade disputes with both Russia and China, two of the largest markets for US broiler meat in recent years, which kept dark meat values subdued; however, record high wing prices in early 2010 coupled with elevated whole bird prices and a resurgent boneless skinless breast meat market, which enjoyed a very strong performance ahead of Labor Day, left producers itching to expand again. The industry‘s expansionary response in late 2010 and early 2011 unraveled much of the good that had happened for producers over the previous 18 months; production increased and prices fell back, resulting in a margin downturn. Based on feed input prices, the feed cost per pound of broiler meat produced has risen to 30.3 cents compared to an average of 20.6 cents in 2006. This appreciation in feed costs has raised total production costs to nearly 70.5 cents per pound. Even with this advance in feed costs, sales values for both whole birds and broiler parts are providing a weighted industry return of nearly 3 cents per pound (see Table 7).
ANALYSIS OF CORN, COMMODITY, AND CONSUMER FOOD PRICES
© 27
Table 7: Broiler Production Costs and Impact of Higher Corn Price
Average
Liveweight
Average
Eviscerated
Weight
Feed
Cost
Other
Cost
Total
Cost
Whole
Broiler Net
Returns
Cutout
Net
Returns
Weighted Net
Returns (80% Cutout,
20% Whole Bird)
lbs lbs $/lb RTC $/lb RTC $/lb RTC $/lb RTC $/lb RTC $/lb RTC
2004 5.27 3.89 22.33 37.60 59.93 14.46 9.95 10.86
2005 5.38 4.00 19.12 37.49 56.61 15.20 3.96 6.21
2006 5.47 4.04 20.59 37.58 58.16 8.17 -6.71 -3.74
2007 5.51 4.06 26.57 39.83 66.40 10.58 6.21 7.08
2008 5.58 4.14 34.60 39.71 74.31 7.10 -9.84 -6.45
2009 5.59 4.17 29.40 39.60 69.00 12.25 0.95 3.21
2010 5.70 4.27 30.30 40.21 70.51 13.59 0.50 3.12
* RTC = Ready to Cook
US Broilers
Eggs
Table 8 provides estimates of shell egg production costs. The feed cost per dozen eggs produced has varied from a low of 25.29 cents per dozen in 2005 to a high of 44.24 cents in 2008. Costs in 2010 for the feed component of production costs averaged 39.40 cents per dozen. Based on shell egg selling prices in the past 3 years, margins have been rather variable. In 2004, margins averaged over 6 cents per dozen even though feed costs were high, helped by very firm egg prices. Lower feed costs in 2005 were accompanied by weak egg prices and margins slipped to -7.24 cents before recovering to 30.77 cents per dozen in 2007. Between 2004 and 2010, margins were the highest during 2007 and 2008, despite high feed costs.
Table 8: Egg Cost of Production Model
US Eggs
Feed Cost
Per Dozen
Total
Production
Cost Per
Dozen
Margin Per
Dozen
Urner Barry
MW Large
Shell Egg
Price
$/dozen $/dozen $/dozen $/dozen
2004 28.89 58.25 6.29 86.54
2005 25.29 54.04 -7.24 68.80
2006 27.28 56.78 -3.34 75.44
2007 34.39 64.83 30.77 117.61
2008 44.24 78.30 30.14 130.94
2009 37.75 70.88 12.68 106.06
2010 39.40 73.16 15.02 110.68
ANALYSIS OF CORN, COMMODITY, AND CONSUMER FOOD PRICES
© 28
Milk
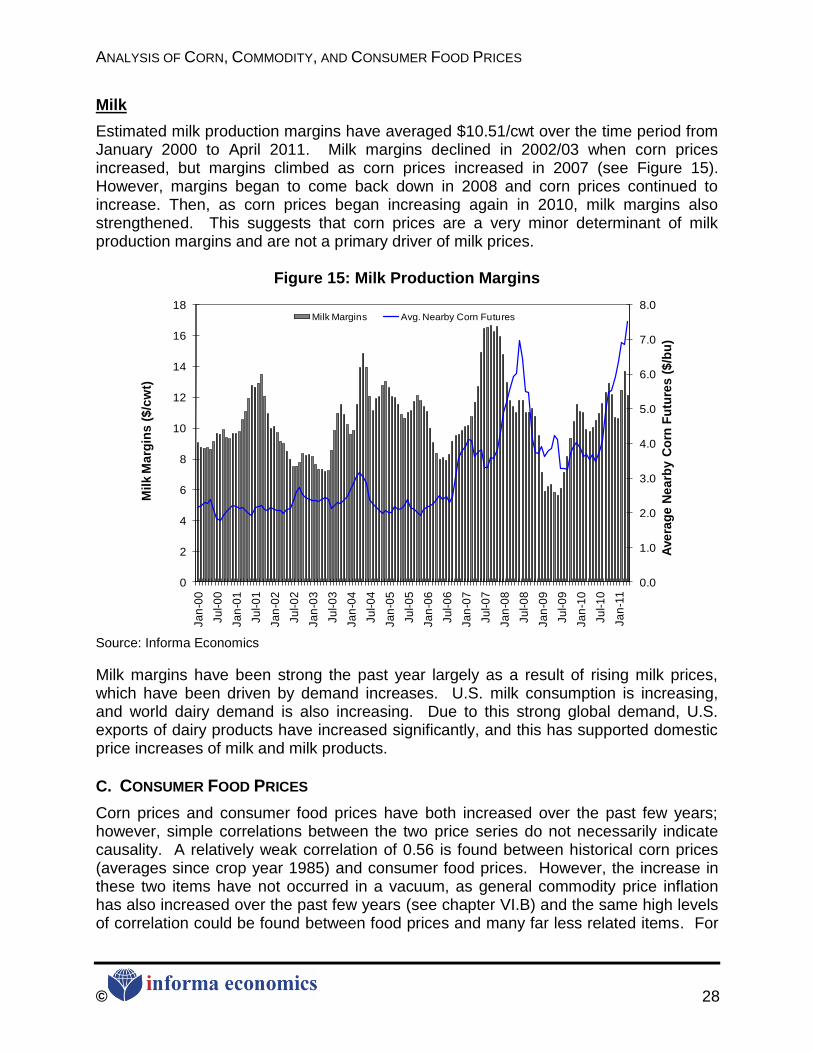
Estimated milk production margins have averaged $10.51/cwt over the time period from January 2000 to April 2011. Milk margins declined in 2002/03 when corn prices increased, but margins climbed as corn prices increased in 2007 (see Figure 15). However, margins began to come back down in 2008 and corn prices continued to increase. Then, as corn prices began increasing again in 2010, milk margins also strengthened. This suggests that corn prices are a very minor determinant of milk production margins and are not a primary driver of milk prices.
Figure 15: Milk Production Margins
0.0
1.0
2.0
3.0
4.0
5.0
6.0
7.0
8.0
0
2
4
6
8
10
12
14
16
18
Ja
n-0
0
Ju
l-0
0
Ja
n-0
1
Ju
l-0
1
Ja
n-0
2
Ju
l-0
2
Ja
n-0
3
Ju
l-0
3
Ja
n-0
4
Ju
l-0
4
Ja
n-0
5
Ju
l-0
5
Ja
n-0
6
Ju
l-0
6
Ja
n-0
7
Ju
l-0
7
Ja
n-0
8
Ju
l-0
8
Ja
n-0
9
Ju
l-0
9
Ja
n-1
0
Ju
l-1
0
Ja
n-1
1
Ave
rag
e N
ea
rby C
orn
Fu
ture
s (
$/b
u)
Mil
k M
arg
ins
($
/cw
t)
Milk Margins Avg. Nearby Corn Futures
Source: Informa Economics
Milk margins have been strong the past year largely as a result of rising milk prices, which have been driven by demand increases. U.S. milk consumption is increasing, and world dairy demand is also increasing. Due to this strong global demand, U.S. exports of dairy products have increased significantly, and this has supported domestic price increases of milk and milk products.
C. CONSUMER FOOD PRICES
Corn prices and consumer food prices have both increased over the past few years; however, simple correlations between the two price series do not necessarily indicate causality. A relatively weak correlation of 0.56 is found between historical corn prices (averages since crop year 1985) and consumer food prices. However, the increase in these two items have not occurred in a vacuum, as general commodity price inflation has also increased over the past few years (see chapter VI.B) and the same high levels of correlation could be found between food prices and many far less related items. For
ANALYSIS OF CORN, COMMODITY, AND CONSUMER FOOD PRICES
© 29
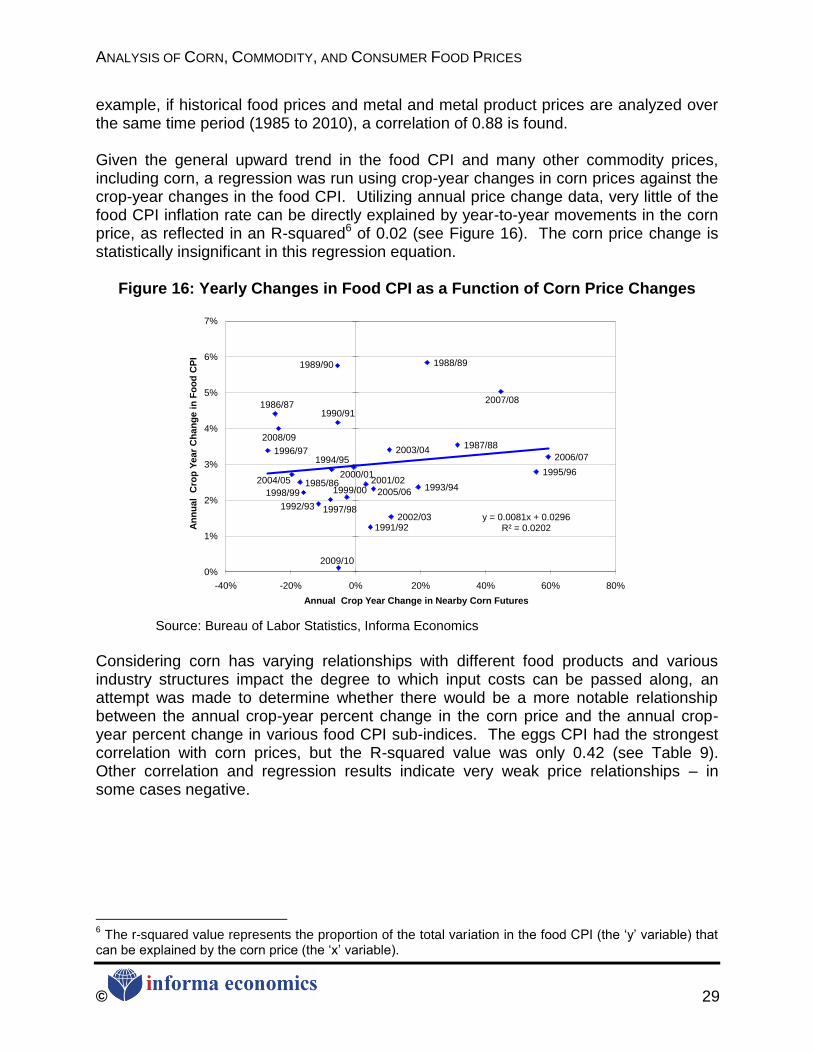
example, if historical food prices and metal and metal product prices are analyzed over the same time period (1985 to 2010), a correlation of 0.88 is found. Given the general upward trend in the food CPI and many other commodity prices, including corn, a regression was run using crop-year changes in corn prices against the crop-year changes in the food CPI. Utilizing annual price change data, very little of the food CPI inflation rate can be directly explained by year-to-year movements in the corn price, as reflected in an R-squared6 of 0.02 (see Figure 16). The corn price change is statistically insignificant in this regression equation.
Figure 16: Yearly Changes in Food CPI as a Function of Corn Price Changes
1985/86
1986/87
1987/88
1988/891989/90
1990/91
1991/92
1992/93
1993/94
1994/95
1995/96
1996/97
1997/98
1998/99 1999/00
2000/012001/02
2002/03
2003/04
2004/05
2005/06
2006/07
2007/08
2008/09
2009/10
y = 0.0081x + 0.0296R² = 0.0202
0%
1%
2%
3%
4%
5%
6%
7%
-40% -20% 0% 20% 40% 60% 80%
An
nu
al
Cro
p Y
ear
Ch
an
ge i
n F
oo
d C
PI
Annual Crop Year Change in Nearby Corn Futures
Source: Bureau of Labor Statistics, Informa Economics
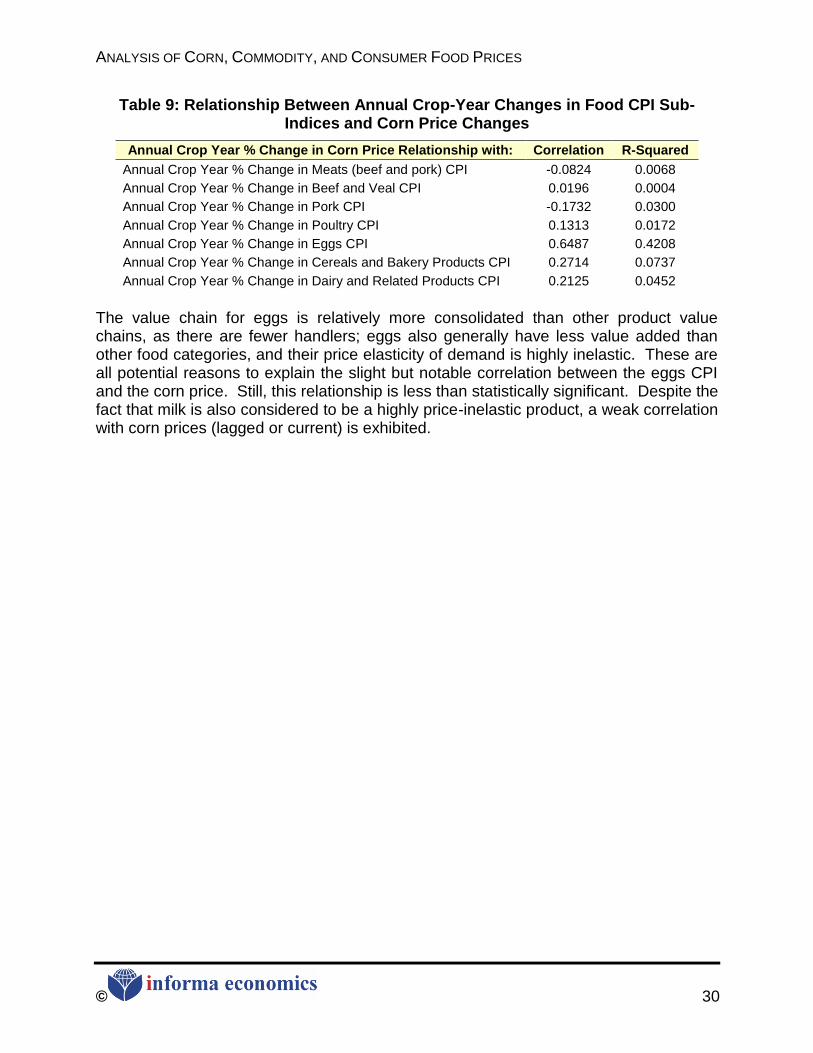
Considering corn has varying relationships with different food products and various industry structures impact the degree to which input costs can be passed along, an attempt was made to determine whether there would be a more notable relationship between the annual crop-year percent change in the corn price and the annual crop-year percent change in various food CPI sub-indices. The eggs CPI had the strongest correlation with corn prices, but the R-squared value was only 0.42 (see Table 9). Other correlation and regression results indicate very weak price relationships – in some cases negative.
6 The r-squared value represents the proportion of the total variation in the food CPI (the ‗y‘ variable) that
can be explained by the corn price (the ‗x‘ variable).
ANALYSIS OF CORN, COMMODITY, AND CONSUMER FOOD PRICES
© 30
Table 9: Relationship Between Annual Crop-Year Changes in Food CPI Sub-Indices and Corn Price Changes
Annual Crop Year % Change in Corn Price Relationship with: Correlation R-Squared
Annual Crop Year % Change in Meats (beef and pork) CPI -0.0824 0.0068
Annual Crop Year % Change in Beef and Veal CPI 0.0196 0.0004
Annual Crop Year % Change in Pork CPI -0.1732 0.0300
Annual Crop Year % Change in Poultry CPI 0.1313 0.0172
Annual Crop Year % Change in Eggs CPI 0.6487 0.4208
Annual Crop Year % Change in Cereals and Bakery Products CPI 0.2714 0.0737
Annual Crop Year % Change in Dairy and Related Products CPI 0.2125 0.0452
The value chain for eggs is relatively more consolidated than other product value chains, as there are fewer handlers; eggs also generally have less value added than other food categories, and their price elasticity of demand is highly inelastic. These are all potential reasons to explain the slight but notable correlation between the eggs CPI and the corn price. Still, this relationship is less than statistically significant. Despite the fact that milk is also considered to be a highly price-inelastic product, a weak correlation with corn prices (lagged or current) is exhibited.
ANALYSIS OF CORN, COMMODITY, AND CONSUMER FOOD PRICES
© 31
V. DRIVERS OF FOOD PRICE INFLATION
Given that historical data shows a relatively limited relationship between corn prices and consumer food prices, the question arises: What does drive consumer food prices? This section will explore various factors affecting consumer food price inflation. In summary, food price inflation is caused by a complex set of factors.
A. SUMMARY OF USDA MODELS OF THE FOOD CPI
USDA-ERS periodically forecasts the food CPI, and it is frequently asked to evaluate the impact of input price changes. The agency uses three different models to analyze the food CPI, with the choice of model depending on whether or not the objective calls for an analysis of short-run or long-run impacts. The ERS price-spread model and input-output model are used to analyze short-run impacts, while the variable proportions model is used in long-run analyses. The price-spread model uses a weighted sum of percent changes in input prices from 16 food industries to estimate input price change effects on at-home food prices, where each input change is weighted by its respective cost share. It is assumed that each firm in each of the 16 food industries produces a single end-product; accordingly, the model combines a farm commodity with a set of non-farm inputs in fixed proportions. Alternatively, the input-output model, while similar to the price-spread model, considers the indirect effects of changing input costs. For example, an increase in energy will not only affect the cost of producing the food item, but it will also impact the costs of producing other food production inputs. This model uses a system of equations from 50 food industries and 430 nonfood industries. Both the short-run models assume that consumers do not respond to retail price changes and that food producers do not alter their input proportions. 7 However, the long-run model (i.e., the variable proportions model) relaxes these short-run restrictions. This eight-market food model uses a system-of-equations approach: (i) the first equation relates the industry‘s retail price to the price of one marketing or non-farm input, the exogenous farm supply, and the shift in consumer demand, and (ii) the second equation relates the industry‘s farm price with the same three variables. Analyses using the variable proportions model have shown that changes in input prices do not always lead to food price increases. This effect is mitigated by firms altering their input proportions and by changing consumer demand.8
7 This may be a rather strong assumption, especially for certain food products in which demand is elastic,
there are multiple substitute products available to consumers, or for which there are substitute products available within the production process. 8 Reed, A.J., K. Hanson, H. Elitzak, and G. Schluter. 1997. ―Changing Consumer Food Prices: A User‘s
Guide to ERS Analyses.‖ Technical Bulletin #1862. Economic Research Service, Washington, DC.
ANALYSIS OF CORN, COMMODITY, AND CONSUMER FOOD PRICES
© 32
The ERS lists four key factors as influencing how input cost increases affect food prices9. The first is the share of total costs accounted for by the input (discussed in further detail in the next section). The second is whether or not the input has adequate substitutes in the production process. Third, is whether or not consumers have good substitutes for the food product. Last, is the time period considered. In the short run, producers and consumers may not be able to adjust to price changes. On one hand, if the price change is permanent, such adjustments can be made. On the other hand, however, this might cause some firms to go out of business, causing the price increase to be greater in the long run.
B. FOOD MARKETING COSTS
1. USDA’s Calculation of the Food Dollar10
Explanation of Methodology Since the release of the original 2007 Informa Economics study, the USDA changed their methodology for calculating the food dollar11. In the past, the USDA‘s Economic Research Service (ERS) calculated the ―marketing bill‖ that presented both the cost share of the food dollar attributable to marketing raw commodities and the farm share received by producers. However, changes in data availability, data measurement problems, and increasing interest in the relationship of the supply chain to the food dollar prompted ERS to change their food dollar analysis. ERS has therefore expanded the food dollar data series to now include three primary data series, and calculates the food dollar and its ―component parts‖ in three ways. ERS refers to the three new distributions of the food dollar as the following:
The marketing bill series: Similar to the previous ―marketing bill‖, this series breaks the food dollar down by marketing costs and farm shares.
The industry group series: Here, the food dollar is broken down by value added into ten industries including: farm and agribusiness, food processing, transportation, energy, packaging, food retailing, food services, finance and insurance, advertising, and legal, accounting, and bookkeeping services.
The primary factor series: This analysis breaks the food dollar into the components of salary and benefits, output taxes, domestic industry assets, and international imports.
Note the difference between the ―farm and agribusiness‖ share of the industry group series and the ―farm share‖ of the marketing bill series is that the ―farm share‖ includes
9 Economic Research Service. 2007. ―Food CPI, Prices, and Expenditures: How Changes in Input Costs
Affect Food Prices.‖ Retrieved from www.ers.usda.gov/Briefing/CPIFoodAndExpenditures/howchangesininputcostsaffectfoodprices.htm 10
This description of the changes made by ERS in calculating their food dollar is based on Canning, Patrick. (2011). A Revised and Expanded Food Dollar Series: A Better Understanding of our Food Costs. (Report No. ERR-114). Washington, D.C.: United States Department of Agriculture Economic Research Service. Retrieved from http://www.ers.usda.gov/publications/err114/ 11 The food dollar is defined by ERS as the ―total annual market value for all purchases of domestically produced foods by persons living in the United States.‖
ANALYSIS OF CORN, COMMODITY, AND CONSUMER FOOD PRICES
© 33
some non-farm value added (such as energy, transportation, and financial services), whereas the ―farm and agribusiness‖ share does not. The ERS study finds that such non-farm value added accounts for 4.2 cents of the farm share of every marketing bill dollar. Therefore the ―farm and agribusiness‖ share in the industry group series focuses on other input costs such as feed, seed, and fertilizer, without taking non-farm value added such as (on-farm) energy use, transportation, and financial services into account. The industry group study instead reallocates such value added into their proper categories (e.g. ―energy‖, ―transportation‖ within the industry group food dollar.) ERS‘s updated food dollar study uses annual input-output (IO) data from both the Bureau of Labor Statistics and the Bureau of Economic Analysis. ERS believes the new data series provides a better and more ―precise‖ approach for measuring the food dollar, it ensures the ―accounting of the entire food system is derived from a single consolidated data source, and that it will ―provide a more complete accounting of the modern global food system.‖ The analysis details what U.S. consumers pay for with every domestically produced food product. It does so by both separating out components of the food dollar that were previously combined into one marketing bill, and by further incorporating new breakdowns of the food dollar according to factors such as nominal/real values, a food and beverage analysis, and food consumed at home/away from home divisions. Using the revised and more complete data series, the study found that increases in the real values of other components of the food dollar partially contributed to the decrease in the farm share of the food dollar. For example, over the study period, increases in demand for food services have played a significant role in decreasing the farm share and farm and agribusiness share of the food dollar. 2. ERS Food Dollar Results: Marketing Bill Series
Using the revised marketing bill series data, the farm share of the food dollar was 15.8% in 2008, a 2.6% decrease since 1993. This revised farm share is a reduction relative to the 19% that was calculated using ERS‘s old method and was reported in Informa‘s last report. Figure 17 demonstrates the shares of the new marketing bill from 1993 to 2008 using USDA‘s new data series.
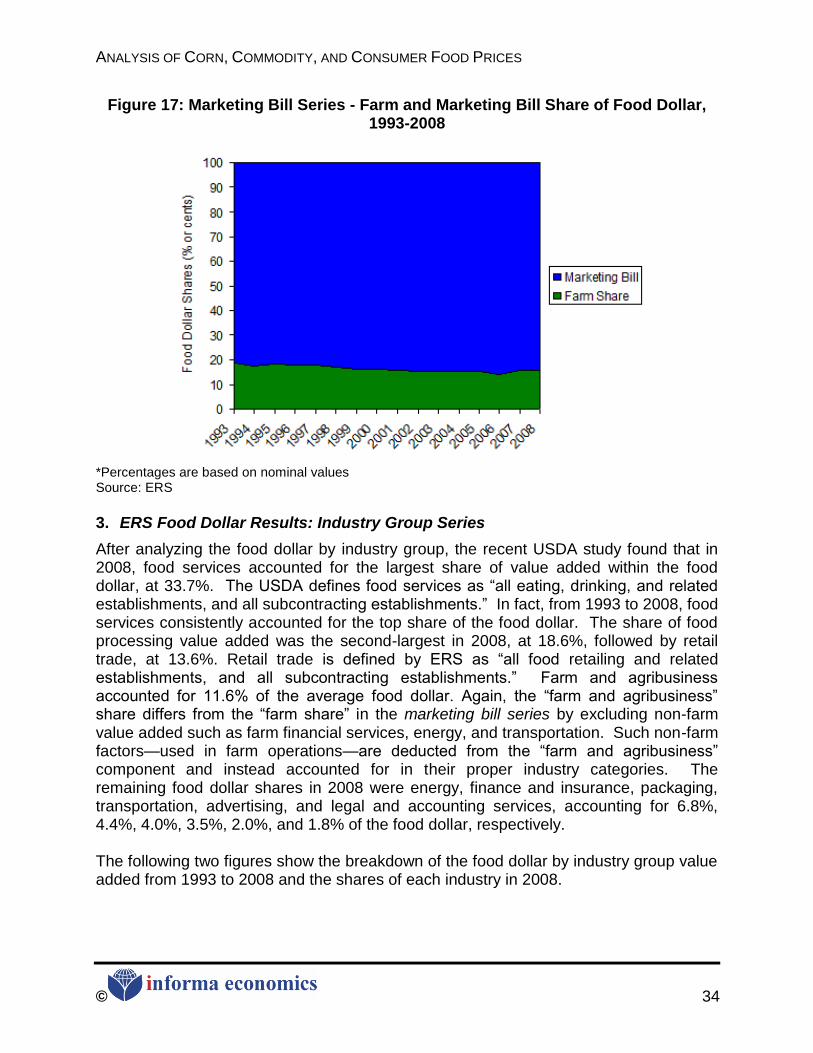
ANALYSIS OF CORN, COMMODITY, AND CONSUMER FOOD PRICES
© 34
Figure 17: Marketing Bill Series - Farm and Marketing Bill Share of Food Dollar, 1993-2008
*Percentages are based on nominal values Source: ERS
3. ERS Food Dollar Results: Industry Group Series
After analyzing the food dollar by industry group, the recent USDA study found that in 2008, food services accounted for the largest share of value added within the food dollar, at 33.7%. The USDA defines food services as ―all eating, drinking, and related establishments, and all subcontracting establishments.‖ In fact, from 1993 to 2008, food services consistently accounted for the top share of the food dollar. The share of food processing value added was the second-largest in 2008, at 18.6%, followed by retail trade, at 13.6%. Retail trade is defined by ERS as ―all food retailing and related establishments, and all subcontracting establishments.‖ Farm and agribusiness accounted for 11.6% of the average food dollar. Again, the ―farm and agribusiness‖ share differs from the ―farm share‖ in the marketing bill series by excluding non-farm value added such as farm financial services, energy, and transportation. Such non-farm factors—used in farm operations—are deducted from the ―farm and agribusiness‖ component and instead accounted for in their proper industry categories. The remaining food dollar shares in 2008 were energy, finance and insurance, packaging, transportation, advertising, and legal and accounting services, accounting for 6.8%, 4.4%, 4.0%, 3.5%, 2.0%, and 1.8% of the food dollar, respectively. The following two figures show the breakdown of the food dollar by industry group value added from 1993 to 2008 and the shares of each industry in 2008.
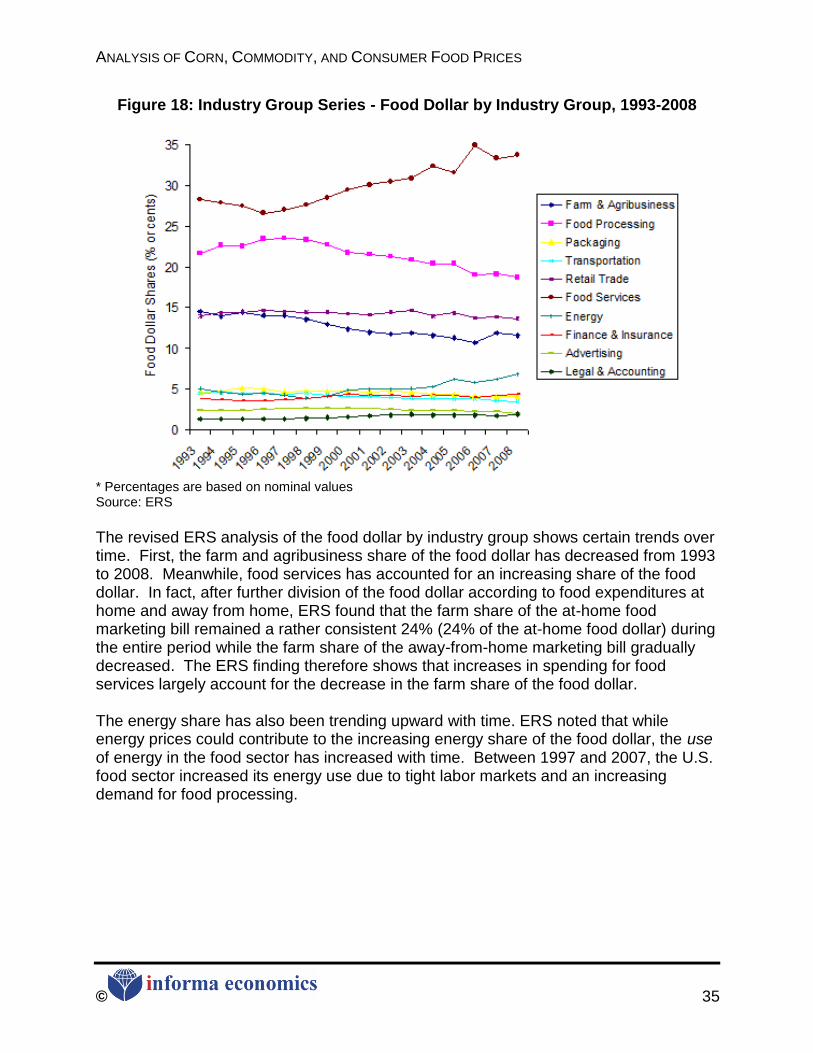
ANALYSIS OF CORN, COMMODITY, AND CONSUMER FOOD PRICES
© 35
Figure 18: Industry Group Series - Food Dollar by Industry Group, 1993-2008
* Percentages are based on nominal values Source: ERS
The revised ERS analysis of the food dollar by industry group shows certain trends over time. First, the farm and agribusiness share of the food dollar has decreased from 1993 to 2008. Meanwhile, food services has accounted for an increasing share of the food dollar. In fact, after further division of the food dollar according to food expenditures at home and away from home, ERS found that the farm share of the at-home food marketing bill remained a rather consistent 24% (24% of the at-home food dollar) during the entire period while the farm share of the away-from-home marketing bill gradually decreased. The ERS finding therefore shows that increases in spending for food services largely account for the decrease in the farm share of the food dollar. The energy share has also been trending upward with time. ERS noted that while energy prices could contribute to the increasing energy share of the food dollar, the use of energy in the food sector has increased with time. Between 1997 and 2007, the U.S. food sector increased its energy use due to tight labor markets and an increasing demand for food processing.
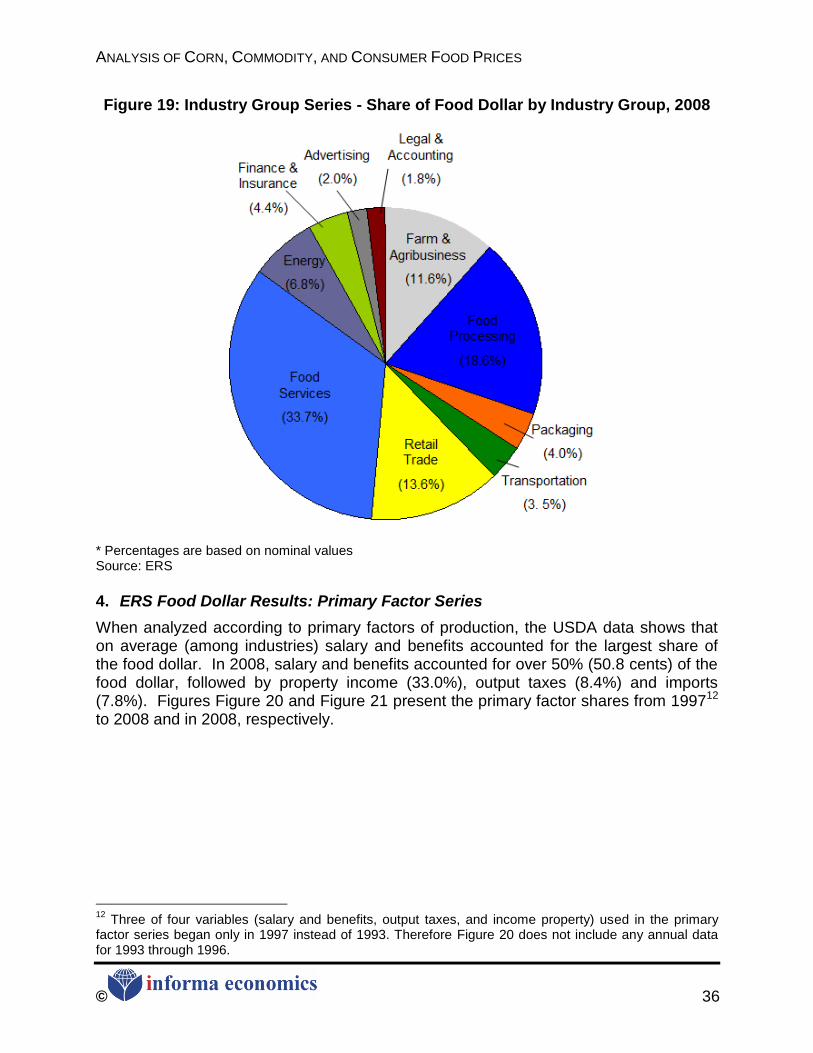
ANALYSIS OF CORN, COMMODITY, AND CONSUMER FOOD PRICES
© 36
Figure 19: Industry Group Series - Share of Food Dollar by Industry Group, 2008
* Percentages are based on nominal values Source: ERS
4. ERS Food Dollar Results: Primary Factor Series
When analyzed according to primary factors of production, the USDA data shows that on average (among industries) salary and benefits accounted for the largest share of the food dollar. In 2008, salary and benefits accounted for over 50% (50.8 cents) of the food dollar, followed by property income (33.0%), output taxes (8.4%) and imports (7.8%). Figures Figure 20 and Figure 21 present the primary factor shares from 199712 to 2008 and in 2008, respectively.
12
Three of four variables (salary and benefits, output taxes, and income property) used in the primary factor series began only in 1997 instead of 1993. Therefore Figure 20 does not include any annual data for 1993 through 1996.
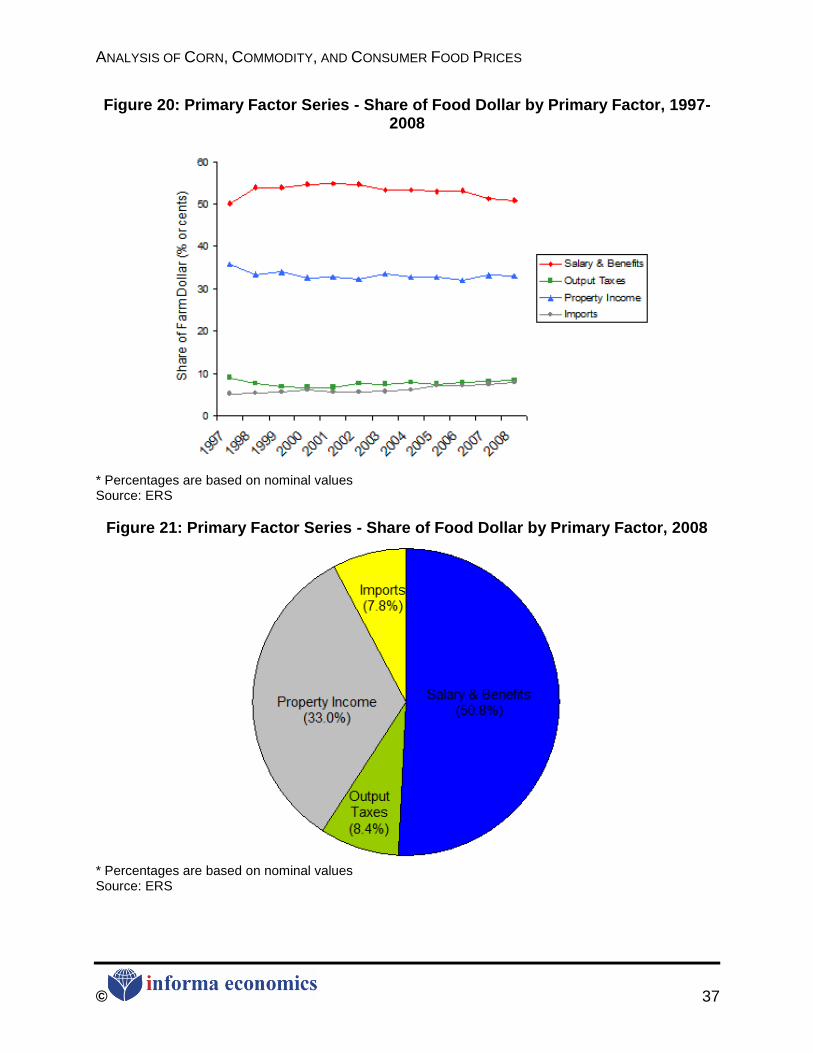
ANALYSIS OF CORN, COMMODITY, AND CONSUMER FOOD PRICES
© 37
Figure 20: Primary Factor Series - Share of Food Dollar by Primary Factor, 1997-2008
* Percentages are based on nominal values Source: ERS
Figure 21: Primary Factor Series - Share of Food Dollar by Primary Factor, 2008
* Percentages are based on nominal values Source: ERS
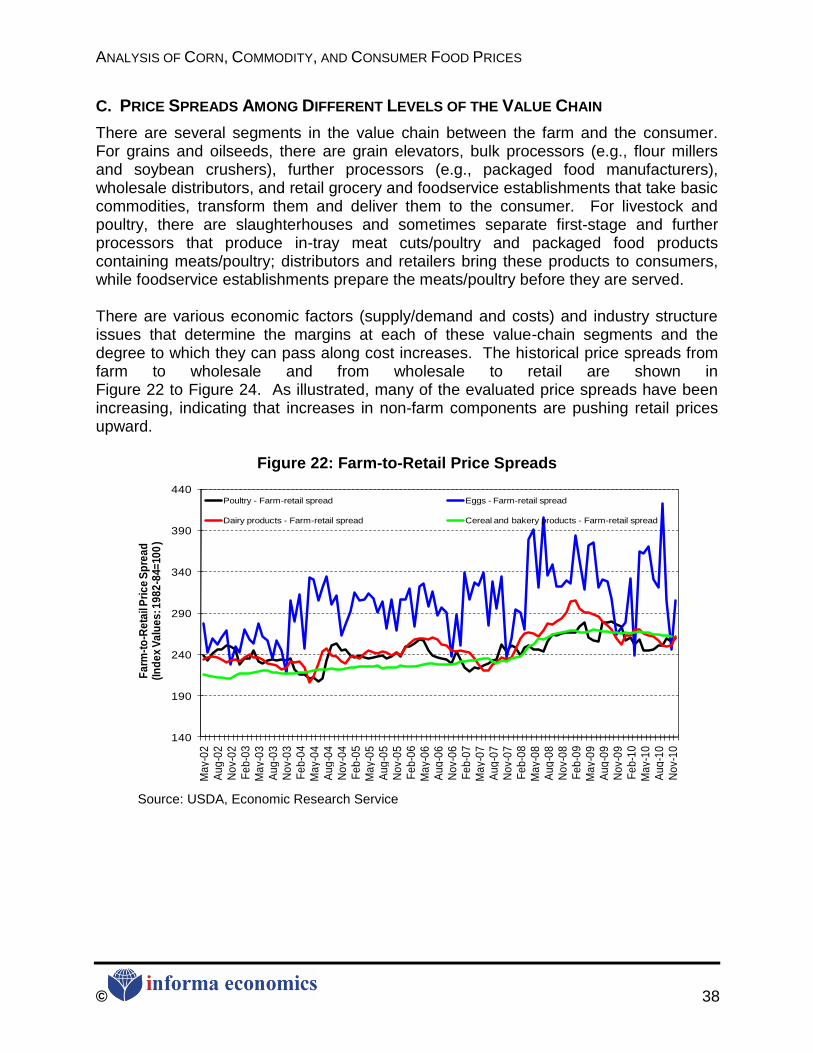
ANALYSIS OF CORN, COMMODITY, AND CONSUMER FOOD PRICES
© 38
C. PRICE SPREADS AMONG DIFFERENT LEVELS OF THE VALUE CHAIN
There are several segments in the value chain between the farm and the consumer. For grains and oilseeds, there are grain elevators, bulk processors (e.g., flour millers and soybean crushers), further processors (e.g., packaged food manufacturers), wholesale distributors, and retail grocery and foodservice establishments that take basic commodities, transform them and deliver them to the consumer. For livestock and poultry, there are slaughterhouses and sometimes separate first-stage and further processors that produce in-tray meat cuts/poultry and packaged food products containing meats/poultry; distributors and retailers bring these products to consumers, while foodservice establishments prepare the meats/poultry before they are served. There are various economic factors (supply/demand and costs) and industry structure issues that determine the margins at each of these value-chain segments and the degree to which they can pass along cost increases. The historical price spreads from farm to wholesale and from wholesale to retail are shown in Figure 22 to Figure 24. As illustrated, many of the evaluated price spreads have been increasing, indicating that increases in non-farm components are pushing retail prices upward.
Figure 22: Farm-to-Retail Price Spreads
140
190
240
290
340
390
440
Ma
y-0
2
Au
g-0
2N
ov-
02
Fe
b-0
3
Ma
y-0
3A
ug
-03
No
v-0
3
Fe
b-0
4M
ay-
04
Au
g-0
4
No
v-0
4F
eb
-05
Ma
y-0
5
Au
g-0
5N
ov-
05
Fe
b-0
6
Ma
y-0
6A
ug
-06
No
v-0
6
Fe
b-0
7M
ay-
07
Au
g-0
7
No
v-0
7F
eb
-08
Ma
y-0
8
Au
g-0
8N
ov-
08
Fe
b-0
9
Ma
y-0
9A
ug
-09
No
v-0
9
Fe
b-1
0M
ay-
10
Au
g-1
0
No
v-1
0
Fa
rm-t
o-R
eta
il P
ric
e S
pre
ad
(In
de
x V
alu
es
: 19
82
-84=
100
)
Poultry - Farm-retail spread Eggs - Farm-retail spread
Dairy products - Farm-retail spread Cereal and bakery products - Farm-retail spread
Source: USDA, Economic Research Service
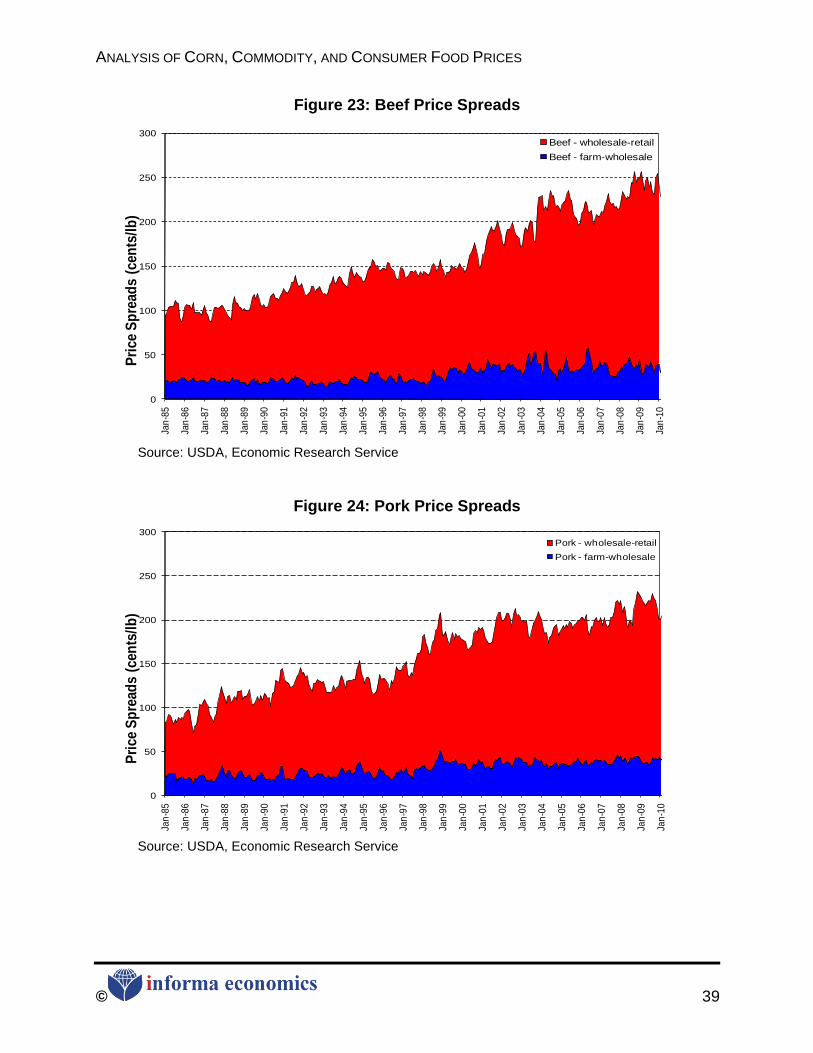
ANALYSIS OF CORN, COMMODITY, AND CONSUMER FOOD PRICES
© 39
Figure 23: Beef Price Spreads
0
50
100
150
200
250
300
Jan
-85
Jan
-86
Jan
-87
Jan
-88
Jan
-89
Jan
-90
Jan
-91
Jan
-92
Jan
-93
Jan
-94
Jan
-95
Jan
-96
Jan
-97
Jan
-98
Jan
-99
Jan
-00
Jan
-01
Jan
-02
Jan
-03
Jan
-04
Jan
-05
Jan
-06
Jan
-07
Jan
-08
Jan
-09
Jan
-10
Pri
ce S
pre
ads
(cen
ts/l
b)
Beef - wholesale-retail
Beef - farm-wholesale
Source: USDA, Economic Research Service
Figure 24: Pork Price Spreads
0
50
100
150
200
250
300
Jan
-85
Jan
-86
Jan
-87
Jan
-88
Jan
-89
Jan
-90
Jan
-91
Jan
-92
Jan
-93
Jan
-94
Jan
-95
Jan
-96
Jan
-97
Jan
-98
Jan
-99
Jan
-00
Jan
-01
Jan
-02
Jan
-03
Jan
-04
Jan
-05
Jan
-06
Jan
-07
Jan
-08
Jan
-09
Jan
-10
Pri
ce S
pre
ads
(cen
ts/l
b)
Pork - wholesale-retail
Pork - farm-wholesale
Source: USDA, Economic Research Service
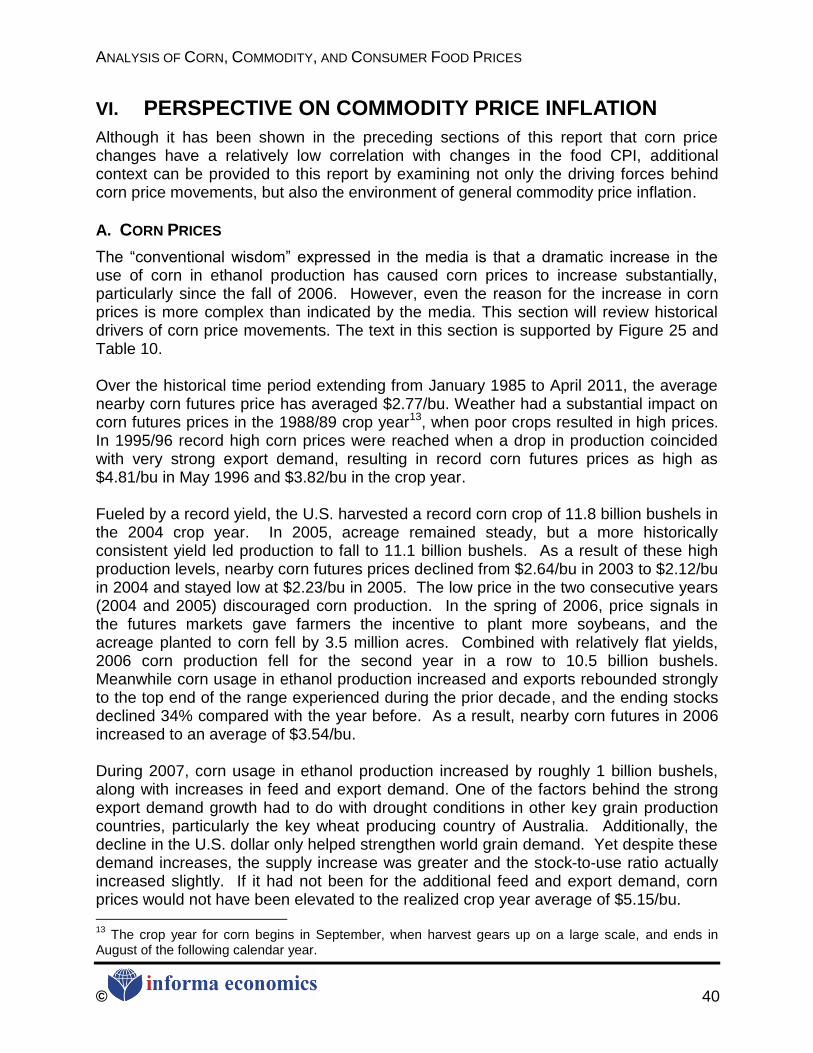
ANALYSIS OF CORN, COMMODITY, AND CONSUMER FOOD PRICES
© 40
VI. PERSPECTIVE ON COMMODITY PRICE INFLATION
Although it has been shown in the preceding sections of this report that corn price changes have a relatively low correlation with changes in the food CPI, additional context can be provided to this report by examining not only the driving forces behind corn price movements, but also the environment of general commodity price inflation.
A. CORN PRICES
The ―conventional wisdom‖ expressed in the media is that a dramatic increase in the use of corn in ethanol production has caused corn prices to increase substantially, particularly since the fall of 2006. However, even the reason for the increase in corn prices is more complex than indicated by the media. This section will review historical drivers of corn price movements. The text in this section is supported by Figure 25 and Table 10. Over the historical time period extending from January 1985 to April 2011, the average nearby corn futures price has averaged $2.77/bu. Weather had a substantial impact on corn futures prices in the 1988/89 crop year13, when poor crops resulted in high prices. In 1995/96 record high corn prices were reached when a drop in production coincided with very strong export demand, resulting in record corn futures prices as high as $4.81/bu in May 1996 and $3.82/bu in the crop year. Fueled by a record yield, the U.S. harvested a record corn crop of 11.8 billion bushels in the 2004 crop year. In 2005, acreage remained steady, but a more historically consistent yield led production to fall to 11.1 billion bushels. As a result of these high production levels, nearby corn futures prices declined from $2.64/bu in 2003 to $2.12/bu in 2004 and stayed low at $2.23/bu in 2005. The low price in the two consecutive years (2004 and 2005) discouraged corn production. In the spring of 2006, price signals in the futures markets gave farmers the incentive to plant more soybeans, and the acreage planted to corn fell by 3.5 million acres. Combined with relatively flat yields, 2006 corn production fell for the second year in a row to 10.5 billion bushels. Meanwhile corn usage in ethanol production increased and exports rebounded strongly to the top end of the range experienced during the prior decade, and the ending stocks declined 34% compared with the year before. As a result, nearby corn futures in 2006 increased to an average of $3.54/bu. During 2007, corn usage in ethanol production increased by roughly 1 billion bushels, along with increases in feed and export demand. One of the factors behind the strong export demand growth had to do with drought conditions in other key grain production countries, particularly the key wheat producing country of Australia. Additionally, the decline in the U.S. dollar only helped strengthen world grain demand. Yet despite these demand increases, the supply increase was greater and the stock-to-use ratio actually increased slightly. If it had not been for the additional feed and export demand, corn prices would not have been elevated to the realized crop year average of $5.15/bu. 13
The crop year for corn begins in September, when harvest gears up on a large scale, and ends in August of the following calendar year.
ANALYSIS OF CORN, COMMODITY, AND CONSUMER FOOD PRICES
© 41
During 2007, U.S. farmers proved that they could respond to the market‘s need for more corn by increasing production by approximately 2.5 billion bushels primarily through expanding acreage; only modest yield increases were realized in 2007. In the 1996 and 2002 Farm Bills, producers had been relieved of the base-acre and set-aside systems that had previously restricted what they could plant, and they now have ―freedom to farm‖ – the ability to allocate their crop acreage as they saw fit, with few remaining constraints. With this freedom and corn prices provided a significant net revenue premium per acre over soybeans, farmers planted 93.5 million acres of corn in 2007 – the highest level recorded since the 1940s. This resulted in production increasing to 13.0 billion bushels. The corn price peaked at $6.99/bu. in June 2008 and plummeted thereafter. The collapse of crude oil market in July 2008 was a strong signal of economic recession which systematically affected domestic consumption and foreign demand. While corn prices were high in 2007, oilseed prices were relatively higher, which led to a reduction in 2008 planted corn acres to 86.0 million acres. Soybean oil prices had been lifted by rising crude oil (petroleum) prices, and as a result the pace of soybean consumption was expected to bring stocks to meager levels by the end of the 2007 crop year. This led to upward pressure on soybean prices. Resulting from lower acreage, corn production was reduced from the high level experienced in 2007 to 12.1 billion bushels in 2008. 2008 was followed by a year in which production increased as a result of slight acreage increases and strong yields. In 2008 and 2009, although corn usage for ethanol production continued to grow by 700 million and 800 million bushels, respectively, the corn usage for feed and corn exports were 88% and 79% of 2007 levels. As a result of the reduced demand and increased 2009 production, the corn futures price declined to $3.92/bu. in 2008 and to $3.72/bu. in 2009. Then, in 2010, as production fell and demand increased, the stocks-to-use ratio was reduced down to 5% and corn prices increased to a historic high. The corn futures price rose again in the 2010/11 crop year. However, unlike the price increase in 2006 and 2007, 2010 did not coincide with a significant increase in ethanol production. In fact, ethanol production increases have been flattening out as capacity approaches the 2015 15 billion gallon per year mandate level. Thus, the 2010 price increase cannot be wholly attributed to increased demand on the part of the ethanol industry. The price increase in 2010 is largely a combination of strong export demand, unfavorable August weather, strengthening feed demand, and a run-up in petroleum prices that increased production costs and soybean prices, for which corn competes with for acreage. The dry warm weather in August 2010 had a substantial impact on the corn yield, lowering it from 164.7 bushels/acre in 2009 to 152.8 bushels/acre in 2010. The ending stocks are expected to be 0.68 billion bushels (5%), only about 40% of previous year‘s stock. The average corn futures price during September 2010 and April 2011 is $6.18/bu. and the annual average is expected to be $6.35/bu.
ANALYSIS OF CORN, COMMODITY, AND CONSUMER FOOD PRICES
© 42
A fundamental driver of the price of corn is the level of inventories at the end of the crop-marketing year. Ending stocks are viewed by the industry as the ―cushion‖ or ―buffer‖ stocks available to incorporate increases in demand or reductions in supply in the following crop year. The larger the level of ending stocks, the more comfortable the market will be with a given level of demand. In particular, the ratio of yearend stocks to total consumption during the year is a key price determinant. Corn prices tend to weaken when supplies are plentiful relative to usage, whereas they strengthen when stocks are drawn down compared to demand. Historically, corn prices tend to ―overreact‖ when stock-to-use ratio is very low. The average of stock-to-use ratio during 1985/86 – 2010/11 is 20.39%, while it is expected to be merely 5.04% in 2010/11. The level of stocks is market driven, as the U.S. government no longer carries large stocks as part of its corn support programs. In evaluating the price movements of corn over the past few years and the driving forces behind these movements, growing ethanol demand has been only one of many forces. Weather conditions domestically have impacted domestic supplies, conditions abroad have impacted export demand, and petroleum prices have impacted not only production costs but also soybean oil prices. This impact on soybean oil prices has influenced corn prices as corn and soybeans compete for acreage.
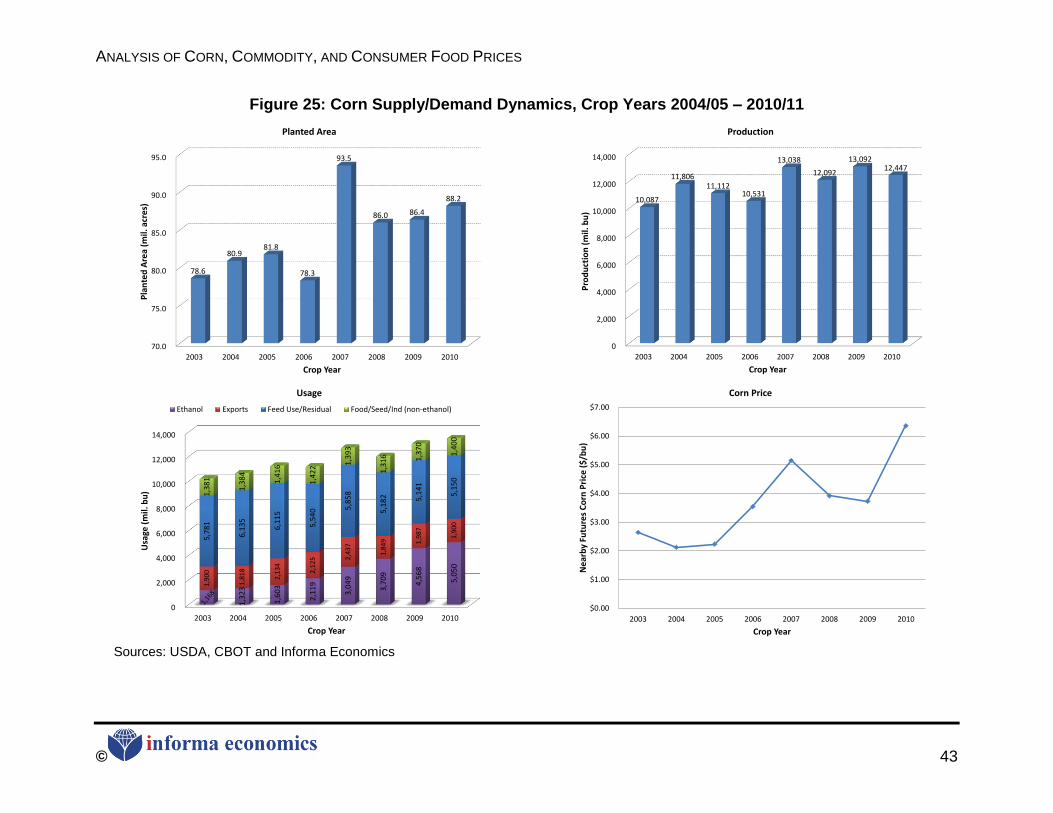
ANALYSIS OF CORN, COMMODITY, AND CONSUMER FOOD PRICES
© 43
Figure 25: Corn Supply/Demand Dynamics, Crop Years 2004/05 – 2010/11
0
2,000
4,000
6,000
8,000
10,000
12,000
14,000
2003 2004 2005 2006 2007 2008 2009 2010
10,087
11,806 11,112
10,531
13,038
12,092
13,092 12,447
Pro
du
ctio
n (
mil.
bu
)
Crop Year
Production
0
2,000
4,000
6,000
8,000
10,000
12,000
14,000
2003 2004 2005 2006 2007 2008 2009 2010
1,3
23
1,6
03
2,1
19
3,0
49
3,7
09
4,5
68
5,0
50
1,9
00
1,8
18
2,1
34
2,1
25
2,4
37
1,8
49
1,9
87
1,9
00
5,7
81
6,1
35
6,1
15
5,5
40
5,8
58
5,1
82
5,1
41
5,1
50
1,3
81
1,3
84
1,4
16
1,4
22
1,3
93
1,3
16
1,3
70
1,4
00
Usa
ge (
mil.
bu
)
Crop Year
Usage
Ethanol Exports Feed Use/Residual Food/Seed/Ind (non-ethanol)
$0.00
$1.00
$2.00
$3.00
$4.00
$5.00
$6.00
$7.00
2003 2004 2005 2006 2007 2008 2009 2010
Ne
arb
y Fu
ture
s C
orn
Pri
ce (
$/b
u)
Crop Year
Corn Price
Sources: USDA, CBOT and Informa Economics
70.0
75.0
80.0
85.0
90.0
95.0
2003 2004 2005 2006 2007 2008 2009 2010
78.6
80.9 81.8
78.3
93.5
86.0 86.4
88.2
Pla
nte
d A
rea
(mil.
acr
es)
Crop Year
Planted Area
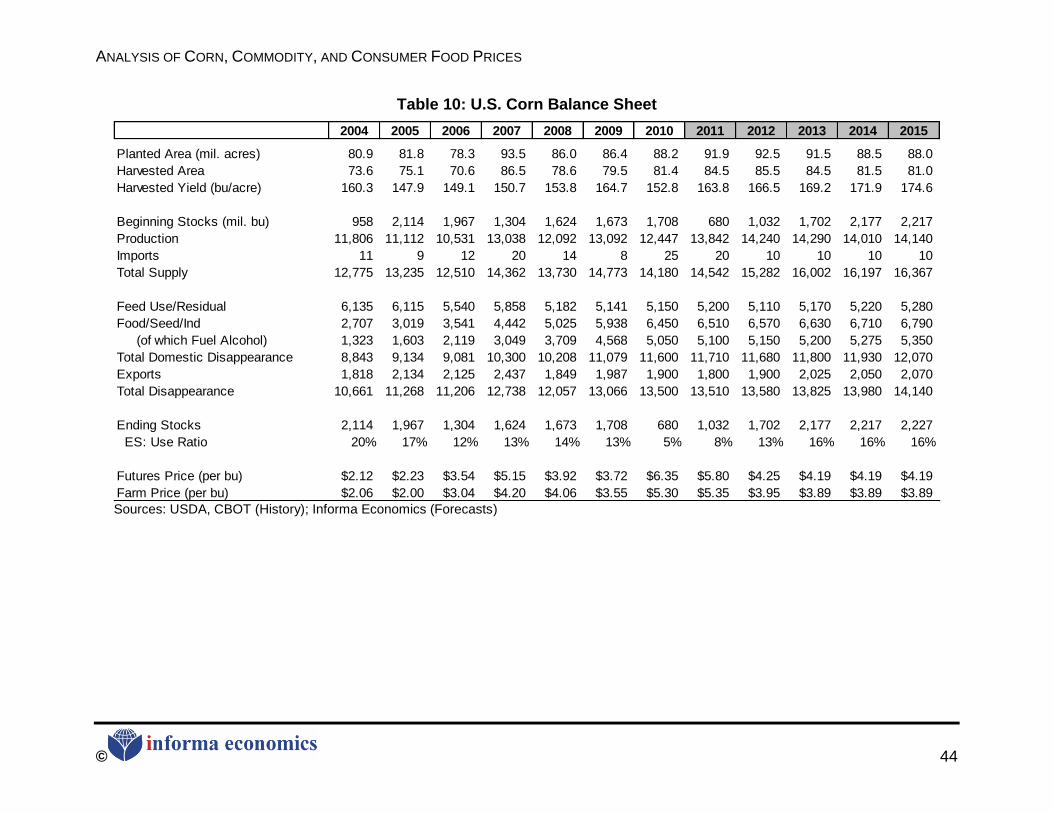
ANALYSIS OF CORN, COMMODITY, AND CONSUMER FOOD PRICES
© 44
Table 10: U.S. Corn Balance Sheet
2004 2005 2006 2007 2008 2009 2010 2011 2012 2013 2014 2015
Planted Area (mil. acres) 80.9 81.8 78.3 93.5 86.0 86.4 88.2 91.9 92.5 91.5 88.5 88.0
Harvested Area 73.6 75.1 70.6 86.5 78.6 79.5 81.4 84.5 85.5 84.5 81.5 81.0
Harvested Yield (bu/acre) 160.3 147.9 149.1 150.7 153.8 164.7 152.8 163.8 166.5 169.2 171.9 174.6
Beginning Stocks (mil. bu) 958 2,114 1,967 1,304 1,624 1,673 1,708 680 1,032 1,702 2,177 2,217
Production 11,806 11,112 10,531 13,038 12,092 13,092 12,447 13,842 14,240 14,290 14,010 14,140
Imports 11 9 12 20 14 8 25 20 10 10 10 10
Total Supply 12,775 13,235 12,510 14,362 13,730 14,773 14,180 14,542 15,282 16,002 16,197 16,367
Feed Use/Residual 6,135 6,115 5,540 5,858 5,182 5,141 5,150 5,200 5,110 5,170 5,220 5,280
Food/Seed/Ind 2,707 3,019 3,541 4,442 5,025 5,938 6,450 6,510 6,570 6,630 6,710 6,790
(of which Fuel Alcohol) 1,323 1,603 2,119 3,049 3,709 4,568 5,050 5,100 5,150 5,200 5,275 5,350
Total Domestic Disappearance 8,843 9,134 9,081 10,300 10,208 11,079 11,600 11,710 11,680 11,800 11,930 12,070
Exports 1,818 2,134 2,125 2,437 1,849 1,987 1,900 1,800 1,900 2,025 2,050 2,070
Total Disappearance 10,661 11,268 11,206 12,738 12,057 13,066 13,500 13,510 13,580 13,825 13,980 14,140
Ending Stocks 2,114 1,967 1,304 1,624 1,673 1,708 680 1,032 1,702 2,177 2,217 2,227
ES: Use Ratio 20% 17% 12% 13% 14% 13% 5% 8% 13% 16% 16% 16%
Futures Price (per bu) $2.12 $2.23 $3.54 $5.15 $3.92 $3.72 $6.35 $5.80 $4.25 $4.19 $4.19 $4.19
Farm Price (per bu) $2.06 $2.00 $3.04 $4.20 $4.06 $3.55 $5.30 $5.35 $3.95 $3.89 $3.89 $3.89 Sources: USDA, CBOT (History); Informa Economics (Forecasts)
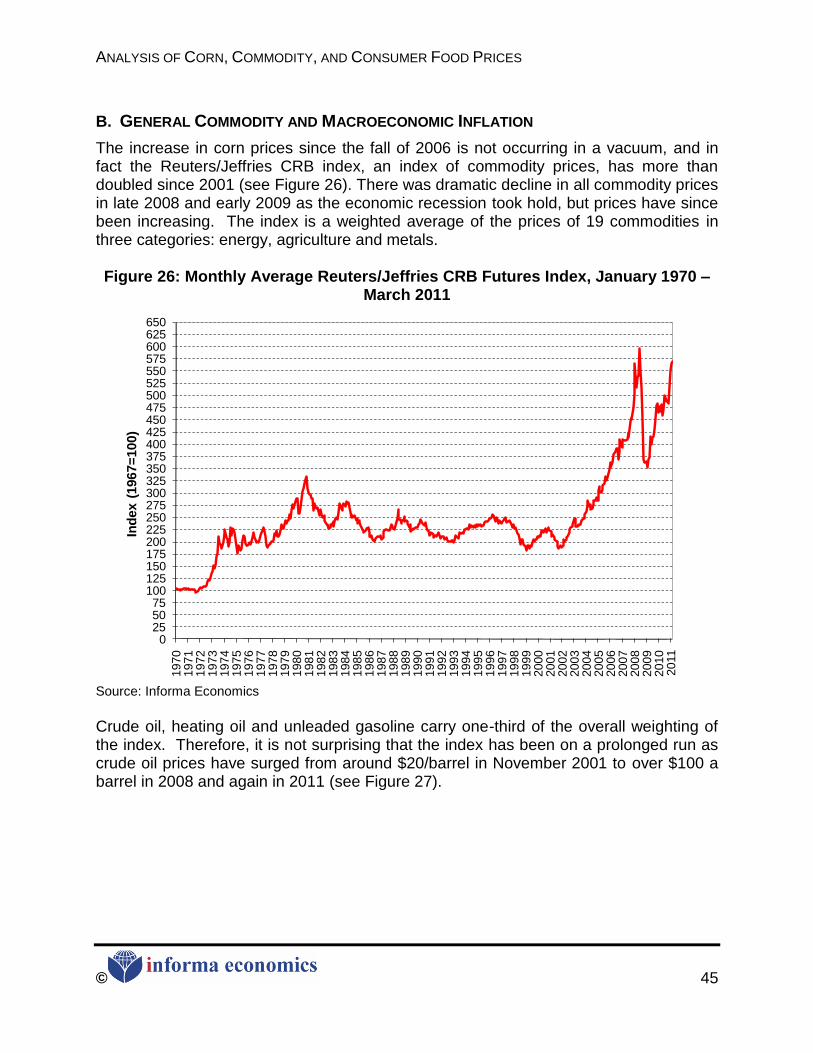
ANALYSIS OF CORN, COMMODITY, AND CONSUMER FOOD PRICES
© 45
B. GENERAL COMMODITY AND MACROECONOMIC INFLATION
The increase in corn prices since the fall of 2006 is not occurring in a vacuum, and in fact the Reuters/Jeffries CRB index, an index of commodity prices, has more than doubled since 2001 (see Figure 26). There was dramatic decline in all commodity prices in late 2008 and early 2009 as the economic recession took hold, but prices have since been increasing. The index is a weighted average of the prices of 19 commodities in three categories: energy, agriculture and metals. Figure 26: Monthly Average Reuters/Jeffries CRB Futures Index, January 1970 –
March 2011
0255075
100125150175200225250275300325350375400425450475500525550575600625650
1970
1971
1972
1973
1974
1975
1976
1977
1978
1979
1980
1981
1982
1983
1984
1985
1986
1987
1988
1989
1990
1991
1992
1993
1994
1995
1996
1997
1998
1999
2000
2001
2002
2003
2004
2005
2006
2007
2008
2009
2010
2011
Ind
ex (
1967=
100)
Monthly Average 'Reuters- CRB Futures IndexJanuary 1970--September 2007
Source: Informa Economics
Crude oil, heating oil and unleaded gasoline carry one-third of the overall weighting of the index. Therefore, it is not surprising that the index has been on a prolonged run as crude oil prices have surged from around $20/barrel in November 2001 to over $100 a barrel in 2008 and again in 2011 (see Figure 27).
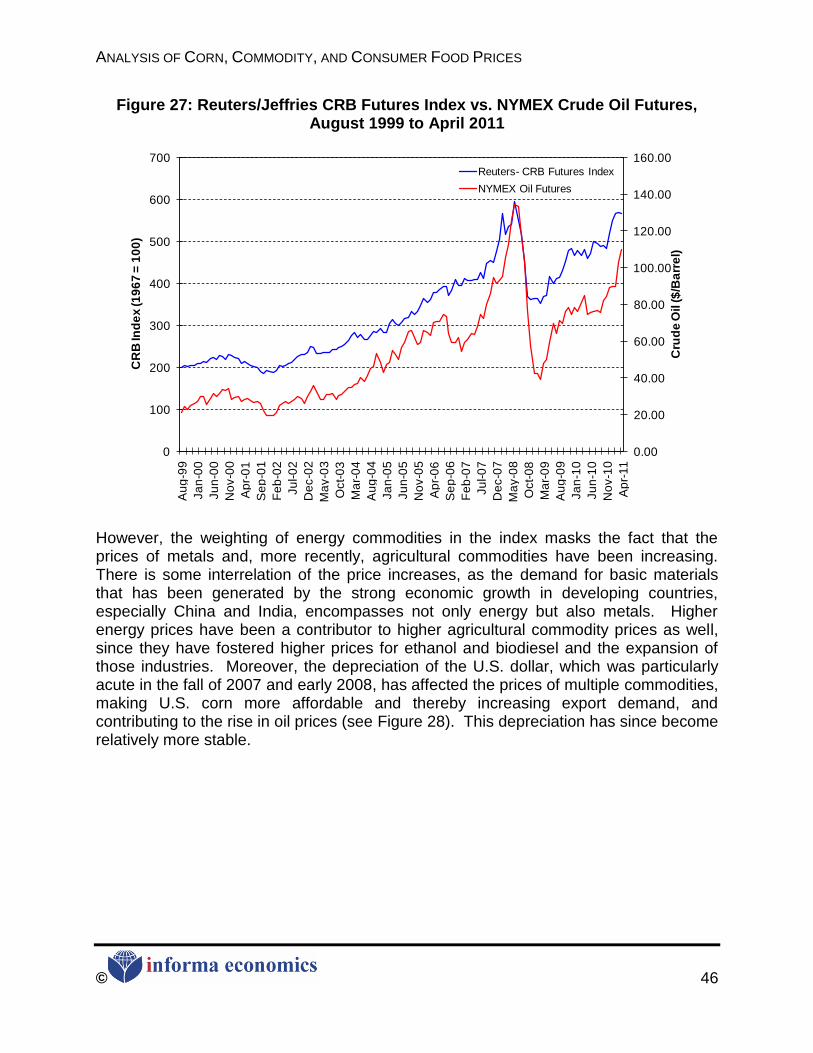
ANALYSIS OF CORN, COMMODITY, AND CONSUMER FOOD PRICES
© 46
Figure 27: Reuters/Jeffries CRB Futures Index vs. NYMEX Crude Oil Futures, August 1999 to April 2011
0.00
20.00
40.00
60.00
80.00
100.00
120.00
140.00
160.00
0
100
200
300
400
500
600
700
Au
g-9
9
Ja
n-0
0
Ju
n-0
0
No
v-0
0
Ap
r-0
1
Se
p-0
1
Fe
b-0
2
Ju
l-0
2
De
c-0
2
Ma
y-0
3
Oct-
03
Ma
r-0
4
Au
g-0
4
Ja
n-0
5
Ju
n-0
5
No
v-0
5
Ap
r-0
6
Se
p-0
6
Fe
b-0
7
Ju
l-0
7
De
c-0
7
Ma
y-0
8
Oct-
08
Ma
r-0
9
Au
g-0
9
Ja
n-1
0
Ju
n-1
0
No
v-1
0
Ap
r-11
Cru
de
Oil ($
/Ba
rre
l)
CR
B In
de
x (1
96
7 =
10
0)
Reuters- CRB Futures Index
NYMEX Oil Futures
However, the weighting of energy commodities in the index masks the fact that the prices of metals and, more recently, agricultural commodities have been increasing. There is some interrelation of the price increases, as the demand for basic materials that has been generated by the strong economic growth in developing countries, especially China and India, encompasses not only energy but also metals. Higher energy prices have been a contributor to higher agricultural commodity prices as well, since they have fostered higher prices for ethanol and biodiesel and the expansion of those industries. Moreover, the depreciation of the U.S. dollar, which was particularly acute in the fall of 2007 and early 2008, has affected the prices of multiple commodities, making U.S. corn more affordable and thereby increasing export demand, and contributing to the rise in oil prices (see Figure 28). This depreciation has since become relatively more stable.
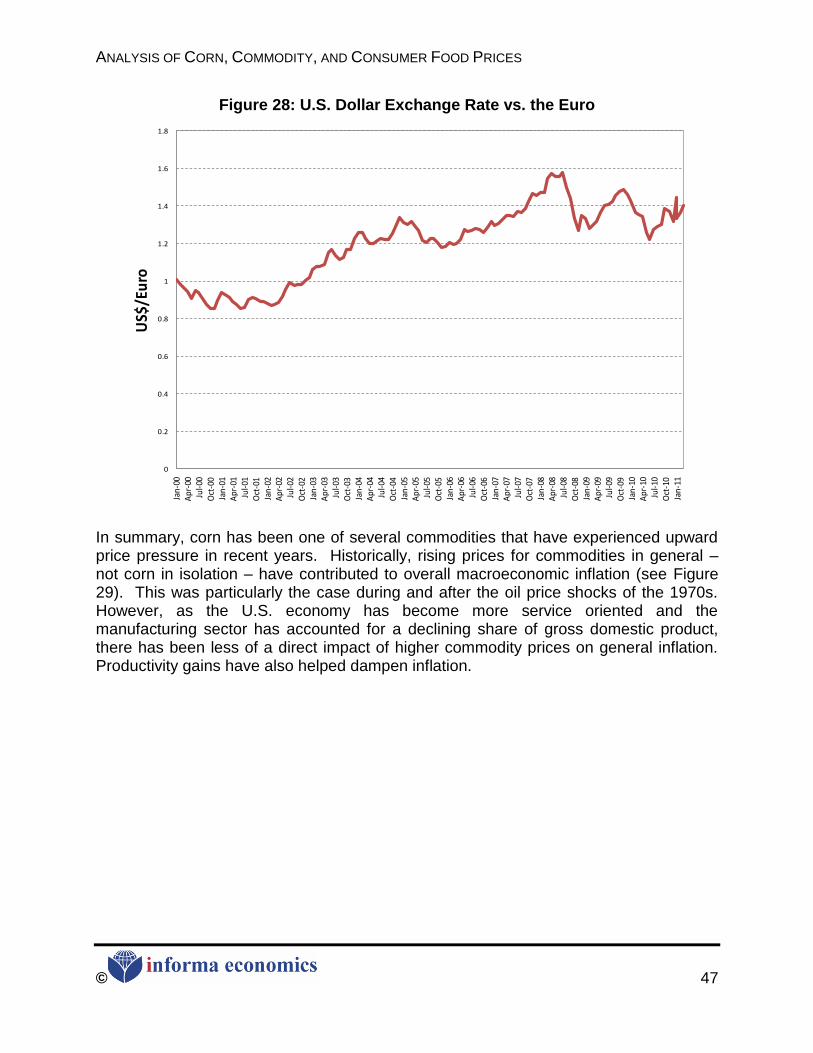
ANALYSIS OF CORN, COMMODITY, AND CONSUMER FOOD PRICES
© 47
Figure 28: U.S. Dollar Exchange Rate vs. the Euro
0
0.2
0.4
0.6
0.8
1
1.2
1.4
1.6
1.8
Jan-
00A
pr-0
0Ju
l-00
Oct
-00
Jan-
01A
pr-0
1Ju
l-01
Oct
-01
Jan-
02A
pr-0
2Ju
l-02
Oct
-02
Jan-
03A
pr-0
3Ju
l-03
Oct
-03
Jan-
04A
pr-0
4Ju
l-04
Oct
-04
Jan-
05A
pr-0
5Ju
l-05
Oct
-05
Jan-
06A
pr-0
6Ju
l-06
Oct
-06
Jan-
07A
pr-0
7Ju
l-07
Oct
-07
Jan-
08A
pr-0
8Ju
l-08
Oct
-08
Jan-
09A
pr-0
9Ju
l-09
Oct
-09
Jan-
10A
pr-1
0Ju
l-10
Oct
-10
Jan-
11
US$
/Eu
ro
In summary, corn has been one of several commodities that have experienced upward price pressure in recent years. Historically, rising prices for commodities in general – not corn in isolation – have contributed to overall macroeconomic inflation (see Figure 29). This was particularly the case during and after the oil price shocks of the 1970s. However, as the U.S. economy has become more service oriented and the manufacturing sector has accounted for a declining share of gross domestic product, there has been less of a direct impact of higher commodity prices on general inflation. Productivity gains have also helped dampen inflation.
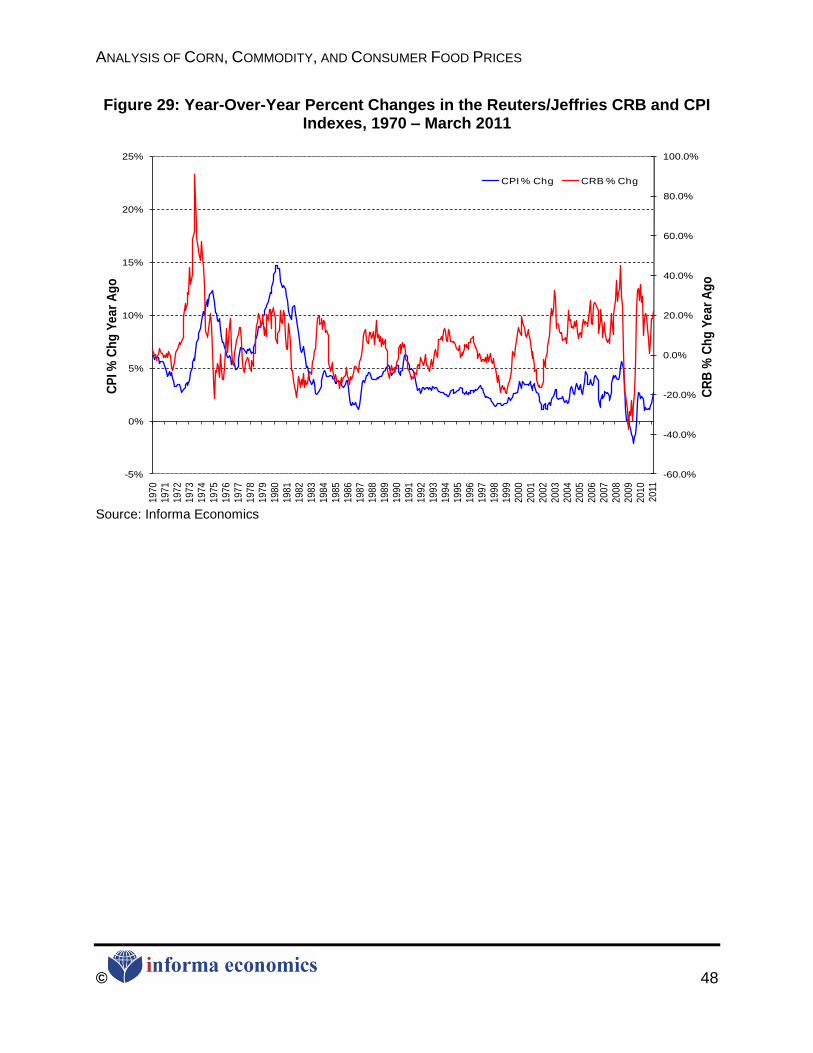
ANALYSIS OF CORN, COMMODITY, AND CONSUMER FOOD PRICES
© 48
Figure 29: Year-Over-Year Percent Changes in the Reuters/Jeffries CRB and CPI Indexes, 1970 – March 2011
-60.0%
-40.0%
-20.0%
0.0%
20.0%
40.0%
60.0%
80.0%
100.0%
-5%
0%
5%
10%
15%
20%
25%1
97
01
97
11
97
21
97
31
97
41
97
51
97
61
97
71
97
81
97
91
98
01
98
11
98
21
98
31
98
41
98
51
98
61
98
71
98
81
98
91
99
01
99
11
99
21
99
31
99
41
99
51
99
61
99
71
99
81
99
92
00
02
00
12
00
22
00
32
00
42
00
52
00
62
00
72
00
82
00
92
01
02
011
CR
B %
Ch
g Y
ea
r A
go
CP
I % C
hg
Ye
ar
Ag
o
CPI % Chg CRB % Chg
Source: Informa Economics
ANALYSIS OF CORN, COMMODITY, AND CONSUMER FOOD PRICES
© 49
VII. CONCLUSIONS
While there have been a number of stories in the media over the last few years indicating consumer food prices are being driven higher by an ethanol-induced increase in corn prices, there is little evidence of such a simplistic cause-and-effect linkage. In reality, a complex set of factors drives the food CPI. In fact, the marketing bill, defined as the portion of the food dollar that is not related to the farm value of raw materials, has a stronger relationship with the food CPI than does the cost of corn. Statistical evidence does not support a conclusion that the growth in the ethanol industry is the driving force behind higher consumer food prices. Ethanol has not been the only factor influencing corn prices, other supply and demand factors have also been at play. Furthermore, corn prices have a relatively weak correlation with food prices, as the farm share is a relatively small portion of the overall retail food dollar and for many products corn is only a portion of the farm value. While an increase in corn prices will affect certain industries – for example, causing livestock and poultry feeding margins to be lower than they otherwise would have been – the statistical evidence does not support a conclusion that there is a strict ―food-versus-fuel‖ tradeoff that is automatically driving consumer food prices higher.