Embed Size (px)
Citation preview
International Journal of Applied Science and Engineering 2012. 10, 3: 171-179
Int. J. Appl. Sci. Eng., 2012. 10, 3 171
Analysis of Cumulative Distribution Function of 2-year Rainfall Measurements in Ogbomoso, Nigeria
Folasade Abiola Semirea,b,*, Rosmiwati Mohd-Mokhtara, Temidayo Victor Omotoshoc, Widad
Ismaila, Norizah Mohamada, and J.S. Mandeepd
aSchool of Electrical and Electronic Engineering, Universiti Sains Malaysia, Engineering Campus, Nibong Tebal, Malaysia
bDepartment of Electronic and Electrical Engineering, Ladoke Akintola University of Technology, P.M.B. Ogbomoso, Oyo State, Nigeria
cDepartment of Physics, Covenant University, Ota, Ogun State, Nigeria dDepartment of Electrical and Electronic Engineering, Universiti Kebangsaan Malaysia, Bangi,
Selangor, Malaysia Abstract: The conversion of most available hourly rainfall data to 1-minute integration time rain rate statistic is imperative for accurate estimation of attenuation due to rain employed in the design of both terrestrial and earth-to-space microwave systems. 2-year rainfall data collected at Ogbomoso, South-west region of Nigeria, between the periods of 2009 and 2010 was used in the analysis. Result shows that a power law relationship exists between the equiprobable rain rates of two different integration times. The regression coefficients a and b obtained are slightly different from the ITU-R recommendation. The conversion factor obtained at Ogbomoso is lower compared to Ile-Ife, in the South-west region of the country. The disagreement is attributed to the effect of global warming hitting the whole universe most especially the tropical regions. This study also reveals that different conversion factors are required for different locations even within the same climatic region. Keywords: Rain rate; attenuation; equiprobable rain rate; regression coefficient.
* Corresponding author; e-mail: [email protected] Received 11 May 2011 © 2012 Chaoyang University of Technology, ISSN 1727-2394 Revised 6 February 2012 Accepted 8 February 2012
1. Introduction
Attenuation due to rain has long been known to be the major atmospheric effect that limits the path length over which reliable radio communication systems can be established [1-2]. It also limits the usage of higher frequencies for terrestrial microwave point to point as well as satellite communication. As the frequency increases, the impact of atmospheric conditions on the radio wave propagation increases [3-4], causing reduction in the quality of signal in
the case of analogue transmissions, and increase in the bit error rate in the case of digital transmissions. Rain attenuation prediction requires 1-minute rain rate statistics which are not readily available in most meteorological centres especially in Nigeria. Hence, the need for conversion from higher integration time to ITU-R recommended 1-minute integration time [5]. Several works have been reported on the effect of integration time on rain rate over
Folasade Abiola Semire, Rosmiwati Mohd-Mokhtar, Temidayo Victor Omotosho, Widad Ismail, Norizah Mohamad, and J.S. Mandeep
172 Int. J. Appl. Sci. Eng., 2012. 10, 3
the last three decades [6-10], but most of these conversion factors deviate from the ITU-R recommendation. The work of Segal and Burgueno reported that a unified regression coefficient for the conversion of rain rates of other integration times to 1-minute was not possible [11-12].
In this paper, some characteristics of 2-year tropical rainfall measurement at Ogbomoso are discussed. The objective of this study is to investigate the effect of integration time on the rain rate and the relation to cumulative distribution functions. In doing so, the conversion factors at different integration times are modelled. In addition, the rain rate duration characteristic is also examined. The study is to present an accurate time integration conversion formula for estimation of 1-minute rainfall rate for adequate microwave link budget estimation.
The paper is organized as follows. Section 2 discusses the rainfall pattern of the study area while section 3 describes the measurement system set-up and the procedure used to obtain the cumulative distribution function of rainfall rate. The results of the measured rainfall rate at different integration time are presented in section 4. The analysis on the characteristic of the conversion factors and rain rate duration are also discussed. The significant results of the work are recapitulated in section 5. 2. Study area
Nigeria, a country located on western part of Africa has two predominant seasons: Dry and rainy seasons. The country is divided into six regions: North-west, North-east, North central, South-west, South-east and South-south. The rainfall event and its associated rain accumulation increases from the North-east region down to the South-south region. Ogbomoso is located on (8.150N, 4.250E) The town is close to the
border of North-central region of the country. It is the second largest town in Oyo state and the fifth in the country.
The town, most often, experiences a rain pattern different from its associated towns within the same region. The rain pattern is similar to that of North central region, although the total rain accumulation expected is still the same but with different patterns in terms of: period of rainy season, number of rain event, duration of rain event and total rain accumulation. The population of the town increases as a result of student’s yearly enrolment in the university located in the town. Consequently, communication around the town sometimes experiences congestion -especially during heavy rain fall. Therefore, there is the need to present an accurate measurement of rainfall in the station for quality, adequate and reliable communication systems for the area.
3. Measurement system setup
The precise knowledge of rain attenuation on any communication link improves the estimation of link availability by providing accurate knowledge of outage time expected. Most attenuation prediction models require at least 1min. rain rate statistic [13-14]. Rain rate statistic is specified on percentage of time basis; i.e the percentage of time in a year or a month that rain rate equals or exceeds a specific value. A network of rain wise rain gauges was set-up at three strategic places in Ogbomoso, Oyo State, Nigeria. One rain gauge was placed at the Faculty of Engineering workshop, Ladoke Akintola University of technology (LAUTECH), Ogbomoso, one at Ogbomoso High school in the North Local Government area and the last one at Owode police station located in the South Local Government area of the town.
The positions of the rain gauge were almost on a straight line at 5km apart [15-17]. Rain gauges were set at 0.5mm rain
Analysis of Cummulative Distribution Function of 2-year Rainfall Measurements in Ogbomoso, Nigeria
Int. J. Appl. Sci. Eng., 2012. 10, 3 173
wise tipping bucket type, which records the number of tipping in a 1-minute integration time. No data is recorded if the bucket does not tip which means there is no or very little rain i.e. less than 0.5mm/ minute or 30mm/h. The accuracy of the rain gauge is above 95% and the period of the equipment down time is less than 2%. This is because the rain gauge comes with a rain logger.
The rain log attached to the rain buckets contains a microcontroller that has a real time clock with EEPROM (Electrically Erasable Programmable Read Only Memory) containing input and serial ports. Once the logger is configured using the RL- Loader software, it goes into standby mode, and remains in this mode until the internal clock reaches the end of a minute. The logger checks for a number of contact closures recorded in the preceding minute, if the count is greater than zero, the logger writes an entry into the EEPROM. This entry contains the time, date and number of counts for that minute.
Rainfall data were extracted from the rain logger into Microsoft Excel for statistical processing. Rain rates at different percentages of time are estimated from the data using Macro Excel program to extract the number of times different rain rate occur. Rain rate cumulative probability function (cdf) at 6 different integration time threshold (1, 5, 10, 15, 20, 30 and 60 minutes) are evaluated. Subsequently, the regression analysis method is also employed. The regression coefficients for 3 integration times are derived by plotting the logarithm of 1-min data against other integration times.
4. Measurement results of rain rate in
ogbomoso 4.1. Integration time
The relationship between rain rate statistics with different integration times has
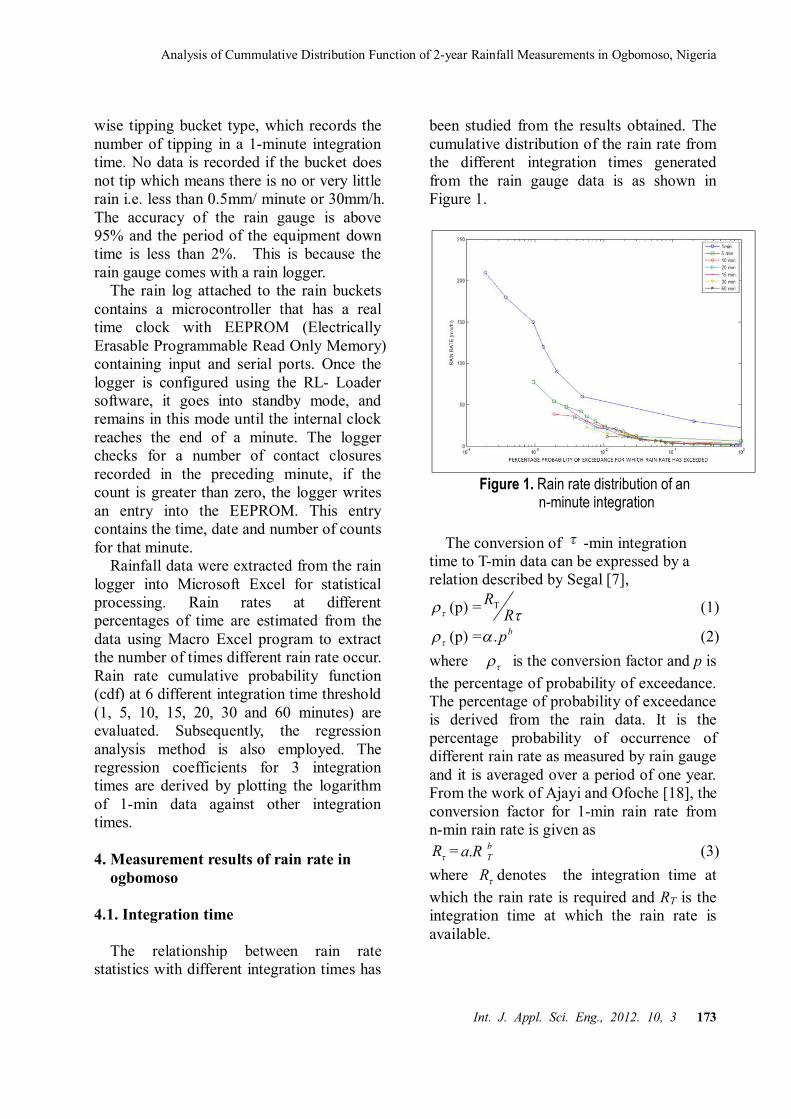
been studied from the results obtained. The cumulative distribution of the rain rate from the different integration times generated from the rain gauge data is as shown in Figure 1.
Figure 1. Rain rate distribution of an
n-minute integration
The conversion of -min integration time to T-min data can be expressed by a relation described by Segal [7],
(p) = RR (1)
(p) = bp. (2) where is the conversion factor and p is the percentage of probability of exceedance. The percentage of probability of exceedance is derived from the rain data. It is the percentage probability of occurrence of different rain rate as measured by rain gauge and it is averaged over a period of one year. From the work of Ajayi and Ofoche [18], the conversion factor for 1-min rain rate from n-min rain rate is given as
R = Ra. bT (3)
where R denotes the integration time at which the rain rate is required and RT is the integration time at which the rain rate is available.
Folasade Abiola Semire, Rosmiwati Mohd-Mokhtar, Temidayo Victor Omotosho, Widad Ismail, Norizah Mohamad, and J.S. Mandeep
174 Int. J. Appl. Sci. Eng., 2012. 10, 3
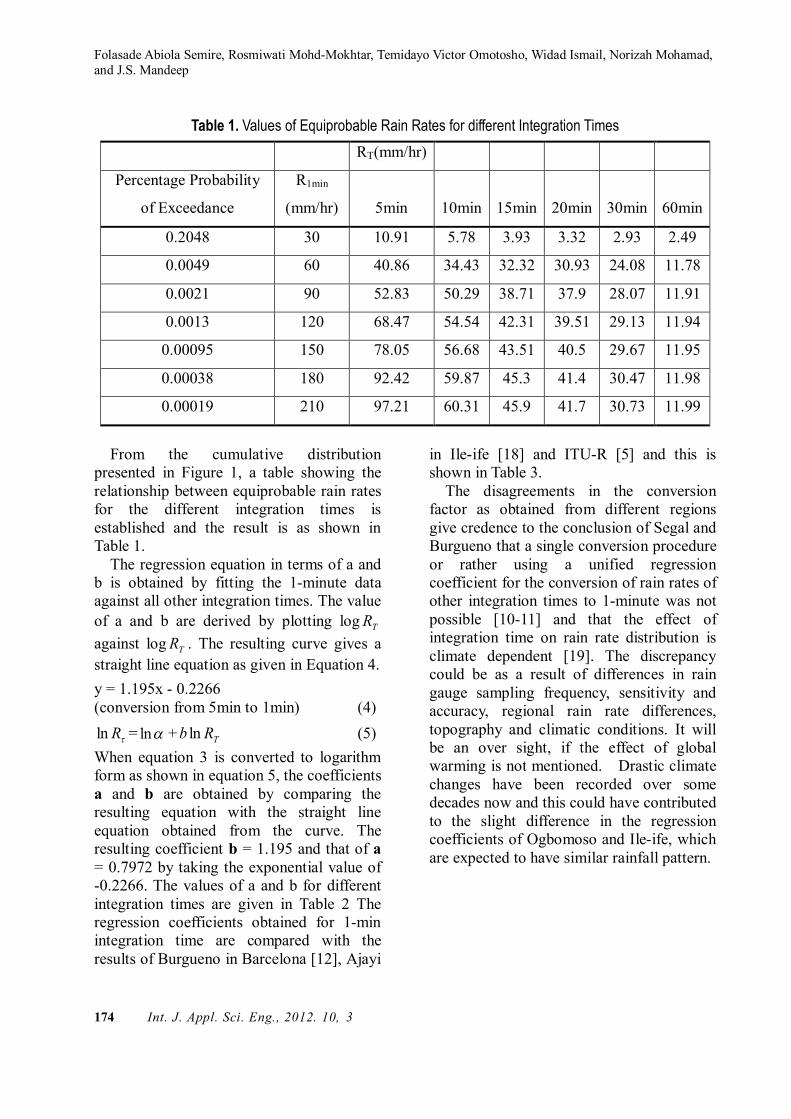
Table 1. Values of Equiprobable Rain Rates for different Integration Times
RT(mm/hr)
Percentage Probability
of Exceedance
R1min
(mm/hr) 5min 10min 15min 20min 30min 60min
0.2048 30 10.91 5.78 3.93 3.32 2.93 2.49
0.0049 60 40.86 34.43 32.32 30.93 24.08 11.78
0.0021 90 52.83 50.29 38.71 37.9 28.07 11.91
0.0013 120 68.47 54.54 42.31 39.51 29.13 11.94
0.00095 150 78.05 56.68 43.51 40.5 29.67 11.95
0.00038 180 92.42 59.87 45.3 41.4 30.47 11.98
0.00019 210 97.21 60.31 45.9 41.7 30.73 11.99
From the cumulative distribution
presented in Figure 1, a table showing the relationship between equiprobable rain rates for the different integration times is established and the result is as shown in Table 1.
The regression equation in terms of a and b is obtained by fitting the 1-minute data against all other integration times. The value of a and b are derived by plotting log TR against log TR . The resulting curve gives a straight line equation as given in Equation 4.
y = 1.195x - 0.2266 (conversion from 5min to 1min) (4)
Rln = ln + TRb ln (5)
When equation 3 is converted to logarithm form as shown in equation 5, the coefficients a and b are obtained by comparing the resulting equation with the straight line equation obtained from the curve. The resulting coefficient b = 1.195 and that of a = 0.7972 by taking the exponential value of -0.2266. The values of a and b for different integration times are given in Table 2 The regression coefficients obtained for 1-min integration time are compared with the results of Burgueno in Barcelona [12], Ajayi
in Ile-ife [18] and ITU-R [5] and this is shown in Table 3.
The disagreements in the conversion factor as obtained from different regions give credence to the conclusion of Segal and Burgueno that a single conversion procedure or rather using a unified regression coefficient for the conversion of rain rates of other integration times to 1-minute was not possible [10-11] and that the effect of integration time on rain rate distribution is climate dependent [19]. The discrepancy could be as a result of differences in rain gauge sampling frequency, sensitivity and accuracy, regional rain rate differences, topography and climatic conditions. It will be an over sight, if the effect of global warming is not mentioned. Drastic climate changes have been recorded over some decades now and this could have contributed to the slight difference in the regression coefficients of Ogbomoso and Ile-ife, which are expected to have similar rainfall pattern.
Analysis of Cummulative Distribution Function of 2-year Rainfall Measurements in Ogbomoso, Nigeria
Int. J. Appl. Sci. Eng., 2012. 10, 3 175
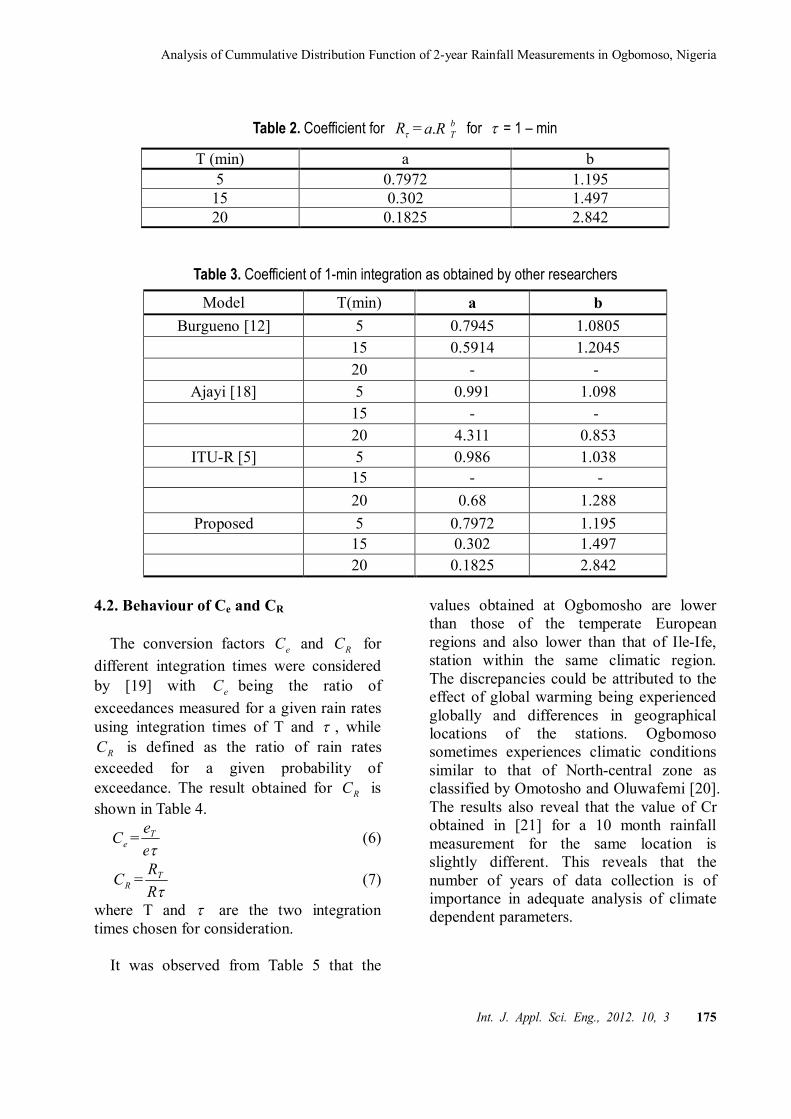
Table 2. Coefficient for R = Ra. bT for = 1 – min
T (min) a b 5 0.7972 1.195
15 0.302 1.497 20 0.1825 2.842
Table 3. Coefficient of 1-min integration as obtained by other researchers
Model T(min) a b Burgueno [12] 5 0.7945 1.0805
15 0.5914 1.2045 20 - -
Ajayi [18] 5 0.991 1.098 15 - - 20 4.311 0.853
ITU-R [5] 5 0.986 1.038 15 - - 20 0.68 1.288
Proposed 5 0.7972 1.195 15 0.302 1.497 20 0.1825 2.842
4.2. Behaviour of Ce and CR
The conversion factors eC and RC for different integration times were considered by [19] with eC being the ratio of exceedances measured for a given rain rates using integration times of T and , while
RC is defined as the ratio of rain rates exceeded for a given probability of exceedance. The result obtained for RC is shown in Table 4.
eC =e
eT (6)
RC =R
RT (7)
where T and are the two integration times chosen for consideration.
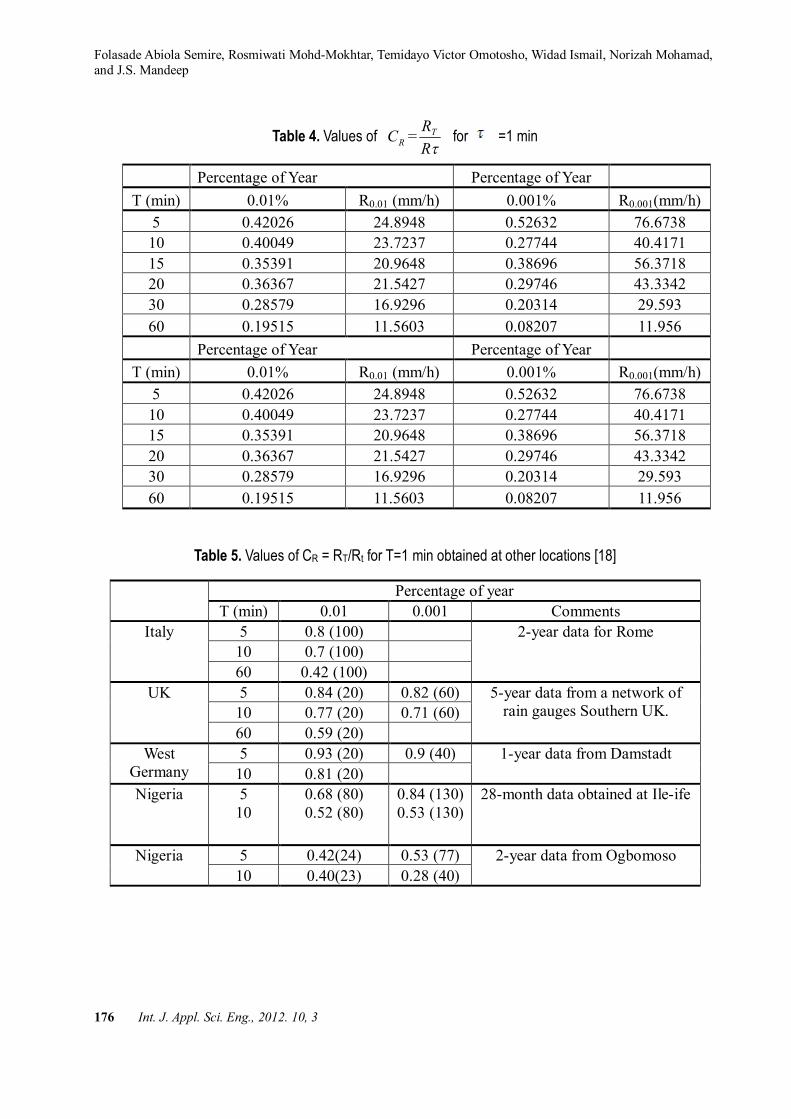
It was observed from Table 5 that the
values obtained at Ogbomosho are lower than those of the temperate European regions and also lower than that of Ile-Ife, station within the same climatic region. The discrepancies could be attributed to the effect of global warming being experienced globally and differences in geographical locations of the stations. Ogbomoso sometimes experiences climatic conditions similar to that of North-central zone as classified by Omotosho and Oluwafemi [20]. The results also reveal that the value of Cr obtained in [21] for a 10 month rainfall measurement for the same location is slightly different. This reveals that the number of years of data collection is of importance in adequate analysis of climate dependent parameters.
Folasade Abiola Semire, Rosmiwati Mohd-Mokhtar, Temidayo Victor Omotosho, Widad Ismail, Norizah Mohamad, and J.S. Mandeep
176 Int. J. Appl. Sci. Eng., 2012. 10, 3
Table 4. Values of RC =R
RT for =1 min
Percentage of Year Percentage of Year T (min) 0.01% R0.01 (mm/h) 0.001% R0.001(mm/h)
5 0.42026 24.8948 0.52632 76.6738 10 0.40049 23.7237 0.27744 40.4171 15 0.35391 20.9648 0.38696 56.3718 20 0.36367 21.5427 0.29746 43.3342 30 0.28579 16.9296 0.20314 29.593 60 0.19515 11.5603 0.08207 11.956
Percentage of Year Percentage of Year T (min) 0.01% R0.01 (mm/h) 0.001% R0.001(mm/h)
5 0.42026 24.8948 0.52632 76.6738 10 0.40049 23.7237 0.27744 40.4171 15 0.35391 20.9648 0.38696 56.3718 20 0.36367 21.5427 0.29746 43.3342 30 0.28579 16.9296 0.20314 29.593 60 0.19515 11.5603 0.08207 11.956
Table 5. Values of CR = RT/Rt for T=1 min obtained at other locations [18]
Percentage of year T (min) 0.01 0.001 Comments
Italy 5 0.8 (100) 2-year data for Rome 10 0.7 (100) 60 0.42 (100)
UK 5 0.84 (20) 0.82 (60) 5-year data from a network of rain gauges Southern UK. 10 0.77 (20) 0.71 (60)
60 0.59 (20) West
Germany 5 0.93 (20) 0.9 (40) 1-year data from Damstadt
10 0.81 (20) Nigeria 5
10 0.68 (80) 0.52 (80)
0.84 (130) 0.53 (130)
28-month data obtained at Ile-ife
Nigeria 5 0.42(24) 0.53 (77) 2-year data from Ogbomoso 10 0.40(23) 0.28 (40)
Analysis of Cummulative Distribution Function of 2-year Rainfall Measurements in Ogbomoso, Nigeria
Int. J. Appl. Sci. Eng., 2012. 10, 3 177
4.3. Rain rate duration analysis
Rain rate duration analysis has been carried out on the 2- year data obtained from Ogbomosho. In this analysis, rain rate duration is described as the number of occasions for rain event of a particular rain rate occurs for a specified duration. Rain
Event is defined when a continuous rain occurs above a specified rain rate and threshold. The number of occasions and their respective duration for the rain rates obtained from the rain gauge measurement with integration time of 1-minute is as shown in Table 6.
Table 6. Numbers of occasions when rain rates is continuously exceeded for duration of ΔT seconds
ΔT (sec) 30 mm/hr
60 mm/hr
90 mm/hr
120 mm/hr
150 mm/hr
180 mm/hr
210 mm/hr
60 1060 15 4 2 3 1 1 300 2 1 600 1 900 1
1200 1 1800 3600
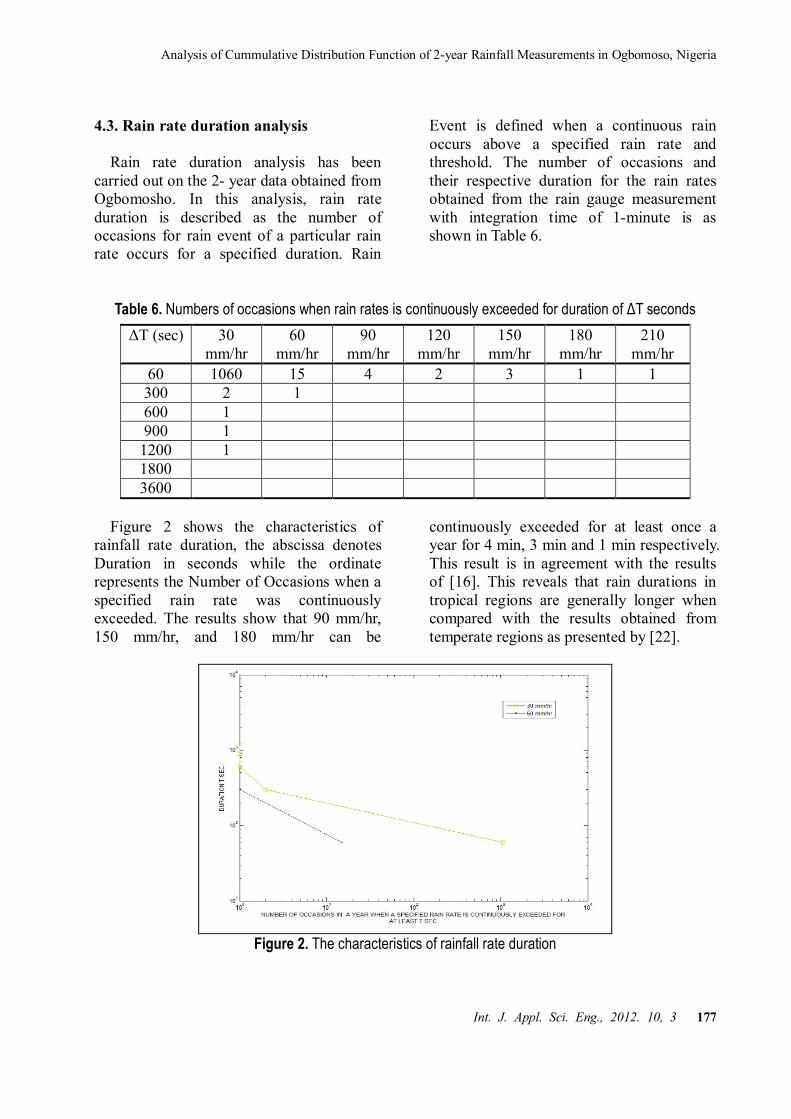
Figure 2 shows the characteristics of
rainfall rate duration, the abscissa denotes Duration in seconds while the ordinate represents the Number of Occasions when a specified rain rate was continuously exceeded. The results show that 90 mm/hr, 150 mm/hr, and 180 mm/hr can be
continuously exceeded for at least once a year for 4 min, 3 min and 1 min respectively. This result is in agreement with the results of [16]. This reveals that rain durations in tropical regions are generally longer when compared with the results obtained from temperate regions as presented by [22].
Figure 2. The characteristics of rainfall rate duration
Folasade Abiola Semire, Rosmiwati Mohd-Mokhtar, Temidayo Victor Omotosho, Widad Ismail, Norizah Mohamad, and J.S. Mandeep
178 Int. J. Appl. Sci. Eng., 2012. 10, 3
5. Conclusion In this contribution, 2-year rainfall data at Ogbomosho station have been used in the study of effect of integration time on the cumulative distribution of rain rate. The result shows that power law relationship exists between the equiprobable rain rates of two different integration times and that conversion factor is climate and terrain dependent. The conversion factors CR and CE obtained at Ogbomoso are lower compared to those obtained at Ile-Ife. This could be as a result of differences in rain gauge sampling frequency, sensitivity and accuracy, regional rain rate differences, topography and climatic conditions as well as the effect of global warming. Our results show that different conversion factors are required for different locations even within the same climatic region for the conversion of one integration time to another as against the ITU-R unified time integration regression coefficients. In conclusion, the contribution of this study apparently reveals that rainfall pattern in the tropics most especially in Nigeria and all over the world is gradually changing and the corresponding effect is evident in the conversion factors. The effect which is traceable to global warming is becoming popular and efforts are now geared towards reducing its effects on atmospheric conditions and consequently on environments and humans. References [ 1] Ippolito, Jr. L.J. 1986. “Radio wave
propagation in satellite communication”. Third Ed., Van Nostrand Reinhold Company, New York.
[ 2] Pratt, T., Bostian, C.W., and Alnutt, J.E. 2003. “Satellite Communication”. Third Ed., Wiley: New York.
[ 3] ITU–RP. 618-10. 2001. Propagation
Data and prediction methods Requirement for the design of Earth-space. Telecom. Sys. Geneva.
[ 4] Kenneth, C.A. 1990. Observation of geographical variability of the attenuation rate in rain. Proceedings of URSI Commission F Open Symposium on Regional Factors in Predicting Radiowave Attenuation due to Rain, Rio de Janeiro.
[ 5] ITU-R Rec. P. 838-3. 2007. Specific attenuation models for rain for use in prediction methods. Telecom. Sys. Geneva.
[ 6] Moupfouma, F. and Martin, L. 1995. Modelling of the rainfall rate cumulative distribution for the design of satellite and terrestrial communication systems. International Journal of Satellite Communications, 13, 1: 105-115.
[ 7] Joo, H.L., Choi, S.Y., Pack, K.J., and Ha, H.E. 2002. Conversion of rain rate distribution for various integration time. “Proceedings of URSI Commission F Wave Propagation and Remote Sensing, Maastricht”. The Netherlands, August 2002.
[ 8] Ong, J.T. and Zhu, C.N. 1997. Effect of integration time on rain rate statistics for Singapore. Proceedings of 10th International Conference on Antennas and Propagation, Singapore, 14th - 17th of April, 1997.
[ 9] Maitra, A., Das, S., and Shukla, A.K. 2009. Joint Statistics of Rain Rate and Event Duration for Tropical location in India. India J. Radio Space Phy, 38: 353-363.
[10] Mandeep, J.S., Hassan, S.I.S., and Ain, M.F. 2008. Rain rate conversion for various integration time for equatorial and tropical climates. International Journal of Satellite Communication, 26: 329-345.
[11] Segal, B. 1986. The Influence of Rain Gauge Integration Time on Measured
Analysis of Cummulative Distribution Function of 2-year Rainfall Measurements in Ogbomoso, Nigeria
Int. J. Appl. Sci. Eng., 2012. 10, 3 179
Rainfall Intensity Distribution Functions. J. of Atmospheric Oceanic Tech, 3, 4: 662-671.
[12] Burgueno, A.M., Puigcever, M., and Vilar, E. 1988. Influence of raingauge integration time on the rain rate statistics used in microwave communication. Annals of Telecommunications, 43, 9-10: 522-527.
[13] ITU-RP. 530-13 2005. Propagation Data and Prediction Methods required for the design of Terrestrial line-of-sight system. Telecom. Sys. Geneva.
[14] Lin, S.H. 1997. National long term rain statistics and empirical calculate of 11GHz microwave rain attenuation. The Bell Sys. Techn. J. 56, 9: 1581-1604.
[15] Khamis, N.H., Din, J., and Abdul-Rahman, T. 2004. Determination of Rain Cell Size Distribution For Microwave Link Design in Malaysia. RFM, Selangor, Malaysia.
[16] Pan, Q.W. and Bryant, G.H. 1994. Effective Rain-cell Diameters and Rain-column Heights in the Tropics. Electronic Letter. 30, 21: 1800-1802.
[17] Goldhirsh, J. and Musiani, B.H. 1992. Dimension Statistics of Rain Cell Cores and associated Rain Rate Isopleths Derived from Radar Measurements in the Mid-Atlantic Coast of the United States. Geosci. Rem. Sens., IEEE Transations, 30, 1: 28 – 37.
[18] Ajayi, G.O. and Ofoche, E.B. 1983. Some tropical rainfall rate characteristic at Ile-Ife for microwave and millimetre wave applications. J. Clim. Appl. Meteor, 23: 562-567.
[19] Watson, P.A., Sathiaseelan, V., and Potter, B. 1981. Development of a climatic map of rainfall attenuation for Europe Post graduate school of Electriacl and Electronic Engineering, University of Bradford, U.K., Rep, 300,
134. [20] Omotosho, T.V. and Oluwafemi, C.O.
2009. Impairment of radio wave signal by rainfall on fixed satellite service on earth-space path at 37 stations in Nigeria. J. Atmosp. Solar –Terr. Phy. 71: 830-840.
[21] Semire, F.A and Raji, T.I. 2011. Characteristics of Measured Rainfall Rate at Ogbomoso, Nigeria for Microwave Applications. J. of Telecommunications and Information Technology, 2, 2: 85-89.
[22] Aydin, K. and Daisley, S.E.A. 2002. Relationship between rainfall rate and 35-GHz attenuation and differential attenuation: modelling the effects of raindrop size distribution canting and oscillation. Geosci. Rem. Sens., IEEE Transactions, 40, 11: 2343-2352.
Appendix Nomenclatures
conversion factor at time P percentage of probability of
exceedance Ce conversion factor given in terms
of probability of exceedance CR conversion factor given in terms
of rain rate at different integration time
a,b regression coefficients R rain rate for unavailable
integration time (mm/h) RT rain rate for available (T minute)
integration time (mm/h) Rp rain rate at a certain percentage
of time (mm/h)