Embed Size (px)
Citation preview

discussed. Section IV discusses the test systems under study in this research. Section V compares and analyzes the simulation results. Section VI contains the conclusion.
II. LITERATURE REVIEW
The advantages and disadvantages of HVDC system have been discussed in [i]. HVDC system has found many applications, like power transmission over a long distance, power transmission through cables, offshore transmission, power transmission to urban areas and grid segmentation, since its evolution in the late 1950s [i-iii].
The main components of HVDC system have been discussed in detail in [iii-iv]. Convertor is an integral component of HVDC system There are three convertor technologies available namely line commutated current source (LCC), capacitor commutated convertors (CCC) and voltage source convertors (VSC).
Grid segmentation is one of the modern applications of HVDC technology in which a huge power grid is divided into smaller segments which are then connected to each other through HVDC links. The concept of grid segmentation was introduced by authors in [v-viii]. Increased reliability of renewable sources integration [ix], efficient congestion management [ix], improvement in power system stability, power transfer capability and reduction of cascading outages and blackouts are the proposed advantages of grid segmentation [vi -xi].
The authors concluded that VSC-HVDC technology gave better transient stability results than LCC-HVDC technology and HVAC after studying a two-area hybrid HVDC-HVAC system. A three phase short circuit fault was applied and bus voltage, bus angle, generator speed and rotor angle were analyzed [xii]. Two-area power network containing VSC-HVDC links gave better results, with respect to system stability, than that containing pure AC links. Generation loss and tripping of transmission lines were the disturbances applied [xiii]. A two area network containing VSC-HVDC links in parallel with AC links
.
39
Abstract-This paper explores the power grid segmentation concept for power system stability improvement in detail. First, the firewall property of grid segmentation is investigated for a two area network. Then two HVDC technologies, LCC and VSC, are compared for the same network. A two area VSC-AC segmented network is then compared with two area VSC segmented network. Suitable segmentation topology and suitable number of VSC segmented areas are then investigated. Simulation results show that grid segmentation offers network stability during fault conditions and VSC is the most suitable choice for segmentation over LCC. Results further show that having large number of DC segmented areas and using the radial segmentation topology improves the stability of the overall system. All the simulations were carried out in PSS®E software provided by SIEMENS.
Keywords-HVDC System, Grid Segmentation, Stability, Voltage Source Convertors, Line Commutated Convertors.
I. INTRODUCTION
In the earlier days, DC (direct current) systems were used for electrical power generation, transmission and distribution. Due to low voltage levels and high losses associated with DC systems in the past, the electrical power generating sources had to be located very close to the electrical loads. With the invention of AC system, particularly the transformer, the problems of high transmission line losses and location of generating stations were solved. The development of power electronics and semi conductor devices resulted in significant improvement in the system for transmitting DC power at high voltage levels. This system is called high voltage direct current (HVDC) system.
This paper is structured as follows. In section II, merits and demerits of HVDC system, its latest applications and research work carried out in power grid segmentation is discussed. In section III core HVDC technologies and power system stability is
Analysis of Different Power Grid Segmentation and Transmission Schemes for Power System
Security Improvement1 2 3U. T. Shami , R. Naeem , M. S. Chaudhary
1,2,3Electrical Engineering Department, UET Lahore, [email protected]
Technical Journal, University of Engineering and Technology (UET) Taxila, Pakistan Vol. 20 No. I-2015

provide reactive power compensation automatically and improve voltage stability by providing commutation voltage.
C. VSC-HVDC technologyVSC stands for voltage source convertors. This
technology is also known as HVDC LIGHT or HVDC PLUS. In this technology, self commutated IGBTs are used for switching purpose. Reactive power is not consumed by VSC-HVDC convertors. They improve voltage regulation of AC system and can be used as a source of balanced three phase voltage. There is no commutation problem in this technology. The authors in [iii-iv] have done detailed comparison of LCC and VSC convertors.
3.2 Power system stabilityStability of a power system is divided into three
categories; Rotor angle, Voltage and frequency stability. Rotor angle stability gives idea about synchronism of synchronous machines after a disturbance in the power system. A power system is voltage and frequency stable if all of its buses maintain the steady state voltage and frequency respectively after a disturbance [xv]. In this paper the first two categories of stability are considered while speed of the generator is considered to study the frequency stability. The rotor angle studied in this paper is relative to the swing bus.
IV. SYSTEM UNDER STUDY
Three cases are studied in this paper. In all of the cases, all of the generators, along with their exciters and turbine governors, use built-in models of the software.
Case 1In this case the system shown in Fig. 1 is used as a
test case provided by NTDC (National Transmission and Dispatch Company) limited Pakistan. It is a two-area four machine network. Bus 12 and 25 are the swing buses. Three scenarios are studied; Scenario A: Area 1
is shown to be more stable than that containing only the AC links [xiv].
The research work presented in this paper is divided into four cases. In the first case, a comparison between LCC, VSC and AC segmentation schemes is made for a two area network. This network is not a hybrid HVDC-HVAC network as in [xii]. Second case investigates whether it is better to segment a power grid by VSC links only or segment it by VSC links in parallel with an AC link. The third case involves the study of the effect of increasing the number of HVDC-segmented areas on the stability of the overall system. The fourth case involves study of three possible connection topologies of grid segmentation using VSC links. LCC and VSC links refer to HVDC transmission lines based on LCC and VSC convertor technologies respectively. All the simulations were carried out in PSS®E software provided by SIEMENS.
III. CORE HVDC TECHNOLOGIES AND
POWER SYSTEM STABILITY
3.1 Core HVDC technologiesThe different HVDC technologies present are:a) LCC / CSC (Classical) HVDCb) CCC-HVDCc) VSC-HVDC/ HVDC PLUS/ HVDC LIGHT
A. LCC- HVDC technologyLCC stands for line commutated current source
convertor. This technology is also called CSC or classical HVDC. In this technology, thyristors are used for switching purpose. The switching circuit consists of three phase full wave bridge. A strong synchronous voltage source is required for commutation [ii].
B. CCC- HVDC technologyCCC stands for capacitor commutated convertors.
In this technology, series capacitors are connected between valves (built up with thyristor modules connected in series) and convertor transformers. They
40
Technical Journal, University of Engineering and Technology (UET) Taxila, Pakistan Vol. 20 No. I-2015
Fig. 1. Two-area four machine network under study for case 1 and case 2
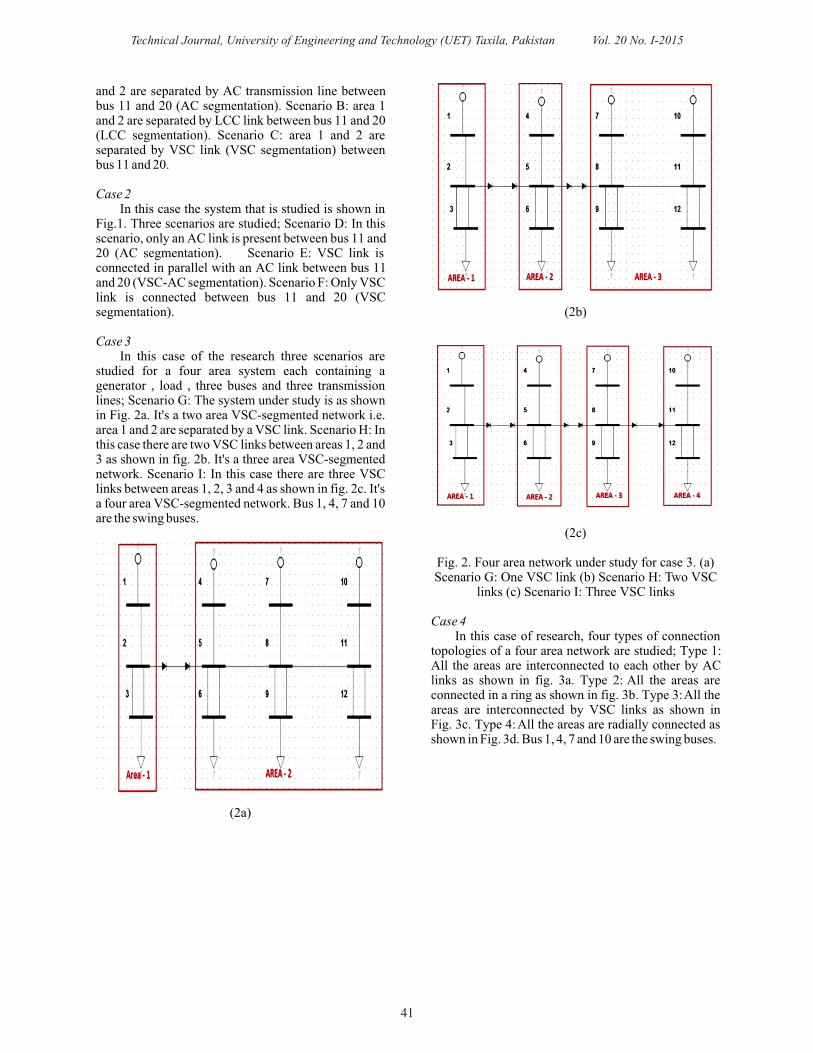
(2b)
(2c)
Fig. 2. Four area network under study for case 3. (a) Scenario G: One VSC link (b) Scenario H: Two VSC
links (c) Scenario I: Three VSC links
Case 4In this case of research, four types of connection
topologies of a four area network are studied; Type 1: All the areas are interconnected to each other by AC links as shown in fig. 3a. Type 2: All the areas are connected in a ring as shown in fig. 3b. Type 3: All the areas are interconnected by VSC links as shown in Fig. 3c. Type 4: All the areas are radially connected as shown in Fig. 3d. Bus 1, 4, 7 and 10 are the swing buses.
and 2 are separated by AC transmission line between bus 11 and 20 (AC segmentation). Scenario B: area 1 and 2 are separated by LCC link between bus 11 and 20 (LCC segmentation). Scenario C: area 1 and 2 are separated by VSC link (VSC segmentation) between bus 11 and 20.
Case 2In this case the system that is studied is shown in
Fig.1. Three scenarios are studied; Scenario D: In this scenario, only an AC link is present between bus 11 and 20 (AC segmentation). Scenario E: VSC link is connected in parallel with an AC link between bus 11 and 20 (VSC-AC segmentation). Scenario F: Only VSC link is connected between bus 11 and 20 (VSC segmentation).
Case 3In this case of the research three scenarios are
studied for a four area system each containing a generator , load , three buses and three transmission lines; Scenario G: The system under study is as shown in Fig. 2a. It's a two area VSC-segmented network i.e. area 1 and 2 are separated by a VSC link. Scenario H: In this case there are two VSC links between areas 1, 2 and 3 as shown in fig. 2b. It's a three area VSC-segmented network. Scenario I: In this case there are three VSC links between areas 1, 2, 3 and 4 as shown in fig. 2c. It's a four area VSC-segmented network. Bus 1, 4, 7 and 10 are the swing buses.
(2a)
41
Technical Journal, University of Engineering and Technology (UET) Taxila, Pakistan Vol. 20 No. I-2015
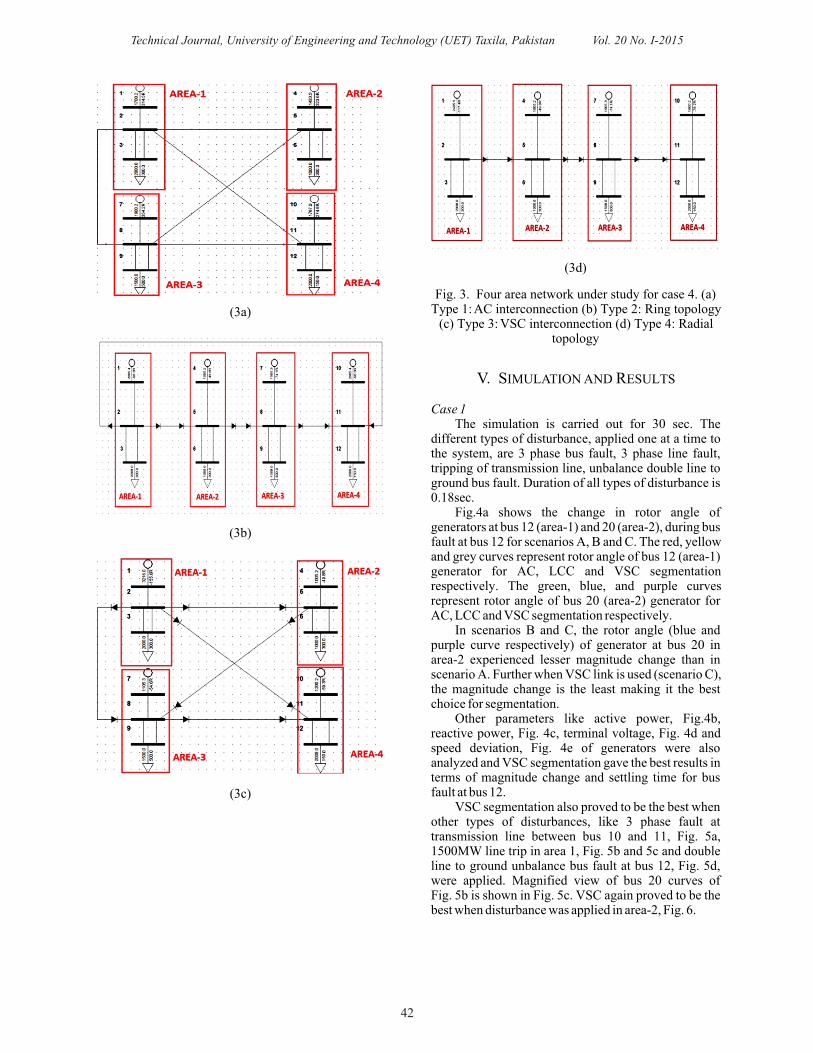
(3d)
Fig. 3. Four area network under study for case 4. (a) Type 1: AC interconnection (b) Type 2: Ring topology
(c) Type 3: VSC interconnection (d) Type 4: Radial topology
V. SIMULATION AND RESULTS
Case 1The simulation is carried out for 30 sec. The
different types of disturbance, applied one at a time to the system, are 3 phase bus fault, 3 phase line fault, tripping of transmission line, unbalance double line to ground bus fault. Duration of all types of disturbance is 0.18sec.
Fig.4a shows the change in rotor angle of generators at bus 12 (area-1) and 20 (area-2), during bus fault at bus 12 for scenarios A, B and C. The red, yellow and grey curves represent rotor angle of bus 12 (area-1) generator for AC, LCC and VSC segmentation respectively. The green, blue, and purple curves represent rotor angle of bus 20 (area-2) generator for AC, LCC and VSC segmentation respectively.
In scenarios B and C, the rotor angle (blue and purple curve respectively) of generator at bus 20 in area-2 experienced lesser magnitude change than in scenario A. Further when VSC link is used (scenario C), the magnitude change is the least making it the best choice for segmentation.
Other parameters like active power, Fig.4b, reactive power, Fig. 4c, terminal voltage, Fig. 4d and speed deviation, Fig. 4e of generators were also analyzed and VSC segmentation gave the best results in terms of magnitude change and settling time for bus fault at bus 12.
VSC segmentation also proved to be the best when other types of disturbances, like 3 phase fault at transmission line between bus 10 and 11, Fig. 5a, 1500MW line trip in area 1, Fig. 5b and 5c and double line to ground unbalance bus fault at bus 12, Fig. 5d, were applied. Magnified view of bus 20 curves of Fig. 5b is shown in Fig. 5c. VSC again proved to be the best when disturbance was applied in area-2, Fig. 6.
(3a)
(3b)
(3c)
42
Technical Journal, University of Engineering and Technology (UET) Taxila, Pakistan Vol. 20 No. I-2015

(4d)
(4e)
Fig. 4. Plots of different parameters of generator under study for scenarios A, B and C. (a) Rotor angle
(b) Active power (c) Reactive Power (d) Terminal voltage (e) Speed deviation
(5a)
(4a)
(4b)
(4c)
43
Technical Journal, University of Engineering and Technology (UET) Taxila, Pakistan Vol. 20 No. I-2015
700
600
500
400
300
200
100
0
Ro
tor
An
gle
(D
EG
RE
ES
)
0 5 10 15 20 25 30 35Time (seconds)
50
40
30
20
10
0
Act
ive
Po
wer
(p
u)
0 5 10 15 20 25 30 35Time (seconds)
80
70
60
50
40
30
20
10
0
-10
-20
Rea
ctiv
e P
ow
er (
pu
)
0 5 10 15 20 25 30 35Time (seconds)
40 45 50
1.1
1
0.9
0.8
0.7
0.6
0.5
0.4
0.3
0.2
Ter
min
al
vo
lta
ge
(pu
)
0 5 10 15 20 25 30 35Time (seconds)
0.02
0.018
0.015
0.013
0.01
0.008
0.005
0.002
0
-0.003
-0.005
Sp
eed
Dev
iati
on
(p
u)
0 5 10 15 20 25 30 35Time (seconds)
700
600
500
400
300
200
100
0
Ro
tor
an
gle
(D
egre
es)
0 5 10 15 20 25 30 35Time (seconds)

Fig. 6. Rotor angle plot for bus fault at bus 25 in area 2.
The results in case 1 clearly show that DC links (VSC or LCC) were able to minimize the propagation of disturbance from area-1 to area-2 and vice versa hence providing more stability to the overall network. Results also show that VSC is better than LCC for segmentation.
Case 2The disturbance applied is 3 phase bus fault at
bus 1. Duration of fault is 0.18sec. Simulation results are shown in Fig. 7a-7e. Each plot represents different parameters of bus 20 generator. In each plot the red, Green and yellow curves represent scenarios D, E and F respectively.
(7a)
(5b)
(5c)
(5d)
Fig. 5. Rotor angle plot for different types of disturbances (a) Line fault (b) 1500MW Line trip (c) Magnified view of Fig. 5b (d) unbalance double line
to ground fault
44
Technical Journal, University of Engineering and Technology (UET) Taxila, Pakistan Vol. 20 No. I-2015
4,000
3,500
3,000
2,500
2,000
1,500
1,000
500
0
-500
Ro
tor
An
gle
(D
egre
es)
0 5 10 15 20 25 30 35Time (seconds)
34
33
32
31
30
29
28
27
26
Ro
tor
An
gle
(D
egre
es)
0 5 10 15 20 25 30 35Time (seconds)
450
400
350
300
250
200
150
100
50
0
Ro
tor
An
gle
(D
egre
es)
0 5 10 15 20 25 30 35Time (seconds)
700
600
500
400
300
200
100
0
-100
-200
Ro
tor
An
gle
(D
egre
es)
0 5 10 15 20 25 30 35Time (seconds)
350
300
250
200
150
100
50
0
RO
TO
R A
NG
LE
(D
EG
RE
ES
)
0 5 10 15 20 25 30 35Time (seconds)

(7e)
Fig. 7. Plots of different parameters of bus 20 generator under study for scenarios D, E and F. (a)
Rotor angle (b) Active power (c) Reactive Power (d) Terminal voltage (e) Speed deviation
In Fig. 7a, the magnitude change of rotor angle is lowest for scenario F (VSC segmentation) and highest for scenario D (AC segmentation).
In Fig. 7b the magnitude change and settling time of generated power is highest in scenario D and least in scenario F. Same is the case in Fig. 7c. Here the yellow curve is almost straight. In Fig.7d the drop in generator terminal voltage magnitude and settling time is highest in scenario D while in scenario F there is no significant drop. In Fig. 7e generator speed deviation is highest in scenario D and lowest in scenario F.
Hence it can be concluded that the overall system is more stable during a fault when only VSC technology is used for system segmentation. Performance of AC segmented and VSC-AC segmented systems during a fault are almost the same as shown by the red and green curves in each plot from Fig. 7(a-e).
Case 3A three phase bus fault is applied at bus 10 for 0.18
sec. Simulation results are shown in Fig. 8-11. In Fig. 8-11 the red, green, yellow and blue curves represent parameters of generator at bus 10, 7, 4 and 1 respectively.
(8a)
(7b)
(7c)
(7d)
45
Technical Journal, University of Engineering and Technology (UET) Taxila, Pakistan Vol. 20 No. I-2015
55
50
45
40
35
30
AC
TIV
E
PO
WE
R (
pu
)
0 5 10 15 20 25 30 35Time (seconds)
50
40
30
20
10
0
AC
TIV
E
PO
WE
R (
pu
)
0 5 10 15 20 25 30 35Time (seconds)
1.1
1.05
1
0.95
0.9
0.85
0.8
TE
RM
INA
L V
OL
TA
GE
(p
u)
0 5 10 15 20 25 30 35Time (seconds)
0.01
0.008
0.005
0.002
0
-0.003SP
EE
D D
EV
IAT
ION
(p
u)
0 5 10 15 20 25 30 35Time (seconds)
700
600
500
400
300
200
100
0
RO
TO
R A
NG
LE
(D
EG
RE
ES
)
0 5 10 15 20 25 30 35Time (seconds)
40

well like generator active power (Fig. 10a-10c) and speed deviation (Fig.11a-11c) as well. Hence it is concluded that having large number of DC segmented areas improves overall system stability.
(9a)
(9b)
(9c)
Fig. 9. Terminal voltage plots for different scenarios of case 3 (a) Scenario G: two area VSC-segmented network (b) Scenario H: three area VSC-segmented network (c) Scenario I: four area VSC-segmented
network
(8b)
(8c)
Fig. 8. Rotor angle plots for different scenarios of case 3 (a) Scenario G: two area VSC-segmented
network (b) Scenario H: three area VSC-segmented network (c) Scenario I: four area VSC-segmented
network
Fig. 8 (a), (b) and (c) shows the rotor angle of generator for scenarios G, H and I respectively. Rotor angle change at bus 1 (area 1) improves from about max 100 degrees in scenario G (two area VSC-segmented network) to 0 degrees in scenarios H (three area VSC-segmented network) and I(four area VSC-segmented network). Similarly rotor angle change at bus 4 (area 2) improves from about max 700 degrees in scenario G to max 200 degrees in scenario H and finally to 0 degrees in scenario I. Rotor angle change at bus 7 (area 3) also experience the same trend. Whereas rotor angle change at bus 10 (area 4) remains almost the same for all the scenarios.
Fig. 9(a), (b) and (c) shows the magnitude of terminal voltage of generator for scenarios G, H and I respectively. Terminal voltage drop at bus 1 is 0 volts in scenario G and remains 0 in scenarios H and I. Terminal voltage drop at bus 4 improves from 0.956 degrees in scenarios G to 0 degrees in scenarios H and I. Similarly terminal voltage drop at bus 7 improves from 0.963 degrees in scenarios G to 0 degrees in scenarios I. Scenario I showed best result for other parameters as
46
Technical Journal, University of Engineering and Technology (UET) Taxila, Pakistan Vol. 20 No. I-2015
800
700
600
500
400
300
200
100
0
RO
TO
R A
NG
LE
(D
EG
RE
ES
)
0 5 10 15 20 25 30 35Time (seconds)
40
700
600
500
400
300
200
100
0RO
TO
R A
NG
LE
(D
EG
RE
ES
)
0 5 10 15 20 25 30 35Time (seconds)
40
1
.75
0.5
.25
0
0 5 10 15 20 25 30 35Time (seconds)
40
1
.75
0.5
.25
0
0 5 10 15 20 25 30 35Time (seconds)
40
1
.75
0.5
.25
0
0 5 10 15 20 25 30 35Time (seconds)
40

(11a)
(11b)
(11c)
Fig. 11. Generator Speed deviation plots for different scenarios of case 3 (a) Scenario G: two area VSC-
segmented network (b) Scenario H: three area VSC-segmented network (c) Scenario I: four area VSC-
segmented network
(10a)
(10b)
(10c)
Fig. 10 Active Power plots for different scenarios of case 3 (a) Scenario G: two area VSC-segmented
network (b) Scenario H: three area VSC-segmented network (c) Scenario I: four area VSC-segmented
network
47
Technical Journal, University of Engineering and Technology (UET) Taxila, Pakistan Vol. 20 No. I-2015
25
20
15
10
5
0
Act
ive
Po
wer
(p
u)
0 5 10 15 20 25 30 35Time (seconds)
40
25
20
15
10
5
0
Act
ive
Po
wer
(p
u)
0 5 10 15 20 25 30 35Time (seconds)
40
25
20
15
10
5
0
Act
ive
Po
wer
(p
u)
0 5 10 15 20 25 30 35Time (seconds)
40
0.015
0.013
0.01
0.007
0.005
0.002
0
-0.003
SP
EE
D D
EV
IAT
ION
(p
u)
0 5 10 15 20 25 30 35Time (seconds)
40
0.015
0.013
0.01
0.007
0.005
0.002
0
-0.003
-0.005
SP
EE
D D
EV
IAT
ION
(p
u)
0 5 10 15 20 25 30 35Time (seconds)
40
0.013
0.01
0.007
0.005
0.002
0
-0.003
SP
EE
D D
EV
IAT
ION
(p
u)
0 5 10 15 20 25 30 35Time (seconds)
40 45 5

(12d)
Fig. 12. Rotor angle plots for different connection types (a) Type 1: AC interconnection (b) Type 2: Ring topology (c) Type 3: VSC interconnection (d) Type 4:
Radial topology
Fig. 12a represents rotor angle of generators for connection type 1 and shows that all the areas experience rotor angle change following a disturbance. Fig. 12b represents rotor angle for connection type 2 and shows that area 3 rotor angle (yellow curve) change is negligible while area 2 (green curve) and 4 (blue curve) experience change. Fig. 12c represents rotor angle for connection type 3 and shows that all the areas experience rotor angle change but less than the one they experienced in type 1 connection.
Fig. 12d represents rotor angle for connection type 4 and shows that area 3 and 4 under goes negligible rotor angle change.
Area 4 is affected in type 2 connection because it is directly attached to the area, where fault occurred, through VSC link while in type 4 connection it is indirectly attached to fault area 1 and hence remained unaffected. Similarly all the areas in type 3 connection is affected because of their direct connection with the fault area 1 through VSC links.
This research shows that type 4 connection (radial) is the best as more number of areas is stable. Further, areas farther away from fault area are more stable. Also this type of connection uses minimum number of VSC links as compared to type 3 and type 4 connection and hence reduction in the overall system cost.
VI. CONCLUSIONS
In this paper, the concept of grid segmentation was thoroughly explored in four cases. Case 1 concludes that HVDC segmentation acts as a firewall by minimizing the propagation of disturbance to healthy areas of the power network. In this case it is also concluded that Voltage source convertor (VSC) technology, when used alone, is better than the line commutated convertor (LCC) technology for grid
Case 4A three phase bus fault is applied at bus 1 (area 1)
for 0.18 sec. Simulation results are shown in Fig.12(a-d). The red, green, yellow and blue curves represent rotor angle of generator at bus 1, 4, 7 and 10 respectively.
(12a)
(12b)
(12c)
48
Technical Journal, University of Engineering and Technology (UET) Taxila, Pakistan Vol. 20 No. I-2015
800
700
600
500
400
300
200
100
0
RO
TO
R A
NG
LE
(D
EG
RE
ES
)
0 5 10 15 20 25 30 35Time (seconds)
800
700
600
500
400
300
200
100
0
-100
-200
RO
TO
R A
NG
LE
(D
EG
RE
ES
)
0 5 10 15 20 25 30 35Time (seconds)
1,250
1,000
750
500
250
0
-250
RO
TO
R A
NG
LE
(D
EG
RE
ES
)
0 5 10 15 20 25 30 35Time (seconds)
1,000
750
500
250
0
-250
RO
TO
R A
NG
LE
(D
EG
RE
ES
)
0 5 10 15 20 25 30 35Time (seconds)

[viii] Dennis Woodford . (2008, October) . Segmentation A Solution for the Future. Manitoba HVDC Research Centre. [Online].Available:https://hvdc.ca/uploads/ck/files/newsletters/Pulse_Oct2020.pdf
[ix] J. Pan, R. Nuqui, K. Srivastava, T. Jonsson, P. Holmberg and Y.-J. Hafner, “AC grid with embedded VSCHVDC for secure and efficient power delivery,” in IEEE Energy 2030 Conf., Atlanta, GA, 2008, pp. 1 6 .
[x] O. A. Mousavi, L. Bizumic and R. Cherkaoui, “Assessment of HVDC Grid Segmentation for Reducing the Risk of Cascading Outages and Blackouts,” in Bulk Power Systems Dynamics and Control-IX (IREP), Rethymnon, Greece, 2013, pp. 1- 10.
[xi] Lennart Carlsson. (2008, Sep.). HVDC: A firewall against disturbances in high-voltage grids. ABB Review3/2005. [online]. 3, pp. 42-46 Available:http://www05.abb.com/global/scot/scot221.nsf/veritydisplay/3bf9df6237c1f988c12574880039eaff/$file/HVDC%20-%20a%20firewall %20against%20disturbance%20in%20HV%20grids.pdf
[xii] L. C. Azimoh, K. Folly, SP Chowdhury, S. Chowdhury and A. Haddad, “Investigation of voltage and transient stability of HVAC network in hybrid with VSC-HVDC and HVDC Link,” in 45th International UPEC conf., Cardiff, Wales, 2010, pp. 1-6.
[xiii] X. H. Fang and J. H. Chow, “BTB DC link modeling, control, and application in the segmentation of AC interconnections,” in IEEE Power & Energy Society General Meeting (PES), Calgary, AB, 2009, pp. 1-7 .
[xiv] R. G. Roshanagh, S.N. Ravadanegh, “A way to evaluate segmentation: An examination of AC line elimination in a parallel AC/DC transmission system,” in 21st ICEE conf., Mashhad, 2013, pp. 1-4.
[xv] P. Kundur , J. Paserba , V. Ajjarapu , G. Andersson , A. Bose , C. Canizares , N. Hatziargyriou , D. Hill , A. Stankovic , C. Taylor, T. V. Cutsem and V. Vittal, “Definition and classification of power system stability: IEEE/CIGRE joint task force on stability terms and definitions,” IEEE Trans. Power Syst., vol. 19, no. 3, pp. 1387 - 1401, May 2004.
segmentation. In case 2 it is shown that VSC grid segmentation is better than VSC-AC segmentation. Case 3 concludes that having large number of HVDC segmented areas improves overall system stability. Case 4 of the research concludes that radial VSC connection is more suitable than ring and interconnected connection as it improves overall system stability. The segmentation concept is relatively new. Some areas like its implementation from economic point of view, finding out suitable location for installing HVDC links and application of this concept in detailed models of power system should be considered in future study.
REFERENCES
[i] M. H. Okba, M. H. Saied, M. Z. Mostafa and T. M. Abdel- Moneim, “High Voltage Direct Current Transmission - A Review, Part I,” in IEEE Energytech, Cleveland, OH, 2012, pp. 1-7.
[ii] M. P. Bahrman and B. K. Johnson, “The ABCs of HVDC transmission technologies,” IEEE Power Energy Mag., vol. 5, no. 2, pp. 32 - 44, Mar. 2007.
[iii] J. Setreus and L. Bertling, “Introduction to HVDC technology for reliable electrical power systems,” in 10th Int. Conf. Probabilistic Methods Applied to Power Systems, Rincon, 2008, pp. 1- 8.
[iv] M. H. Okba, M. H. Saied, M. Z. Mostafa and T. M. Abdel- Moneim, “High Volt ag e Di re ct Current Transmission - A Review, Part II - Converter Technologies,” in IEEE Energytech, Cleveland, OH, 2012, pp. 1-7
[v] G. C. Loehr. (2007, Jan). Enhancing the grid, smaller can be better. Energybiz Mag. [online]. 4(1), pp. 35-36. Available:Http://www.nxtbook.com/nxtbooks/energycentral/energybiz0107.
[vi] H. Clark, A.-A. Edris, M. M. El-Gasseir, K. Epp, A. Isaacs and D. Woodford, “Softening the blow of disturbances,” IEEE Power Energy Mag., vol. 6, no. 1, pp. 30 - 41, Jan. 2008.
[vii] H. K. Clark, M. M. El-Gasseir, H. D. K. Epp and A. A. Edris, “The application of segmentation and grid shock absorber concept for reliable power grids,” in 12th Int. Middle-East Power System Conf., Aswan, 2008, pp. 34-38.
49
Technical Journal, University of Engineering and Technology (UET) Taxila, Pakistan Vol. 20 No. I-2015