Embed Size (px)
Citation preview
INTERNATIONAL JOURNAL OF GEOMATICS AND GEOSCIENCES
Volume 2, No 4, 2012
© Copyright 2010 All rights reserved Integrated Publishing services
Research article ISSN 0976 – 4380
Submitted on March 2012 published on May 2012 995
Analysis of drainage morphometry and watershed prioritization in Bandu
Watershed, Purulia, West Bengal through Remote Sensing and GIS
technology - A case study
Ajoy Das1, Milan Mondal
2, Bhaskar Das
3, Asim Ratan Ghosh
4
1- Junior Research Fellow, West Bengal State Council of Science and Technology (DST),
Govt. of West Bengal
2- Senior Research Fellow, The University of Burdwan, Burdwan-713104
3- Senior Research Fellow, West Bengal State Council of Science and Technology (DST),
Govt. of West Bengal
4- Senior Scientist, West Bengal State Council of Science and Technology (DST),Govt. of
West Bengal
ABSTRACT
The study area, Bandu watershed of Purulia District extends from 23o 20’ N to 23
o 47’ N’ and
86o 0’ E to 86
o 30’ E. The study area is under the upper catchment of Kasai river, Purulia
district is a drought prone district of the West Bengal. Inspite of considerable amount of
rainfall, due to heavy runoff the main problem of this area is scarcity of water as well as soil
erosion. It has been accepted that for sustainable rural livelihood water and soil conservation
is a must. The most suitable way to achieve this is micro-watershed development. But there is
an acute shortage of technical manpower to handle such a huge volume of survey related
work. For that reason, application of Remote Sensing and GIS has become a necessity.
Moreover since fund is limited, watershed prioritization is highly required.
Key words: Watershed prioritization, Morphometric analysis, Micro-watershed, RS, GIS
1. Introduction
In the present study various thematic maps viz. Geomorphological Map, Drainage, Watershed
and Surface Waterbody Map, Landuse/ landcover Map, Transport and Settlement Map, Soil
Map, Slope Map have been prepared. These maps have been used for prioritization of mini-
watersheds through morphometric analysis, generally the criteria for watershed prioritization
are subjective in nature and difficult to implement in ground reality due to various reasons.
Some objective criteria are also available for watershed prioritization viz. Sediment Yield
Index. In the present study another objective approach has been attempted which is based on
morphometric analysis of drainage system and shape-size of their micro-watersheds.
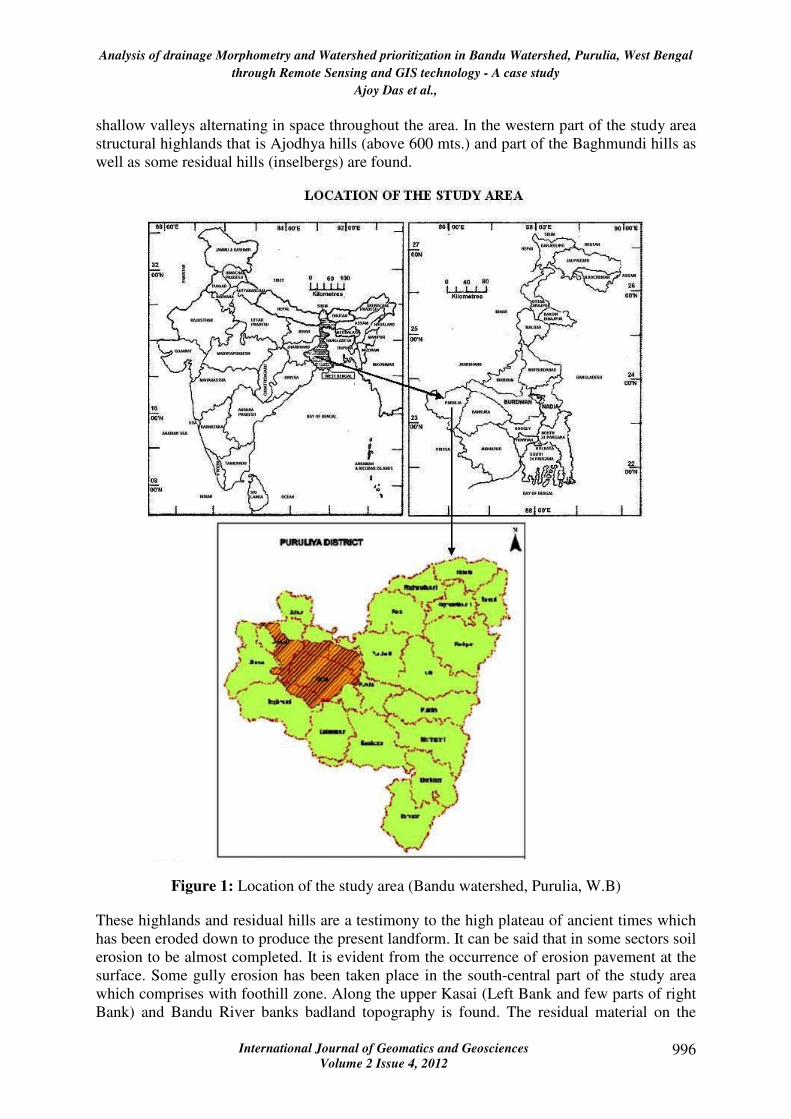
The study area, Bandu watershed (geographical area: 648.24 sq.km) is lying between
23o20'00"N to 23
o47'00"N and 86
o0'00"E to 86
o30'00"E, Jhalda-II, Arsha and Baghmundi and
Jaipur block of Purulia district. Purulia district is a drought prone district of West Bengal.
The main problem of this area is scarcity of water as well as soil erosion (Figure 1).
1.1 Geomorphology
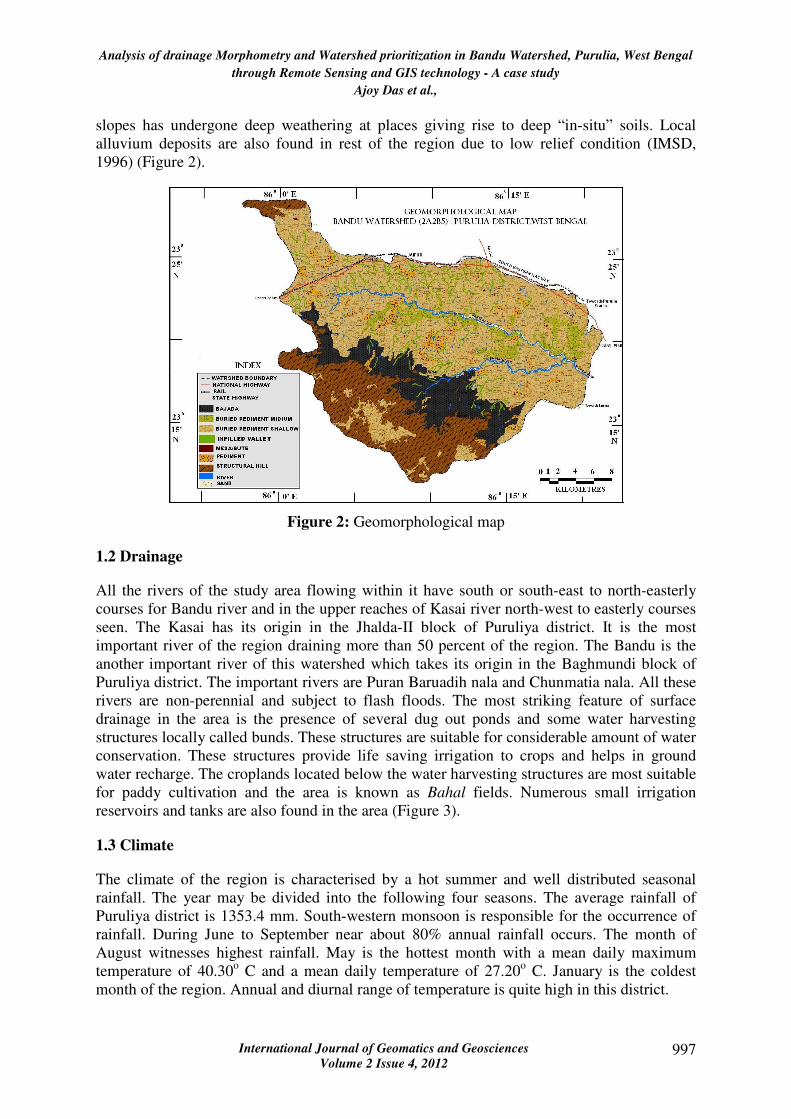
The Puruliya district of West Bengal presents a thoroughly pene-planated surface. The study
area is composed of slightly elevated nearly level to moderately sloping tracts of uplands and
Analysis of drainage Morphometry and Watershed prioritization in Bandu Watershed, Purulia, West Bengal
through Remote Sensing and GIS technology - A case study
Ajoy Das et al.,
International Journal of Geomatics and Geosciences
Volume 2 Issue 4, 2012 996
shallow valleys alternating in space throughout the area. In the western part of the study area
structural highlands that is Ajodhya hills (above 600 mts.) and part of the Baghmundi hills as
well as some residual hills (inselbergs) are found.
Figure 1: Location of the study area (Bandu watershed, Purulia, W.B)
These highlands and residual hills are a testimony to the high plateau of ancient times which
has been eroded down to produce the present landform. It can be said that in some sectors soil
erosion to be almost completed. It is evident from the occurrence of erosion pavement at the
surface. Some gully erosion has been taken place in the south-central part of the study area
which comprises with foothill zone. Along the upper Kasai (Left Bank and few parts of right
Bank) and Bandu River banks badland topography is found. The residual material on the
Analysis of drainage Morphometry and Watershed prioritization in Bandu Watershed, Purulia, West Bengal
through Remote Sensing and GIS technology - A case study
Ajoy Das et al.,
International Journal of Geomatics and Geosciences
Volume 2 Issue 4, 2012 997
slopes has undergone deep weathering at places giving rise to deep “in-situ” soils. Local
alluvium deposits are also found in rest of the region due to low relief condition (IMSD,
1996) (Figure 2).
Figure 2: Geomorphological map
1.2 Drainage
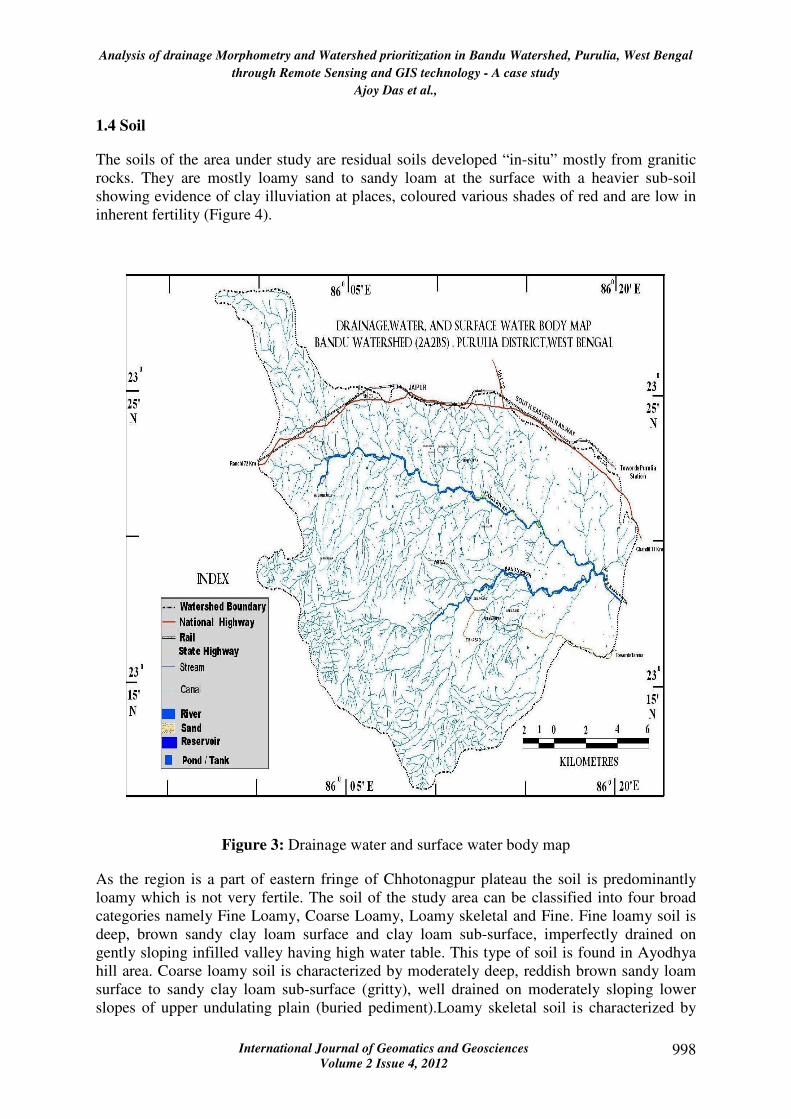
All the rivers of the study area flowing within it have south or south-east to north-easterly
courses for Bandu river and in the upper reaches of Kasai river north-west to easterly courses
seen. The Kasai has its origin in the Jhalda-II block of Puruliya district. It is the most
important river of the region draining more than 50 percent of the region. The Bandu is the
another important river of this watershed which takes its origin in the Baghmundi block of
Puruliya district. The important rivers are Puran Baruadih nala and Chunmatia nala. All these
rivers are non-perennial and subject to flash floods. The most striking feature of surface
drainage in the area is the presence of several dug out ponds and some water harvesting
structures locally called bunds. These structures are suitable for considerable amount of water
conservation. These structures provide life saving irrigation to crops and helps in ground
water recharge. The croplands located below the water harvesting structures are most suitable
for paddy cultivation and the area is known as Bahal fields. Numerous small irrigation
reservoirs and tanks are also found in the area (Figure 3).
1.3 Climate
The climate of the region is characterised by a hot summer and well distributed seasonal
rainfall. The year may be divided into the following four seasons. The average rainfall of
Puruliya district is 1353.4 mm. South-western monsoon is responsible for the occurrence of
rainfall. During June to September near about 80% annual rainfall occurs. The month of
August witnesses highest rainfall. May is the hottest month with a mean daily maximum
temperature of 40.30o C and a mean daily temperature of 27.20
o C. January is the coldest
month of the region. Annual and diurnal range of temperature is quite high in this district.
Analysis of drainage Morphometry and Watershed prioritization in Bandu Watershed, Purulia, West Bengal
through Remote Sensing and GIS technology - A case study
Ajoy Das et al.,
International Journal of Geomatics and Geosciences
Volume 2 Issue 4, 2012 998
1.4 Soil
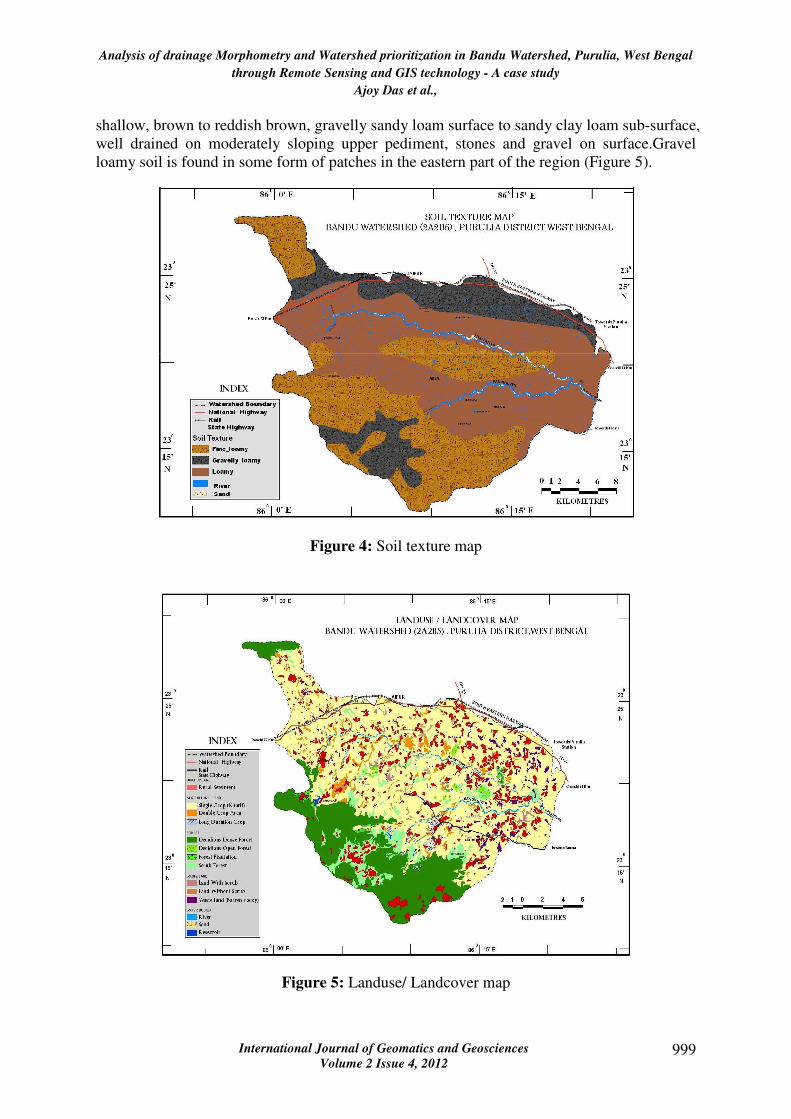
The soils of the area under study are residual soils developed “in-situ” mostly from granitic
rocks. They are mostly loamy sand to sandy loam at the surface with a heavier sub-soil
showing evidence of clay illuviation at places, coloured various shades of red and are low in
inherent fertility (Figure 4).
Figure 3: Drainage water and surface water body map
As the region is a part of eastern fringe of Chhotonagpur plateau the soil is predominantly
loamy which is not very fertile. The soil of the study area can be classified into four broad
categories namely Fine Loamy, Coarse Loamy, Loamy skeletal and Fine. Fine loamy soil is
deep, brown sandy clay loam surface and clay loam sub-surface, imperfectly drained on
gently sloping infilled valley having high water table. This type of soil is found in Ayodhya
hill area. Coarse loamy soil is characterized by moderately deep, reddish brown sandy loam
surface to sandy clay loam sub-surface (gritty), well drained on moderately sloping lower
slopes of upper undulating plain (buried pediment).Loamy skeletal soil is characterized by
Analysis of drainage Morphometry and Watershed prioritization in Bandu Watershed, Purulia, West Bengal
through Remote Sensing and GIS technology - A case study
Ajoy Das et al.,
International Journal of Geomatics and Geosciences
Volume 2 Issue 4, 2012 999
shallow, brown to reddish brown, gravelly sandy loam surface to sandy clay loam sub-surface,
well drained on moderately sloping upper pediment, stones and gravel on surface.Gravel
loamy soil is found in some form of patches in the eastern part of the region (Figure 5).
Figure 4: Soil texture map
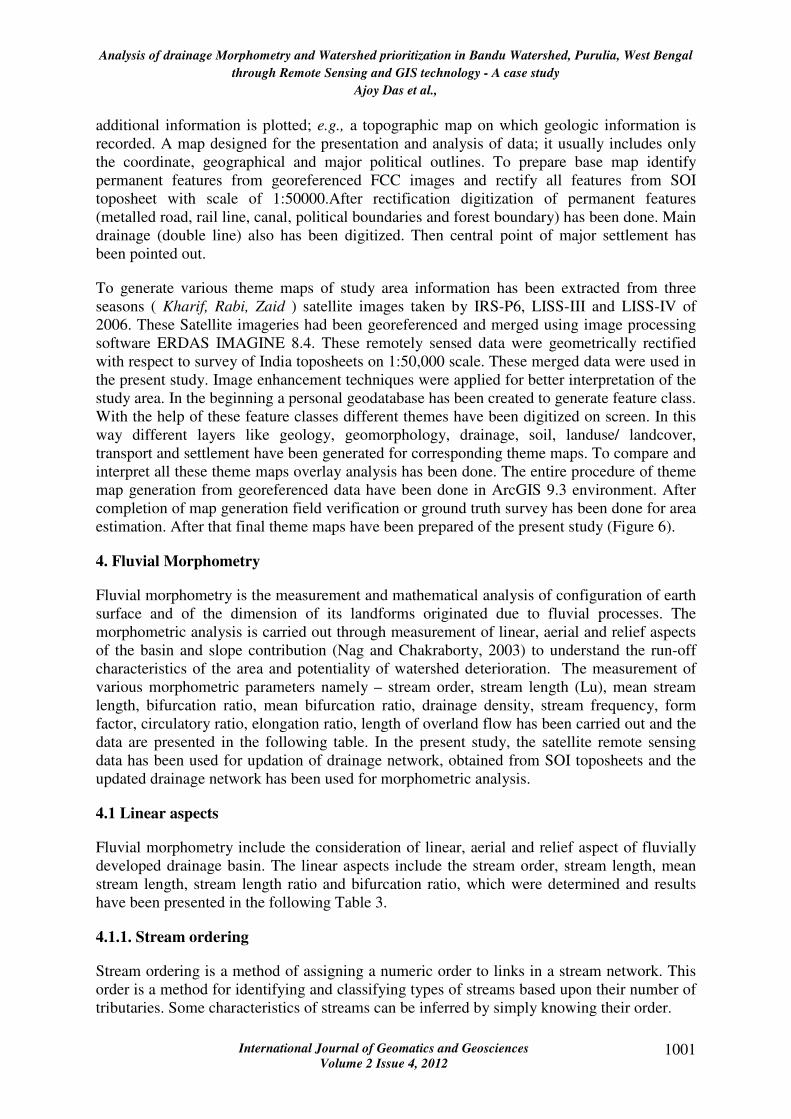
Figure 5: Landuse/ Landcover map

Analysis of drainage Morphometry and Watershed prioritization in Bandu Watershed, Purulia, West Bengal
through Remote Sensing and GIS technology - A case study
Ajoy Das et al.,
International Journal of Geomatics and Geosciences
Volume 2 Issue 4, 2012 1000
2. Objectives
The main objectives of this study are (i) prioritization of mini-watersheds through
morphometric analysis generation of relevant thematic maps for the aforesaid studies. It has
been accepted that for sustainable rural livelihood water and soil conservation is a must. The
most suitable way to achieve this is micro-watershed development. Since fund is limited,
watershed prioritization is highly required. Common Guidelines for Watershed Development
has identified some criteria for this purpose. Some of them are (a) not more than 30% of the
area should get assured irrigation, (b) acute drinking water crisis, (c) high SC/ST population,
Some objective criteria are also available for watershed prioritization viz. Sediment Yield
Index (SYI). In the present study another objective approach has been attempted which is
based on morphometric analysis of drainage system and shape-size of their micro-watersheds.
3. Methods
Remote sensing technique with visual interpretation approach was adopted for generation of
various thematic maps.
Figure 6: Flow chart showing methodology of thematic map generation
It involves interpretation of imagery by using image elements and correlating them with land
features such as lithology, landforms, vegetation cover, soil and drainage. To prepare
thematic map first of all base map has been generated. A base map is a map shows only
essential geographic references (such as rail, road, main drainage (double line) on which
Analysis of drainage Morphometry and Watershed prioritization in Bandu Watershed, Purulia, West Bengal
through Remote Sensing and GIS technology - A case study
Ajoy Das et al.,
International Journal of Geomatics and Geosciences
Volume 2 Issue 4, 2012 1001
additional information is plotted; e.g., a topographic map on which geologic information is
recorded. A map designed for the presentation and analysis of data; it usually includes only
the coordinate, geographical and major political outlines. To prepare base map identify
permanent features from georeferenced FCC images and rectify all features from SOI
toposheet with scale of 1:50000.After rectification digitization of permanent features
(metalled road, rail line, canal, political boundaries and forest boundary) has been done. Main
drainage (double line) also has been digitized. Then central point of major settlement has
been pointed out.
To generate various theme maps of study area information has been extracted from three
seasons ( Kharif, Rabi, Zaid ) satellite images taken by IRS-P6, LISS-III and LISS-IV of
2006. These Satellite imageries had been georeferenced and merged using image processing
software ERDAS IMAGINE 8.4. These remotely sensed data were geometrically rectified
with respect to survey of India toposheets on 1:50,000 scale. These merged data were used in
the present study. Image enhancement techniques were applied for better interpretation of the
study area. In the beginning a personal geodatabase has been created to generate feature class.
With the help of these feature classes different themes have been digitized on screen. In this
way different layers like geology, geomorphology, drainage, soil, landuse/ landcover,
transport and settlement have been generated for corresponding theme maps. To compare and
interpret all these theme maps overlay analysis has been done. The entire procedure of theme
map generation from georeferenced data have been done in ArcGIS 9.3 environment. After
completion of map generation field verification or ground truth survey has been done for area
estimation. After that final theme maps have been prepared of the present study (Figure 6).
4. Fluvial Morphometry
Fluvial morphometry is the measurement and mathematical analysis of configuration of earth
surface and of the dimension of its landforms originated due to fluvial processes. The
morphometric analysis is carried out through measurement of linear, aerial and relief aspects
of the basin and slope contribution (Nag and Chakraborty, 2003) to understand the run-off
characteristics of the area and potentiality of watershed deterioration. The measurement of
various morphometric parameters namely – stream order, stream length (Lu), mean stream
length, bifurcation ratio, mean bifurcation ratio, drainage density, stream frequency, form
factor, circulatory ratio, elongation ratio, length of overland flow has been carried out and the
data are presented in the following table. In the present study, the satellite remote sensing
data has been used for updation of drainage network, obtained from SOI toposheets and the
updated drainage network has been used for morphometric analysis.
4.1 Linear aspects
Fluvial morphometry include the consideration of linear, aerial and relief aspect of fluvially
developed drainage basin. The linear aspects include the stream order, stream length, mean
stream length, stream length ratio and bifurcation ratio, which were determined and results
have been presented in the following Table 3.
4.1.1. Stream ordering
Stream ordering is a method of assigning a numeric order to links in a stream network. This
order is a method for identifying and classifying types of streams based upon their number of
tributaries. Some characteristics of streams can be inferred by simply knowing their order.
Analysis of drainage Morphometry and Watershed prioritization in Bandu Watershed, Purulia, West Bengal
through Remote Sensing and GIS technology - A case study
Ajoy Das et al.,
International Journal of Geomatics and Geosciences
Volume 2 Issue 4, 2012 1002
The designated stream order is the first step in the drainage basin analysis. In the present
study, ranking of streams has been carried out based on the method proposed by Strahler
(1964). It is noticed from the table that the maximum frequency is in the case of first order
streams. It is also observed that there is a decrease in stream frequency as the stream order
increases.
4.1.2. Stream length
Stream length is measured from mouth of a river to drainage divide.
4.1.3. Mean stream length
Mean Stream Length of a stream channel system is a dimension less property revealing the
characteristics of size of a component of drainage network and its contributing basin set.
Lu= ∑Lu/Nu
Where, ∑Lu= Total length of a order
Nu= No of stream of that order.
Mean stream length (Lsm) is a characteristic property related to the drainage network
components and its associated basin surfaces (Strahler, 1964). This has been calculated by
dividing the total stream length of order (u) by the number of streams of segments in the
order.
4.1.4. Stream length ratio
Stream length ratio (RL) is the ratio of the mean length of the one order to the next lower
order of the stream segments.
4.1.5. Bifurcation ratio
According to Schumn (1956), the term bifurcation ratio may be defined as the ratio of the
number of the stream segments of given order to the number of segments of the next higher
orders. Bifurcation ratio shows a small range of variation for different regions or for different
environments except where the powerful geological control dominates (Strahler, 1957).
Bifurcation Ratio (Rb): Gregory
Bifurcation ratio is defined as the ratio of the number of stream of a given order to the
number of stream to the next higher order which is expressed in terms of following equation-
Rb = Nu/ Nu+1
Where, Rb = Bifurcation Ratio.
Nu= Number of segments of a given order segment.
Nu+1=Number of segments of the next higher order.
It varies from 2 to 5. Rb is used to find out the degree of integration in drainage basin. Rb
depends on the slope, physiography, and climate. Aerial aspects include different
morphometric parameters, like drainage density, texture ratio, stream frequency, form factor,
Analysis of drainage Morphometry and Watershed prioritization in Bandu Watershed, Purulia, West Bengal
through Remote Sensing and GIS technology - A case study
Ajoy Das et al.,
International Journal of Geomatics and Geosciences
Volume 2 Issue 4, 2012 1003
circularity ratio, elongation ratio and length of the overland flow. The values of these
parameters are presented in the table and discussed and interpreted.
4.1.6. Drainage density
Drainage density is defined as the total length of streams of all orders per drainage area.
Density factor is related to climate, type of rocks, relief, infiltration capacity, vegetation
cover, surface roughness has no significant correlation with drainage density. The drainage
density indicates the closeness of spacing of channels (Horton, 1932). It may be considered as
one of the methods of measurement of basin area.
According to Horton, Drainage Density is defined ratio of total length of all stream segments
in a given drainage basin to the total area of that basin. It is expressed by a formula
DD = ∑L/A
Where, ∑L = Total length
A = Total area
The amount and type of precipitation influences directly to the quantity and characters of
surface run-off. An area with high precipitation such as thundershowers loses greater
percentage of rainfall in run-off resulting in more surface drainage lines. Amount of
vegetation and rainfall absorption capacity of soils, which influences the rate of surface run-
off, affects the drainage texture of an area. The similar condition of lithology and geologic
structures, semi-arid regions have finer drainage density texture than humid regions. Low
drainage density generally results in the areas of highly resistant or permeable sub-soil
material, sparse vegetation and mountainous relief. Low drainage density leads to coarse
drainage texture while drainage density leads to fine drainage texture.
4.1.7. Stream frequency/channel frequency
The total number of stream segments of all orders per unit area is known as stream frequency
(Horton, 1932). Hopefully, it is possible to have basins of same drainage density differing
stream frequency and basins of the same stream frequency differing in drainage density.
Stream Frequency is defined as the ratio between the number of stream segment per unit area
which expressed by a formula
DF= ∑N/A where, ∑N= Total no of stream segment; A= Unit area in km2 or m2
It is a technique which is also used in planning and development to identify land quality for
optimum utilization.
4.1.8. Drainage texture
Drainage texture is the total number of stream segments of all orders per perimeter of that
area (Horton, 1945). It is one of the important concepts of geomorphology which means that
the relative spacing of drainage lines. Drainage lines are numerous over impermeable areas
than permeable areas. According to Horton (1945), infiltration capacity as the single
important factors which influences drainage texture and considered drainage texture which
includes drainage density and stream frequency.
Analysis of drainage Morphometry and Watershed prioritization in Bandu Watershed, Purulia, West Bengal
through Remote Sensing and GIS technology - A case study
Ajoy Das et al.,
International Journal of Geomatics and Geosciences
Volume 2 Issue 4, 2012 1004
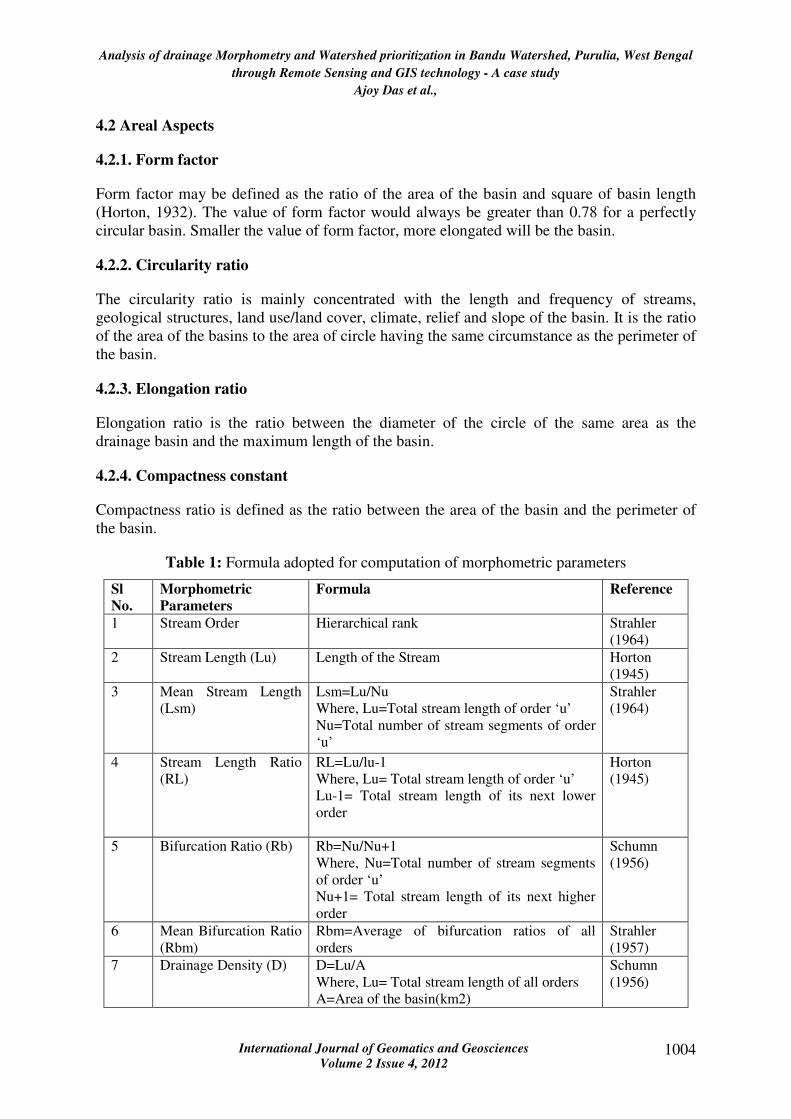
4.2 Areal Aspects
4.2.1. Form factor
Form factor may be defined as the ratio of the area of the basin and square of basin length
(Horton, 1932). The value of form factor would always be greater than 0.78 for a perfectly
circular basin. Smaller the value of form factor, more elongated will be the basin.
4.2.2. Circularity ratio
The circularity ratio is mainly concentrated with the length and frequency of streams,
geological structures, land use/land cover, climate, relief and slope of the basin. It is the ratio
of the area of the basins to the area of circle having the same circumstance as the perimeter of
the basin.
4.2.3. Elongation ratio
Elongation ratio is the ratio between the diameter of the circle of the same area as the
drainage basin and the maximum length of the basin.
4.2.4. Compactness constant
Compactness ratio is defined as the ratio between the area of the basin and the perimeter of
the basin.
Table 1: Formula adopted for computation of morphometric parameters
Sl
No.
Morphometric
Parameters
Formula Reference
1 Stream Order Hierarchical rank Strahler
(1964)
2 Stream Length (Lu) Length of the Stream Horton
(1945)
3 Mean Stream Length
(Lsm)
Lsm=Lu/Nu
Where, Lu=Total stream length of order ‘u’
Nu=Total number of stream segments of order
‘u’
Strahler
(1964)
4 Stream Length Ratio
(RL)
RL=Lu/lu-1
Where, Lu= Total stream length of order ‘u’
Lu-1= Total stream length of its next lower
order
Horton
(1945)
5 Bifurcation Ratio (Rb) Rb=Nu/Nu+1
Where, Nu=Total number of stream segments
of order ‘u’
Nu+1= Total stream length of its next higher
order
Schumn
(1956)
6 Mean Bifurcation Ratio
(Rbm)
Rbm=Average of bifurcation ratios of all
orders
Strahler
(1957)
7 Drainage Density (D) D=Lu/A
Where, Lu= Total stream length of all orders
A=Area of the basin(km2)
Schumn
(1956)
Analysis of drainage Morphometry and Watershed prioritization in Bandu Watershed, Purulia, West Bengal
through Remote Sensing and GIS technology - A case study
Ajoy Das et al.,
International Journal of Geomatics and Geosciences
Volume 2 Issue 4, 2012 1005
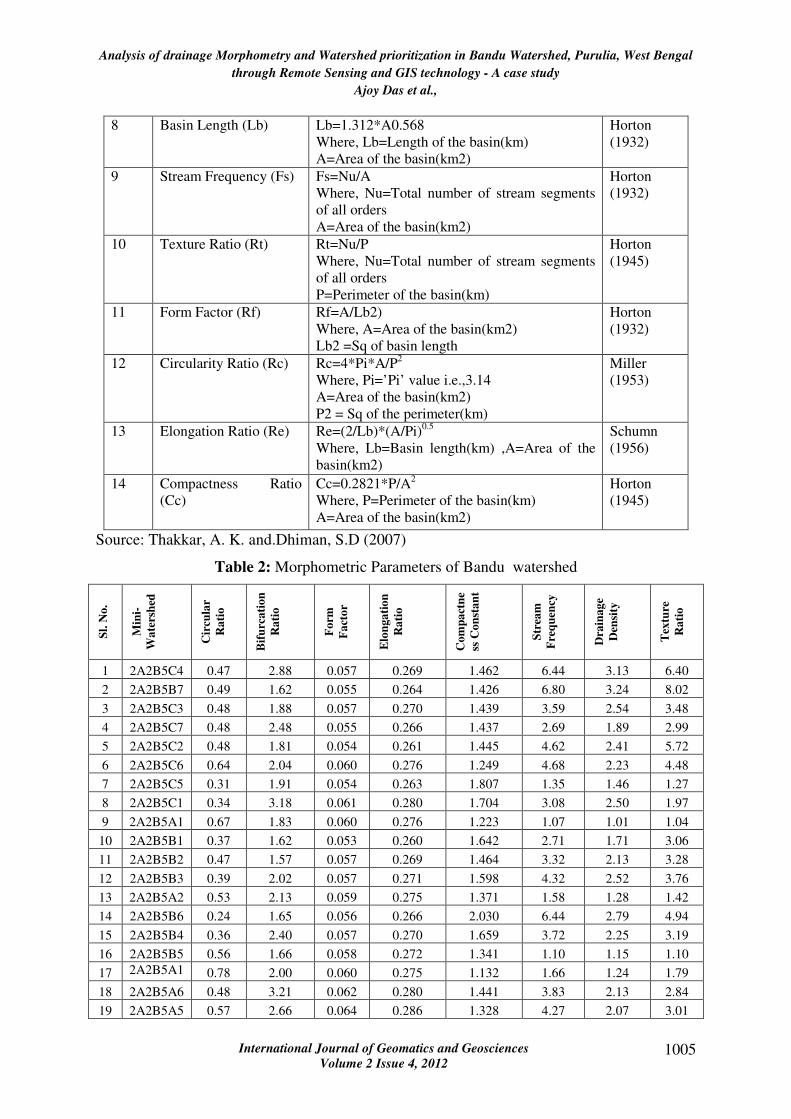
8 Basin Length (Lb) Lb=1.312*A0.568
Where, Lb=Length of the basin(km)
A=Area of the basin(km2)
Horton
(1932)
9 Stream Frequency (Fs) Fs=Nu/A
Where, Nu=Total number of stream segments
of all orders
A=Area of the basin(km2)
Horton
(1932)
10 Texture Ratio (Rt) Rt=Nu/P
Where, Nu=Total number of stream segments
of all orders
P=Perimeter of the basin(km)
Horton
(1945)
11 Form Factor (Rf) Rf=A/Lb2)
Where, A=Area of the basin(km2)
Lb2 =Sq of basin length
Horton
(1932)
12 Circularity Ratio (Rc) Rc=4*Pi*A/P2
Where, Pi=’Pi’ value i.e.,3.14
A=Area of the basin(km2)
P2 = Sq of the perimeter(km)
Miller
(1953)
13 Elongation Ratio (Re) Re=(2/Lb)*(A/Pi)0.5
Where, Lb=Basin length(km) ,A=Area of the
basin(km2)
Schumn
(1956)
14 Compactness Ratio
(Cc)
Cc=0.2821*P/A2
Where, P=Perimeter of the basin(km)
A=Area of the basin(km2)
Horton
(1945)
Source: Thakkar, A. K. and.Dhiman, S.D (2007)
Table 2: Morphometric Parameters of Bandu watershed
Sl.
No.
Min
i-
Wa
ters
hed
Cir
cula
r
Ra
tio
Bif
urc
ati
on
Ra
tio
Fo
rm
Fa
cto
r
Elo
nga
tio
n
Ra
tio
Co
mp
act
ne
ss C
on
sta
nt
Str
eam
Fre
qu
ency
Dra
ina
ge
Den
sity
Tex
ture
Ra
tio
1 2A2B5C4 0.47 2.88 0.057 0.269 1.462 6.44 3.13 6.40
2 2A2B5B7 0.49 1.62 0.055 0.264 1.426 6.80 3.24 8.02
3 2A2B5C3 0.48 1.88 0.057 0.270 1.439 3.59 2.54 3.48
4 2A2B5C7 0.48 2.48 0.055 0.266 1.437 2.69 1.89 2.99
5 2A2B5C2 0.48 1.81 0.054 0.261 1.445 4.62 2.41 5.72
6 2A2B5C6 0.64 2.04 0.060 0.276 1.249 4.68 2.23 4.48
7 2A2B5C5 0.31 1.91 0.054 0.263 1.807 1.35 1.46 1.27
8 2A2B5C1 0.34 3.18 0.061 0.280 1.704 3.08 2.50 1.97
9 2A2B5A1 0.67 1.83 0.060 0.276 1.223 1.07 1.01 1.04
10 2A2B5B1 0.37 1.62 0.053 0.260 1.642 2.71 1.71 3.06
11 2A2B5B2 0.47 1.57 0.057 0.269 1.464 3.32 2.13 3.28
12 2A2B5B3 0.39 2.02 0.057 0.271 1.598 4.32 2.52 3.76
13 2A2B5A2 0.53 2.13 0.059 0.275 1.371 1.58 1.28 1.42
14 2A2B5B6 0.24 1.65 0.056 0.266 2.030 6.44 2.79 4.94
15 2A2B5B4 0.36 2.40 0.057 0.270 1.659 3.72 2.25 3.19
16 2A2B5B5 0.56 1.66 0.058 0.272 1.341 1.10 1.15 1.10
17 2A2B5A1
1 0.78 2.00 0.060 0.275 1.132 1.66 1.24 1.79
18 2A2B5A6 0.48 3.21 0.062 0.280 1.441 3.83 2.13 2.84
19 2A2B5A5 0.57 2.66 0.064 0.286 1.328 4.27 2.07 3.01

Analysis of drainage Morphometry and Watershed prioritization in Bandu Watershed, Purulia, West Bengal
through Remote Sensing and GIS technology - A case study
Ajoy Das et al.,
International Journal of Geomatics and Geosciences
Volume 2 Issue 4, 2012 1006
20 2A2B5A3 0.46 4.13 0.057 0.270 1.467 1.43 1.11 1.36
21 2A2B5A4 0.66 1.67 0.056 0.267 1.231 3.98 2.14 4.90
22 2A2B5A7 0.52 1.49 0.062 0.280 1.387 4.49 2.06 3.50
23 2A2B5A8 0.72 1.59 0.061 0.279 1.179 3.35 1.79 3.16
24 2A2B5A9 0.41 2.21 0.061 0.279 1.557 2.80 1.75 2.01
25 2A2B5A1
0 0.36 1.77 0.054 0.263 1.675 2.36 1.72 2.44
Table 3: Suitable Sensor and their application in Watershed Management
Image number: 106/55
Acquired on:
21st January, 2006
3rd
April, 2006
Image number: 106/56
12th
October, 2006
Acquired on:
16th
January, 2006
29th
March, 2006
7th
October, 2006
To prepare theme maps satellite data of geocoded FCC of bands 2, 3, 4 on 1:50,000 scales
along with corresponding SOI toposheet no.73I/3,73I/4,73I/7 and 73I/8.
The generated theme maps are as follows:
(1) Geomorphological Map
(2) Drainage, Watershed and Surface Waterbody Map
(3) Landuse/ landcover Map
(4) Transport and Settlement Map
(5) Soil Map
6) Slope Map
(7) Map showing catchment area of selected check dam sites
4.3 Watershed Concept
Watershed is a technical term used by the British to denote a common drainage point. It is a
hydro geological unit. In American terminology, it is referred to as Catchment Area.
Watershed is the line separating neighboring drainage basins (catchments). In hilly country,
the divide lies along topographical peaks and ridges, but in flat country (especially where the
ground is marshy) the divide may be invisible – just a more or less notional line on the
ground on either side of which falling raindrops will start a journey to different rivers, and
even to different sides of a region or continent. Drainage divides are important geographical
Analysis of drainage Morphometry and Watershed prioritization in Bandu Watershed, Purulia, West Bengal
through Remote Sensing and GIS technology - A case study
Ajoy Das et al.,
International Journal of Geomatics and Geosciences
Volume 2 Issue 4, 2012 1007
and often also political boundaries. Roads (such as ridge ways) and rail tracks often follow
divides to minimize grades (gradients), and to avoid marshes and rivers.
4.4 Causes of watershed deterioration
1. Uncontrolled, unplanned, unscientific land use and interventions lead to deterioration
of the watershed area. Some of the activities detrimental to watershed.
2. Cultivation on sloping land without adequate precautions, cultivation without
agronomic measures to conserve soil and water, cultivation along susceptible nalla
banks, cultivation of erosion-permitting crops, over-cropping without soil fertility
replenishment, faulty agricultural techniques etc.
3. Grass land: Excessive and uncontrolled grazing, growth of weeds, development of
cattle tracks causing damage and compaction of soil resulting in lower infiltration
rates, fires, theft etc.
4. Forest: Excessive and uncontrolled grazing which inhibits regeneration from seed or
stock, clear felling on steep slopes, destruction of forest land by fires and thefts, biotic
pressure for fuel, fodder, NTFP and small timber, drastic thinning of plantation along
slopes etc.
5. Shifting cultivation: Shifting cultivation or Jhum kheti practiced in certain areas of
counties (like North East India etc.) has proved to be very damaging to protective and
productive vegetation. This practice results in damage to the topsoil and inhibits the
growth of grasses, shrubs and trees.
6. Unscientific mining and construction activities: These activities damage the
vegetation and the landscape. The natural drainage lines are often blocked by debris.
7. Fire: Intentional / accidental fires result in loss of vegetation, organic matter and
micro-organisms.
8. Non-cooperation of the community: Non-Cooperation of the community in
conserving, protecting and enriching then ecosystem and CPR has also resulted in
most of the ills.
4.5 Why Watershed Management?
Watershed management is required for the following reasons:
1. To control damaging runoff.
2. To manage and utilize runoff for useful purposes.
3. To control erosion affecting reduction of sediment production.
4. To moderate floods in the downstream area.
5. To enhance groundwater storage wherever applicable, and
6. To appropriately use land resources in the watershed, thus developing forests and
fodder resources.
5. Methods
Analysis of drainage Morphometry and Watershed prioritization in Bandu Watershed, Purulia, West Bengal
through Remote Sensing and GIS technology - A case study
Ajoy Das et al.,
International Journal of Geomatics and Geosciences
Volume 2 Issue 4, 2012 1008
To delineate micro-watersheds, prioritization of mini-watersheds through morphometric
analysis in Bandu watershed has been attempted through integrated use of remote sensing and
GIS techniques. In the present study, the drainage map of the study area has been prepared
from three season’s satellite images of IRS-P6 (Resourcesat) LISS-III and LISS-IV of 2006.
LISS-III (106/55) satellite data were acquired on 21st January, 3rd April, and 12th October of
2006 and LISS-III (106/56) 16th January, 29th March and 07th October of 2006.These
satellite imageries had been georeferenced and merged using image processing software
ERDAS IMAGINE 9.1. These remotely sensed data were geometrically rectified with respect
to survey of India toposheet with 1: 50,000 scale. These merged data were used in the present
study. Image enhancement techniques were applied for better interpretation of the study area.
To delineate drainage map satellite data of geocoded FCC of bands 2, 3, 4 on 1: 50,000 scales
along with corresponding toposheets have been used 73I/3, 73I/4, 73I/7, and 73I/8. The
morphometric parameters for the delineated watershed area were calculated based on formula
suggested by various authors viz. Horton, Strahler, Schumn and Miller, presented in Table.1.
Digitization and computation of output value were done in ArcGIS 9.3 environment. On the
basis of some selected morphometric parameters watershed prioritization of all micro-
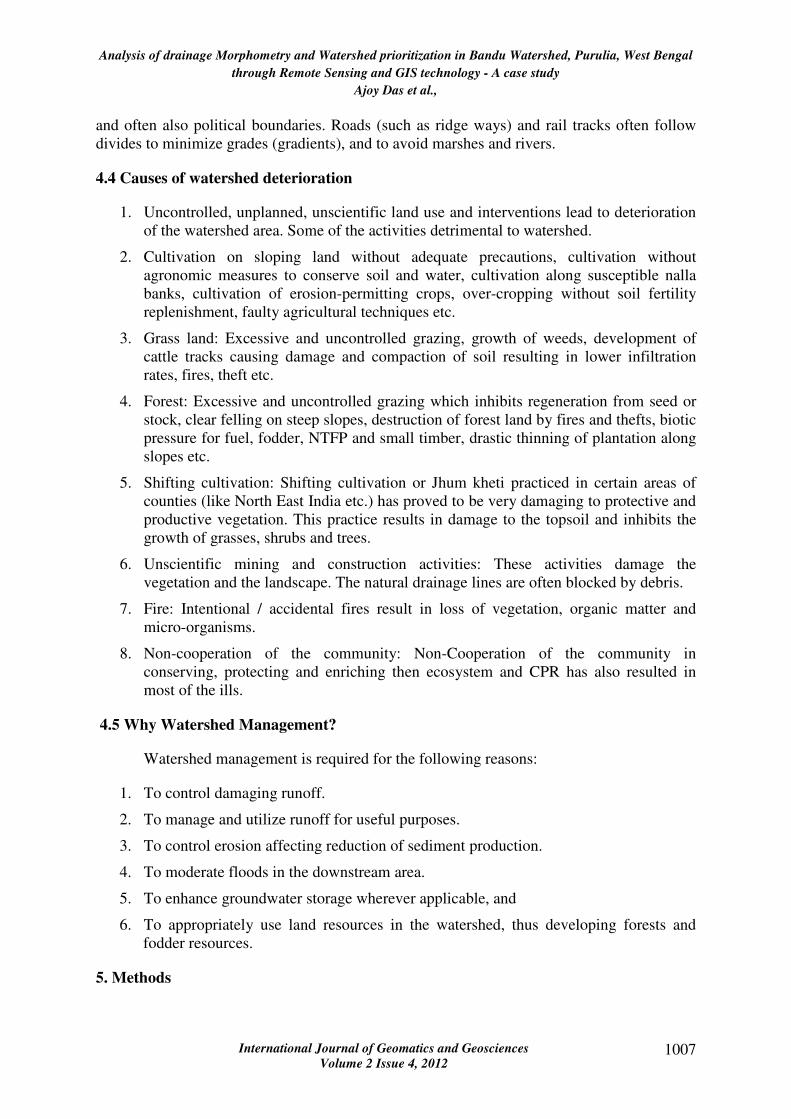
watersheds was carried out (Figure 7).
Figure 7: Flow chart showing methodology of micro-watershed prioritization map
The step wise methodology is listed as below
1. Drainage has been digitized as separate segments for every stream order.
2. Delineation of subwatershed, mini-watershed and micro-watershed have been done.
3. Computation of number and length of streams of every order for every mini-
watershed area have been done.
Analysis of drainage Morphometry and Watershed prioritization in Bandu Watershed, Purulia, West Bengal
through Remote Sensing and GIS technology - A case study
Ajoy Das et al.,
International Journal of Geomatics and Geosciences
Volume 2 Issue 4, 2012 1009
4. Computation of eight morphometric parameters namely Mean Bifurcation Ratio,
Drainage Density, Texture Ratio, Stream Frequency, Circularity Ratio, Form Factor,
Compactness Constant, Elongation Ratio have been made
5. Since higher value of Mean Bifurcation Ratio, Drainage Density, Texture Ratio,
Stream Frequency indicates higher potentiality of watershed deterioration these
parameters are given rank in descending order. Since lower value of Circularity Ratio,
Form Factor, Compactness Constant, Elongation Ratio indicates higher potentiality of
watershed deterioration these parameters are given rank in ascending order.
6. All parameters are assumed to have equal weights. The average rank for all mini-
watersheds are computed. Final rank has been assigned in ascending manner. (Table.
4)
5.1 Observation
On the basis of above mentioned observation it can be concluded that Remote Sensing and
GIS techniques are efficient tools in drainage delineation and their updation. These updated
drainages are treated as input data for morphometric analysis. This analysis was carried out
through measurement of linear, aerial and relief aspects of micro-watersheds. This
morphometric analysis reveals dendritic to sub-dendritic, parallel, radial drainage patterns
with moderate drainage textures of the entire sub-watershed. The variation in stream length
ratio reflects the change in slope and topography. The bifurcation ratio of sub-watersheds
indicates normal basin category and the area having moderate drainage density reflects that it
has highly permeable sub-soil and coarse to moderate drainage texture. The values of stream
frequency indicate that all the micro-watersheds show positive correlation with increasing
stream population with respect to increasing drainage density. The values of form factor and
circularity ratio evolve that almost all micro-watersheds are elongated in shape. Elongation
ratio indicates that Bandu watershed is a region of very low relief whereas other micro-
watersheds are characterized by moderate to high relief and steep ground slopes relief and
steep ground slopes.
5.2 Results and discussion
Stream length has been computed based on the law proposed by Horton (1945) for all the
micro watershed of the study area. Usually, the total length of stream segments is maximum
in first order streams and decreases as the stream order increases in the present case. The
mean stream length is presented in the table. The Bifurcation Ratio (Rb) values of study area
indicates that there is a uniform decrease in Rb values of 2A2B5A3 to 2A2B5A7, from one
order to the next order whereas in other micro watersheds, the Rb values are not same from
one order to next order. These differences are depending upon the geological and lithological
development of the drainage basin. In the study area, the higher values of Rb indicates a
strong structural control in the drainage pattern whereas the lower values indicate that the
sub-basins are less affected by structural disturbances (Nag, 1998; Vittala et al., 2004 and
Chopra et al., 2005). The Rb values of the micro watersheds of the study area range from
1.00 to 8.00 indicating that all the micro watersheds are falling under normal watershed
category
The drainage density in the micro watersheds of the study area shows variation from 1.47 to
4.20 per km2 suggesting moderate drainage density. This moderate drainage density of the
study area suggests that it has moderately permeable sub-soil and fine drainage texture

Analysis of drainage Morphometry and Watershed prioritization in Bandu Watershed, Purulia, West Bengal
through Remote Sensing and GIS technology - A case study
Ajoy Das et al.,
International Journal of Geomatics and Geosciences
Volume 2 Issue 4, 2012 1010
observed on hilly terrain. The Stream Frequency (Fs) values of the of the study area are
presented in the following table. It is noted that the values of Fs vary from 1.20 to 10.37. It is
also seen that the drainage density values of the micro watersheds exhibits positive
correlation with the stream frequency suggesting that there is an increase in stream
population with respect to increasing drainage density. The values of drainage texture ratio of
the study area vary from 1.04 to 8.02 . According to Smith (1950), five different drainage
textures have been classified based on the drainage density. The drainage density less than 2
indicates very coarse, between 4 and 6 is moderate, between 6 and 8 is fine and greater than
8 is very fine drainage texture. The 2A2Bb7 micro watershed has high values of Rt indicating
very fine drainage texture whereas the remaining micro watersheds show coarse to moderate
drainage texture exhibited by the surrounding source rock while the lower values may
indicate that the rocks exposed in the form of small ridges and mounds and plains with lower
degree of slopes.The form factor (Rf) values of the study area are presented in the Table. It is
noted that the Rf values vary from 0.053 to 0.064 micro watershed suggesting that it is almost
circular in shape. In the study area, the Circularity Ratio (Rc) values are ranging from 0.30 to
0.63. Those micro watersheds have the value of Rc is less than 0.5 indicating those are
elongated, whereas the remaining micro watersheds have greater than 0.5 values suggesting
that they are more or less circular in shape and are characterized by the high to moderate
relief and the drainage system were structurally controlled.The elongation ratio values of the
micro watersheds vary from 0.286 to 0.260. On the basis of elongation ratio it is also
suggested that the Bandu watershed is elongated in shape. A circular basin is more efficient
in the discharge of run-off than an elongated basin (Singh and Singh, 1997). In Bandu
watershed compactness ratio varies from 2.03 to 1.32.
Table 4: Prioritization Results of Morphometric analysis
Sl.
No.
Min
i- W
ate
rsh
ed
Cir
cula
rity
Ra
tio
Fo
rm F
act
or
Elo
nga
tio
n R
ati
o
Co
mp
act
-nes
s ra
tio
Str
eam
Fre
qu
ency
Dra
ina
ge
Den
sity
Tex
ture
Ra
tio
Bif
urc
ati
on
ra
tio
SU
M R
AN
K
Fin
al
Ra
nk
1 2A2B5C4 11 9 9 15 3 2 2 4 12.38 3
2 2A2B5B7 16 5 5 10 1 1 1 22 12.13 2
3 2A2B5C3 14 13 13 12 12 4 9 14 17.88 11
4 2A2B5C7 15 6 6 11 18 15 15 6 16.25 7
5 2A2B5C2 12 2 2 14 5 7 3 16 11.38 1
6 2A2B5C6 21 18 18 5 4 9 6 10 19.13 14
7 2A2B5C5 2 4 4 24 23 20 23 13 18.38 12
8 2A2B5C1 3 22 22 23 15 6 19 3 22.88 16
9 2A2B5A1 23 19 19 3 25 25 25 15 27.25 25
10 2A2B5B1 6 1 1 20 17 19 13 21 15.75 5
11 2A2B5B2 10 10 10 16 14 12 10 24 19 13
12 2A2B5B3 7 14 14 19 7 5 7 11 17.25 10
13 2A2B5A2 18 16 16 8 21 21 21 9 23.5 18
14 2A2B5B6 1 7 7 25 2 3 4 20 13.63 4
15 2A2B5B4 5 11 11 21 11 8 11 7 16.63 8
Analysis of drainage Morphometry and Watershed prioritization in Bandu Watershed, Purulia, West Bengal
through Remote Sensing and GIS technology - A case study
Ajoy Das et al.,
International Journal of Geomatics and Geosciences
Volume 2 Issue 4, 2012 1011
16 2A2B5B5 19 15 15 7 24 23 24 19 25.25 24
17 2A2B5A11 25 17 17 1 20 22 20 12 24.25 21
18 2A2B5A6 13 24 24 13 10 11 16 2 23.38 17
19 2A2B5A5 20 25 25 6 8 13 14 5 24 20
20 2A2B5A3 9 12 12 17 22 24 22 1 21.13 15
21 2A2B5A4 22 8 8 4 9 10 5 18 15.75 6
22 2A2B5A7 17 23 23 9 6 14 8 25 24.63 22
23 2A2B5A8 24 21 21 2 13 16 12 23 25 23
24 2A2B5A9 8 20 20 18 16 17 18 8 23.88 19
25 2A2B5A10 4 3 3 22 19 18 17 17 16.88 9
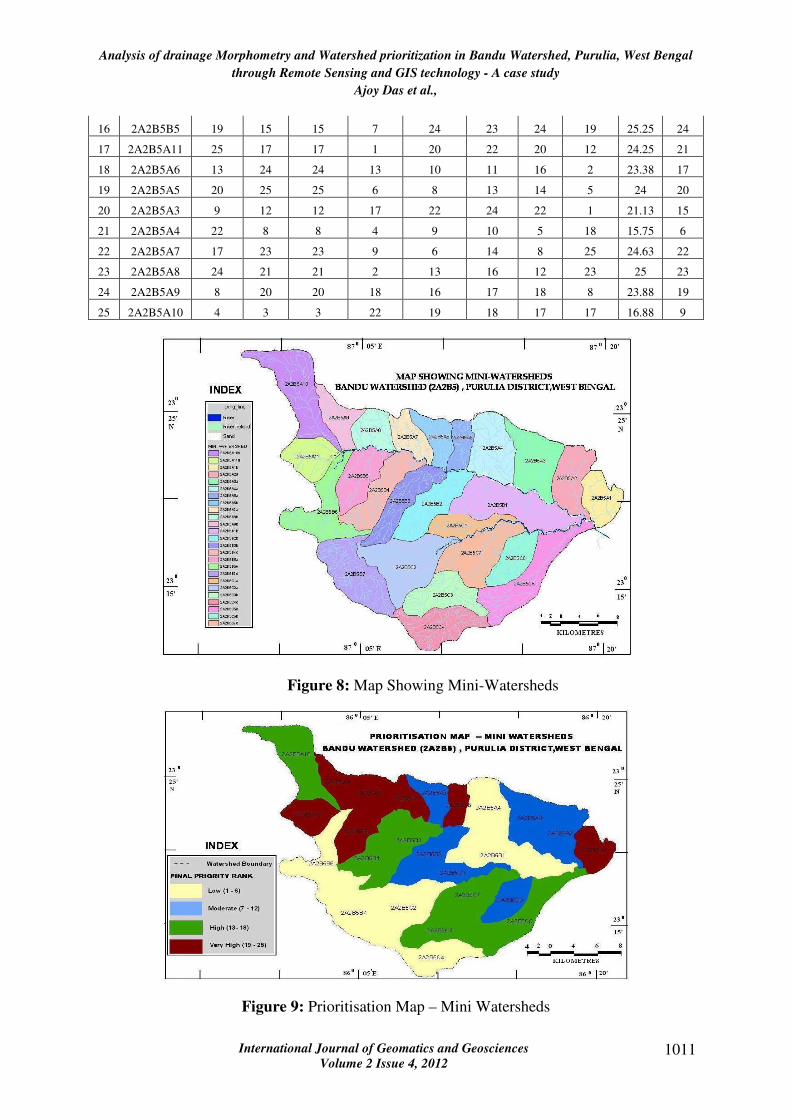
Figure 8: Map Showing Mini-Watersheds
Figure 9: Prioritisation Map – Mini Watersheds
Analysis of drainage Morphometry and Watershed prioritization in Bandu Watershed, Purulia, West Bengal
through Remote Sensing and GIS technology - A case study
Ajoy Das et al.,
International Journal of Geomatics and Geosciences
Volume 2 Issue 4, 2012 1012
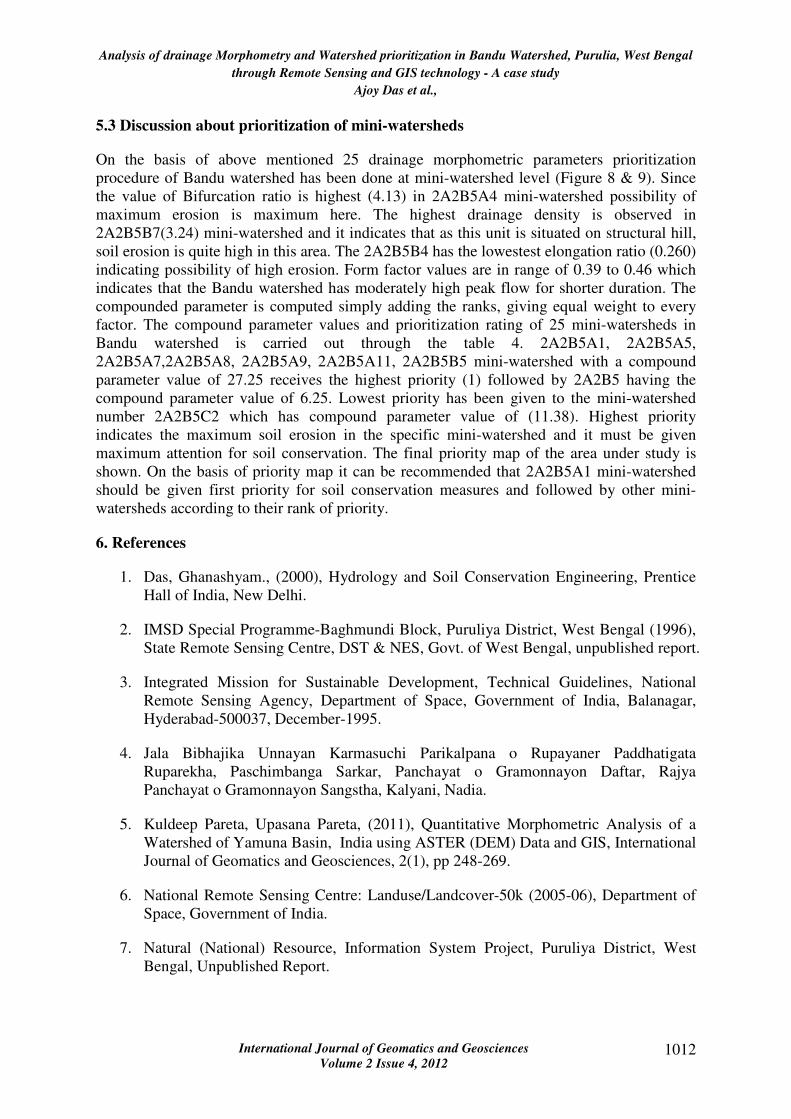
5.3 Discussion about prioritization of mini-watersheds
On the basis of above mentioned 25 drainage morphometric parameters prioritization
procedure of Bandu watershed has been done at mini-watershed level (Figure 8 & 9). Since
the value of Bifurcation ratio is highest (4.13) in 2A2B5A4 mini-watershed possibility of
maximum erosion is maximum here. The highest drainage density is observed in
2A2B5B7(3.24) mini-watershed and it indicates that as this unit is situated on structural hill,
soil erosion is quite high in this area. The 2A2B5B4 has the lowestest elongation ratio (0.260)
indicating possibility of high erosion. Form factor values are in range of 0.39 to 0.46 which
indicates that the Bandu watershed has moderately high peak flow for shorter duration. The
compounded parameter is computed simply adding the ranks, giving equal weight to every
factor. The compound parameter values and prioritization rating of 25 mini-watersheds in
Bandu watershed is carried out through the table 4. 2A2B5A1, 2A2B5A5,
2A2B5A7,2A2B5A8, 2A2B5A9, 2A2B5A11, 2A2B5B5 mini-watershed with a compound
parameter value of 27.25 receives the highest priority (1) followed by 2A2B5 having the
compound parameter value of 6.25. Lowest priority has been given to the mini-watershed
number 2A2B5C2 which has compound parameter value of (11.38). Highest priority
indicates the maximum soil erosion in the specific mini-watershed and it must be given
maximum attention for soil conservation. The final priority map of the area under study is
shown. On the basis of priority map it can be recommended that 2A2B5A1 mini-watershed
should be given first priority for soil conservation measures and followed by other mini-
watersheds according to their rank of priority.
6. References
1. Das, Ghanashyam., (2000), Hydrology and Soil Conservation Engineering, Prentice
Hall of India, New Delhi.
2. IMSD Special Programme-Baghmundi Block, Puruliya District, West Bengal (1996),
State Remote Sensing Centre, DST & NES, Govt. of West Bengal, unpublished report.
3. Integrated Mission for Sustainable Development, Technical Guidelines, National
Remote Sensing Agency, Department of Space, Government of India, Balanagar,
Hyderabad-500037, December-1995.
4. Jala Bibhajika Unnayan Karmasuchi Parikalpana o Rupayaner Paddhatigata
Ruparekha, Paschimbanga Sarkar, Panchayat o Gramonnayon Daftar, Rajya
Panchayat o Gramonnayon Sangstha, Kalyani, Nadia.
5. Kuldeep Pareta, Upasana Pareta, (2011), Quantitative Morphometric Analysis of a
Watershed of Yamuna Basin, India using ASTER (DEM) Data and GIS, International
Journal of Geomatics and Geosciences, 2(1), pp 248-269.
6. National Remote Sensing Centre: Landuse/Landcover-50k (2005-06), Department of
Space, Government of India.
7. Natural (National) Resource, Information System Project, Puruliya District, West
Bengal, Unpublished Report.

Analysis of drainage Morphometry and Watershed prioritization in Bandu Watershed, Purulia, West Bengal
through Remote Sensing and GIS technology - A case study
Ajoy Das et al.,
International Journal of Geomatics and Geosciences
Volume 2 Issue 4, 2012 1013
8. NRIS Project, Project Report On Soil Mapping of Puruliya District, West Bengal,
Indian Resources Information and Management Technologies LTD., Plot No. 1299K,
Road No. 66, Jubilee Hills, Hyderabad-500033.
9. Rudraiah, Govinaiah, Vittala., (2008), Morphometry Using Remote Sensing and GIS
Techniques In The Sub-Basins of Kagna River Basin, Gulburga District, Karnataka,
India, Journal of Indian society of Remote Sensing 36, 351-360.
10. Seethapathi P.V, Dutta D, and Siva Kumar R., (2008), Hydrology of Small
Watersheds (eds), New Delhi: TERI (The Energy and Resources Institute).
11. Sethupathi. A.S , Lakshmi Narasimhan C , Vasanthamohan V , MohanS.P, (2011),
Prioritization of mini watersheds based on Morphometric analysis using Remote
Sensing and GIS techniques in a draught prone Bargur Mathur sub water sheds,
Ponnaiyar river basin, India, International Journal of Geomatics and Geosciences,
2(2), pp 403-414.
12. Sandipan Gosh, (2011), Quantitative and Spatial Analysis of Fluvial Erosion in
relation to Morphometric Attributes of Sarujharna Basin, East Singhbhum, Jharkhand,
International Journal of Geomatics and Geosciences, 2(1), pp 71-90.
13. Thakkar, A.K. and Dhiman, S.D., (2007), Morphometric Analysis and Prioritization
of miniwatersheds in Mohr Watershed, Gujarat Using Remote Sensing and GIS
technique, Journal of the Indian society of Remote Sensing, 35(4), 313-321.