Embed Size (px)
Citation preview
Annals of Nuclear Energy 59 (2013) 63–71
Contents lists available at SciVerse ScienceDirect
Annals of Nuclear Energy
journal homepage: www.elsevier .com/locate /anucene
Analysis of economics and safety to cope with station blackout in PWR
0306-4549/$ - see front matter � 2013 Elsevier Ltd. All rights reserved.http://dx.doi.org/10.1016/j.anucene.2013.03.017
⇑ Corresponding author at: Department of Nuclear and Quantum Engineering,Korea Advanced Institute of Science and Technology, 373-1 Guseong-dong,Yuseong-gu, Daejeon 305-701, Republic of Korea.
E-mail address: [email protected] (H.G. Kang).
Ahmed Saeed Al Shehhi a, Soon Heung Chang b, Sang Ho Kim b, Hyun Gook Kang a,b,⇑a Department of Nuclear Engineering, Khalifa University of Science, Technology & Research, Abu Dhabi, United Arab Emiratesb Department of Nuclear and Quantum Engineering, Korea Advanced Institute of Science and Technology, 373-1 Guseong-dong, Yuseong-gu, Daejeon 305-701, Republic of Korea
a r t i c l e i n f o
Article history:Received 23 August 2012Received in revised form 11 March 2013Accepted 12 March 2013Available online 23 April 2013
Keywords:Risk-informed decision makingStation blackoutEmergency water supplyDiverse emergency diesel generatorSurveillance test intervalRisk aversion factor
a b s t r a c t
Design and operation options that can reduce both the initiating event frequency and the accident mit-igation probability were addressed in an integrated framework to cope with station blackout. The safety,engineering cost, water delivery cost and testing/maintenance cost of each option were quantitativelyevaluated to calculate the cost variation and to find an optimal point in the reference reactor,OPR1000. Design variables that represent additional emergency water supply, diverse emergency dieselgenerator, and surveillance test period modification were investigated. Based on these design variables,we applied the developed formula to quantify cost items, which were presented as changes of the eco-nomics and the safety. A case study was provided to illustrate the change of the total cost. Different riskaversion factors that represent different attitudes of the public were also investigated. The result showsthat the costs and benefits of various complicated options can be effectively addressed with the proposedrisk-informed decision making framework.
� 2013 Elsevier Ltd. All rights reserved.
1. Introduction In this paper, the reference plant is OPR1000, the first Korean
From the literature, the report ‘The Reactor Safety Study(WASH1400)’, published in 1975, shows that station blackout(SBO) is one of the most important contributors to core damagefrequency (CDF) (Raughley, 2003). NUREG/CR-6890, published in2005, shows that even after improvement of the SBO mitigationfacility, the SBO is still one of the most significant contributors toCDF (Eide et al., 2005).
The definition of SBO is (as per 10 CFR 50.2) ‘‘The complete lossof alternating current (AC) electric power to the essential and non-essential switchgear buses in a nuclear power plant (i.e. loss of off-site electric power system concurrent with turbine trip andunavailability of the onsite emergency AC power system). Stationblackout does not include the loss of available AC power to busesfed by station batteries through inverters or by alternate ACsources as defined in this section, nor does it assume a concurrentsingle failure or design basis accident. . .’’ (Raughley, 2003).
Recently, on March 14, 2011, earthquake and a tsunami hit Ja-pan and caused four nuclear power plants to be faced with aSBO. In the incident there was a leakage of radioactive substancesinto the environment. This accident served as a motivation toreevaluate the total cost of existing and future nuclear powerplants, in order to address the issue of whether those plants aresafe enough or need an upgrade to cope with a SBO.
plant of a standardization project which consists of two steam gen-erators (SGs) and four reactor coolant pumps that are connected toa reactor vessel, one pressurizer connected to one output of the hotleg line, and safety injection lines which are connected to the coldleg (Park et al., 2009).
Once a SBO occurs, the reactor will be tripped immediately bythe insertion of the control rods into the reactor core by the mech-anism of gravity. However, the reactor core continuously producesdecay heat after shutdown and this residual heat must be removedby a cooling mechanism in order to avoid any increase of the fuelcladding temperature. The failure of cladding due to high temper-ature might lead to release of radioactive substances into the con-tainment and then to the environment.
The OPR1000 design copes with a SBO by using a turbine drivenauxiliary feedwater pump (TDP) to deliver feedwater to the SGs.Steam from the secondary side of the SGs is diverted into a turbinewhich provides motive power for the TDP. In order to remove suf-ficient decay heat, a steam relief path through either the SG atmo-spheric dump valves (ADVs) or the main steam safety valves(MSSVs) is needed. DC batteries, which can work up to 4 h, are alsorequired to support additional equipment needed to use the TDPs,such as valves and instrumentation. Regardless of whether TDP isavailable, successful mitigation of a SBO requires the eventual res-toration of AC power. If SG water makeup from the TDP is unavail-able (but AC power has been restored), decay heat can also beremoved by providing water to the reactor coolant system fromsafety injection pumps (if available) and intentionally bleedingcoolant. Even if there are steps for coping with a SBO inOPR1000, the main methods to mitigate a SBO are the restoration

64 A.S. Al Shehhi et al. / Annals of Nuclear Energy 59 (2013) 63–71
of AC power and the operation of TDPs. If the restoration of ACpower is not possible for a long time, TDP would be the essentialinstrument for removing decay heat. A case in which TDP isunavailable due to the failure of some particular component alsohas to be considered. Accordingly, in this paper, an emergencywater supply (EWS) to the SGs through the hookup pipe is pro-posed as a diverse backup system.
EWS consists of a fixed pipe connected from the SG to the out-side of the containment. A standby valve is installed on the pipe.Following the occurrence of a SBO, a fire truck hose is connectedto the pipe hole at the opening of the isolation valve. In many acci-dents, the inside of the containment cannot be made accessible ormanageable. However, because EWS can be operated from outsideof the containment, it has the advantages of high accessibility andmaintenance in accidents. Fig. 1 shows the mitigation system for aSBO in OPR1000 and the design concept of EWS.
Second, safety can also be enhanced by the reduction of SBO ini-tiation frequency. One of the most agreed on suggestions fromengineers is to install a diverse backup system to supply AC power.In the Fukushima nuclear power plant accident, the only survivingemergency diesel generator (EDG) was an air-cooled type whichsuccessfully supplied electricity for cooling units 5 and 6 whilewater-cooled type EDGs were unavailable. EDGs require accurate,intensive and frequent testing and maintenance to avoid any fail-ures that might cause unavailability when a demand signal is gen-erated. At the same time, frequent testing and maintenance lead tohigh cost and may cause degradation and wearing out of the com-ponents. The testing interval and maintenance scheme greatly af-fect the reliability of an EDG.
Lots of possible design and operation options against SBOs haveproposed, with their merits and demerits. In order to make a prop-er decision from a variety of choices, the use of a risk-informed ap-proach is one promising method. In this study, we propose a risk-informed framework to treat the above-mentioned variety of op-tions in an effective manner. As an example of the frameworkapplication, we performed analysis for the addition of EWS andEDG and the change of EDG testing interval, all of which are ex-pected to enhance the safety and economics of nuclear powerplants.
This paper consists of six sections: Section 2 is to show therisk-informed decision making framework. In Section 3, the safety
Fig. 1. OPR1000 with the
analysis results which provide some input parameters for designspecification of EWS are explained. Section 4 describes an exampleanalysis result with three independent variables against SBOs:EWS, additional EDG, and test interval of EDG. In Section 5, a sen-sitivity study of different risk aversion factors is illustrated. Thestudy will be concluded in Section 6.
2. Cost calculation
The objective function which represents the total cost changewill be calculated as
DCt ¼ DEþ DM þ DDþ DR ð1Þ
The objective function, DCt, is the sum of cost changes in engi-neering and equipment (DE), maintenance (DM), water delivery(DD), and plant risk (DR) with the unit of dollars per year. Thesecosts depend on inflation and the financial situation, both of whichshould be taken into account. The engineering and equipment costchange, DE, can be directly measured with dollars. This cost in-cludes the costs of installation of new systems, and of planningand labor. Total maintenance cost, M, is calculated as
M ¼ n� l� d ¼ 1T� l� d ð2Þ
where n is the number of tests performed per year, l is the testingcost of unit time, d is duration of each test and T is interval betweensurveillance tests. DM is the cost change caused by the changedinspection period from the reference (12 tests per year).
The water delivery cost change from reference plant configura-tion, DD, must be calculated if we consider the addition of EWS. Itis directly correlated to mass flow rate and to delay time of waterdelivery. If we assume that the EWS uses fire trucks, the requirednumber of fire trucks will be the basis of DD calculation.
The risk cost of the plant, R, depends on design parameters oroperation environment of the plant. The overall risk of a plantcan be quantified by using probabilistic safety assessment (PSA).In this study, we used AIMS-PSA (HAN et al., 2010) software pack-age to quantify the plant risk. Risk will be represented by the mea-sures: the CDF of PSA level 1 and the large early release frequency(LERF) of PSA level 2. Khalaquzzaman et al. (2011) showed that therisk cost can be calculated as
application of EWS.
A.S. Al Shehhi et al. / Annals of Nuclear Energy 59 (2013) 63–71 65
R ¼ N1 � CDFSBO þ N2 � LERFSBO ð3Þ
N1 is the monetary value of electricity loss for reactor core damage:
N1 ¼ CP � G� 8760 hyear
� 30 years� S0 ð4Þ
CP is the plant capacity factor; G is the electricity generation capac-ity in kW, with 30 years taken as the average duration of electricityloss (considering 60 years of plant life); S0 is the electricity sellingprice in dollars per kW h. N2 is the total external cost consideringpublic risk insight and can be expressed as
N2 ¼ w� b ð5Þ
where b is the direct external cost for large early release and w isthe multiplication factor for the risk aversion attitude of the public.
Eeckhoudt et al. (2000) proposed a calculation method for themultiplication factor. In order to calculate w, it is necessary to ob-tain the coefficients shown in Eq. (6). MA represents the maximumpercentage of wealth that a risk averse individual is willing to losewith certainty in order to avoid an accident. MN indicates the max-imum percentage of wealth that a risk neutral individual is willingto lose with certainty in order to avoid an accident. These valuesare calculated for each group of individuals. Then, w is calculatedusing these coefficients weighted by the population of each group.In Eq. (6), the total group is divided by three for each area, the totalindividual costs corresponding to each state of the world (Eec-khoudt et al., 2000).
w ¼ N1MA1 þ N2MA2 þ N3MA3
N1MN1 þ N2MN2 þ N3MN3ð6Þ
For simplicity, we assumed that
LERFSBO ¼ a� CDFSBO ð7Þ
In Eq. (7), the calculation of LERFSBO is simplified with the assump-tion that the value is linearly proportional to CDFSBO with the ratiofactor (a), which implies the conditional failure probability ofcontainment.
CDFSBO is quantified as
CDFSBO ¼ Z--SBO � PSBO ð8Þ
whereR--SBO is the initiating event frequency of a SBO and in Eq. (8)
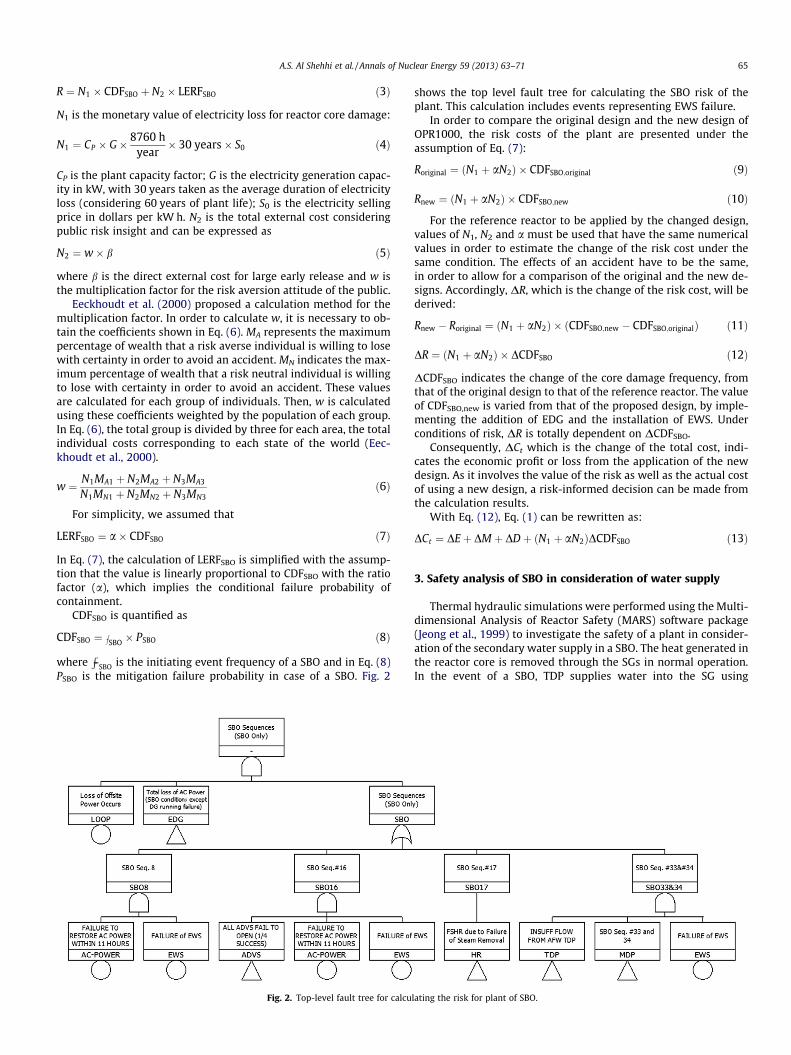
PSBO is the mitigation failure probability in case of a SBO. Fig. 2
Fig. 2. Top-level fault tree for calcu
shows the top level fault tree for calculating the SBO risk of theplant. This calculation includes events representing EWS failure.
In order to compare the original design and the new design ofOPR1000, the risk costs of the plant are presented under theassumption of Eq. (7):
Roriginal ¼ ðN1 þ aN2Þ � CDFSBO;original ð9Þ
Rnew ¼ ðN1 þ aN2Þ � CDFSBO;new ð10Þ
For the reference reactor to be applied by the changed design,values of N1, N2 and a must be used that have the same numericalvalues in order to estimate the change of the risk cost under thesame condition. The effects of an accident have to be the same,in order to allow for a comparison of the original and the new de-signs. Accordingly, DR, which is the change of the risk cost, will bederived:
Rnew � Roriginal ¼ ðN1 þ aN2Þ � ðCDFSBO;new � CDFSBO;originalÞ ð11Þ
DR ¼ ðN1 þ aN2Þ � DCDFSBO ð12Þ
DCDFSBO indicates the change of the core damage frequency, fromthat of the original design to that of the reference reactor. The valueof CDFSBO,new is varied from that of the proposed design, by imple-menting the addition of EDG and the installation of EWS. Underconditions of risk, DR is totally dependent on DCDFSBO.
Consequently, DCt which is the change of the total cost, indi-cates the economic profit or loss from the application of the newdesign. As it involves the value of the risk as well as the actual costof using a new design, a risk-informed decision can be made fromthe calculation results.
With Eq. (12), Eq. (1) can be rewritten as:
DCt ¼ DEþ DM þ DDþ ðN1 þ aN2ÞDCDFSBO ð13Þ
3. Safety analysis of SBO in consideration of water supply
Thermal hydraulic simulations were performed using the Multi-dimensional Analysis of Reactor Safety (MARS) software package(Jeong et al., 1999) to investigate the safety of a plant in consider-ation of the secondary water supply in a SBO. The heat generated inthe reactor core is removed through the SGs in normal operation.In the event of a SBO, TDP supplies water into the SG using
lating the risk for plant of SBO.

0
200
400
600
800
1000
1200
1400
1600
0 1000 2000 3000 4000 5000 6000
Tem
pera
ture
(c)
Time (s)
Fig. 4. Maximum fuel cladding temperature with TDP failure in SBO condition.
0.00E+002.00E+064.00E+066.00E+068.00E+061.00E+071.20E+071.40E+071.60E+071.80E+072.00E+07
0 1000 2000 3000 4000 5000
Pres
sure
(Pa)
Time (s)
Fig. 5. Pressure of the primary loop with TDP failure in SBO condition. The openingand closing of the PRV cause the fluctuation.
66 A.S. Al Shehhi et al. / Annals of Nuclear Energy 59 (2013) 63–71
generated steam. Currently, this is the only water supply systemfor supplying water in a SBO. The addition of EWS works as a di-verse backup system to supply water in cases in which the TDPsand the recovery of the AC power fail. SBO scenarios in OPR1000were simulated using MARS for three different cases. The first casewas one in which there was no water supply into the SGs. The sec-ond case included EWS only for one SG and the third case includedEWS for two SGs at the same time. The maximum fuel claddingtemperature was the key parameter to judge the integrity of thereactor core. Some assumptions were applied for this simulation:
� Failure of TDP occurred at 0 s (no water supply into the SG fromeither TDP or MDP).� Reactor trip at beginning of accident (same for turbine).� Other emergency core cooling systems are inoperable except
safety injection tanks due to the loss of AC.� Increasing pressure in the containment will be considered small
and will not lead to containment failure.� The safety relief valve of the pressurizer will be opened at
17.5 MPa and closed at 14.2 MPa.� Failure criteria were set at maximum fuel cladding temperature
of 1000 �K.
The first simulation was conducted to determine the maximumallowed delay time (ADT) before failure of the reactor core. Thissimulation showed that failure started to develop around 65 minafter the accident. The second simulations were performed withdifferent mass flow rates from 10 kg/s to 40 kg/s, and different de-lay times of water delivery, in a range from 10 min to 70 min. Thethird simulations were performed under the same conditions asthose of the second, except that water was supplied into both SGs.
3.1. Failure of TDP
For the case of TDP failure, the simulation was performed todetermine the maximum time before core damage. Following thefailure of TDP, there would be no available backup AC power inthe early stage. Fig. 3 shows the water level in the SGs and reactorcore. Because of water boiling in the SGs, the SGs will run out ofwater. That would lead to increases of the fuel cladding tempera-ture and the reactor coolant system pressure, as shown in Figs. 4and 5, respectively. The maximum fuel cladding temperature startsto increase once the water runs out from the SG (900 s after therunning out of water) and accelerates dramatically just after4200 s. Fig. 5 shows the post-reactor trip pressure decrease dueto the reduction of power. At this point, the pressure increasesgradually because of insufficient heat transfer. The pressurizer
Fig. 3. Reactor core and steam generator water level with TDP failure in SBOcondition.
safety relief valves (PRVs) start to open at 1437 s. The PRVcontinues to open and close with the decrease of water inventory.This causes core uncovery and leads to a rapid increase in the tem-perature of the primary loop, as shown in Fig. 4.
3.2. Supplying water into one SG
Fig. 6 shows the results of supplying water into only one SG. Adelivery water flow rate of less than 20 kg/s was not sufficient toremove the decay heat from the reactor core. The state of the corealso depends on the delay time of the water delivery. The resultsreasonably show an increase of the fuel cladding temperaturewhen the delivery water was delayed or insufficient water wassupplied.
3.3. Supplying water into two SGs
Fig. 7 shows the results of supplying water into two SGs. As in-tended by the engineering design of OPR1000, there was in thiscase no big difference from the case of water supplied into oneSG. A small difference can be observed at the low mass flow region.It was clear that the fuel cladding temperature was a bit lower inthe case of two SG supply. In general, cooling using one SG willbe sufficient to remove the decay heat successfully.
4. Examples of design and operation change
In this section, an example is illustrated with three design vari-ables: EWS, addition of AC power source, and the variation of theEDG maintenance period. These variables are adopted to cover avariety of design alternatives that aim to reduce the risk of SBOby reducing the initiating event frequency or by enhancing themitigation capability. The design alternatives can be comparedusing the objective functions shown in Eqs. (1) and (13).

Fig. 6. Temperature gradient according to the mass flow rate and ADT when wateris supplied into only one SG.
Fig. 7. Temperature gradient according to the mass flow rate and ADT when wateris supplied into two SGs.
A.S. Al Shehhi et al. / Annals of Nuclear Energy 59 (2013) 63–71 67
DCt varies according to the design parameters, including massflow rate ð _mÞ and allowed delay time (t), testing intervals of EDGs(T), and addition of EDG to the reference plant (A). Water deliverycost of EWS also depends on the design parameters, _m and t. Eq.(13) can be rewritten in consideration of the design parameters.
Ctð _m; t; T;AÞ ¼ DEð _m; t;AÞ þ DMðT;AÞ þ DDð _m; tÞ þ ðN1
þ aN2Þ � DCDFSBOð _m; t; T;AÞ ð14Þ
DR of Eq. (1) can be calculated based on the risk difference amongdesign alternatives and the reference design. The risk cost of eachdesign can be calculated using Eq. (3). In this example, N1, the mon-etary value of electricity loss caused by reactor core damage, wasassumed to be $1.42E+10. Also, CP = 0.9, G = 1,000,000 kW, andS0 = $0.06/kW h were assumed.
As shown in Eq. (5), N2, the total external cost considering pub-lic risk insight, can be calculated using the multiplication of the di-rect external cost for large early release (b) and the multiplicationfactor for the risk aversion attitude of the public (w). The directexternal cost is highly dependent on the conditions of the nuclearpower plant. In this calculation, to estimate a general condition, inconsideration of various cost categories including food bans,evacuation and relocation, indirect costs, fatal effect cost andnon-fatal effect costs, the direct external cost was assumed to be
$2.20E+10 from the French case study ST21 (NEA, 2003; Eeckhoudtet al., 2000).
The resulting value will be multiplied by w, the value of whichwill be decided in consideration of the location of the site and thepopulations around the site. In this example, a multiplication fac-tor of 20 was applied since it was known to be the reasonable valuefor a severe accidents scenario (NEA, 2003; Eeckhoudt et al., 2000).The multiplication factor of 20 was calculated using the data in Ta-ble 1, which were results of previous research (Eeckhoudt et al.,2000). From the actual results of PSA for OPR1000 and from thevalues of other reactors, the ratio factor (a) can be reasonably as-sumed to be 0.1 for a general estimation.
Eq. (12) can be rewritten as
DR ¼ c� DCDFSBO ð15Þ
where c = 5.82E+10. DCDF will be quantified using PSA models.Regarding the periodic testing of EDGs, an increase of testing
frequency would lead to a decrease of undetected failure probabil-ity to start EDG, as intended. However, at the same time, this in-crease of testing frequency would lead to an increase of thefailure probability to start EDG due to the down time in the periodfor testing. The unavailability of EDG due to random failures can beestimated as
Uf ¼k� T
2ð16Þ
where k is the failure rate. The unavailability due to maintenancedown time is
Um ¼dT
ð17Þ
where d is the downtime per repair or testing. These two kinds ofunavailability will be used as input data for PSA models in orderto obtain the total change of CDF for different testing intervals.
The maintenance cost change in Eq. (1), DM, will be calculatedwith assumptions that l = $500/h/EDG and d = 2 h. DM is the costchange caused by the changed testing interval in the referencecase. Thus DM = M �MO, where MO = 24,000 $/year which corre-sponds to 12 tests per year and 2 EDGs.
In this analysis, the mass flow rate of EWS was fixed at 20 kg/ssince this is the amount of successful water delivery in the event ofa SBO as shown in Figs. 6 and 7. If EWS relies on the use of firetrucks, the required amount of water flow will determine the re-quired number of fire trucks to ensure the safety of the plant.
The failure probability of EWS is assumed to be 1.0E�3, whichincludes the failure probabilities of the valves of the pipe con-nected to the SGs and failure probabilities of the pumps of the firetrucks that support water. The external hazard rates, which cancause EWS failure, and other factors that can degrade the effective-ness of the EWS system, are not considered.
The EWS cost is assumed to follow the graph in Fig. 8. TheEWS cost includes the fire truck costs, maintenance costs, andfuel, engineering and installation costs. In Fig. 8, the cost curvestarts at $46,667, which covers the cost of two fire trucks andengineering, equipment, and installation. The slope decreasesdue to the higher possibility of utilization of fire trucks outsidethe site if there is more allowable delay time (ADT). The costdecreases to an ADT of 65 min, at which point the amount ofwater required increases, which leads to an increased numberof required fire trucks. Eq. (13) can be rewritten with constantsand design parameters as:
Ctð _m; t; T;AÞ ¼ DEð _m; t;AÞ þ 17;280T
� l� 24;000� �
þ DDð _m; tÞ þ 1:0229� 1011
� DCDFSBOð _m; t; T;AÞ ð18Þ

Table 1Calculation of the risk aversion attitude of the public for each group of individuals(Eeckhoudt et al., 2000).
First group (local andrelocated, j = 1)
Second group (local andno relocated, j = 2)
Third group(regional, j = 3)
Nj 9800 1,990,200 54 millionsMAj 1.5E�08 9.6E�09 2.1E�09MNj 4.2E�09 4.9E�10 1.0E�10
Fig. 9. DCt according to the number of tests with fixed EWS cost at ADT of 30 min.
68 A.S. Al Shehhi et al. / Annals of Nuclear Energy 59 (2013) 63–71
DCt according to the number of tests performed per year is plottedin Fig. 9 with the fixed EWS at an ADT of 30 min. When there are alarge number of tests performed per year, DCt is high due to the costof frequent inspections. When there are a small number of testsperformed per year, DCt is higher because the unavailability of EDGswill cause higher DR. The dotted line in Fig. 9 indicates the optimalpoint of testing interval. It is notable that the optimal point dependson the other design parameters and on various constants. The valueof w is one of the main contributors to uncertainty since it largelydepends on the willingness of the public to pay to avoid the risk.Further discussion regarding the cost sensitivity of w can be foundin Section 5.
Fig. 10 shows the change of DCt according to the number oftests and the ADT change. As explained by the data in Fig. 8, DCt
decreases as ADT increases up to 65 min. After 65 min of ADT,due to the increased number of required fire trucks, DCt increasesas ADT increases as shown in Figs. 6 and 7. Fig. 11 shows the con-tour of DCt to effectively illuminate the optimal region of the low-est cost. A decrease in the number of tests means a reduction oftest costs; at the same time, it causes an increase in the randomfailure probability of the EDG.
The current design of OPR1000 contains two EDGs of sea watercooling type. For diversity of AC sources, the addition of one moreair-cooled type diesel generator is considered. Any common causeof failure between this type of air-cooled EDG and water-cooledEDG is assumed to be negligible. The cost of this EDG is huge com-pared to the cost of EWS. DE should be calculated in considerationof the EDG cost. DE is assumed to be $150,000 per year.
Fig. 12 shows the DCt of the plant with addition of EDG and EWSwhen the ADT of EWS is fixed at 30 min. The dotted line shows theoptimal point of the testing interval, which is around 4 tests peryear, while 12 tests are done in the reference plant. The reductionof risk is an important input for the decision making. Focusing onthe risk, the addition of EDG provides a reasonable result. Table 2shows the contribution of a SBO to the plant risk for different de-sign options. It shows that an additional EDG is an effective meansof reducing the risk of a SBO, but that its cost is much larger thanthat of EWS. The comparison of Figs. 9 and 12 provide some insightregarding this cost-effect balance. Figs. 13 and 14 show the value of
05000100001500020000250003000035000400004500050000
5 25 45 65
(dol
lar/y
r)
ADT (mins)
Fig. 8. EWS cost assumption: costs of DE and DD along the ADT.
DCt in the case of the addition of EWS and EDG when ADT and test-ing frequency are varied.
5. Sensitivity study of risk aversion factor
The PSA aims not only to evaluate the risk or safety of a nuclearpower plant but also to provide a valuable means to support thesafety, economics, design and operation of a nuclear power plant(Verma et al., 2011). Most issues of utilities are related to makingthe overall plant design, the operation, and the maintenance costsas low as possible with maximum benefits. The important issue ofregulatory bodies is to make sure that the plants are in safe andthat risk is reasonably controlled. This study aims to provide a bal-anced input to allow decision making by both utilities and regula-tory bodies. The risk cost consists of two parts: Internal cost isassociated with the cost of the plant itself, since a severe accidentwill cause the loss of the plant, which will lead to the loss of elec-tricity generation. External costs include the damage to the envi-ronment and the public. It is clear that the total risk cost isdirectly related to a multiplication factor for the risk aversion atti-tude of the public (w) as shown in Eq. (5).
Investment in the safety equipment, which imposes additionalcost, will reduce the risk. Finding a balance point between thesedifferent viewpoints is an issue. While the cost of equipment andmaintenance can be calculated in a more direct manner, the costof risk must be calculated based on both internal and external ef-fects. The risk aversion factor is a critical factor in the calculationof costs caused by external effects. This factor refers to the behav-ioral tendency of avoiding risk or uncertainty (Cather, 2010). Moredetails on estimation methods of the multiplication factor areavailable in Eeckhoudt et al. (2000).
A high value of w implies that people are willing to pay more toavoid risk; for an example, people might be willing to pay more ifthe site is located near a large city. In this case, DR becomes higherwhen w increases. Fig. 15 shows the calculated results of DCt forvarious values of w when EWS is applied. It can be seen that thereare different optimum points according to the different values of w.Risk reduction, which is represented by DR, compensates for theadditional cost of EWS. The decision to apply EWS to a specificplant should be made in consideration of the balance betweenDR and other additional costs.
Fig. 16 shows DCt for the case of adding an EDG in addition to anEWS application. The figure shows that, with w = 20, the additionof an EDG is not beneficial from the viewpoint of economics, eventhough its safety improvement is significant. DCt increases withlarge w and n due to high DR and DM. Figs. 15 and 16 show thateven with a relatively small value of w, an EWS is beneficial option,while EDG addition requires a much larger value of w for itsjustification.

Fig. 10. DCt when EWS was applied.
Fig. 11. Contour of DCt shown in Fig. 10.
Fig. 12. DCt according to the number of tests with additional EDG and fixed EWScost at ADT of 30 min.
A.S. Al Shehhi et al. / Annals of Nuclear Energy 59 (2013) 63–71 69
As shown in this sensitivity study, the value of w largely affectsrisk-informed decision making. That is, w should be determinedvery carefully in order to obtain a reasonable estimate of the totalcost.
It is notable that this study was performed with these assump-tions: (1) The time value of money is not considered. (2) This study
focuses on a simple SBO sequence. Thus, the effects of designalternatives and operation options on the sequences of other initi-ating events are not considered. Also, the initiator of the SBO wasset as a random failure. Events such as seismic disturbances or tsu-nami were not included in the analyses. (3) In order to focus on theeffects of the proposed main variables, some indirect costs wereexcluded in the equation. These are costs associated with late con-tainment releases, and onsite costs such as the cleanup and decon-tamination of a plant.
6. Conclusions
In this study, an integrated risk-informed decision makingframework was proposed. It covers considerations in very compli-cated combinations of design and maintenance schemes to supportproper decision making. Various options against SBO wereaddressed.
There are two strategies for performing safety improvements.The first is the prevention of accidents. Reducing the SBO fre-quency with diverse air-cooled EDG is beneficial from the viewof increasing the number of methods to prevent SBOs. The secondis the mitigation of accidents under the conditions of an SBO. Anemergency water supply system using fire trucks was proposedto cool down the core, for example.
The safety analysis of the reference plant in the case of a SBOprovides information required to determine the details of EWS.The estimated maximum ADT and cooling water amount wereused to calculate the water delivery cost. The risk cost was calcu-lated based on the CDF of a plant with a new design or new main-tenance period.
The total cost changes for various design and maintenance op-tions were calculated in the proposed framework. Additions ofEWS and EDG with various EDG testing intervals were consideredin the example analyses. It determined that the approach of reduc-ing the CDF with diverse EWS is economically preferable to theaddition of EDGs. The addition of an EDG is simpler than the instal-lation of EWS and effectively reduces the risk of a SBO, but its costis much larger than that of EWS. If the cost of EDG decreases or thatof EWS increases from the value used in the example calculation ofthis study, this comparison must be revisited.
At w = 20, the addition of EWS with the adjusted EDG testinginterval was shown to be the best option. The addition of a diverse

Table 2Contribution to total CDF (%) for different examples of OPR1000 design.
Initiatingevent
Contribution to total CDF (%)(original)
Contribution to total CDF (%) (onlyEWS)
Contribution to total CDF (%) (onlyEDG)
Contribution to total CDF (%)(EWS + EDG)
SBO 11.50 6.13 0.77 0.40
Fig. 13. DCt when EWS and an additional diverse EDG is applied.
Fig. 14. Contour of DCt shown in Fig. 13.
Fig. 15. DCt according to the number of tests with fixed EWS ADT of 30 min fordifferent risk aversion factors.
Fig. 16. DCt according to the number of tests with additional EDG and fixed EWSADT of 30 min for different risk aversion factors.
70 A.S. Al Shehhi et al. / Annals of Nuclear Energy 59 (2013) 63–71
EDG is very costly, and thus could be justified only when very largew is applied. The optimal EDG testing interval was also determinedin the case study.
In the case of a plant that has specific safety goals in terms ofnumerical values of CDF and LERF, the design variables that resultin excess risk beyond the safety goal should not be considered asdesign or operation options. With these constraints, the proposedanalysis framework can be utilized to provide useful design andoperation information.
The insights from this study are expected to be useful for boththe operators and the regulators of nuclear power plants. In orderto allow for a more precise analysis, the assumptions we made inthis paper should be revisited. It is recommended that the changeof total risk be addressed for more realistic results. Finally, the real-istic treatment of the uncertainty of the analysis is recommendedas a topic for the future study.

A.S. Al Shehhi et al. / Annals of Nuclear Energy 59 (2013) 63–71 71
References
Cather, D.A., 2010. A gentle introduction to risk aversion and utility theory. RiskManage. Insur. Rev. 13, 127–145.
Eeckhoudt, L., Schieber, C., Schneider, T., 2000. Risk aversion and external cost of anuclear accident. J. Environ. Manage. 58, 109–117.
Eide, S.A., Gentillon, C.D., Wierman, T.E., Rasmuson, D.M., 2005. Reevaluation ofstation blackout risk at nuclear power plants. NUREG/CR-6890, vol. 3.
Han, S.H. et al., 2010. Improved features in a PSA software AIMS-PSA. In: KoreanNuclear Society Spring Meeting, Pyeongchang, Korea.
Jeong, J.J., Ha, K.S., Chung, B.D., Lee, W.J., 1999. Development of a multi-dimensional thermal-hydraulic system code, MARS 1.3.1. Ann. Nucl. Energy26, 1611–1642.
Khalaquzzaman, M., Kang, H.G., Kim, M.C., Seong, P.H., 2011. Optimization ofperiodic testing frequency of a reactor protection system based on a risk-costmodel and public risk perception. Nucl. Eng. Des. 241, 1538–1547.
OECD/NEA, 2003. Nuclear electricity generation: what are the external Costs?NEA4372. <http://www.nea.fr/ndd/reports/2003/nea4372-generation.pdf>(accessed 30.06.12).
Park, R.J., Hong, S.W., Kim, S.B., Kim, H.D., 2009. Detailed evaluation of coolantinjection into the reactor vessel with RCS depressurization for high pressuresequences. Nucl. Eng. Des. 239, 2484–2490.
Raughley, W.S., 2003. Regulatory effectiveness of the station blackout rule. NUREG-1776. US Nuclear Regulatory Commission.
Verma, A.K., Srividya, A., Gopika, V., Rao, K.D., 2011. Risk-informed decision makingin nuclear power plants. In: Safety and Risk Modeling and its Applications.Springer, New York.