Embed Size (px)
Citation preview

Analysis of Effect of Service Quality,
Physical Environment And Customer
Experience To Customer Loyalty Through
Customer Satisfaction of Visitor Starbucks
Coffee In Samarinda
1st Besse Asniwaty
Business Administration Department,
Marketing Study Program Samarinda State Polytechnic, E-mail : [email protected]
2nd Muhta Sehe2
Business Administration Department,
Business Administration Study Program Samarinda State Polytechnic,
E-mail : [email protected]
3th Bobby Siswanto
Business Administration Department,
Marketing Study Program Samarinda State Polytechnic,
E-mail : [email protected]
4th
Satryawati
Business Administration Department Business Administration Study Program
Samarinda State Polytechnic
E-mail : [email protected]
Abstract-This study aims to determine the effect of service quality,
physical environment and customer experience to customer loyalty
through customer satisfaction on Starbucks coffee visitors in
Samarinda ,. The research data obtained were then analyzed using
the structural equation modeling (SEM) analysis tool using the
analysis of moment structure (AMOS) software. The result of this
research shows that service quality and physical environment have
significant influence directly to customer satisfaction and to
customer loyalty, other districts of customer experience have not
significant effect either directly on customer satisfaction and
customer loyalty, and customer satisfaction as intervening variable
significantly customer loyalty, thus very precise research puts
customer satisfaction as variable intervening Keywords: Service Quality, Physical Environment, Customer
Experience, Customer Satisfaction, Customer Loyalty
I. INTRODUCTION
The company always innovates for customer satisfaction and
this applies to all types of companies including companies
engaged in services or retail that have adopted a strategy that
can maintain satisfaction and create customer loyalty like [19]
found in their research that maintaining and maintaining
customers will have an impact on cost efficiency that is
cheaper than the costs used to find new customers.
In fact, it can be witnessed that more and more retail
businesses are currently competing in the market and showing
great development, this is not an obstacle for retail companies
to always add outlets in various regions. This business is better known as a franchise, which is widely developed in developed
and developing countries. Franchising is also known to have a
very effective distribution to bring products closer to each
customer. One of the franchises that are engaged in coffee
shops that are currently developing, is Starbucks Coffee.
Starbucks Coffee has more varied coffee beverage products. Starbucks Corporation is a coffee shop network from the
United States based in Seattle, Washington. Starbucks is the
largest coffee shop company in the world, with 15,012 outlets
in 44 countries. Starbucks Coffee was first opened in 1971 in
Seattle by Jerry Baldwin, Zev Siegle, and Gordon Bowker. In
the 1990s, Starbucks opened many new stores, this growth
continued until the 2000s. At the end of March 2008,
Starbucks had 16,226 outlets, 11,434 of which were in the
United States.
Starbucks in Indonesia has also spread in large cities such as in
Jakarta, Bandung, Surabaya, Medan, and Bali. In Indonesia Starbucks competes with other Coffee Shop networks from the
United States, such as The Coffee Bean and Excelso.
Starbucks offers a variety of beverage menus for customers,
namely non-coffee drinks, snacks and beautiful souvenirs.
Starbucks Coffee market target: in terms of age 16-40 Years,
students, entrepreneurs, and private employees to families.
Based on the Top Brand Award data in Indonesia in the last 5
years from 2013-2017 Starbucks excelled from other
competitors in the field of coffee café franchise in Indonesia
and occupied the Top Brand position for 5 consecutive years.
As in the following data:
1st International Conference on Materials Engineering and Management - Management Section (ICMEMm 2018)
Copyright © 2019, the Authors. Published by Atlantis Press. This is an open access article under the CC BY-NC license (http://creativecommons.org/licenses/by-nc/4.0/).
Advances in Economics, Business and Management Research, volume 75
122

Table 1
Top Brand Award Café Coffee 2013-2017
NO Brand Year Percen-
tage
Infor
mation
1
Star-
bucks
2013 47,3%
TOP
BRAND
2 2014 48,6%
3 2015 47,8%
4 2016 44,0%
5 2017 39,5%
In 2013-2014 Starbucks Coffee in Indonesia increased by
around 1.3% from 47.3% to 48.6%. However, from 2015 to
2016 to 2017 Starbucks successively decreased from 48.7% to
47.8% then from 47.8% to 44.0% and lastly from 44.0)% to 39.5%, in that position Starbucks Coffee. In the following year
in 2016 and 2017 Starbucks was still the Top Brand Award in
the coffee segment in Indonesia. Decreasing the percentage
percentage of Starbucks Coffee reported by the Top Brand
Award website is the number of other Coffee Cafés in
Indonesia that make Starbucks Coffee consumers begin to
slowly move to Café Coffee, such as The Coffee Bean and
Excels. Other variants in Indonesia
Variables that are suspected to be part of the achievement of
Starbuck to become a top brand during this time, namely
Service Quality, where the quality of service provided to consumers every time buying products includes physical
facilities, equipment or equipment, prices, and personal
appearance and written material that is Starbuck, providing
fast, precise, polite and sensitive services to customer needs.
The variable Physical Environment includes strategic location
selection, layout, interior design, aesthetics, tables and chairs,
sound system, air condition and cleanliness, then Customer
Experience includes experiences that create a sense of comfort
through the quality of drinks and food that is presented with
vision, touch, taste, hospitality to meet the needs and desires of
customers.
Customer Satisfaction is an intervening variable that covers
customer satisfaction with the services provided, products
offered to consumers and facilities provided by Starbucks
outlets in Samarinda to create the comfort and satisfaction of
each customer. Furthermore, variable Customer Loyalty is
indicated through repurchase, a statement of positive things
about the product. and also has a commitment to always be
loyal to Starbucks products. Based on the facts described, a
research title can be drawn, namely "Analysis of the Effect of
Service Quality, Physical Environment and Customer Experience on Customer Loyalty through Customer
Satisfaction on Starbucks Coffee Visitors in Samarinda City".
II. LITERATURE REVIEW
Some experts argue about the notion of marketing as expressed
by [11] that marketing is the realization of potential exchanges
with the intention of satisfying human needs and desires. Then
[14] states that marketing is an overall system of business
activities aimed at planning, pricing, promoting and
distributing goods or services that can satisfy the needs of both
existing buyers and potential buyers.
According to [12] "Marketing mix is the set of tactical
marketing tools that the company blends to produce the
response it wants in the target market." The marketing mix
consists of 4 (four) components called 4P , namely: (1)
Product is an item, service, idea designed and offered by the company for consumer needs. (2) Price is the amount of
money the customer must pay to get the product, (3) Place is
the placement of a product to be available to target consumers,
and how to deliver products to consumers. (4) Promotion is the
activity of communicating and conveying information about
products to consumers, and persuading target consumers to
buy products. Then [15] adding another 3P to 7P, namely (5)
Process is the service, creation, design and implementation of
effective processes (6) Physical environment is the design of
building appearance, landscaping, interior furniture,
equipment, staff uniforms, signs, printed materials, which are
visible and provide tangible evidence of the quality of service of the company, (7) People are individuals who interact
directly with consumers, which require good interpersonal
skills and positive attitudes.
Marketing Services according to [18] Services are activities
that can be identified individually and are not palpable, to meet
needs and not have to be tied to the sale of other products or
services. Furthermore [11] stated that services are all actions
or performance that can be offered by one party to another
party which is essentially intangible and does not produce any
ownership. Various research and service marketing literature
reveals that services have a number of unique characteristics that differentiate from goods and have an impact on how to
market them. The characteristics of services according to [6]
are Intangibility, Inseparability, Variability, Perishability
[11] said that, "Consumer behavior is the study of how
individuals, groups, and organizations select, buy, use, and
dispose of goods, services, ideas, or experiences to satisfy their
needs and desires". In line with [22] which says consumer
behavior can be defined as behavior in which consumers show
(searching for), purchasing, using, evaluating, and disposing of
products and services that they will satisfy their needs
[13] that "Retailing is a series of business activities to add
value to goods and services sold to consumers for personal or household consumption". So consumers are the target of
retailing as the end consumers who buy products for
consumption own. Retail mix is a variable used to satisfy
customer needs and influence customer purchasing decisions.
[16] says there are 6 retail mix variables including: (1) location
(2) merchandise (3) Price (4) Promotion (5) Service (6)
Atmosphere
[11] states that "Quality is the totality of features and
characteristics of a product or service that depends on its
ability to satisfy expressed or implied needs." Meanwhile,
according to Lewis and Booms in [24] "quality services as a measure of how well the level of service provided is in line
with customer expectations. [1] argues that Service Quality
can be measured by using the following 5 indicators: (1)
Tangible is the appearance and capability of the company's
physical facilities and infrastructure that can be relied on in the
surrounding environment and is tangible evidence of services
provided by service providers. (2) Reliability is the ability of
Advances in Economics, Business and Management Research, volume 75
123

the company to provide services in accordance with what is
promised accurately and reliably. (3) Responsiveness is the
company's ability to provide fast and appropriate services to
customers by delivering clear information (4) Assurance is
knowledge, politeness of compensation, and the ability of
company employees to foster customer trust in the company.
(5) Emphaty is giving sincere and individual or personal attention given to customers by trying to understand customer
desires.
[20] Physical environment is everything that covers all non-
human aspects of the field where consumer behavior occurs.
Almost all aspects of the physical environment can influence
consumer behavior, and measuring Physical Environment by
using the following 6 indicators: (1) Aesthetics Facility,
namely all architectural designs, interior designs, and
decorations that contribute to the attractiveness of the dining
area environment (2) Ambience, which is an intangible
element that aims to influence the senses in a non-visual way that unconsciously gives effect to consumers (3) Lighting,
which is different lighting that can affect individual
consumers' perceptions of the size of the room and change
consumer sensitivity in terms of physical , psychology and
emotional will be an area and influence consumer buying
behavior (4) Layout, which is an element that gives pleasure in
a middle to upper restaurant. (5) Table Settings, that is. how to
design a table by putting flowers or candles as decorations to
make consumers feel they are in a good environment. (6)
Service Staff, that is. refers to employee performance, number
of employees, and employee gender. In line with [3] which measures Physical Environment with 5 indicators, namely
Layout Accessibility, Facilities Aesthetics, Comfort Seating,
Electronic Equipment, Facility Cleanliness,
According to [17] customer experience is customer responses
internally and subjectively as a result of direct and indirect
interactions with the company, further [21] suggests that
consumer experience involves the five senses, heart, mind ,
who can place the purchase of a product or service in a larger
context in life. [23] argues that Customer Experience can be
measured by 5 indicators, namely (1) Sense, namely the senses
that are owned by humans as a tool to feel the products and
services offered. (2) Feel, which is the feeling displayed
through the idea, pleasure, and reputation of the consumer service. (3) Think, namely the experience of demanding
intelligence with the aim of creating cognitive experiences and
problem solving by engaging consumers creatively. (4) Act,
which is designed to create a consumer experience that relates
to physical psychology (5) Relate, namely the existence of
relationships with other people, other social groups (such as
work, lifestyle) or wider social identities
Associated with customer satisfaction [7] states that customer
satisfaction is a feeling that is owned by the customer if the
needs are real or only perceived fulfilled or exceeded expectations, [11] argue that "customer satisfaction is a feeling
of pleasure or disappointment someone who appears after
comparing the perceptions or impressions of the performance
or results of a product and service and its conformity with
expectations [5] measuring Customer Satisfaction with 4
indicators, namely: (1) Service Satisfaction, is a feeling of
satisfaction that consumers feel about the services provided.
(2) Pleasant Experience, which is a pleasant experience felt by
consumers both in using the product or service they buy. (3)
Transaction Service, which is the ease of service in making
transactions. (4) Leisure Facilities, namely a facility provided
to consumers to enjoy leisure time or in a waiting state such as, the features of games facilities and others.
According to [10] loyalty is defined as a strong commitment to
buy or subscribe to certain products or services in the future
even though there are influences of marketing situations and
efforts that have the potential to cause behavior change, then
[26] measure Customer Loyalty with 3 indicators namely Say
Positive Things, Recommend Friend, Continue Purchasing,
according to [4] Customer Loyalty is measured by the
following 3 indicators: (1) Word of Mouth (WOM), (2)
Repurchase Intention, (3) Commitment, In this study,
researchers adopted indicators according to [4] because the indicators are in line with what researchers are researching.
HYPOTESIS TEST
H1: Service Quality has significant influence on Customer
Satisfaction at Starbucks Coffee visitors in Samarinda
H2: Physical Environment has a significant effect on
Customer Satisfaction at Starbucks Coffee visitors in
Samarinda.
H3: Customer Experiencer significantly impacts Customer
Satisfaction on Starbucks Coffee visitors in Samarinda. H4: Service Quality has significant influence to Customer
Loyalty of a Starbucks Coffee visitors in Samarinda
H5: Philosophical Environment significantly affects the
customer loyalty of visitors to Starbucks Coffee in
Samarinda
H6: Customer Experience significantly influence Customer
Loyalty of Starbucks Coffee visitors in Samarinda
H7: Customer Satisfaction significantly affects Customer
Loyalty of Starbucks Coffee visitors in Samarinda.
III. RESEARCH METHOD
This study uses SEM (Structural Equation Model) for data
processing and analysis in which SEM is a statistical technique
that can analyze the relationship between latent constructs and
indicators, latent constructs with each other and direct
measurement errors. SEM allows direct analysis between
several dependent and independent variables [9]. The causal
relationship between research variables can be constructed
from one or several exogenous variables with one or several
endogenous variables. Each endogenous variable or exogenous
variable can be constructed from several indicators that can be
measured directly. Data Processing and Procedure Analysis by Structural Equation Model (SEM) is carried out through the
stages of correlation calculation, confirmation factor analysis,
and the determination of direct and indirect effects between
exogenous and endogenous variables. [2] Software used for
moment structure analysis (AMOS) 5.0.
Advances in Economics, Business and Management Research, volume 75
124
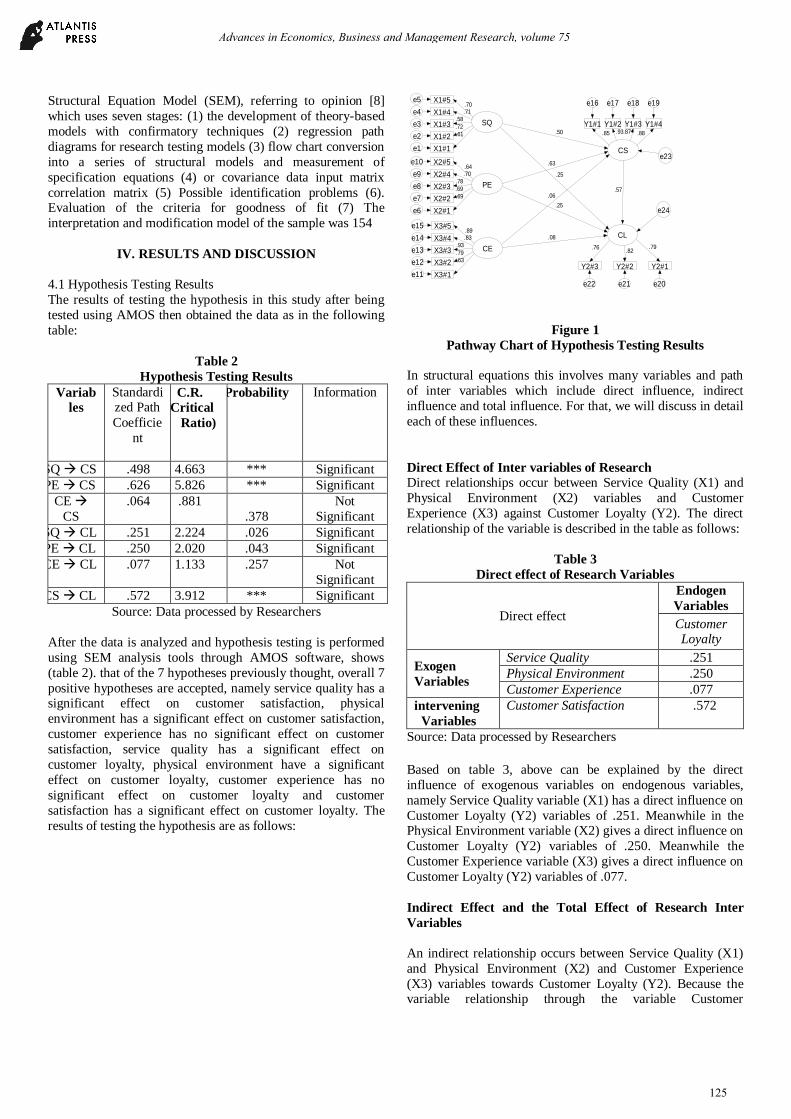
Structural Equation Model (SEM), referring to opinion [8]
which uses seven stages: (1) the development of theory-based
models with confirmatory techniques (2) regression path
diagrams for research testing models (3) flow chart conversion
into a series of structural models and measurement of
specification equations (4) or covariance data input matrix
correlation matrix (5) Possible identification problems (6). Evaluation of the criteria for goodness of fit (7) The
interpretation and modification model of the sample was 154
IV. RESULTS AND DISCUSSION
4.1 Hypothesis Testing Results
The results of testing the hypothesis in this study after being
tested using AMOS then obtained the data as in the following
table:
Table 2
Hypothesis Testing Results
Variab
les
Standardized Path
Coefficie
nt
C.R.
(Critical
Ratio)
Probability Information
SQ CS .498 4.663 *** Significant
PE CS .626 5.826 *** Significant
CE
CS
.064 .881
.378
Not
Significant
SQ CL .251 2.224 .026 Significant
PE CL .250 2.020 .043 Significant
CE CL .077 1.133 .257 Not
Significant
CS CL .572 3.912 *** Significant
Source: Data processed by Researchers
After the data is analyzed and hypothesis testing is performed
using SEM analysis tools through AMOS software, shows
(table 2). that of the 7 hypotheses previously thought, overall 7
positive hypotheses are accepted, namely service quality has a significant effect on customer satisfaction, physical
environment has a significant effect on customer satisfaction,
customer experience has no significant effect on customer
satisfaction, service quality has a significant effect on
customer loyalty, physical environment have a significant
effect on customer loyalty, customer experience has no
significant effect on customer loyalty and customer
satisfaction has a significant effect on customer loyalty. The
results of testing the hypothesis are as follows:
Figure 1
Pathway Chart of Hypothesis Testing Results
In structural equations this involves many variables and path
of inter variables which include direct influence, indirect
influence and total influence. For that, we will discuss in detail
each of these influences.
Direct Effect of Inter variables of Research
Direct relationships occur between Service Quality (X1) and
Physical Environment (X2) variables and Customer
Experience (X3) against Customer Loyalty (Y2). The direct
relationship of the variable is described in the table as follows:
Table 3
Direct effect of Research Variables
Direct effect
Endogen
Variables
Customer Loyalty
Exogen
Variables
Service Quality .251
Physical Environment .250
Customer Experience .077
intervening
Variables
Customer Satisfaction .572
Source: Data processed by Researchers
Based on table 3, above can be explained by the direct
influence of exogenous variables on endogenous variables,
namely Service Quality variable (X1) has a direct influence on
Customer Loyalty (Y2) variables of .251. Meanwhile in the Physical Environment variable (X2) gives a direct influence on
Customer Loyalty (Y2) variables of .250. Meanwhile the
Customer Experience variable (X3) gives a direct influence on
Customer Loyalty (Y2) variables of .077.
Indirect Effect and the Total Effect of Research Inter
Variables
An indirect relationship occurs between Service Quality (X1)
and Physical Environment (X2) and Customer Experience
(X3) variables towards Customer Loyalty (Y2). Because the variable relationship through the variable Customer
SQ
X1#1e1
.61X1#2e2
.72X1#3e3
.58X1#4e4 .71
X1#5e5.70
PE
X2#1e6
X2#2e7
X2#3e8
X2#4e9
X2#5e10
.69
.69
.78
.70.64
CE
X3#1e11
X3#2e12
X3#3e13
X3#4e14
X3#5e15
.63
.79
.93
.83.89
CS
CL
Y2#1
e20
Y2#2
e21
Y2#3
e22
.79.82
.76
Y1#1
e16
.85
Y1#2
e17
.93Y1#3
e18
.87Y1#4
e19
.88.50
.63
.06
.25
.25
.08
.57
e23
e24
Advances in Economics, Business and Management Research, volume 75
125

Satisfaction (intervening variable), so there is a total influence
as shown in table 4 as follows:
Table 4
Indirect Effect and Total Effect of Research Inter
Variables
Variables
Intervening
Customer
Satisfaction
Endogen
Customer
Loyalty
Total
effect
SQ (X1)
CS(Y1)CL(Y2) .285
.572 .857
PE (X2)
CS(Y1)CL(Y2) .358 .572
.930
CE (X3)
CS(Y1)CL(Y2) .037 .572
.609
Source: Data processed by Researchers
Based on table 4 above shows that the relationship between
Service Quality (X1), Physical Environment (X2), and
Customer Experience (X3), on Customer Loyalty (Y2),
through Customer Satisfaction (Y1) as intervening variables, is
respectively (X1), 285, (X2), 358 and, (X3), 037. The
influence of Customer Satisfaction (Y1), on Customer Loyalty
(Y2), is .572. Thus obtained the total effect of Service Quality
(X1), on Customer Loyalty (Y2), through Customer
Satisfaction (Y1) amounting to .857, Physical Environment (X2), on Customer Loyalty (Y2), through Customer
Satisfaction (Y1), amounting to .930 and Customer Experience
(X3) to Customer Loyalty (Y2), through Customer Satisfaction
(Y1), amounting to .609. The use of Customer Satisfaction
(Y1) as an intervening variable is very appropriate because it
can increase and increase the influence of the mass of each
related variable
IV. RESULT AND DISCUSSION
Statistical test results show the causality relationship that
occurs as a proof of the hypothesis in this study, based on data
used and theoretical studies. As well as the results of empirical research that supports, and or rejects the results of hypothesis
testing conducted in this study.
Effect of Service Quality (X1) on Customer Satisfaction
(Y1), Hypothesis 1
The results of the first hypothesis test (H1) states that Service
Quality (X1) has a significant effect on Customer Satisfaction
(Y1) on visitors to Starbucks Coffee outlets in Kota Samarinda
(Table 4.1). This is indicated by the Standardized Path
Coefficient of .498 and the Critical Ratio (CR) value of 4.663, greater than the critical value of ± 1.96 and obtained a
significant probability (p) of *** which is smaller than the
specified error level (α) of 0.05.
Effect of Physical Environment (X2) on Customer
Satisfaction (Y1) Hypothesis 2
The results of the second hypothesis test (H2) stated that
Physical Environment (X2) had a significant effect on
Customer Satisfaction (Y1) on visitors to Starbucks Coffee
outlets in Samarinda City (Table 4.1). This was indicated by
the Standardized Path Coefficient of .626 and the Critical
Ratio value. (CR) of 5.826, greater than the critical value of ±
1.96 and obtained a significant probability (p) of *** which is
smaller than the error level (α) of 0.05.
Effect of Customer Experience (X3) on Customer
Satisfaction (Y1) Hypothesis 3
The results of the third hypothesis (H3) test can be stated as
Customer Experience (X3) which has not significant effect on
Customer Satisfaction (Y1) visitors to Starbucks Coffee outlets
in Kota Samarinda (Table 4.1). This is indicated by the
Standardized Path Coefficient of .064 and the Critical Ratio
(CR) value of .881, smaller than the critical value of ± 1.96
and obtained a significance probability (p) of .378 which is
greater than the specified error level (α) of 0.05. The findings
of this study indicate that Customer Experience (X3)
influences Customer Satisfaction (Y1). This means that
customer experience is not a determinant key to determining
customer satisfaction. In this context every customer has a thought in assessing their level of satisfaction gained from the
experience of visiting the Starbucks Coffee store. In addition,
the majority of respondents surveyed were students / students
with the dominant visiting frequency, namely once/inevitably,
therefore from that experience is not the focus or value taken
by the respondents of this study.
Effect of Service Quality (X1) on Customer Loyalty (Y2)
Hypothesis 4
The results of the fourth hypothesis test (H4) state that Service Quality (X1) has a significant effect on Customer Loyalty (Y2)
on visitors to Starbucks Coffee outlets in Kota Samarinda
(Table 4.1). This is indicated by the Standardized Path
Coefficient of .251 and the Critical Ratio (CR) value of 2.224,
greater than the critical value of ± 1.96 and obtained a
significant probability (p) of .026 which is smaller than the
error rate (α) which is set at 0.05.
Effect of Physical Environment (X2) on Customer Loyalty
(Y2) Hypothesis 5
The result of testing the fifth hypothesis (H5) can be stated that Physical Environment (X2) has a significant effect on
Customer Loyalty (Y2) on visitors to Starbucks Coffee outlets
in Kota Samarinda (Table 4.1). This is indicated by the
Standardized Path Coefficient of .250 and the Critical Ratio
(CR) value of 2.020, greater than the critical value of ± 1.96
and obtained a significant probability (p) of .043 which is
smaller than the error rate (α) of 0.05. . The results of this
study support the previous research conducted by [25] in
Taiwan with a sample of 931 respondents. Where the previous
research stated that Physical Environment had a significant
effect on Customer Loyalty.
Effect of Customer Experience (X3) on Customer Loyalty
(Y2), Hypothesis 6
The test results of the sixth hypothesis (H6) can be stated as
Customer Experience (X3) has no significant effect on
Customer Loyalty (Y2) visitors to Starbucks Coffee Big Mall
Advances in Economics, Business and Management Research, volume 75
126

outlets in Samarinda City (Table 4.1). This is indicated by the
Standardized Path Coefficient of 0.77 and the Critical Ratio
(CR) value of 1.133, smaller than the critical value of ± 1.96
and obtained a significance probability (p) of .257 which is
greater than the error rate (α) of 0.05 ..
Effect of Customer Satisfaction (Y1) on Customer Loyalty
(Y2) Hypothesis 7
The results of testing the seventh hypothesis (H7) can be stated
that Customer Satisfaction (Y1) has a significant effect on
Customer Loyalty (Y2) on visitors to Starbucks Coffee outlets
in Kota Samarinda (Table 4.1). This is indicated by the
Standardized Path Coefficient of .572 and the Critical Ratio
(CR) value of 3.912, greater than the critical value of ± 1.96
and obtained a significant probability (p) of *** which is
smaller than the specified error level (α) of 0.05 .
V. CONCLUSION AND RECOMMENDATION
Conclusion
The results of research conducted on visitors to Starbucks
Coffee outlets in Samarinda City. Based on the data analysis
carried out, the conclusion of the study can be drawn as follows:
1. Service Quality and Physical Environment have a
significant effect on Customer Satisfaction of visitors to
Starbucks Coffee outlets in Samarinda City. With the
findings of this study shows that in a consistent, good
quality service and Physical Environment in this case
conformity with expectations that are expected to create
customer satisfaction visiting Starbucks Coffee outlets in
Samarinda City.
2. Service Quality and Physical Environment have a direct and significant effect on Customer Loyalty visitors to
Starbucks Coffee outlets in Samarinda City. The findings
of this study indicate that customer loyalty is significantly
influenced directly by Service Quality and Physical
Environment. The results of this study also support the
findings of research conducted by [25]
3. Customer Experience has no significant effect on Customer
Satisfaction and Customer Loyalty on visitors to Starbucks
Coffee outlets in Samarinda City. With the findings of this
study indicate that customer experience of the product or service provided is not a determinant key to determining
customer satisfaction as well as customer loyalty.
4. Customer Satisfaction has a significant effect on Customer
Loyalty visitors to Starbucks Coffee outlets in Samarinda
City. The findings of this study indicate that customer
loyalty can be influenced by the level of customer
satisfaction where products and services offered provide
satisfaction to Starbucks Coffee outlets in Samarinda.
Recommendation
Based on the conclusions of this study, it is advisable for the
company to maintain and or improve Service Quality and
Physical Environment variables because these two variables have a direct and significant effect on Customer Satisfaction as
an intervening variable and on Customer Loyalty and
Customer Satisfaction variables also have a direct and
significant effect. Towards Customer Loyalty so that Customer
Satisfaction variable is recommended to be maintained and / or
improved
REFERENCES
[1]. A.Parasuraman.,V Zeitham l. & L Berry. (1985), A Conceptuual model of
service quality and its implications for future research, Journal Of
Marketing, Vol 49.
[2] Arbuckle, J.L. and Wothke, W.(1999). AMOS users guide version 4.0.
Chicago, IL: Small Water
[3] Baker, J., Girewal, D. and Parasuraman, A. (1994), “The Influence of the
StoreEnvironment on Quality Inferences and Store Image”, Journal of
theAcademy of Marketing Science”, Vol.22, Fall, pp.328-39.
[4] Bloemer, J. Ruyter and Wetzel, M. 1998. “On The Relationship Between
Perceived Service Quality, Service Loyalty and Switching Cost”.
International Journal of Industry Management, 107 (5): 57-62
[5] Cronin, JR, J. Joseph; Michael K. Brady, G; and Thomas M. Hult (2000),
“Assessing the Effects of Quality, Value, and Customer Satisfaction on
Consumer Behavioral Intentions in Service Environments”. Journal of
Retailing, Vol. 76, No. 20, pp. 193-218
[6] Fandy, Tjiptono, 2000. Service Management, Second Edition. Andy
Offset, Yogyakarta
[7]. Gerson, R., 2001, Measuring Customer Satisfaction: A Guide to Creating
Quality Services, PPM Publishers, Jakarta
[8] Hair J.F. et.al (1995), “Multivariate Data Analysis With Reading”,
Fourth Edition, Prentice Hall. New Jersey
[9] Hair, et al 2006.Multivariate Data Analysis 6th Ed. New Jersey: Pearson
Education
[10] Kotler, Philip and Keller, 2007, Marketing Management, Volume I,
Twelfth Edition, PT. Index, Jakarta
[11] Kotler, Philip & Kevin Lane Keller. 2009. Marketing Management
Volume 1 edition 12. Translated by Bob Sabran. Jakarta: Erlangga
[12] Kotler, Philip and Gary Armstrong. 2012. Principles of Marketing.
Edition 13. Volume 1. Jakarta: Erlangga
[13] Levy & Weitz, 2001. Retailing Management, 4th edition. New York:
Mc.GrawHill, Irwin
[14] Lupiyoadi, Hamdani. (2006). Service Marketing Management, Second
Edition, Jakarta: Salemba Empat Publisher.
[15] Lovelock, Chistoper and Jochen Wirtz. 2011. Service Marketing. New
Jersey USA : Pearson
[16] Ma'ruf, Hendri, 2005 Retail Marketing, Jakarta: PT Gramedia Main
Library
[17] Meyer, C. and Schwager, A. (2007), “Understanding customer experi-
ence”, Harvard Business Review, Vol. 85 No. 2, pp. 116-126.
Advances in Economics, Business and Management Research, volume 75
127

[18] Mursid, M. 1993. Marketing Management. Ed 1,. Jakarta: Ministry of
Education and Culture Open University
[19] Oliver, R. L. (1997). Satisfaction: A Behavioral Perspective on the
Consumer. New York: McGraw Hill.
[20] Peter J. Paul dan Olson Jerry C. (2010). Cunsumer Behavior and
Marketing Strategy 9th
ed. New York, USA: Mc Graw Hill
[21] Rini, Endang Sulistya. 2009. Creating a Consumer Experience with
Experimental Marketing. Journal of Business Management. Vol II, No
1, h. 15-20
[22] Schiffman, Leon G. dan Leslie Lazar Kanuk. 2010. Consumer
Behaviour Tenth Edition. Pearson Education.
[23] Schmitt, B. H. (1999). Experiential Marketing: How to Get Customer to
Sense, Feel, Think, Act, Relate. New York: Free Press
[24] Tjiptono, Fandy& Chandra, Gregorius. (2005). Service Quality &
Statisfaction. Edition II. Yogyakarta: Andi Publisher
[25] Yao-Kuei Lee, (2016) “Impact Of Government Policy and Environment
Quality On Visitor Loyalty To Festivals: Moderating Effect of Revisit
and Occupation Ty
[26]. Zeithaml, V. & Bitner, M. 2003. Services Marketing: Integrating
Customer Focus across the Firm, International Edition, New York:
McGraw-Hill/Irvin
Advances in Economics, Business and Management Research, volume 75
128