Embed Size (px)
Citation preview
ANALYSIS OF ELECTRICAL SURGES IN AJAOKUTA POWER SYSTEM
NETWORK, NIGERIA
By
ROTIMI, Makanjuola Shola
AAU/SPS/FET/ELE/M.Eng/11/03767
DEPARTMENT OF ELECTRICAL AND ELECTRONICS ENGINEERING,
SCHOOL OF POSTGRADUATE STUDIES,
AMBROSE ALLI UNIVERSITY,
EKPOMA, NIGERIA.
AUGUST, 2018
i
ANALYSIS OF ELECTRICAL SURGES IN AJAOKUTA POWER SYSTEM
NETWORK, NIGERIA
By
ROTIMI, Makanjuola Shola
AAU/SPS/FET/ELE/M.Eng/11/03767
HND (Kwara Poly), PGD Eng (Unizik)
A THESIS IN THE DEPARTMENT OF ELECTRICAL AND ELECTRONICS
ENGINEERING, SUBMITTED TO THE SCHOOL OF POSTGRADUATE STUDIES,
IN PARTIAL FULFILMENT OF THE REQUIREMENTS FOR THE AWARD OF
MASTERS DEGREE (M.Eng) IN ELECTRICAL POWER/MACHINES, AMBROSE
ALLI UNIVERSITY, EKPOMA, NIGERIA.
AUGUST, 2018
ii
DECLARATION
I hereby declare that this research work was done by ROTIMI, Makanjuola Shola and to the
best of my knowledge, this research work has not been submitted elsewhere for the award of
Masters of Engineering or any other degree or diploma.
…….………………………………….. ………………………………..
ROTIMI, Makanjuola Shola Date
AAU/SPS/FET/ELE/M.Eng/11/03767
iii
CERTIFICATION
This is to certify that this study was carried out by ROTIMI, Makanjuola Shola with
Matriculation number AAU/SPS/FET/ELE/M.Eng/11/03767, in the Department of Electrical
and Electronics Engineering, School of Postgraduate Studies, Ambrose Alli University,
Ekpoma.
…………………………….. …………………………
Engr. Dr. Osahenvemwen, O. A. Date
Supervisor
Department of Electrical and Electronics Engineering,
Faculty of Engineering and Technology,
Ambrose Alli University,
Ekpoma, Nigeria.
…………………………….. …………………………
Engr. Dr. Okundamiya, M. S. Date
Head of Department
Department of Electrical and Electronics Engineering,
Faculty of Engineering and Technology,
Ambrose Alli University,
Ekpoma, Nigeria.
..............Signed.................... ………………………
External Examiner Date

iv
DEDICATION
This work is dedicated to the glory of Almighty God for his unmerited favour throughout the
programme

v
ACKNOWLEDGEMENT
I am highly grateful to the Almighty God for the successful completion of this project work,
which is the climax of the M.Eng degree programme. My gratitude goes to my supervisor:
Engr. Dr. A. O Osahenvemwen, the present Head of Department: Engr. Dr. M. S. Okundamiya,
and the Postgraduate Coordinator Engr. Dr. O. Omorogiuwa, for their brotherly support and
counselling throughout the period of putting this project together.
I am also grateful for the encouraging role played by Engr. Dr. M. J. E. Evbogbai,
Engr. Dr. C. E. Ojeabu and Engr. J. K. Yeboah for their input cannot be overemphasized. Also,
I wish to acknowledge all the staff of the Department of Electrical and Electronics Engineering,
Ambrose Alli University Ekpoma.
I thank the organization and management staff of Ajaokuta Steel Company Limited and PHCN
for the rare privilege and support given to me for the successful completion of the project work.
I am grateful to my wife and children for their patient and support given to me till completion
of this course.
Thank be to God Almighty for his infinite mercies and protection throughout the period of this
programme.
vi
ABSTRACT
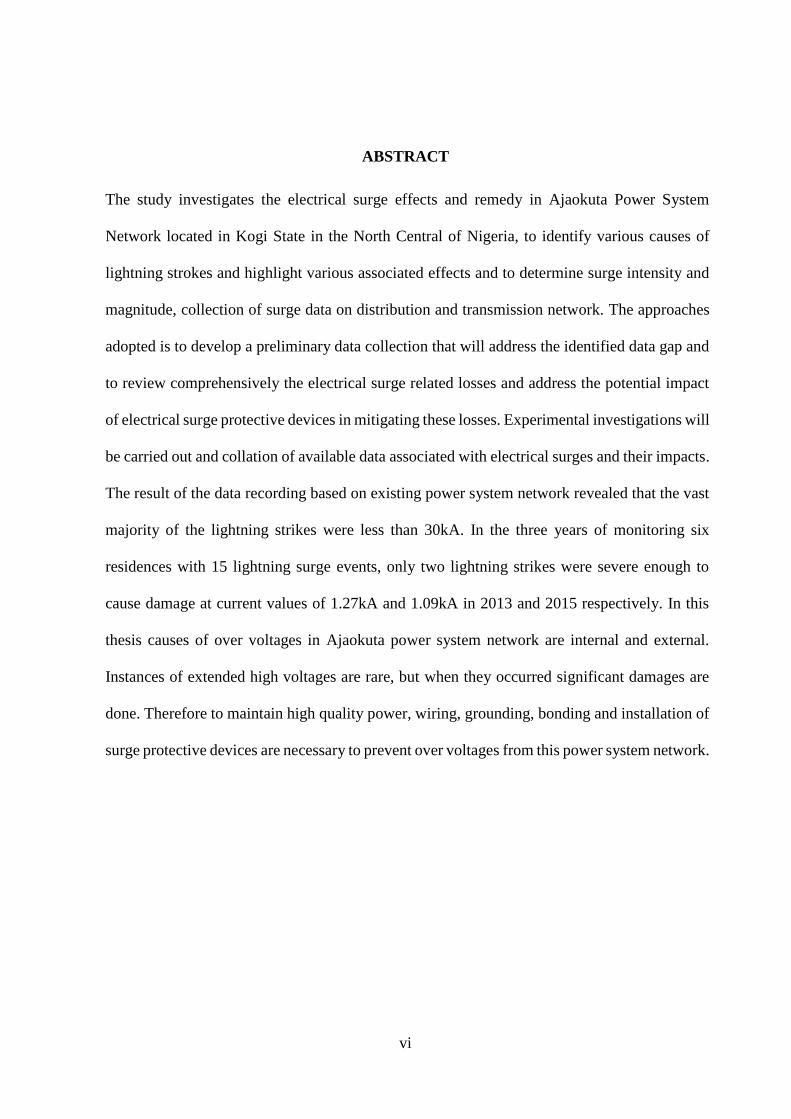
The study investigates the electrical surge effects and remedy in Ajaokuta Power System
Network located in Kogi State in the North Central of Nigeria, to identify various causes of
lightning strokes and highlight various associated effects and to determine surge intensity and
magnitude, collection of surge data on distribution and transmission network. The approaches
adopted is to develop a preliminary data collection that will address the identified data gap and
to review comprehensively the electrical surge related losses and address the potential impact
of electrical surge protective devices in mitigating these losses. Experimental investigations will
be carried out and collation of available data associated with electrical surges and their impacts.
The result of the data recording based on existing power system network revealed that the vast
majority of the lightning strikes were less than 30kA. In the three years of monitoring six
residences with 15 lightning surge events, only two lightning strikes were severe enough to
cause damage at current values of 1.27kA and 1.09kA in 2013 and 2015 respectively. In this
thesis causes of over voltages in Ajaokuta power system network are internal and external.
Instances of extended high voltages are rare, but when they occurred significant damages are
done. Therefore to maintain high quality power, wiring, grounding, bonding and installation of
surge protective devices are necessary to prevent over voltages from this power system network.
vii
CONTENTS
Page
DECLARATION ii
CERTIFICATION iii
DEDICATION iv
ACKNOWLEDGEMENT v
ABSTRACT vi
CONTENTS vii
LIST OF TABLES xi
LIST OF FIGURES xii
LIST OF PLATES xiv
LIST OF ABBREVIATIONS xv
CHAPTER ONE: INTRODUCTION 1
1.1 Background to the Study 1
1.2 Justification for the Study 2
1.3 Objectives of the Study 5
1.4 Scope and Limitation 5
1.5 Research Methodology 6
1.6 Thesis Arrangement 7
CHAPTER TWO: LITERATURE REVIEW 8
2.1 Surge Protection Fundamentals 8
2.2 Sources of Surges 8
2.3 Lightning Surges 12
2.4 Schneider Electric Surge Experimental Investigation. 13
viii
2.5 Utility Switching 14
2.6 Facility Internal Switching 16
2.7 Surge Effects 16
2.8 The Benefits of Power Quality and Protection Products 19
2.9 The Importance of Protecting the Power Network. 19
2.10 Practice for Powering and Grounding Electronic Equipment 19
2.11 Potential impact of Electromagnetic Interference (EMI) 20
2.12 Electrical System Surge Protection 21
2.13 Surge Arresters 22
2.14 The difference Between the Terms “Surge Arrester” and “Transient Voltage Surge
Suppressor (TVSS) 24
2.15 Protective Devices 25
2.15.1 One-Port Parallel-Connected Devices 25
2.15.2 Surge Protective Device (SPD) 25
2.15.3 Integral SPD Issues 25
2.15.4 Hybrid Design 26
2.15.5 Two-Port (Series-Connected) Devices 27
2.16 Active Tracking Filter (ATF) 27
2.16.1 Harmonic Filter 28
2.17 Surge Protection with Filtering 28
2.18 Attenuation in an SPD 28
2.19 Using Active Tracking Filters To Control Low- And High-Voltage Transients 29
2.20 CWG 1.2/50 μs Voltage Open-circuit Surge Waveform 30
ix
2.21 Filters with Air Cored Inductors 31
2.22 Voltage Regulator 32
2.23 Line Conditioner 32
2.24 The difference between series connected filters and parallel connected SPDs 32
2.25 Using Surge Suppression to Control High-Voltage Transients 34
2.26 DC Low Voltage Surge Protection 34
2.26.1 DC Power Protection 35
2.26.2 Video Line Protection 35
2.26.3 Data Line Protection 35
2.26.4 Signal Line Protection 35
2.26.5 Silicon Avalanche Diode (SAD) 35
2.26.6 Fuse 36
2.26.7 PTC (Positive Temperature Coefficient) 36
2.27 Comparisons – Fuse Vs. PTC 37
2.28 Surge Protective Devices (SPDs) 37
2.29 SPD Classification 38
2.30 SPD Ratings 40
2.31 Residential Surge Protection 40
2.32 Power Quality Standards 41
2.33 Surge Suppression Standards Overview 41
2.34 Standard for Transient Voltage Surge Suppressors (SPDs) 42
2.35 National Electrical Code (NEC) and National Fire Protection Association (NFPA) 44
2.36 Research Focus 44
x
CHAPTER THREE: MATERIALS AND METHODS 45
3.1 Site and location of the Study 45
3.2 Experimental Methods 52
3.3 Experimental Procedure 52
3.3.1 Experimental Procedure No. 1 53
3.4 Data presentation 54
3.5 Data Bank Presentation from 2013 - 2015 54
3.6 Experimental Procedure NO. 3 58
CHAPTER FOUR: RESULTS AND DISCUSSION 61
4.1 Lightning Surge Stroke Data obtained for Six Residences 61
4.2 Lightning Stroke Data Characteristics 63
4.3 Arresters Failure Rates on Transmission Lines and their Effects 64
4.4 Findings of the study 68
4.5 Contributions to Knowledge 69
CHAPTER FIVE: CONCLUSION AND RECOMMENDATIONS 70
5.1 Conclusion 70
5.2 Recommendations 70
REFERENCES 72
xi
LIST OF TABLES
Page
Table 2.1 Sources of Surges 10
Table 3.1 Technical Characteristics of the used surge Arresters 48
Table 3.2 Surge data; April to October, 2013 50
Table 3.3 Surge data; March to October, 2014 50
Table 3.4 Surge data; March to October, 2015 51
Table 3.5 Positive Lightning from 2013 to 2015 52
Table 3.6 Negative Stroke from 2013 to 2015 53
Table 3.7 F.F.R% July – August, 2013 55
Table 3.8 F.F.R% August – September, 2014 55
Table 3.9 F.F.R% August – September, 2015 55
Table 3.10 Average F.R.R. for Regional Interval 56
xii
LIST OF FIGURES
Page
Figure 2.1 Nature of Lightning Strokes 9
Figure 2.2 Typical utility capacitor switching transient Characteristics
reaching 134% voltage, observed up line from the capacitor 10
Figure 2.3 Feeder current characteristics associated with Capacitor switching event 11
Figure 2.4 Dynamic overvoltage characteristics during transformer switching 12
Figure 2.5 Lightning Flash Density Map 13
Figure 2.6 Typical Lightning Surge Current 14
Figure 2.7 Voltage Waveform for Capacitor Switching Transient 15
Figure 2.8 CWG 8/20 μs Current Waveform 29
Figure 2.9 Protected Equipment 29
Figure 2.10 Parallel Connected SPD 31
Figure 2.11 Series Connected Filter 31
Figure 2.12 Protected Equipment 32
Figure 2.13 Silicon Avalanche Diode 34
xiii
Figure 2.14 Number of Test Occurrences before Failure 35
Figure 2.15 Three-Stage Hybrid Signature Circuit 35
Figure 3.1 Basic Structure of the Power System Network in Ajaokuta 44
Figure 3.2 Location of SPD in the switchboard (in parallel) 48
Figure 3.3 Cross-section drawing view of a polymer housed Surge arrester 48
Figure 3.4 Schematic Diagram of Experiment No 1 49
Figure 4.1 Stroke Peak Current; April to October 2013 57
Figure 4.2 Stroke Peak Current; March to October 2014 58
Figure 4.3 Stroke Peak Current: March to October 2015 58
Figure 4.4 Stroke Peak Current Percentage (Positive lightning stroke) 59
Figure 4.5 Stroke Peak Current Percentage (Negative Polarity) 60
Figure 4.6 Region 1 %FFR July to August 2013 61
Figure4.7 Region 2 %FFR August to September 2014 61
Figure4.8 Region3 %FFR August to September 2015 61
Figure 4.9 Tower Footing Resistance (OHM) 62
Figure 4.10 Arrester Interval (KM) 63
xiv
LIST OF PLATES
Page
Plate 1.1 Ajaokuta Nigeria Latitude and Longitude 6
Plate 2.1 Circuit Breaker Failure Caused by surge Voltage 16
Plate 2.2 Copper Busbar Melted by Surge Current 17
Plate 2.3 Circuit Board Damaged Caused by Surge Voltage 17
Plate 2.4 Micro Circuit Damage Caused by Surge Voltage 17
Plate 3.1 Ajaokuta Nigeria latitude longitude 43
Plate 3.2 Step for grid Lines 44
Plate 3.3 Main Step –Down Substation I 44
Plate 3.4 Surge Protector 45
Plate 3.5 Earth Ground Tester (Fluke 1625) 45
Plate 3.6 Meter Board of Transmission Station 46
Plate 3.7 Main control Board of Transmission Station 47
Plate 3.8 Export and Import Power at Transmission Station 47
xv
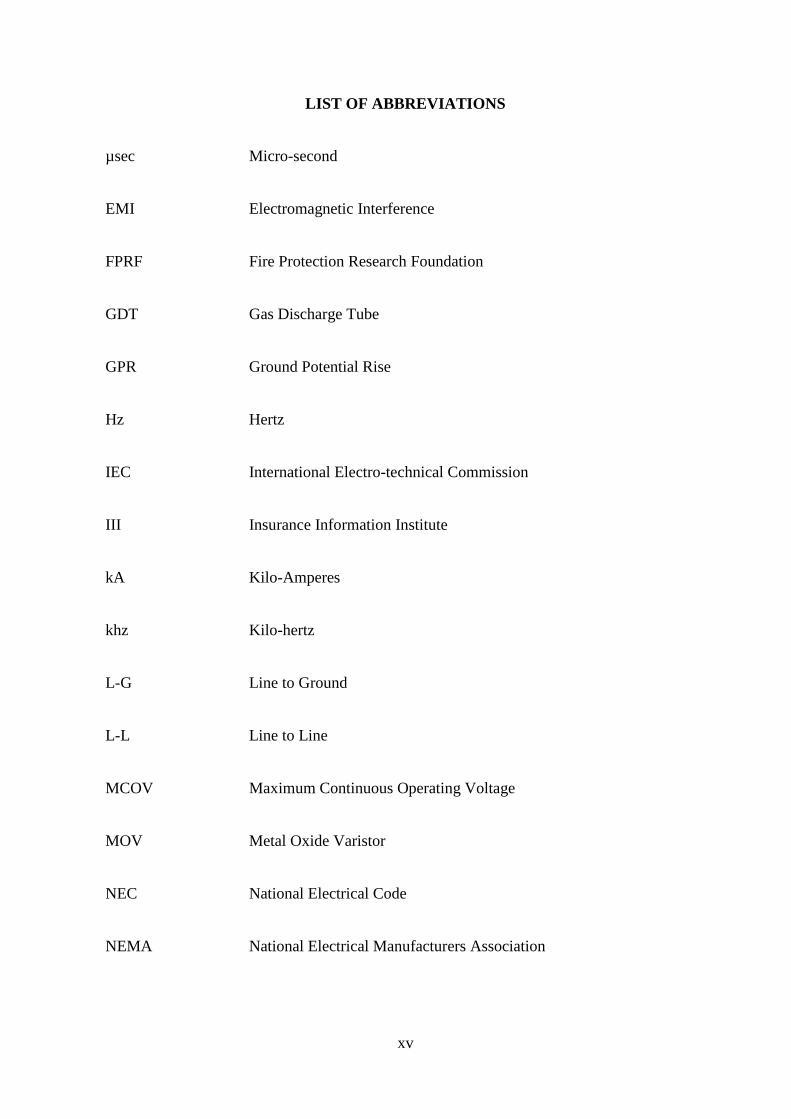
LIST OF ABBREVIATIONS
µsec Micro-second
EMI Electromagnetic Interference
FPRF Fire Protection Research Foundation
GDT Gas Discharge Tube
GPR Ground Potential Rise
Hz Hertz
IEC International Electro-technical Commission
III Insurance Information Institute
kA Kilo-Amperes
khz Kilo-hertz
L-G Line to Ground
L-L Line to Line
MCOV Maximum Continuous Operating Voltage
MOV Metal Oxide Varistor
NEC National Electrical Code
NEMA National Electrical Manufacturers Association
xvi
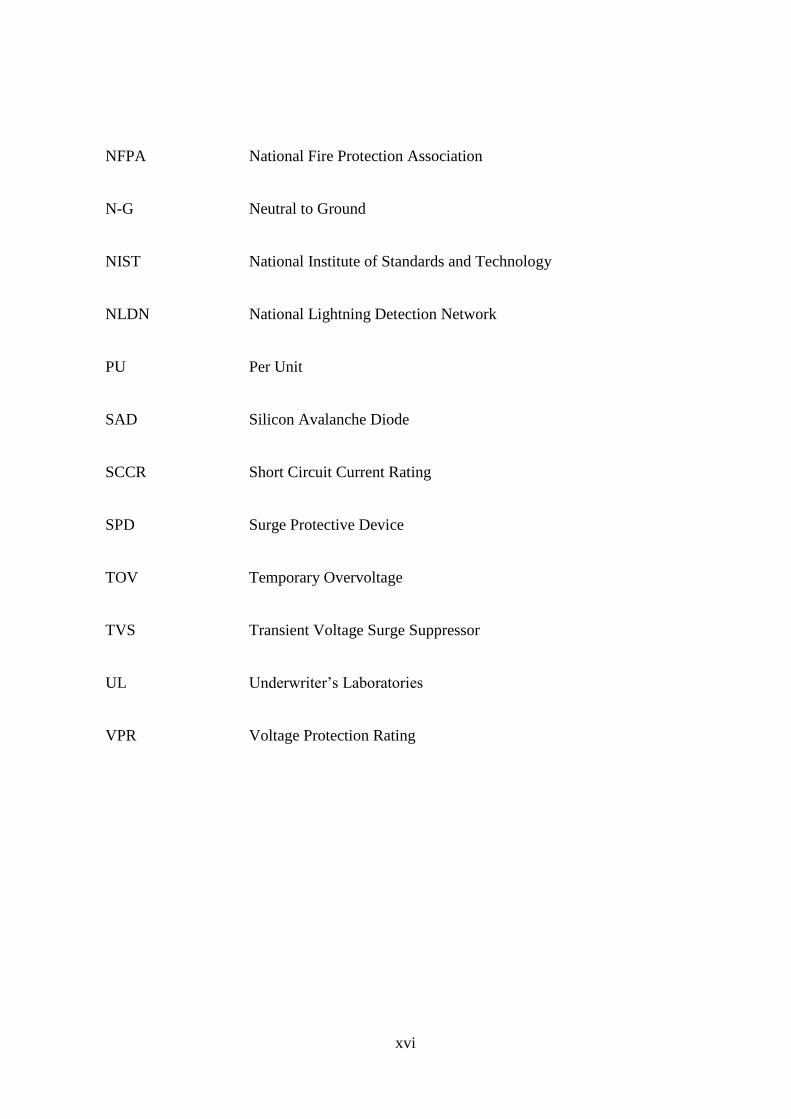
NFPA National Fire Protection Association
N-G Neutral to Ground
NIST National Institute of Standards and Technology
NLDN National Lightning Detection Network
PU Per Unit
SAD Silicon Avalanche Diode
SCCR Short Circuit Current Rating
SPD Surge Protective Device
TOV Temporary Overvoltage
TVS Transient Voltage Surge Suppressor
UL Underwriter’s Laboratories
VPR Voltage Protection Rating
1
CHAPTER ONE
INTRODUCTION
1.1 Background to the Study
Degradation, disruption and destruction are three “Ds” that affect power quality. Electrical
power disturbances may be called a surge, sag, spike, swell, transient, fluctuation, interruption,
or electrical line noise. All these electrical power disturbances are abnormalities and deviations
from normal performance of voltage sources (Gustavo et al, 2003; Sukhdeo, 2013). These
Electrical power disturbances may last for a short period or a long time (continuous).
In general, a surge is a transient wave of current, voltage or power in an electric circuit. In power
systems in particular this is likely the most common context that we relate surges to a surge, or
transient is a sub cycle over-voltage with duration of less than a half-cycle of the normal voltage
waveform. A surge can be either positive or negative polarity, can be additive or subtractive
from the normal voltage waveform, and is often oscillatory and decaying over time. Surges or
transients are brief over-voltage spikes or disturbances on a power waveform that can damage,
degrade, or destroy electronic equipment, industrial, or manufacturing facility, commercial
building. Transient can reach amplitudes of tens of thousands of volts. Surges are generally
measured in microseconds and can be internal over voltages or external over-voltages (Khalid,
2011; Teru, 2010).
Internal over voltages originate in the system itself and may be transient, dynamic or stationary.
Those of a transient nature will have a frequency unrelated to the normal system frequency and
will persist a few cycles only. They can be caused by the operation of circuit breakers when
switching inductive or capacitive loads, “current chopping” when interrupting very small
2
currents or by the sudden grounding of one phase of a system operating with insulated neutral
(Hasssan, 2017 and Makinde et al, 2014).
Approximately 70% of electrical threats are internally generated and the remaining 30% of
issues are external over voltages that can be caused by atmospheric discharges such as static
charges or lightning strokes and are therefore not related to the system (Nema, 2014). They are
often of such magnitude as to cause considerable stress on the insulation and, in the case of
lightning will vary in intensity depending on how directly the line is struck , i.e., directly by the
main discharge, directly by branch or streamer, or by induction due to a flash passing near to
but not touching the line. Power quality is measured by the interaction of electric power with
electrical equipment (Dharmender, 2014; Mehdi et al, 2014).
This thesis is to ensure an uninterrupted supply of electricity that is (power quality) in Ajaokuta
power system network. High quality power can be achieved by ensuring that wiring, grounding
and bonding are up to standards. Once this is verified then the right power quality device is
selected such as Surge Protective Devices (SPDs), low-pass filters, data and signal line
protectors to prevent damage from surges and electrical line noise.
1.2 Justification for the Study
Surges or over voltages have caused stresses, disruption and damages to numerous equipment
and gadgets in Ajaokuta power system network, such as high and low voltage induction motors,
synchronous motors, transformers, circuit breakers, reactors, capacitor banks, generators,
contactors, relays, etc. Khalid (2011) presents the power quality problems, issues, such as power
surge related international standard, effect of power quality problem in different apparatuses
and methods for its correction. Iit-Bhu (2014) presents investigation of different types of
premature failures that are observed during various full-scale testing of transmission line towers
and their results are discussed in detail.
3
Importance of design assumptions and connection detailing in overall performance of towers
were studied (MCoy, 2013). Due to the opening or closing of circuit breakers and disconnect
switches in Gas Insulated Substations (GIS), especially in the pumped storage power stations,
Very Fast Transient Over-Voltages (VFTO) are generated (Sukhdeo, 2013). The main causes
of over voltages in power system are switching and lightning. The over voltages can damage
the insolation of lines and equipment connected to the power system. In other to protect
insulations and equipment of the power systems from the damaging effects of lightning over
voltages, metal oxide surge arresters have been used.
Because of dynamic behaviour of the surge arresters, they cannot be simulated using non-linear
resistors. Therefore, several models are proposed to simulate the dynamic properties of surge
arresters. IEEE and pinceti models are the main models proposed that are for the simulation of
the dynamic behaviour of surge arresters. In this thesis, for identification of surge arrester
parameters and a novel algorithm have been proposed and then a comparison among IEEE
model and pinceti model has been investigated (Mehdi et al, 2014). Mungkung et al. (2007)
investigated the temporary increase in voltage in the transmission line system. Lightning is the
most harmful for destroying the transmission line and setting devices so it is necessary to study
and analyze the temporary increase in voltage for designing and setting the surge arrester. This
analysis describes the lightning wave in transmission line with 115 kV voltage level in Thailand
by using ATP/EMTP program to create the model of the transmission line and lightning surge.
Because of the limit of this program, it must be calculated for the geometry of the transmission
line and surge parameter and calculation in the manual book for the closest value of the
parameter.
On the other hand, for the effects on surge protector when the lightning comes, the surge arrester
model must be standardized as metropolitan electrical authority’s standard. The researcher
4
compared the real information to the result from calculation Shehab (2013) presents an
overview of how the lightning strikes and their effects on power distribution systems can be
modeled, where the results gave an understanding of how to eliminate the devastating impact,
caused by lightning, by using lightning arresters.
Many conventional protective devices installed for protection of excessive fault current in
electric power systems, especially at the power stations are the circuit breakers, tripped by over-
current protection relay (Okundamiya et al., 2009). These devices the response-time delay that
allows initial two or three fault current cycles to pass through before getting activated.
Superconducting Fault Current Limiter (SFCL) is innovative electric equipment which has the
capability to reduce fault current level within the first cycle of fault current. The application of
the Fault Current Limiter (FCL) would not only decrease the stress on network devices, but also
can offer a connection to improve the reliability of the power system (Makinde et al., 2014).
This research is investigate the effects of electrical surge and the possible remedy in Ajaokuta
power system network. Consideration of three basic approaches which includes; experimental
investigation would be carried out on lightning surges in the distribution lines in some
residences of Ajaokuta Power System Network, to develop data bank for lightning stroke and
magnitude of cloud to earth lightning strokes to be used as a factor in determining the required
maximum surge current of SPDs. For this reason, the maximum surge current of an SPD could
be selected based on perceived lightning stroke levels. In addition, a test would be carried out
on the three 132kV transmission lines of Ajaokuta power interconnected system to determine
the variation of surge arresters failure probability with tower footing resistance for each of the
three case studies to be analyzed.
5
1.3 Objectives of the Study
The overall aim of this study is to investigate the effects of electrical surge and the possible
remedy in Ajaokuta power system network.
The specific objectives are to:
(a) identify various causes of lightning stroke and highlight various associated effect in
electrical equipment;
(b) determine the lightning stroke intensity and magnitude;
(c) analyse the data obtained base on set time duration and area under investigation;
(d) determine the variation of surge arresters failure probability with Tower Footing
Resistance (TFR) at 132kV operation transmission lines of Ajaokuta and;
(e) design a surge protection scheme (mechanism) for equipment.
1.4 Scope and Limitation
This research focuses on the effects of electrical surge and it remedy in Ajaokuta power system
network in Kogi State, Nigeria. It involves recent surge data collection and analysis in the
distribution and transmission units to determine the SPDs locations and ratings required in
facilities and residences.
6
1.5 Research Methodology
Experimental investigation will be carried out in this study in order to achieve the desired
objectives of this study as follows:
(a) an experimental investigation would be carried out on lightning surges that flow in the
distribution lines in some residences of Ajaokuta Power System Network. Lightning
surge detectors shall be installed in six (6) residences and monitored for three years,
2013 to 2015 to ascertain the effects of lightning surge on the distribution lines;
(b) data Bank Presentation From 2013 – 2015: This data Bulletin would provide objective
data about lightning stroke intensity based on a scientific study. Since 1995 the power
system network of Ajaokuta has set up the lightning data bank to collect data on the total
number and magnitude of cloud to earth lightning strokes to be used as a factor in
determining the required maximum surge current of Surge Protective Devices (SPDs).
For this reason, the maximum surge current of an SPD could be selected based on
perceived lightning stroke levels; and
(c) tests would be carried out on the three 132kV operation transmission lines of Ajaokuta
power interconnected system to determine the variation of surge arresters failure
probability with Tower Footing Resistance (TFR) for each of the three case studies to
be analysed; and to determine the arrester failure probability interval based on the
transmission line, these lines shall be carefully selected due to: their high rate of failure
during thunderstorms, their sufficient sufficient time in service and the significant
different characteristics, such as ground flash density and the tower footing resistance
which exist through their lengths, since they run through the same region.
7
1.6 Thesis Arrangement
Chapter one is Introduction, which consist of Background to the study, justification of the study,
objectives of the study, scope and limitation, research methods. Chapter two is the Literature
Review, chapter three contains Materials and Method, which consist of three experimental
procedures. Chapter four contains Result and Discussion, findings, contributions to the
knowledge, and chapter five contains conclusion and recommendations.
8
CHAPTER TWO
LITERATURE REVIEW
2.1 Surge Protection Fundamentals
This section provides an overview of electrical surges and protection against the effects of these
destructive surges.
2.2 Sources of Surges
A surge is a transient wave of voltage or current (Khalid, 2011). The duration is not tightly
specified but is usually less than a few milliseconds. The following are typical sources of
surges:
(a) Lightning (External to the network).
(b) Utility switching, including capacitor switching (Internal to the network).
(c) Equipment switching and switching inductive loads within a facility (Internal to the
network).
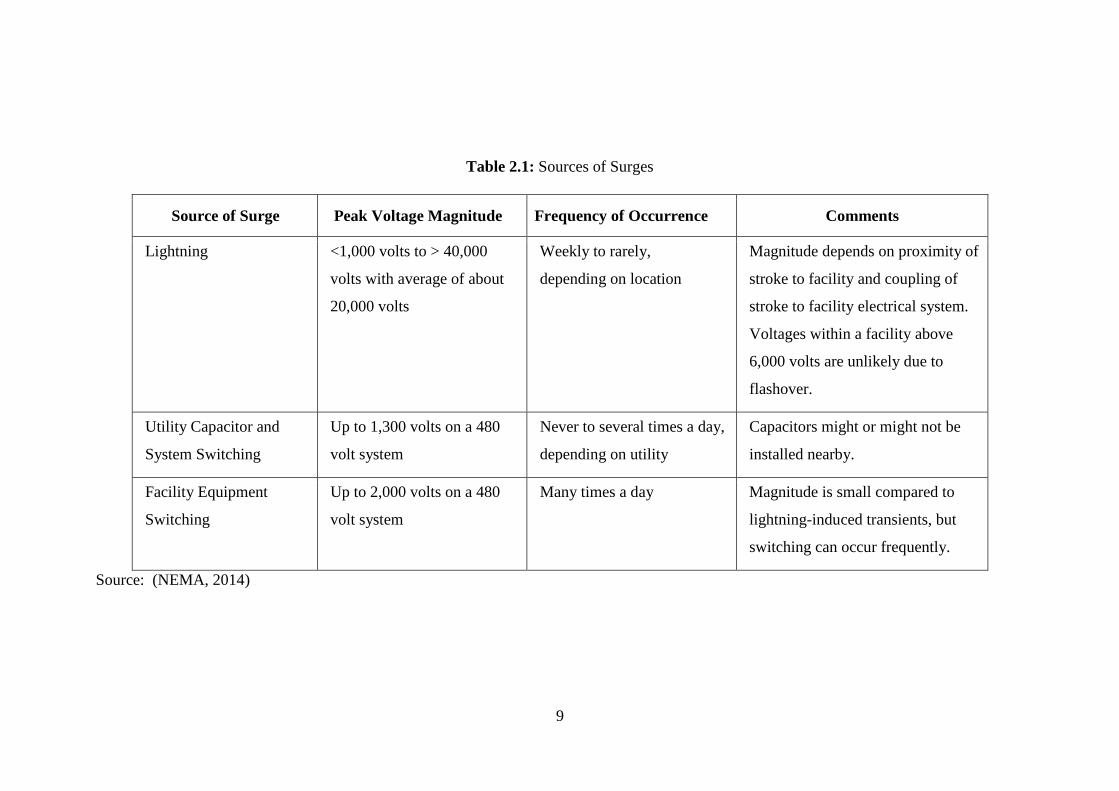
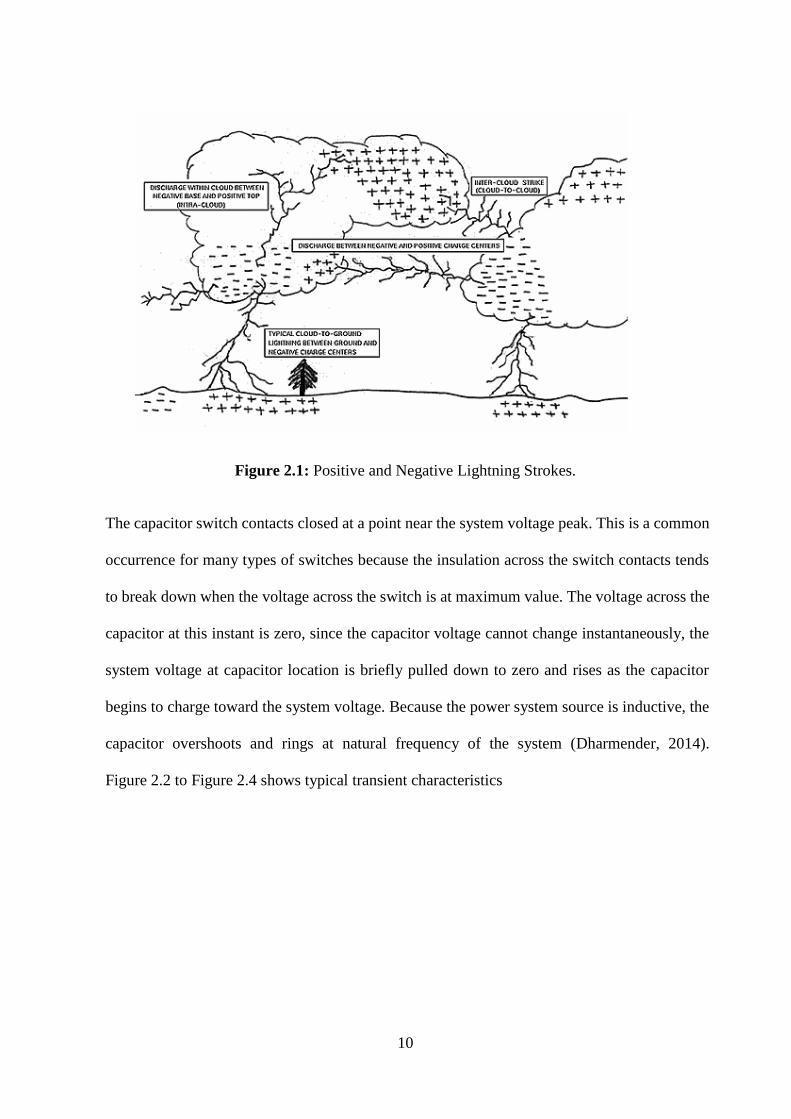
Table 2.1 summarizes the effects of these various surge sources while Figure 2.1 shows positive
and negative Lightning Strokes.
9
Table 2.1: Sources of Surges
Source of Surge Peak Voltage Magnitude Frequency of Occurrence Comments
Lightning <1,000 volts to > 40,000
volts with average of about
20,000 volts
Weekly to rarely,
depending on location
Magnitude depends on proximity of
stroke to facility and coupling of
stroke to facility electrical system.
Voltages within a facility above
6,000 volts are unlikely due to
flashover.
Utility Capacitor and
System Switching
Up to 1,300 volts on a 480
volt system
Never to several times a day,
depending on utility
Capacitors might or might not be
installed nearby.
Facility Equipment
Switching
Up to 2,000 volts on a 480
volt system
Many times a day Magnitude is small compared to
lightning-induced transients, but
switching can occur frequently.
Source: (NEMA, 2014)
10
Figure 2.1: Positive and Negative Lightning Strokes.
The capacitor switch contacts closed at a point near the system voltage peak. This is a common
occurrence for many types of switches because the insulation across the switch contacts tends
to break down when the voltage across the switch is at maximum value. The voltage across the
capacitor at this instant is zero, since the capacitor voltage cannot change instantaneously, the
system voltage at capacitor location is briefly pulled down to zero and rises as the capacitor
begins to charge toward the system voltage. Because the power system source is inductive, the
capacitor overshoots and rings at natural frequency of the system (Dharmender, 2014).
Figure 2.2 to Figure 2.4 shows typical transient characteristics
11
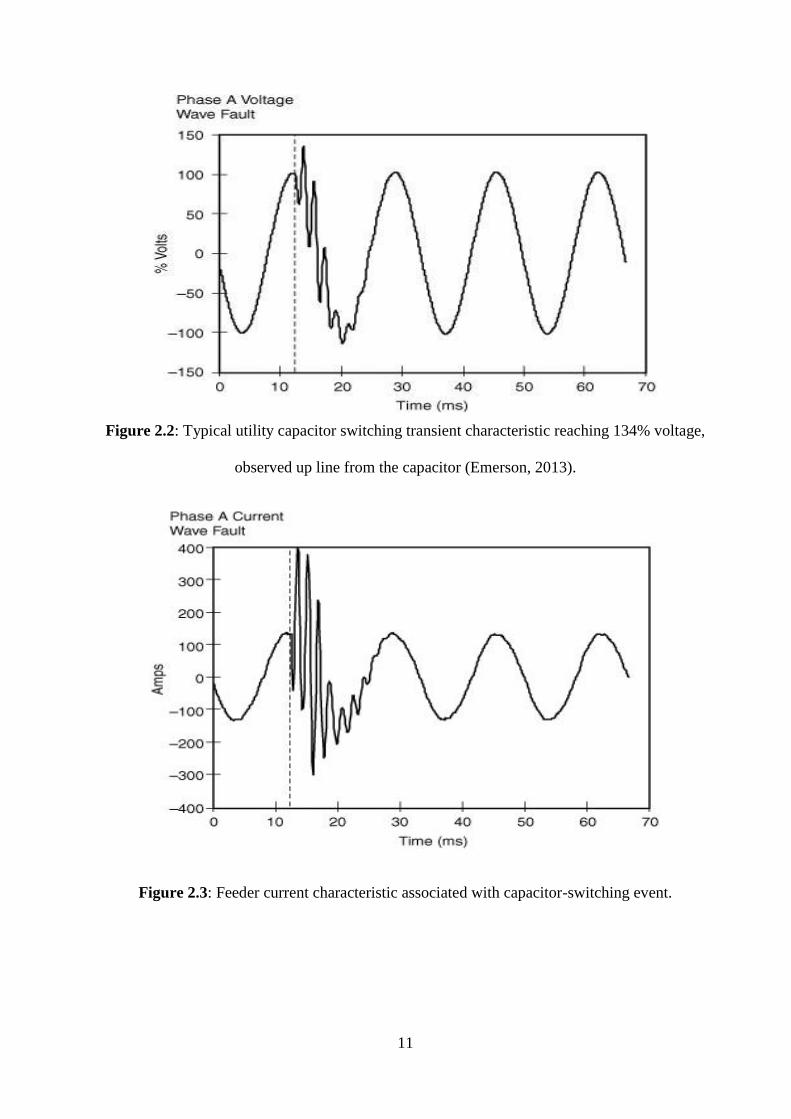
Figure 2.2: Typical utility capacitor switching transient characteristic reaching 134% voltage,
observed up line from the capacitor (Emerson, 2013).
Figure 2.3: Feeder current characteristic associated with capacitor-switching event.
12
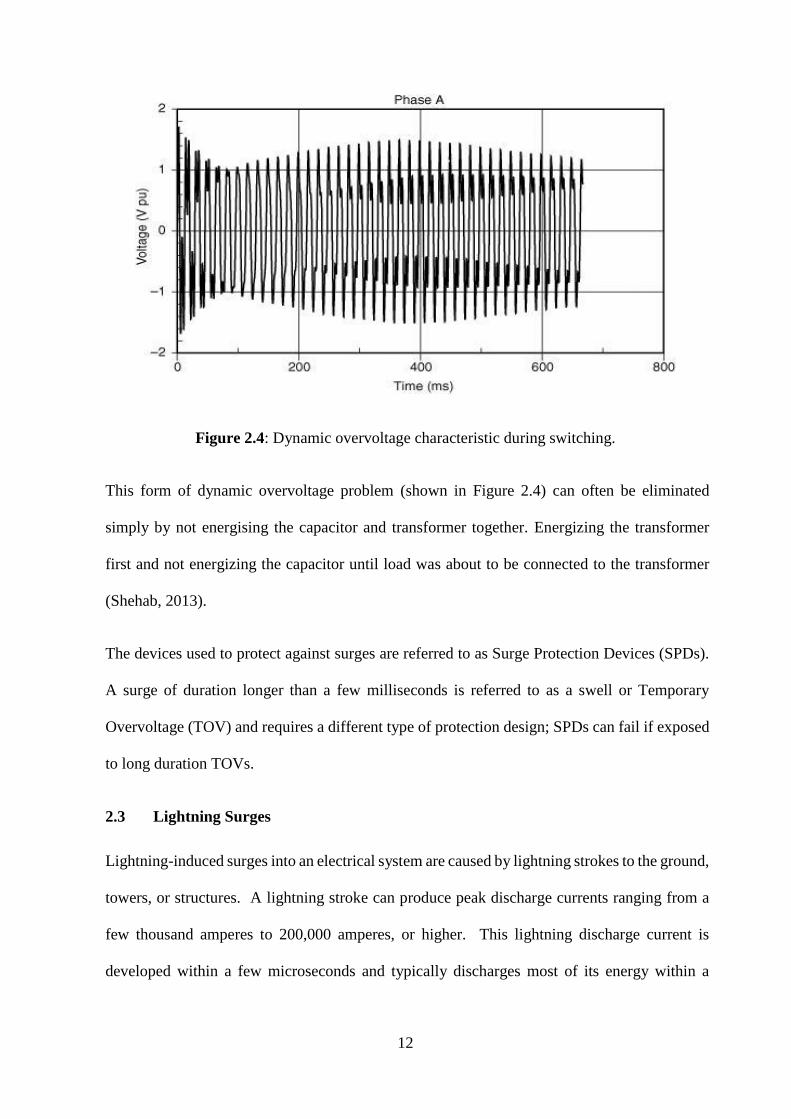
Figure 2.4: Dynamic overvoltage characteristic during switching.
This form of dynamic overvoltage problem (shown in Figure 2.4) can often be eliminated
simply by not energising the capacitor and transformer together. Energizing the transformer
first and not energizing the capacitor until load was about to be connected to the transformer
(Shehab, 2013).
The devices used to protect against surges are referred to as Surge Protection Devices (SPDs).
A surge of duration longer than a few milliseconds is referred to as a swell or Temporary
Overvoltage (TOV) and requires a different type of protection design; SPDs can fail if exposed
to long duration TOVs.
2.3 Lightning Surges
Lightning-induced surges into an electrical system are caused by lightning strokes to the ground,
towers, or structures. A lightning stroke can produce peak discharge currents ranging from a
few thousand amperes to 200,000 amperes, or higher. This lightning discharge current is
developed within a few microseconds and typically discharges most of its energy within a
13
millisecond. The location where a lightning stroke will occur is not completely predictable;
cloud-to-ground strokes have been recorded almost 20 miles from the base of the source cloud.
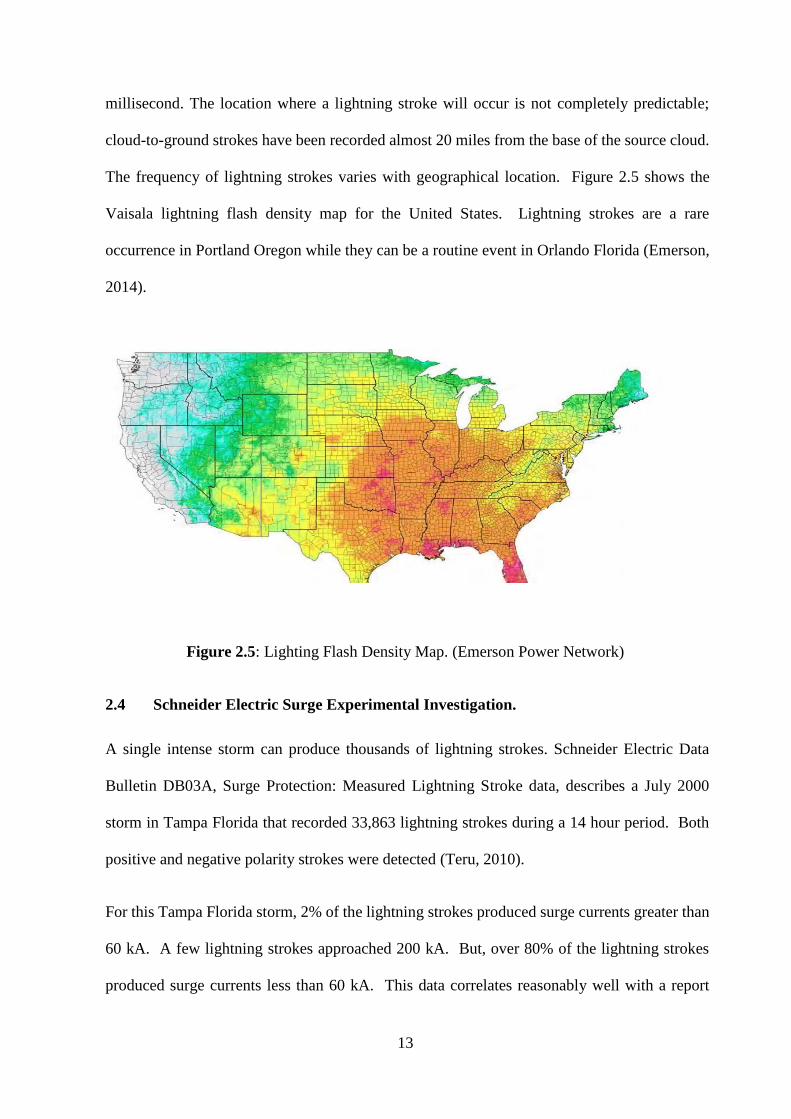
The frequency of lightning strokes varies with geographical location. Figure 2.5 shows the
Vaisala lightning flash density map for the United States. Lightning strokes are a rare
occurrence in Portland Oregon while they can be a routine event in Orlando Florida (Emerson,
2014).
Figure 2.5: Lighting Flash Density Map. (Emerson Power Network)
2.4 Schneider Electric Surge Experimental Investigation.
A single intense storm can produce thousands of lightning strokes. Schneider Electric Data
Bulletin DB03A, Surge Protection: Measured Lightning Stroke data, describes a July 2000
storm in Tampa Florida that recorded 33,863 lightning strokes during a 14 hour period. Both
positive and negative polarity strokes were detected (Teru, 2010).
For this Tampa Florida storm, 2% of the lightning strokes produced surge currents greater than
60 kA. A few lightning strokes approached 200 kA. But, over 80% of the lightning strokes
produced surge currents less than 60 kA. This data correlates reasonably well with a report
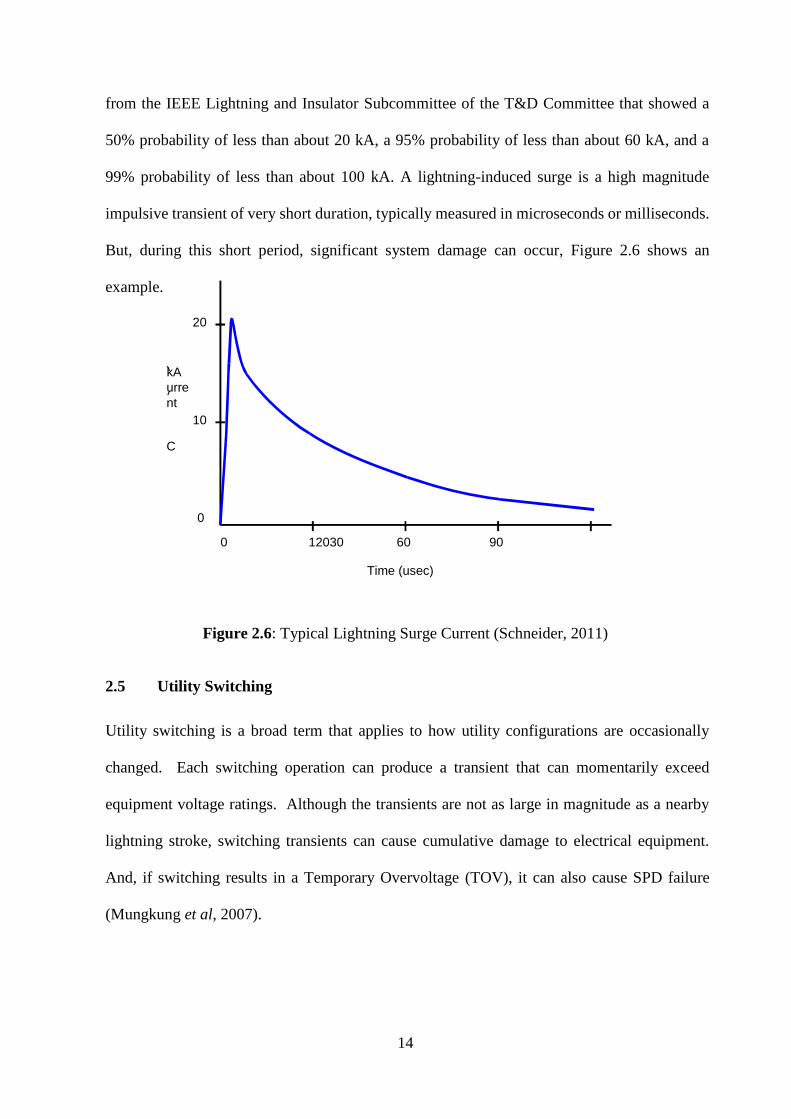
14
from the IEEE Lightning and Insulator Subcommittee of the T&D Committee that showed a
50% probability of less than about 20 kA, a 95% probability of less than about 60 kA, and a
99% probability of less than about 100 kA. A lightning-induced surge is a high magnitude
impulsive transient of very short duration, typically measured in microseconds or milliseconds.
But, during this short period, significant system damage can occur, Figure 2.6 shows an
example.
Figure 2.6: Typical Lightning Surge Current (Schneider, 2011)
2.5 Utility Switching
Utility switching is a broad term that applies to how utility configurations are occasionally
changed. Each switching operation can produce a transient that can momentarily exceed
equipment voltage ratings. Although the transients are not as large in magnitude as a nearby
lightning stroke, switching transients can cause cumulative damage to electrical equipment.
And, if switching results in a Temporary Overvoltage (TOV), it can also cause SPD failure
(Mungkung et al, 2007).
Time (usec)
C
urre
nt (
kA )
0 12030 60 90
0
20
10
15
Capacitor switching is a special case of utility switching. Capacitors might also be switched
periodically by large industrial power customers. Capacitor switching can be a common
everyday event, occurring several times each day in some locations, as the utility adjusts system
voltage and compensates for inductive loads (Kostas, 2007; Osahenvemwen et al., 2018).
Capacitor switching causes a surge voltage by the following process. The voltage across a
capacitor is zero before it is switched into the circuit. As a capacitor is switched, there is a
momentary short circuit across the capacitor as the system voltage is applied to the zero voltage
of the capacitor. At the capacitor location, the bus voltage momentarily experiences a step
change to zero volts. After the initial step change, the voltage recovers and then overshoots as
the system eventually return to its steady state value. Thereafter, the system oscillates until
damping returns the voltage to its steady-state value (Okundamiya and Nzeako, 2010). During
the initial oscillation period, the peak transient voltage can approach 200 percent of the normal
peak system voltage (common peak surge voltages can range from 150 percent to 180 percent
of normal).
Another factor contributing to the transient is the inrush current as the capacitor energizes; this
inrush current IEEE C62.41.1,Guide On The Surge Environment In Low- Voltage (1000V and
Less) AC Power Circuit, uses the terms “direct flash”, “near flash”, and “far flash” to distinguish
between lightning strokes and how they induce a surge on a facility can have a resonant
frequency anywhere from 300 Hz to 1,000 Hz depending on the installed inductance and
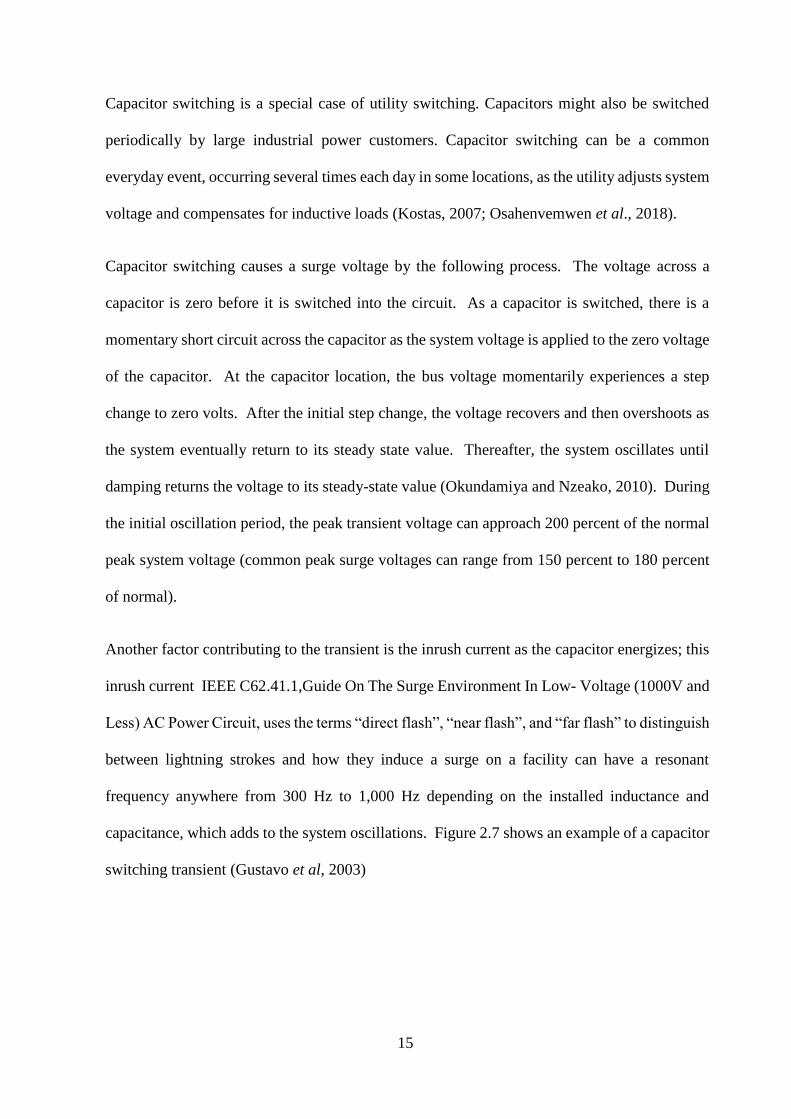
capacitance, which adds to the system oscillations. Figure 2.7 shows an example of a capacitor
switching transient (Gustavo et al, 2003)
16
Figure 2.7: Voltage Waveform for Capacitor Switching Transient
Capacitors inside a facility can resonate with the switching-induced oscillations, thereby
magnifying the peak voltage and extending the period until the voltage returns to normal.
Magnification of the switching transient can occur if the utility switched capacitor bank is much
larger than the facility capacitor bank and there is little resistive load (mostly motor load) to
provide a damping mechanism (Gustavo et al, 2003).
2.6 Facility Internal Switching
Switching equipment in an electrical system resulted in inductive energy that creates a
momentary voltage surge. Even minor switching can cause a significant inductive surge in the
system. This type of switching accounts for the overwhelming majority of switching transients.
However, the magnitude of this type of surge is much smaller than for lightning-induced surges
(Makinde et al, 2014).
2.7 Surge Effects
Surges can cause equipment damage. Large surges damage equipment and other components
in the electrical distribution system. Smaller surges can cumulatively damage equipment and
can cause nuisance equipment tripping. Both surge voltage and current can be damaging. In
the case of lightning strokes, the surge can be carried into a facility via all of the connected
1.5 to 1.8 pu (150 to 180% )
17
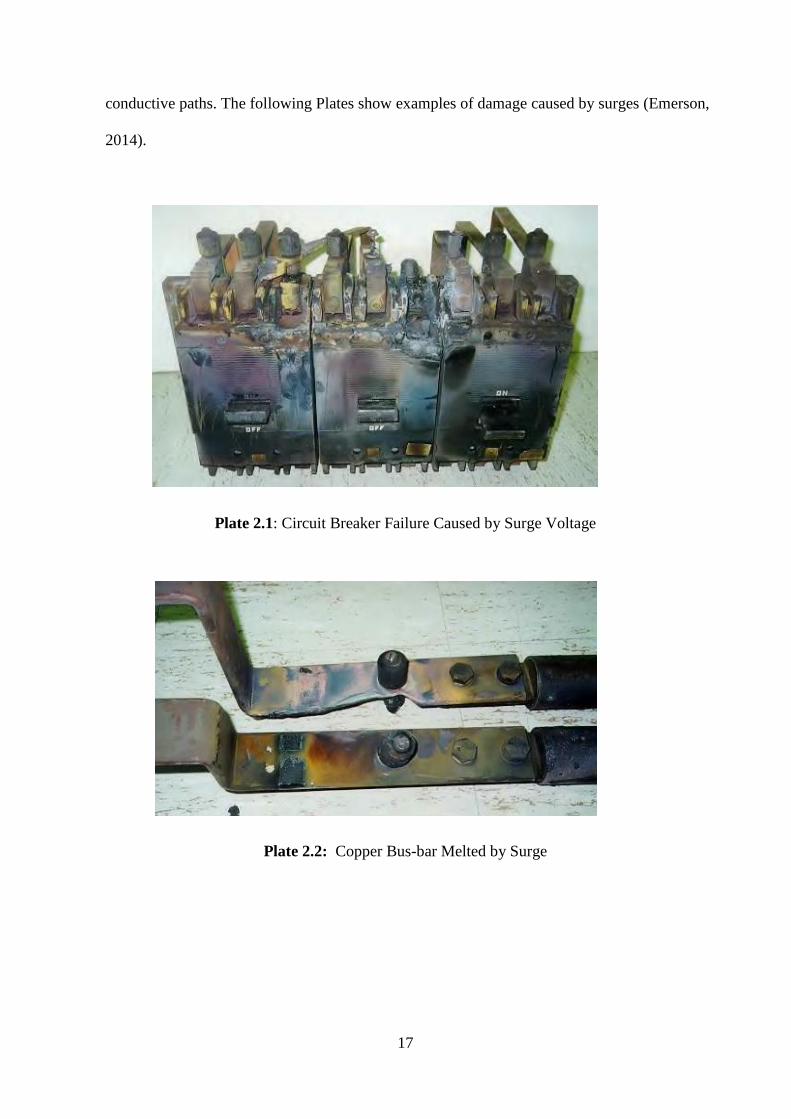
conductive paths. The following Plates show examples of damage caused by surges (Emerson,
2014).
Plate 2.1: Circuit Breaker Failure Caused by Surge Voltage
Plate 2.2: Copper Bus-bar Melted by Surge
18
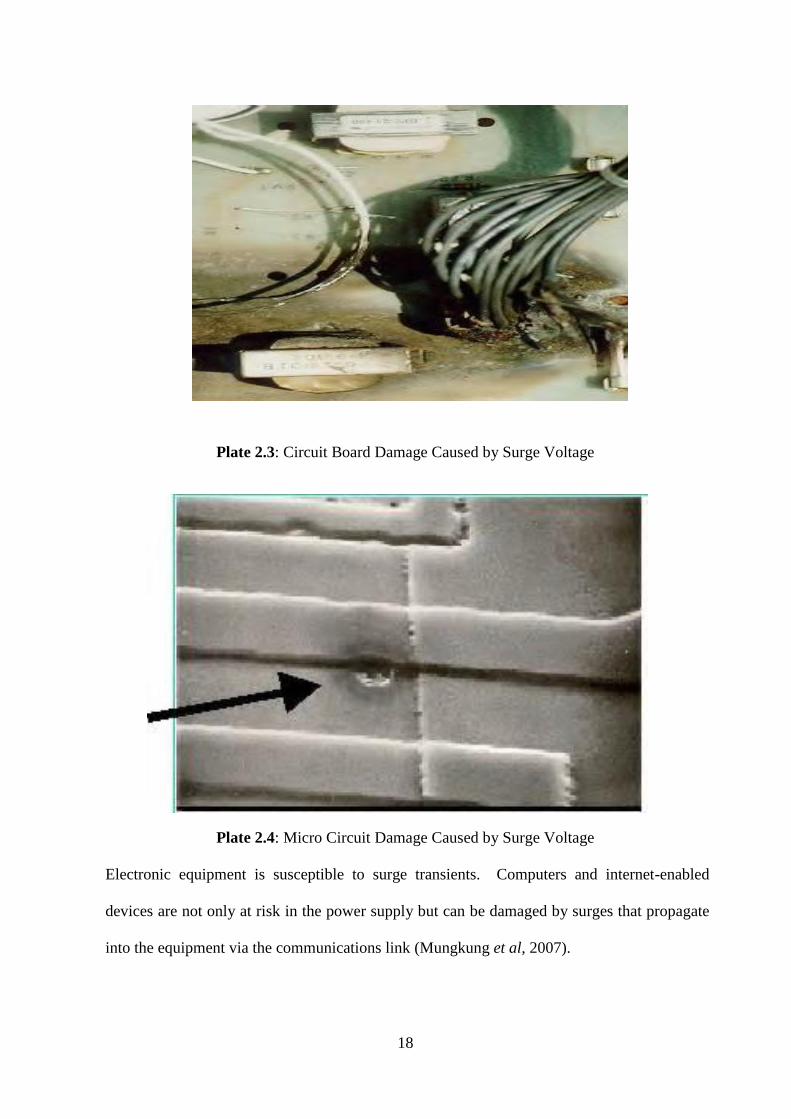
Plate 2.3: Circuit Board Damage Caused by Surge Voltage
Plate 2.4: Micro Circuit Damage Caused by Surge Voltage
Electronic equipment is susceptible to surge transients. Computers and internet-enabled
devices are not only at risk in the power supply but can be damaged by surges that propagate
into the equipment via the communications link (Mungkung et al, 2007).
19
2.8 The Benefits of Power Quality and Protection Products
To maintain high-quality power within the facility, it must start with best engineering practices
foundation. This begins by ensuring that the wiring, grounding, and bonding are up to standards.
Once this is verified, elements such as Surge Protection Devices (SPDs), can be installed, low-
pass filters, and data and signal line protectors to prevent damage from surges and electrical
line noise. To improve the facility’s uptime, Uninterruptible Power Supplies (UPS) should be
considered, voltage regulators, and generators (Teru, 2010).
2.9 The Importance of Protecting the Power Network.
Safety agencies recognize the Need for Pnwer Quality Products for Lightning/surge protection
considerations: a properly rated surge protective device should be applied to each individual or
set of electrical conductors (e.g., power, voice, and data) penetrating any of the six sides forming
a structure (Gustavo et al, 2003).
2.10 Practice for Powering and Grounding Electronic Equipment
If lightning strikes occurs on or near overhead electric power or telephone line, a large current
will be injected into or induced in the wires, and the current can do considerable damage both
to the power and telecommunications equipment and to anything else that is connected to the
system.
Surges can have many effects on equipment, ranging from no detectable effect to complete
destruction, electronic devices can have their operation upset before hard failure occurs. The
semiconductor junctions of electronic devices are particularly susceptible to progressive
deterioration, few solid state devices can tolerate much more than twice their normal rating.
Furthermore, data processing equipment can be affected by fast changes in voltage with
relatively small amplitude compared to the hardware-damaging over-voltages.
20
For large surge currents, this diversion is best accomplished in several stages. The first diversion
should be performed at the entrance to the building, a second protective device at the power
panel.
2.11 Potential impact of Electromagnetic Interference (EMI)
Depending on the severity of the surge and the susceptibility of the equipment, three types of
occurrences are possible, data disruption, hardware stress, and hardware destruction.
(a) EMI, Type I, signal-data disruption: Signal carrying circuits are susceptible to surge
interference via conduction, inductive and capacitive coupling, and electromagnetic
radiation (Kostas, 2007).
(b) EMI, Type II, gradual hardware stress and latent failures: A single lightning or
switching surge often causes immediate, but not readily apparent physical damage to
semiconductor devices. This damage then finally appears at some later time.
(c) EMI, Type III, immediate hardware destruction: The third possible impact of surges
is the immediate obvious and total destruction of hardware components in a single
incident.
(d) Surge suppressors: Effective surge protection requires the coordinated use of large-
capacity current diverting devices at the service entrance followed by progressively
lower voltage-clamping devices.
(e) Lightning/surge protection considerations: A properly rated surge protective device
should be applied to each individual or set of electrical conductors (e.g., power, voice,
and data) penetrating any of the six sides forming a structure.
21
(f) Selection: Surge protective devices for three phases, four-wire circuits are generally
recommended to be connected in all combinations of line-to-line, line-to neutral, line-
to-ground, and neutral-to-ground.
(g) Installation: Recommended installation practice is for all lead lengths to be short and
shaped to minimize open loop geometry between the various conductors by twisting all
the phase, neutral, and equipment grounding conductors together; and by avoiding any
sharp bends and coils in the conductors.
(h) Service entrance surge protection: Facilities housing electronic load equipment of
any type should have service entrances equipped with Category “C” surge protective
devices, as specified in IEEE Std. C62.41-1991 (Shehab, 2013).
2.12 Electrical System Surge Protection
Recommended that additional surge protective devices of listed Category ‘B’ or Category ‘A,’
as specified in IEEE Std. C62.41-1991, be applied to downstream electrical switchboards and
panel boards, and panel boards on the secondary side of separately derived systems if they
support communications, information technology equipment, signalling, television, or other
form of electronic load equipment.
(a) UPS system surge protection: It is recommended practice that both the input circuit
to the UPS and the associated bypass circuits (including the manual bypass circuit) be
equipped with effective Category ‘B’ surge protective device.
(b) Data/communication systems surge protection: Electronic equipment containing
both ac power and data cabling should also be properly protected via surge protective
devices on both the ac power and data cables.
22
(c) Exterior building systems and piping lightning/ surge protection: All exterior
mechanical systems (e.g., cooling towers, fans, blowers, compressors, pumps, and
motors) should be considered targets for a lightning strike.it is recommended practice
to individually provide surge protective device protection on both the power input and
data circuits connected to all such equipment.
2.13 Surge Arresters
Surge arresters are designed to be insulators for nominal operating voltage, conducting at most
a few milliamperes of current and good conductors when the voltage of the line exceeds design
specifications to pass the energy of the lightning strike to the ground (Teru, 2010).
Several different types of arresters are available (e.g. gapped silicon carbide, gapped or non-
gapped metal-oxide) and all perform in a similar manner: they function as high impedances at
normal operating voltages and become low impedances during surge conditions. Even though
a great number of arresters which are gapped arresters with resistors made of silicon carbide
(SiC) are still in use, the arresters installed today are almost all metal-oxide (MO) arresters
without gaps, something which means arresters with resistors made of metal-oxide. The
distinctive feature of a metal-oxide arrester is its extremely non-linear V–I characteristic,
rendering unnecessary the disconnection of the resistors from the line through serial spark gaps,
as it is found in the arresters with SiC resistors.
The most significant technical characteristics of surge arresters according to the IEC 60099-4
are:
(a) Continuous operating voltage (Uc): Designated rms value of power frequency
voltage that may be applied continuously between the terminals of the arrester.
23
MCOV of the arrester must be higher than the maximum continuous operating
voltage of the system.
(b) Rated voltage: Maximum permissible rms value of power frequency voltage
between arrester terminals at which is designed to operate correctly under
temporary over voltages.
(c) Discharge current: Impulse current which flows through the arrester.
(d) Residual voltage (Ures): Peak value of the voltage that appears between arrester
terminals when a discharge current is injected.
(e) Rated discharge current: Peak value of lightning current impulse, which is used
to classify an arrester.
(f) Lightning impulse protective level: Voltage that drops across the arrester when
the rated discharge current flows through the arrester.
(g) Energy absorption capability. Maximum level of energy injected into the
arrester at which it can still cool back down to its normal operating temperature.
Standards do not define energy capability of an arrester. In IEC exists the term
line discharge class, but since this is not enough information, various
manufacturers present thermal energy absorption capability in kJ/kV (Uc),
defined as the maximum permissible energy that an arrester may be subjected
to two impulses without damage and without loss of thermal stability.
24
2.14 The difference Between the Terms “Surge Arrester” and “Transient Voltage
Surge Suppressor (TVSS)
These terms are often used interchangeably and rather loosely. However, the two terms have
different meanings as determined by the National Electrical Code (NEC) (www.nfpa.org), their
UL listing, and applicable IEEE/ANSI standards.
Surge arresters less than 1000 volts have been called secondary surge arresters. Going forward
they are now considered a Type 1 SPD and listed in Article 285 of the NEC. Surge arresters
were originally developed and applied to the power distribution system to protect utility
supplied equipment and building wiring. Surge arresters were intended to protect the system
structure and not necessarily the connected equipment and loads.
Under ANSI/UL 1449-2006, the main difference between a TVSS and a secondary surge
arrester is the location within the electrical distribution system which their respective Listing
allows them to be installed. Secondary surge arresters (now known as Type 1 SPDs) are
generally intended to be installed on the line side of the main service disconnect overcurrent
device (service equipment) Their main purpose is to protect insulation levels of the electrical
system. A TVSS (now known as a Type 2 SPD), by code (NEC 2008), must be installed on the
load side of the main service disconnect overcurrent device (service equipment) and be 1000
volts or less. Their main purpose is to protect the sensitive electronics and microprocessor based
loads by limiting the transient voltage (Mehdi et al, 2014).
Under ANSI/UL 1449-2006, both Type 1 SPDs and Type 2 SPDs are marked with a Short-
Circuit Current Rating (SCCR). This rating is required by code to determine if an SPD is
suitable for installation at a given location within the electrical system. Prior to ANSI/UL 1449-
2006, there was no requirement for this rating on Type 1 SPDs. Under ANSI/UL 1449-2006,
all SPDs are tested to evaluate the suitability of their end-of-service condition given various
25
levels of available fault current when subjected to abnormal over voltages. Prior to ANSI/UL
1449-2006, only Type 2 SPDs were required to undergo this evaluation.
2.15 Protective Devices
Within the three types of protection described above, there are many devices designed for
specific applications.
2.15.1 One-Port Parallel-Connected Devices
This design is to limit high-voltage spikes to a level acceptable to most electronic equipment.
These are considered the first line of defense, using components placed in parallel with the line.
These devices are typically installed at service entrances, larger distribution panels, branch
panel boards, and motor control centres.
2.15.2 Surge Protective Device (SPD)
SPDs are parallel-connected, non-linear protective devices for limiting surge voltages on
equipment by discharging, bypassing, or diverting surge current. They prevent continued flow
of follow current and can repeat these functions as specified.
Domestically, the term SPD is used to describe both Surge Arresters and Transient Voltage
Surge Suppressors (TVSS). However, internationally, the term SPD is synonymous with the
IEC 61643-1 definition that describes a surge component, not a stand-alone device. This
component has no short-circuit current rating so it requires additional fusing and must be
mounted inside an enclosure (Khalid, 2011).
2.15.3 Integral SPD Issues
The major electrical panel manufacturers offer some form of surge protection, integrated
directly within their power distribution or branch panels. Product performance, ease of
installation, and less wall space are some of the advantages that have been touted over externally
26
mounted surge devices. While there may be some credibility to these claims, the end user should
also be aware of the risks involved with integrating SPDs directly into the power distribution
equipment (Emerson, 2014).
The first risk is the failure of the SPD within the distribution equipment. When SPDs fail and
the internal MOVs reach an end-of-life condition, they can create a significant amount of power
which is dissipated in the form of heat. This heat can be so intense that it can cause significant
collateral damage to the distribution equipment.
Additionally, when that failed SPD needs to be repaired in the field, the service technician has
two options: remove all power from the panel; or remove only the power feeding the SPD,
leaving the rest of the panel energized. The first option, which is the safest, may not be feasible
if the connected loads cannot be shut off due to their criticality. Then, considerable measures
need to be taken to work in a live panel. Special gear must be worn and tools used to protect the
technician from shock, electrical faults and potential arc flash (Mungkung et al, 2007).
Performance is another major area of concern when integrating an SPD. Even though
performance is touted as an advantage over externally mounted SPDs, in reality it may be far
worse. For safety reasons, UL dictates the location of the SPD within the gear. This can result
in the device being mounted a long distance away from the connection points. The neutral bus
bar for example may be as far as four feet away from the installed SPD. This would cause the
performance to be considerably worse than an optimally placed, externally mounted SPD.
2.15.4 Hybrid Design
Hybrid surge protection devices combine at least two types of surge components – typically
MOVs and SADs. An effective hybrid design limits the amount of surge current through the
SAD module to an acceptable level and diverts the remaining surge current through the MOV
27
module – sharing the surge. When properly designed, a hybrid SPD will outperform an SPD
that uses only MOVs. However, an effective hybrid SPD requires significant engineering.
Some of the pitfalls of a hybrid approach include:
(a) Designs with all components on line at all times can result in component failure during
surge or overvoltage events.
(b) Some components may not be appropriate for the application of the end unit.
(c) Some manufacturers may claim a capacitor constitutes a hybrid design, but this may not
be the case.
The key to a successful hybrid design is to maximize each individual component’s strengths
and transition away from the weaknesses (NEC, 2014).
2.15.5 Two-Port (Series-Connected) Devices
Filtering/line conditioning units are designed to provide clean AC power by helping to eliminate
or dramatically reduce high-voltage transients and low-voltage electrical line noise that degrade
microprocessor-based equipment. They are generally applied in front of or in series with critical
load or industrial equipment, such as PLCs and motion control systems (Dharmender, 2014).
2.16 Active Tracking Filter (ATF)
Active Tracking Filters offer a comprehensive level of protection by providing clean AC power
for highly sensitive equipment. Composed of series inductors, shunt absorbing components, and
fast-reacting surge protective components, these hybrid devices eliminate low-level noise as
well as protect against destructive high-energy events. Ideal applications include
microprocessor-based equipment such as programmable logic controllers, motion control
equipment, broadcast transmitters, and computers (NEC, 2014; Okundamiya, 2018).
28
2.16.1 Harmonic Filter
A harmonic filter is also a series-connected filter, but is designed to attenuate frequencies that
are a multiple of the fundamental 50 Hz frequency, such as the 5th, 7th, and 9th harmonic
(Kostas , 2007).
2.17 Surge Protection with Filtering
Switching pulses and subsequent re-strikes in multi-stroke lightning can produce very fast
transients, with rise times in the fraction of microseconds. These can capacitive and inductively
couple to equipment and cause induced over-voltages. To eliminate such fast spikes, it is usual
to incorporate a level of filtering in the SPD device. This can simply be a capacitor connected
in parallel across the SPD’s output, or it might be a true series LC filter, often called a two port
SPD where there are distinct sets of input and output terminals.
SPDs incorporating series LC filters generally provide superior filtering performance, however
they are more expensive and need to be sized for the continuous load current. It should be point
out that SPDs with so called “filters” would more accurately be described as wave-shaping
devices as the filter’s prime role is to slow the very fast rate of voltage rise dv/dt rather than to
“filter” (Hasssan, 2017).
2.18 Attenuation in an SPD
Generally this applies to surge protective devices (SPDs), which incorporate filters. The dB of
attenuation stated is usually the point at which the filter has reduced the incident transient by
3dB (or the voltage by a factor of 20).
A more effective surge filter will have a higher dB at a lower frequency. For example, an SPD
with 60dB attenuation at 30 kHz is more effective than a filter with 60dB at 100kHz. The
attenuation can also apply to in-line, series connected; type SPDs used in data communications.
29
In such a case the SPD should have a low attenuation (dB number) at the operating frequency
of the data system. For SPDs protecting ac power circuits, it is common for SPD manufacturers
to quote the dB result at 100kHz, rather than the frequency at which 3dB attenuation occurs.
Rather than quoting a single figure, a graph of frequency response from 10 kHz to 1MHz is
more useful. Performance above 1MHz is of little value as at these higher frequencies large
variations will occur between installations. While many specifications call for 60-80dB at 100
kHz, little practical performance benefit is obtained beyond 30 dB.
The subject of SPDs with filters is not complete without reiterating the point made in the
preceding the term “filter” when applied to a power SPD is confusing. Such “filtering” devices
would more appropriately be described as wave shaping devices and their performance
expressed by the reduction in dv/dt, which they present to the steep rising, edge of the surge,
rather than in dBs. Filters per sec are linear attenuation whilst SPDs with filtering components
exhibit a non-linear action and slope attenuation (Sukhdeo, 2013).
2.19 Using Active Tracking Filters To Control Low- And High-Voltage Transients
Low-voltage noise is caused by everyday events such as turning on appliances or motors.
Although less dramatic than high-voltage transients, the long-term effect of these frequent
disturbances can be just as damaging. Filtering systems, such as our Active Tracking FiltersTM,
provide clean AC power by eliminating lower-voltage noise (Mehdi et al, 2014).
Ideally installed at specific sensitive loads or branch panels, or on individual pieces of
equipment. This is a rather fancy term given to a Surge Protective Device (SPD) which includes
Radio-Frequency Interference (RFI)/Electromagnetic Interference (EMI) filtering. All SPDs
with capacitive RFI/EMI filtering exhibit sine wave tracking abilities (Emerson, 2014).
30
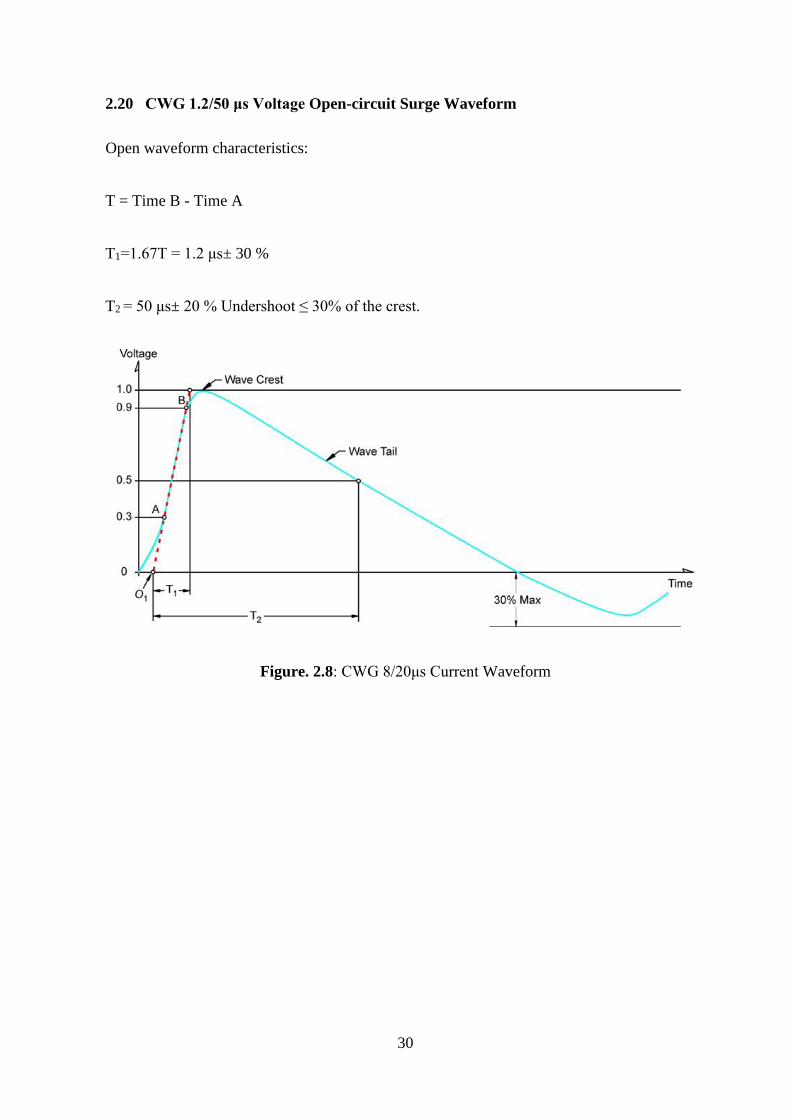
2.20 CWG 1.2/50 μs Voltage Open-circuit Surge Waveform
Open waveform characteristics:
T = Time B - Time A
T1=1.67T = 1.2 μs± 30 %
T2 = 50 μs± 20 % Undershoot ≤ 30% of the crest.
Figure. 2.8: CWG 8/20μs Current Waveform

31
T = Time B - Time C
T1=1.25T = 8 μs± 30 %
T2 = 20 μs± 20 % Undershoot ≤ 30% of the crest.
Figure 2.9: Short-Circuit Characteristics Waveform
2.21 Filters with Air Cored Inductors
Series-installed Surge Protective Devices (SPDs), which comprise LC networks with a series
ferrite inductor in the line-side conductor, can experience saturation under the high current
levels during surge activity. Air gap inductors do not suffer from problems of saturation;
however they are more expensive to produce for the same figure of inductance than ferrite
wound inductors (Sukhdeo, 2013).
32
2.22 Voltage Regulator
Voltage regulators control the output voltage, eliminating voltage sags and swells in the input
voltage that lasts from 15 milliseconds to one-half second. They are typically inexpensive
feedback-controlled transformers.
2.23 Line Conditioner
A line conditioner contains multiple protection devices in one package to provide, for example,
electrical noise isolation and voltage regulation.
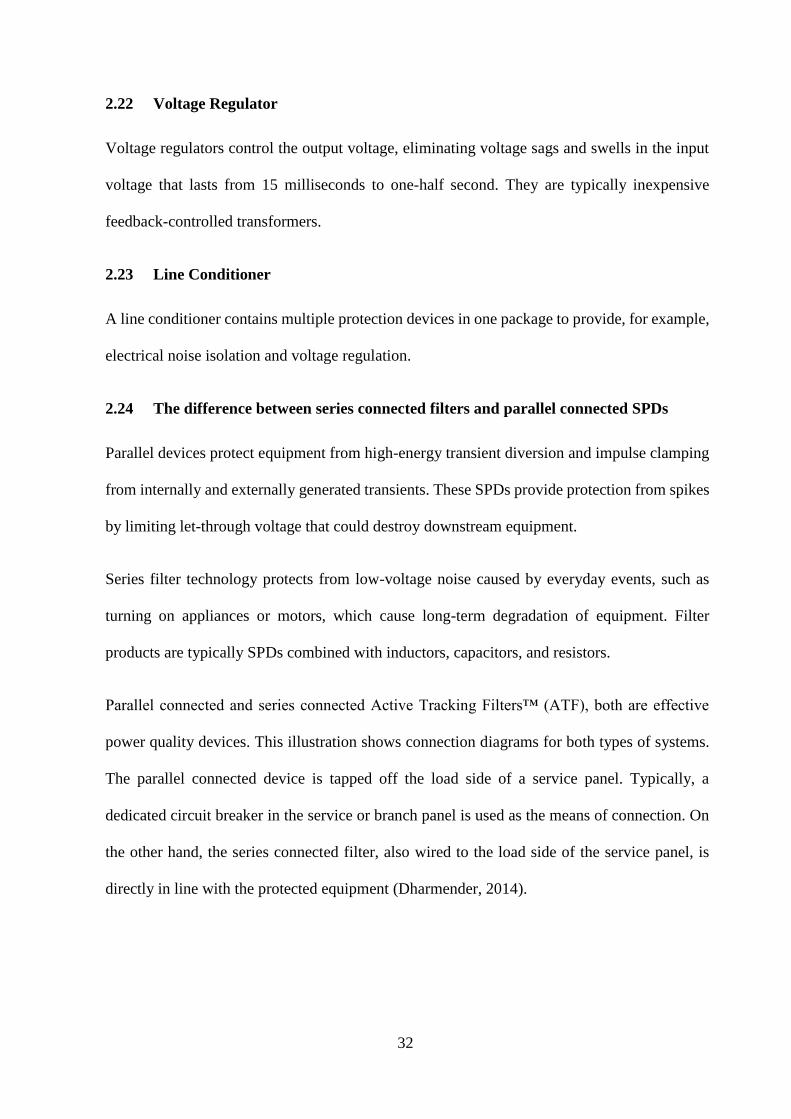
2.24 The difference between series connected filters and parallel connected SPDs
Parallel devices protect equipment from high-energy transient diversion and impulse clamping
from internally and externally generated transients. These SPDs provide protection from spikes
by limiting let-through voltage that could destroy downstream equipment.
Series filter technology protects from low-voltage noise caused by everyday events, such as
turning on appliances or motors, which cause long-term degradation of equipment. Filter
products are typically SPDs combined with inductors, capacitors, and resistors.
Parallel connected and series connected Active Tracking Filters™ (ATF), both are effective
power quality devices. This illustration shows connection diagrams for both types of systems.
The parallel connected device is tapped off the load side of a service panel. Typically, a
dedicated circuit breaker in the service or branch panel is used as the means of connection. On
the other hand, the series connected filter, also wired to the load side of the service panel, is
directly in line with the protected equipment (Dharmender, 2014).
33
Figure 2.10: Parallel Connected SPD and Series Connected Filter
Parallel SPDs protect against high-energy transients by limiting or clamping the surge voltage
and diverting transient surge currents away from the load. The technologies most commonly
used are Gas Discharge Tubes (GDT), Silicon Avalanche Diodes (SADs) and Metal Oxide
Varistors (MOVs). SPDs are voltage-dependent only and are sized based on the surge current
rating on the device.
On the other hand, series connected Active Tracking Filters™ use a low-pass circuit to protect
downstream equipment from high-frequency electrical line noise. ATFs are load dependent,
which means that the series element is sized to handle the maximum current draw of the load.
Inductors, together with the capacitors and resistors, form a circuit capable of absorbing a large
bandwidth of noise.
34
2.25 Using Surge Suppression to Control High-Voltage Transients
High-voltage transients, such as those caused by lightning or grid switching, are relatively rare.
However, they get more attention than low voltage events because their ability to cause
catastrophic damage is so dramatic. Surge suppressors provide protection from spikes by
limiting let-through voltage that could destroy down-stream equipment.
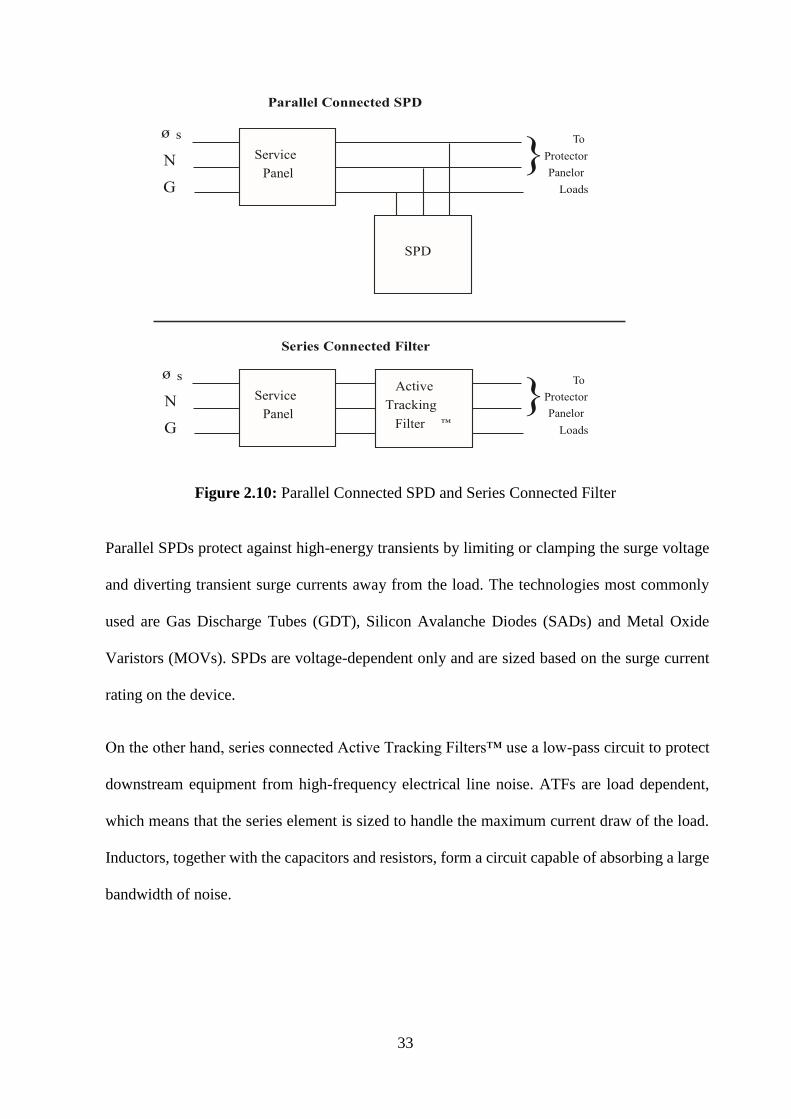
2.26 DC Low Voltage Surge Protection
Low voltage surge protection devices safeguard the integrity of data networks, communication
systems, and video lines from dangerous “backdoor” transients and currents. A three-stage
hybrid design approach is one method used to mitigate surges and “sneak currents” in order to
reduce expensive equipment downtime (Gustavo, 2003).
Figure 2.11: Protected Equipment
Pro
tect
ed E
qu
ipm
ent
35
2.26.1 DC Power Protection
Surge protection designed to protect the DC power going to cameras or other sensitive
equipment generally used in the security industry (Hasssan, 2017).
2.26.2 Video Line Protection
Surge protection devices designed to protect camera, television or computer equipment from
harmful surges that may be induced on to wires or cable lines. These devices may be used in
the security, telecom or traffic industry (Emerson, 2015).
2.26.3 Data Line Protection
Surge protection devices primarily designed to protect high-speed data transmission lines used
for network communication systems. Data lines typically travel throughout a facility and
sometimes even between buildings, leaving the system vulnerable to both externally and
internally generated transients (Kostas, 2007).
2.26.4 Signal Line Protection
Surge protection devices designed to protect signal lines from harmful surges. These devices
are typically used in the telecom industry to protect analogue and digital phone lines as well as
intercom systems. Other applications may include security lines and traffic signal lines
(Dharmender, 2014).
2.26.5 Silicon Avalanche Diode (SAD)
A semiconductor device that normally acts as an open circuit, but changes to a short circuit
when the trigger voltage exceeds a certain amount. The SAD is shown in Plate 2.5.
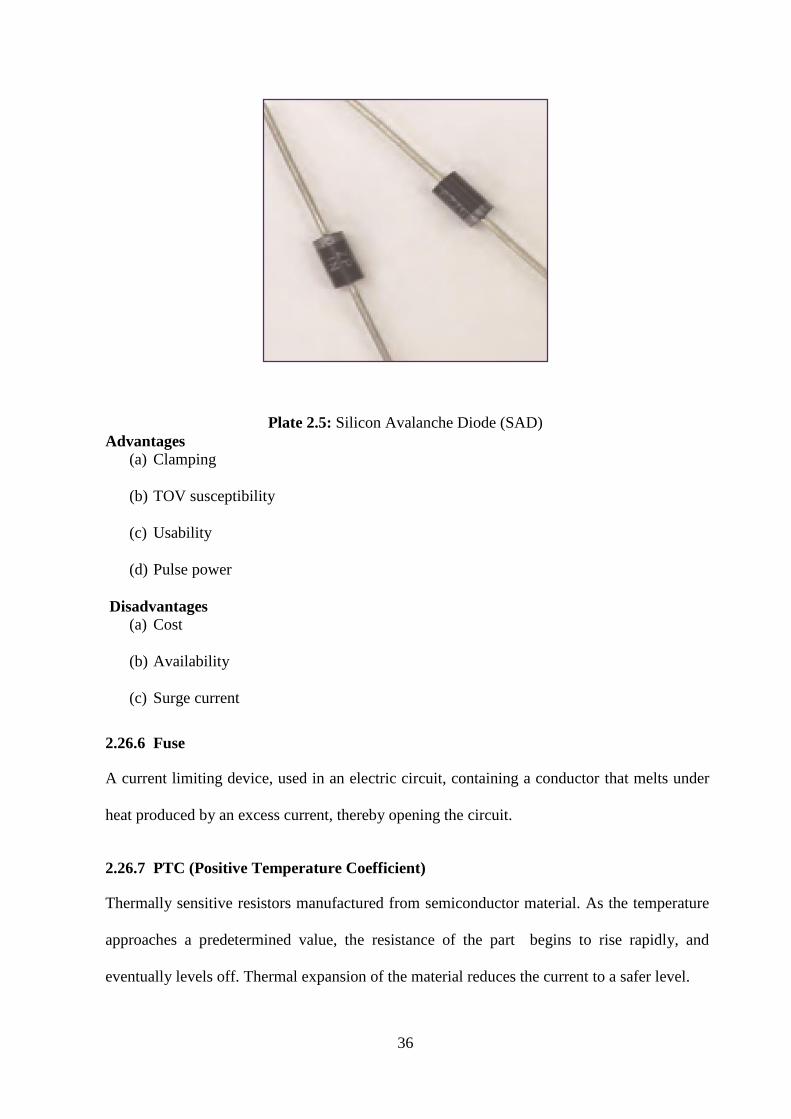
36
Plate 2.5: Silicon Avalanche Diode (SAD)
Advantages
(a) Clamping
(b) TOV susceptibility
(c) Usability
(d) Pulse power
Disadvantages
(a) Cost
(b) Availability
(c) Surge current
2.26.6 Fuse
A current limiting device, used in an electric circuit, containing a conductor that melts under
heat produced by an excess current, thereby opening the circuit.
2.26.7 PTC (Positive Temperature Coefficient)
Thermally sensitive resistors manufactured from semiconductor material. As the temperature
approaches a predetermined value, the resistance of the part begins to rise rapidly, and
eventually levels off. Thermal expansion of the material reduces the current to a safer level.
37
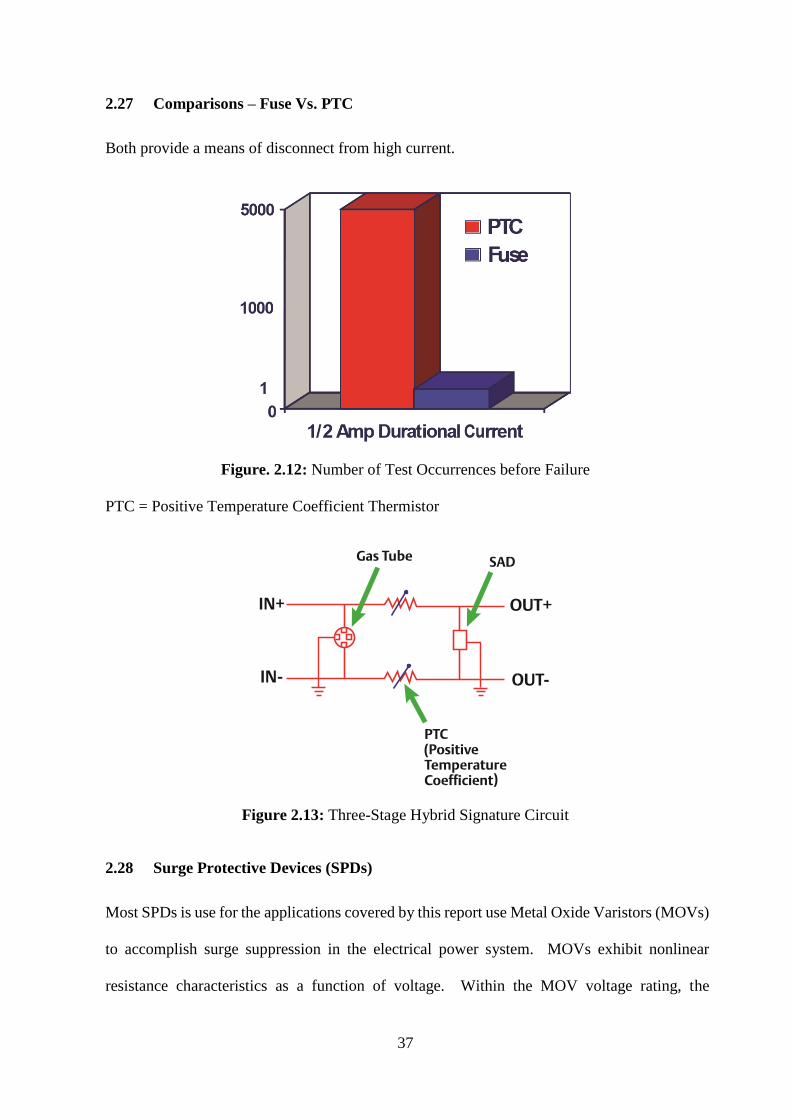
2.27 Comparisons – Fuse Vs. PTC
Both provide a means of disconnect from high current.
Figure. 2.12: Number of Test Occurrences before Failure
PTC = Positive Temperature Coefficient Thermistor
Figure 2.13: Three-Stage Hybrid Signature Circuit
2.28 Surge Protective Devices (SPDs)
Most SPDs is use for the applications covered by this report use Metal Oxide Varistors (MOVs)
to accomplish surge suppression in the electrical power system. MOVs exhibit nonlinear
resistance characteristics as a function of voltage. Within the MOV voltage rating, the
38
resistance usually exceeds 10,000,000ohms, but the resistance drops to less than 0.1ohm when
the MOV is exposed to an overvoltage, such as a transient voltage spike due to a nearby
lightning stroke. It is this characteristic that makes MOVs an effective protection element
(Mungkung et al, 2007)
The MOV is essentially a matrix of zinc oxide grain boundaries that have a nonlinear resistance
characteristic. The series combination of the boundaries defines the MOV voltage rating, the
parallel combination defines the total current that can be passed, and the bulk volume
determines how much energy that it can absorb. When an MOV is energized with an AC
voltage, resistive and reactive current flows through the highly capacitive disc.
Most SPDs are connected in parallel with the circuit and operate when a transient voltage
exceeds the voltage protection rating. Parallel surge protectors have little interaction with the
circuit under normal conditions (Sukhdeo, 2013).
A different technology is commonly used for communications lines, referred to as a Gas
Discharge Tube (GDT), which is a spark gap type of surge suppression device. When subjected
to a surge voltage, the gas discharge tube sparks over, thereby causing an arc to ground. The
hermetically sealed tubes used today can have a precise and repeatable turn-on voltage. Gas
discharge tubes consist of a spark gap in series with a resistance or varistance to limit the
discharge current to safe levels (Mehdi et al, 2014).
2.29 SPD Classification
UL 1449 classifies SPDs by type depending, in part, on their location in the system and their
level of internal protection:
(a) Type 1 – Permanently connected SPDs intended for installation between the secondary
of the service transformer and the line side of the service equipment overcurrent device,
39
as well as the load side, including watt-hour meter socket enclosures and intended to
be installed without an external overcurrent protective device. They must have
overcurrent protective devices either installed internally on the SPD or included with
it. While these are primarily intended for installation before the main service
disconnect, Type 1 SPDs can be installed in Type 2 and Type 4 locations such as
distribution panels, end-use equipment. Residential installations are often Type 1,
installed near the incoming meter.
(b) Type 2 – Permanently connected SPDs intended for installation on the load side of the
service equipment overcurrent device; including SPDs located at the branch panel.
While some will have internal overcurrent protective components, Type 2 SPDs can
rely on the service entrance overcurrent disconnect device for over current protection.
These SPDs can be installed in service equipment, distribution panels, and end-use
equipment.
(c) Type 3 – Point of utilization SPDs, installed at a minimum conductor length of 10
meters (30 feet) from the electrical service panel to the point of utilization, for example
cord connected, direct plug-in, receptacle type and SPDs installed at the utilization
equipment being protected.
(d) Type 4 – Component SPDs, including discrete components as well as component
assemblies.
40
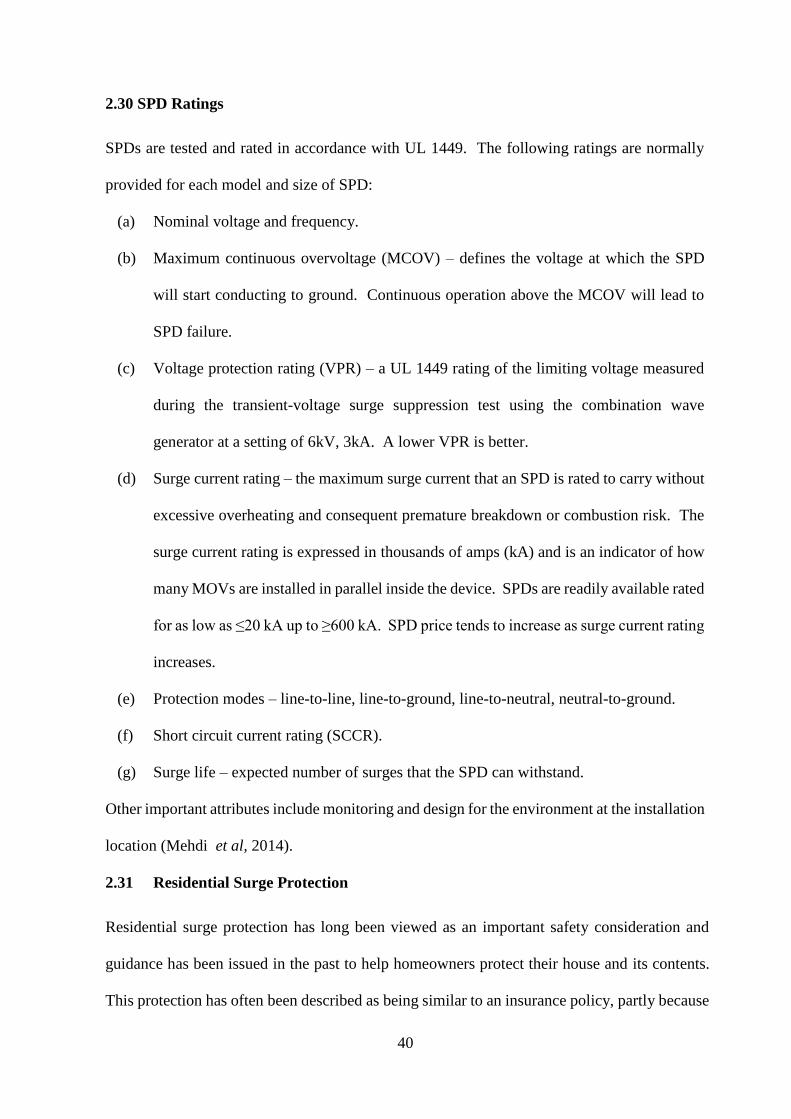
2.30 SPD Ratings
SPDs are tested and rated in accordance with UL 1449. The following ratings are normally
provided for each model and size of SPD:
(a) Nominal voltage and frequency.
(b) Maximum continuous overvoltage (MCOV) – defines the voltage at which the SPD
will start conducting to ground. Continuous operation above the MCOV will lead to
SPD failure.
(c) Voltage protection rating (VPR) – a UL 1449 rating of the limiting voltage measured
during the transient-voltage surge suppression test using the combination wave
generator at a setting of 6kV, 3kA. A lower VPR is better.
(d) Surge current rating – the maximum surge current that an SPD is rated to carry without
excessive overheating and consequent premature breakdown or combustion risk. The
surge current rating is expressed in thousands of amps (kA) and is an indicator of how
many MOVs are installed in parallel inside the device. SPDs are readily available rated
for as low as ≤20 kA up to ≥600 kA. SPD price tends to increase as surge current rating
increases.
(e) Protection modes – line-to-line, line-to-ground, line-to-neutral, neutral-to-ground.
(f) Short circuit current rating (SCCR).
(g) Surge life – expected number of surges that the SPD can withstand.
Other important attributes include monitoring and design for the environment at the installation
location (Mehdi et al, 2014).
2.31 Residential Surge Protection
Residential surge protection has long been viewed as an important safety consideration and
guidance has been issued in the past to help homeowners protect their house and its contents.
This protection has often been described as being similar to an insurance policy, partly because
41
there is not an NFPA code requirement for SPD installation in residences. Today’s residences
often contain electronic equipment throughout, including appliances, computers, security
systems, life safety equipment, automation systems for internet-enabled applications, and home
entertainment systems (Teru, 2010).
2.32 Power Quality Standards
Technical standards are developed by panels of experts, and designed to be independent of
proprietary products or specific vendors. These standards are then maintained and revised as
needed by the organization that issues them (e. g., Underwriters Laboratories).
National and international product safety standards and guidelines are created to:
(a) Reduce risks to human health and safety.
(b) Improve the quality of manufactured goods and services.
(c) Promote interoperability, making it possible for equipment from one vendor to function
efficiently in coordination with equipment from other vendors.
(d) Improve the efficiency of constructing and equipping industrial, medical, and
commercial facilities.
(e) Result in consistent products and reliable manufacturing and safety processes.
(f) Improve environmental protection where standards compliant products are installed.
2.33 Surge Suppression Standards Overview
When it comes to SPDs, specific standards are developed by Underwriters Laboratories (UL)
and the National Fire Protection Association. Over the last several years, there have been many
changes in the codes and standards for SPDs. The most significant are changes to UL 1449.
42
There is also a new standard for safety, of surge protective devices (article 285), which involves
changes to the National Electric Code (Khalid, 2011).
This standard specifies the waveforms to be used in testing American-manufactured SPDs,
defines terminology related to SPD manufacture and test procedures, establishes proper
labelling for SPD products, and specifies required testing and minimum acceptable
performance.
Previous versions of UL 1449 identified only two types of SPDs: permanently connected or
cord-connected. The third edition of UL 1449 has combined all categories into a formal
classification and identified them as four different types, each of which has consistent testing
and application requirements. The most common SPDs generally fall into Type 1 and Type 2
categories. (NFPA, 2013)
2.34 Standard for Transient Voltage Surge Suppressors (SPDs)
Type 1 SPDs are Secondary Surge Arresters and are installed between the secondary side of a
service transformer and the primary side of a service entrance disconnect. They must have
overcurrent protective devices either installed internally on the SPD or included with it. While
these are primarily intended for installation before the main service disconnect, Type 1 SPDs
can be installed in Type 2 and Type 4 locations such as distribution panels, end-use equipment,
etc.
Type 2 SPDs are intended to be connected on the secondary side of the main service disconnect.
While some will have internal overcurrent protective components, Type 2 SPDs can rely on the
service entrance overcurrent disconnect device for over current protection. These can be
installed in service equipment, distribution panels, and end-use equipment. Type 2 SPDs are
permanently connected.
43
Type 3 SPDs are intended to connect at least 33 feet from the service entrance; this does not
include the length of the SPD conductors. These devices are cord-connected devices, and
intended to be used in end-equipment locations. They can rely on external overcurrent
protective devices for overcurrent protection. Type 3 SPDs that are cord-connected are required
to comply with the leakage current requirements to ensure unwanted (objectionable) currents
are not injected on the ground conductor.
Type 4 SPDs are component or assembly drives. They are incomplete in their construction or
safety testing (e. g., limited-current abnormal overvoltage test, and intermediate current tests)
and are intended to be tested in the final assembly. Those that are incomplete in construction or
testing have the identifying information noted in the requirements section of the manufacturer’s
UL report. Unfortunately, there is no documentation of the additional testing requirements for
a Type 4 SPD on the labelling or installation instructions. These can range from single
components (MOVs, SADs) to complex devices intended for installation into distribution
equipment (panel boards, switchboards, etc).
In addition to the new categorization, ANSI/UL 1449 Third Edition specifies that surge
suppression products formerly identified as Transient Voltage Surge Suppressor (TVSS) will
be called Surge Protective Devices (SPDs). It modified the Suppressed Voltage Rating (SVR)
test from 6kV, 500A to 6kV, 3,000A, which represents six times more surge current. And let-
through voltage is now termed the Voltage Protection Rating (VPR).
There’s also a Nominal Discharge Current rating up to 20kA. This is part of the Voltage
Protection Rating test and is a measure of the SPD’s endurance capability. Manufacturers will
choose the applicable rating and show the data on literature, specifications, and products
(Gustavo, 2003).
44
2.35 National Electrical Code (NEC) and National Fire Protection Association (NFPA)
Developed by the NFPA, the NEC was established in 2002 to address electrical safety in the
workplace. While the code is updated every three years, not all states and municipalities have
adopted the same version of the NEC. The 2005 revision of the NEC had two types of SPDs:
secondary surge arrestors and transient voltage surge suppressors (now called SPDs) (NEC,
2014).
2.36 Research Focus
This research focuses on the effects of electrical surge and its remedy which is an improvement
on Paul Mccoy, 2014 research on power surges, causes and their effects in the residential
environment, using Ajaokuta power system Network in Kogi State, of Nigeria as a case study.
It’s a further move in finding the effects and remedy to power surges both in residential,
industrial and Transmission line which involves the collating of data in three environments with
two experimental procedures and to identify other parameters such as effects of tower footing
resistance and arrester intervals on arresters failure probability on transmission line.
The recent surge data recorded and would be analysed to determine the SPD ratings required
for facilities and residences.
45
CHAPTER THREE
MATERIALS AND METHODS
3.1 Site and location of the Study
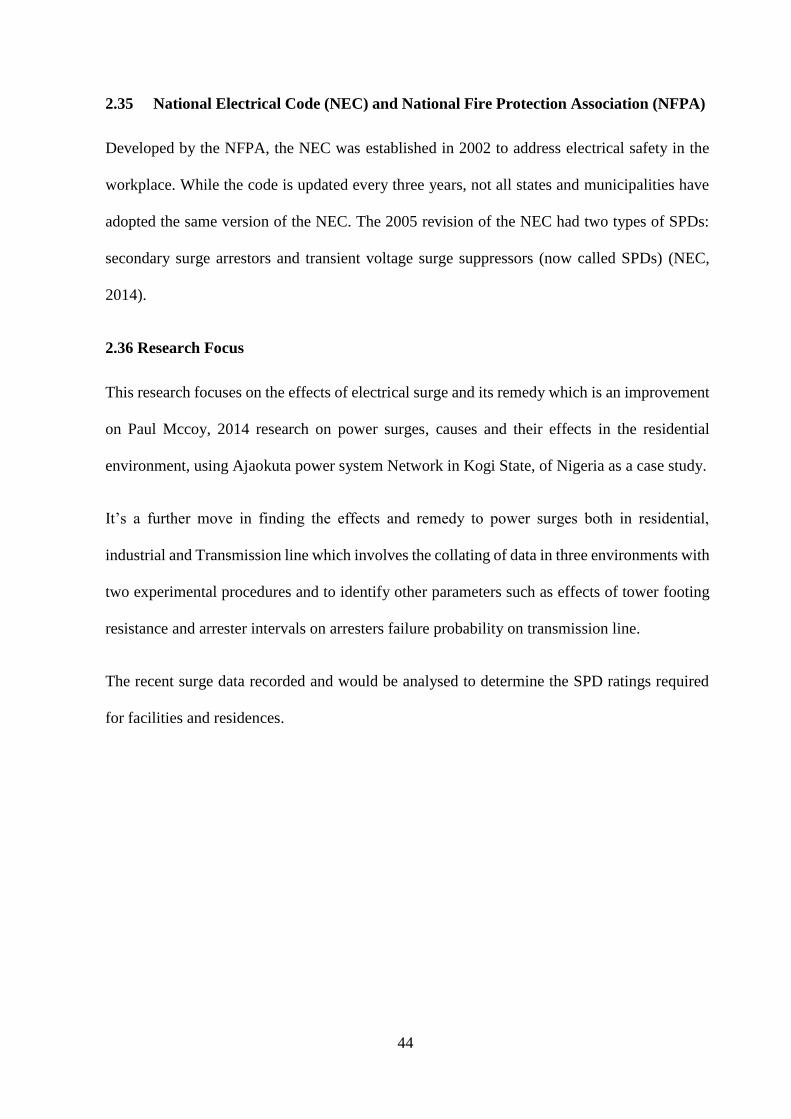
Ajaokuta is located in the North-central of Nigeria popularly known as steel-city because of the
established integrated steel plant by the federal government of Nigeria. The land Area is about
1,800 hectares, (18 million square metres) and the latitude/longitude coordinates for Ajaokuta
are: 7°33'44.24"N, 6°39'17.89"E.
•Latitude position: Equator ⇐ 841km (522mi) ⇐ Ajaokuta⇒ 9166km (5696mi) ⇒ North
pole.
Plate 3.1: Step for grid lines is 15°. On second map 15° latitude and 0° longitude line is
numbered. Map pointer shows the 7.56, 6.65 lat-long coordinates.
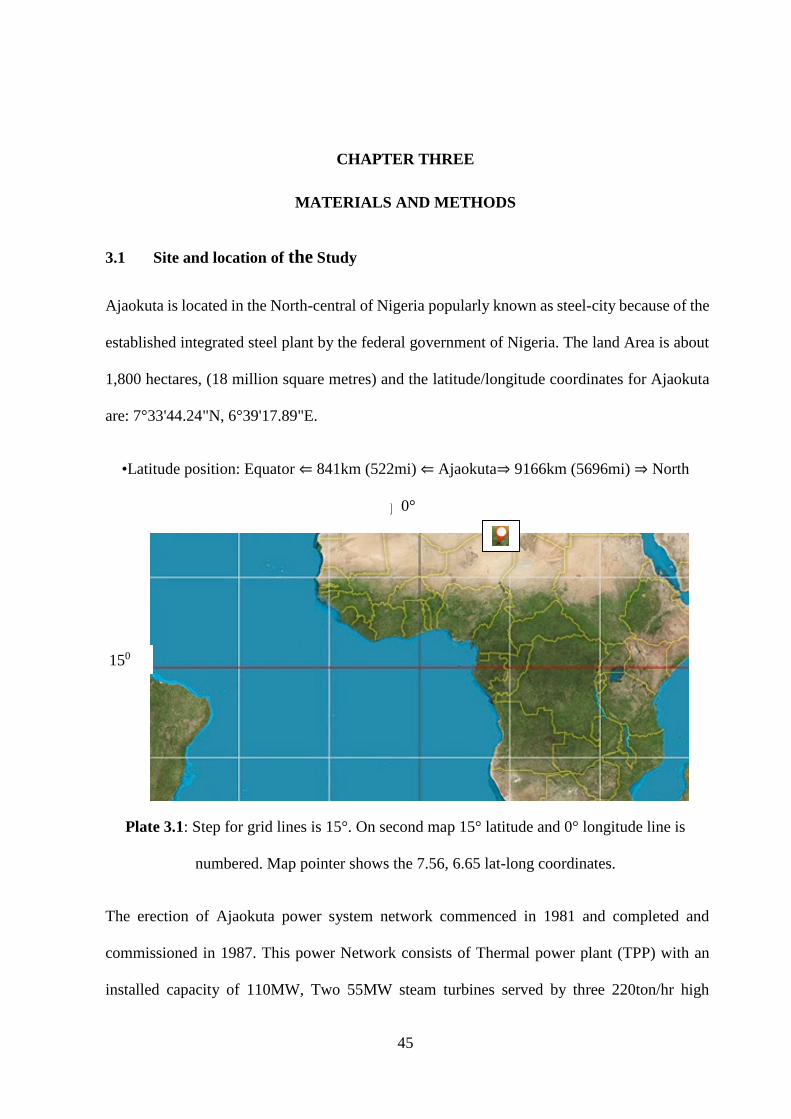
The erection of Ajaokuta power system network commenced in 1981 and completed and
commissioned in 1987. This power Network consists of Thermal power plant (TPP) with an
installed capacity of 110MW, Two 55MW steam turbines served by three 220ton/hr high
150
0°
46
pressure boilers. The plant output of 11.5kV is stepped up to 132kV by two 63MVA coupling
transformers for loading to the national grid and to the two 63MVA main step down transformer
stations for domestic and industrial usage.
Figure 3.1: Basic Structure of the Power System Network in Ajaokuta.
The generating, transmission and distribution stations is shown in Figure 3.2.
Source: www.nerc.com
Transmission
Lines
Transmission
to Grid (132kV) Generator Step Up
Transformer
(132kV, 63 MVA)
Generating Station
(110MW)
Substation Step-
Down Transformer
(63MVA)
Sub-transmission
Consumer (11.5kV)
Primary Consumer
(6.6kV)
Secondary
Consumer
(1000MVA, 240V)
47
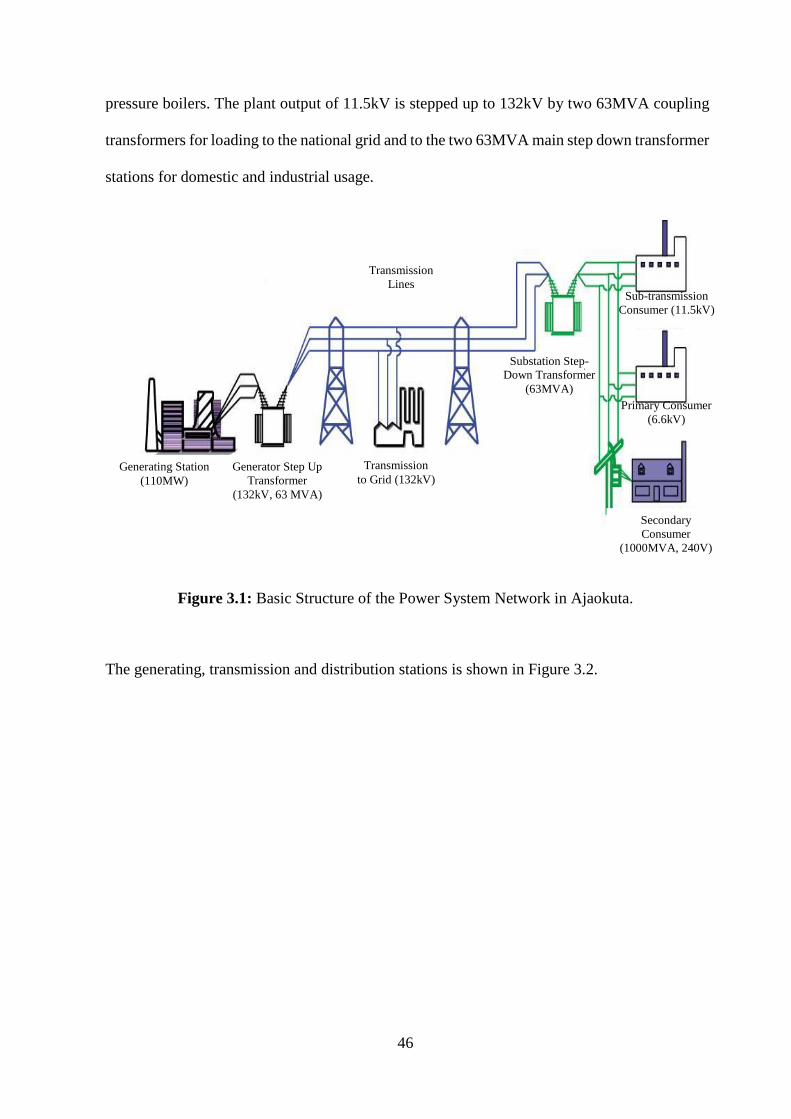
Plate: 3.2 Main Step-Down Substation I
Figure 3.2: Generating Transmission and Distribution Stations is shown in Figure 3.2.
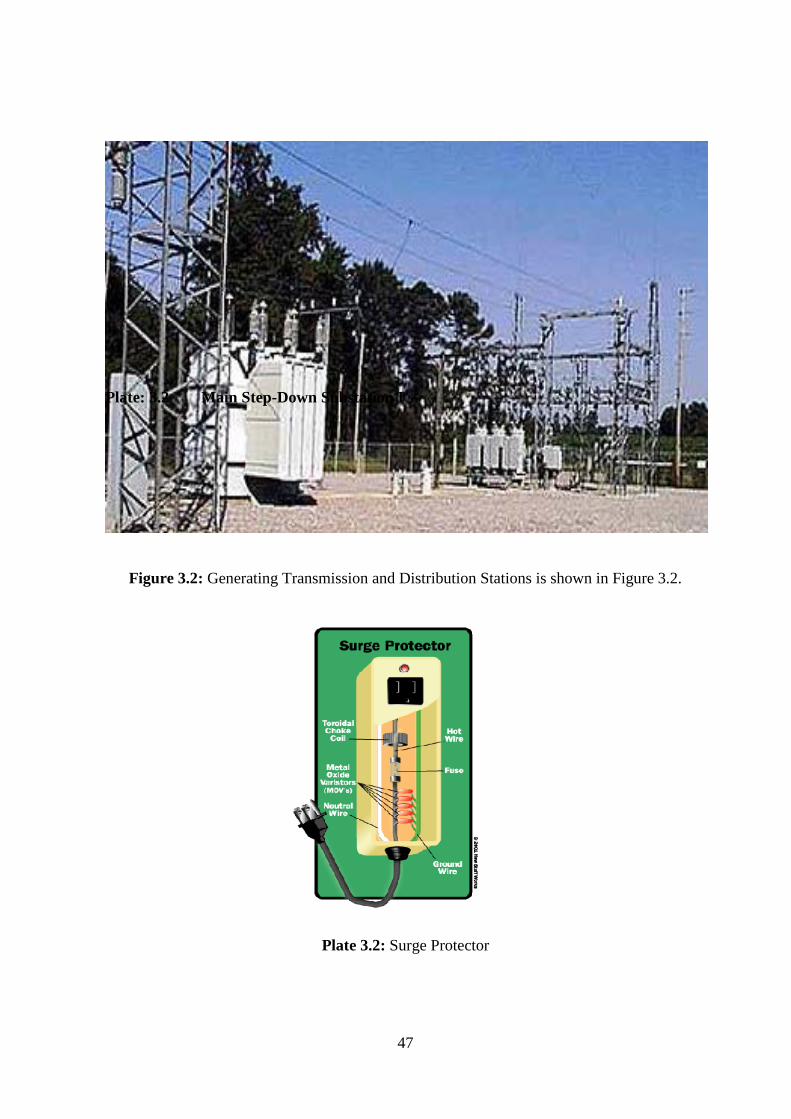
Plate 3.2: Surge Protector
48
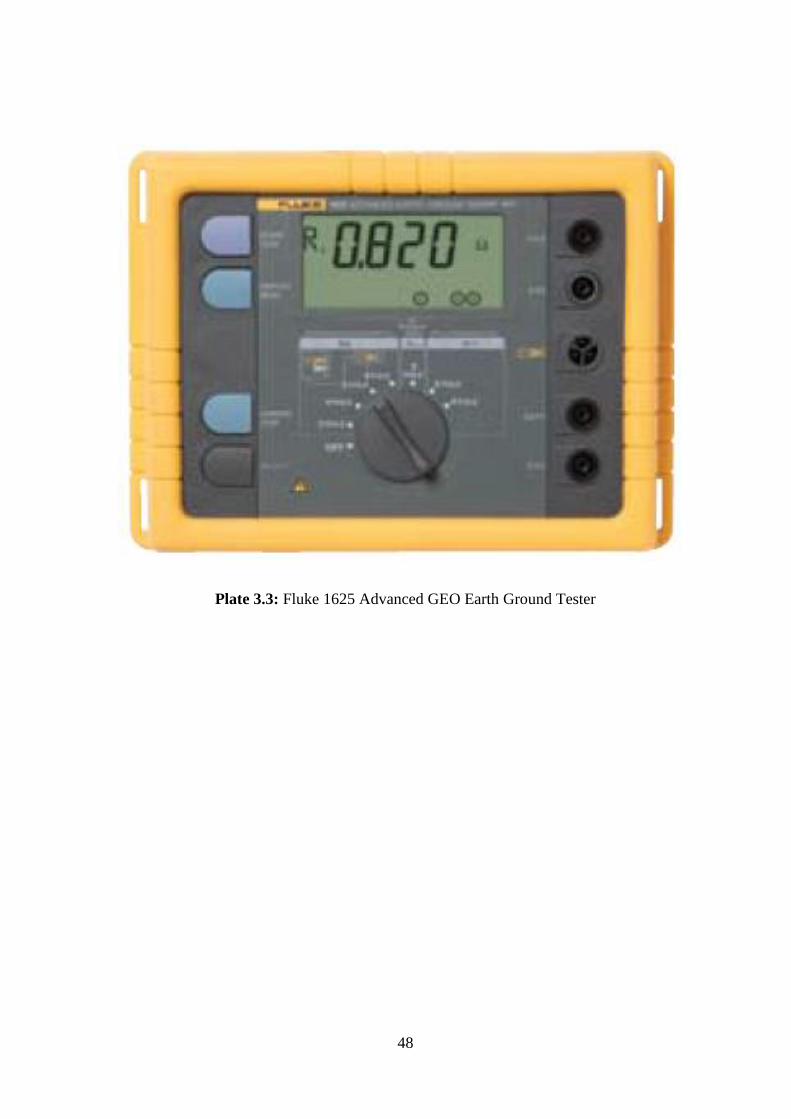
Plate 3.3: Fluke 1625 Advanced GEO Earth Ground Tester
49
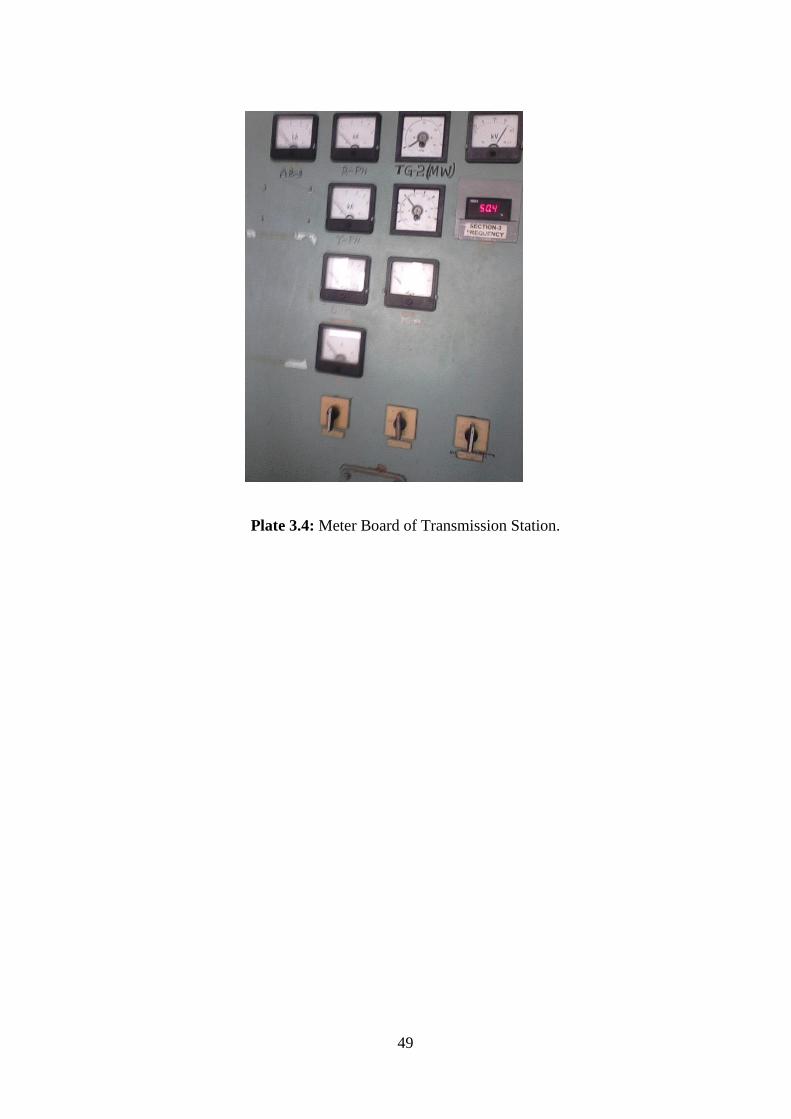
Plate 3.4: Meter Board of Transmission Station.
50
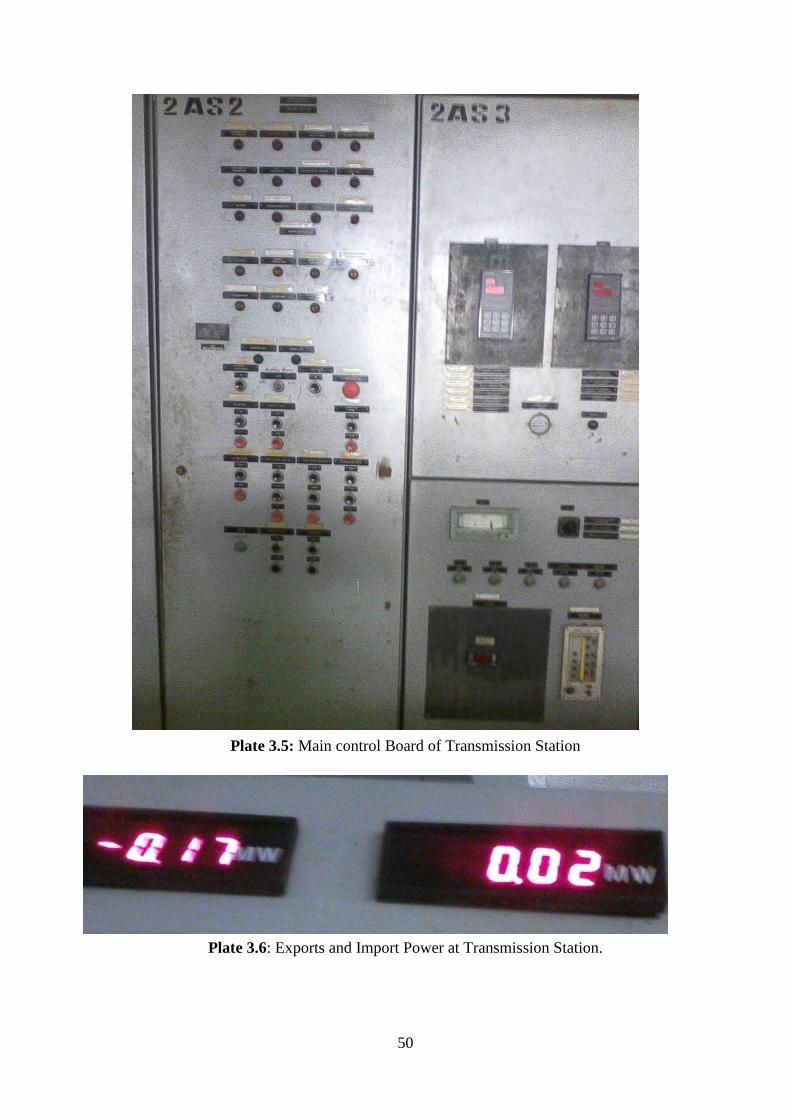
Plate 3.5: Main control Board of Transmission Station
Plate 3.6: Exports and Import Power at Transmission Station.
51
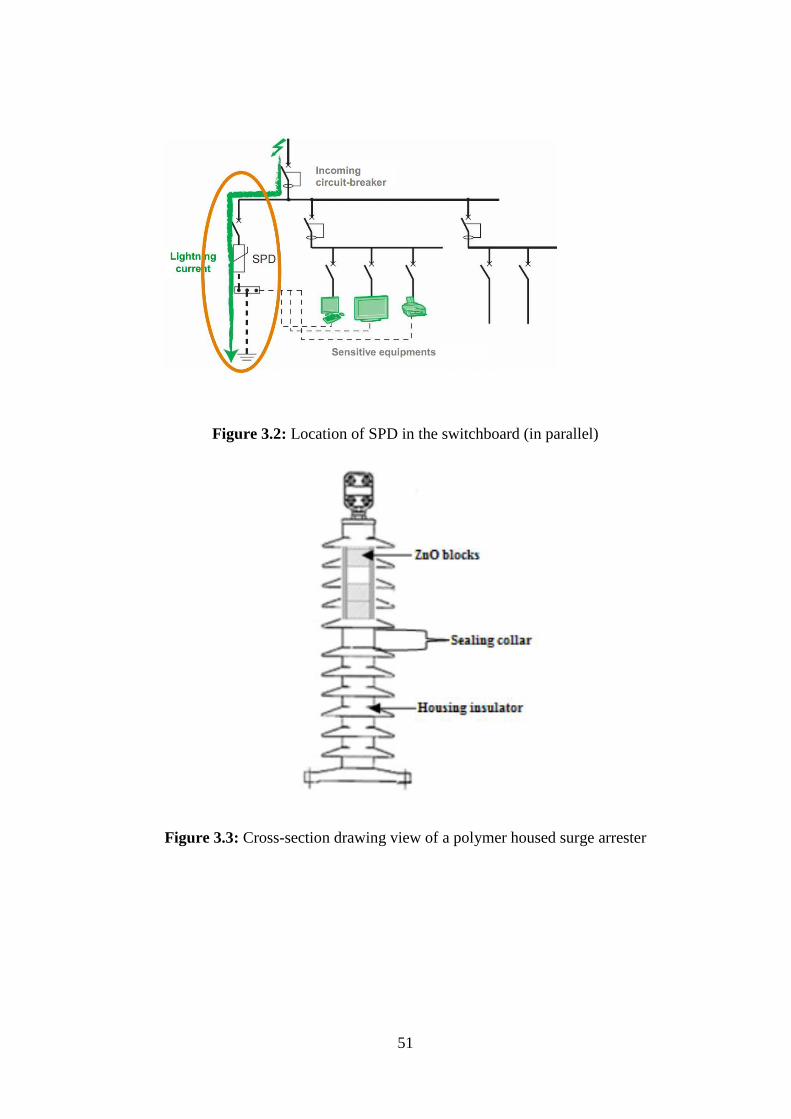
Figure 3.2: Location of SPD in the switchboard (in parallel)
Figure 3.3: Cross-section drawing view of a polymer housed surge arrester
52
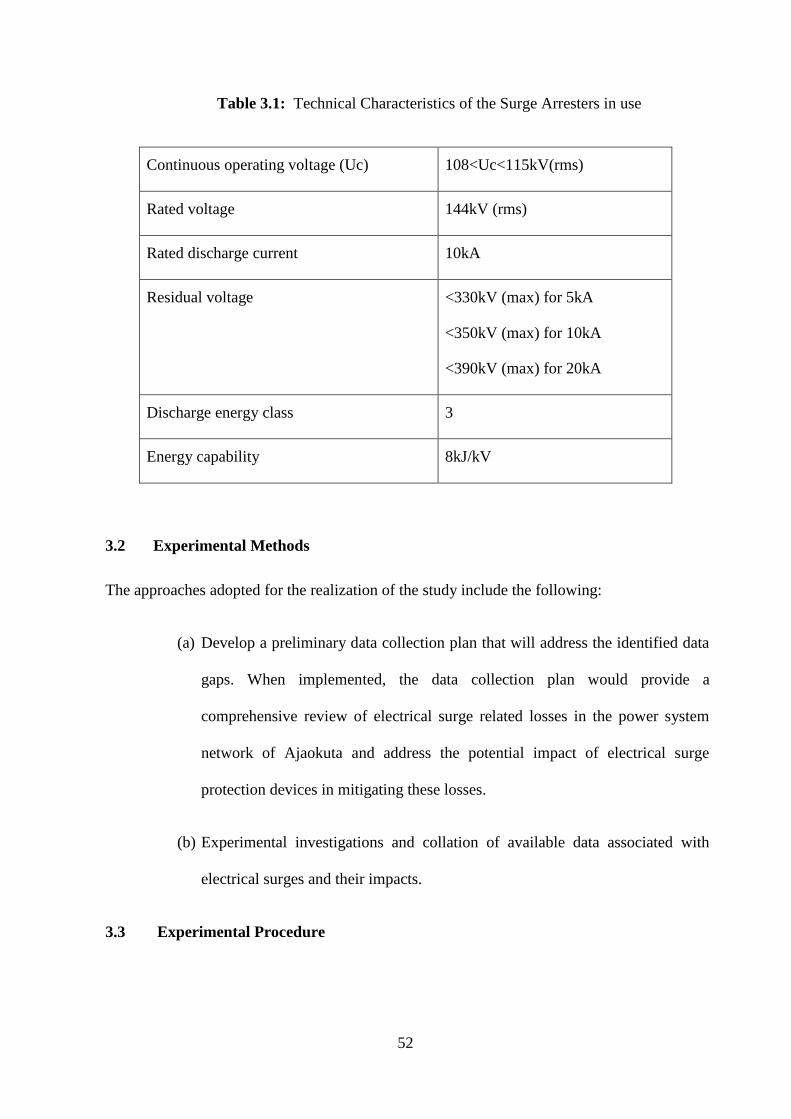
Table 3.1: Technical Characteristics of the Surge Arresters in use
Continuous operating voltage (Uc) 108<Uc<115kV(rms)
Rated voltage 144kV (rms)
Rated discharge current 10kA
Residual voltage <330kV (max) for 5kA
<350kV (max) for 10kA
<390kV (max) for 20kA
Discharge energy class 3
Energy capability 8kJ/kV
3.2 Experimental Methods
The approaches adopted for the realization of the study include the following:
(a) Develop a preliminary data collection plan that will address the identified data
gaps. When implemented, the data collection plan would provide a
comprehensive review of electrical surge related losses in the power system
network of Ajaokuta and address the potential impact of electrical surge
protection devices in mitigating these losses.
(b) Experimental investigations and collation of available data associated with
electrical surges and their impacts.
3.3 Experimental Procedure
53
The experimental procedure in this paper is subdivided into three in order to achieve the desired
objectives.
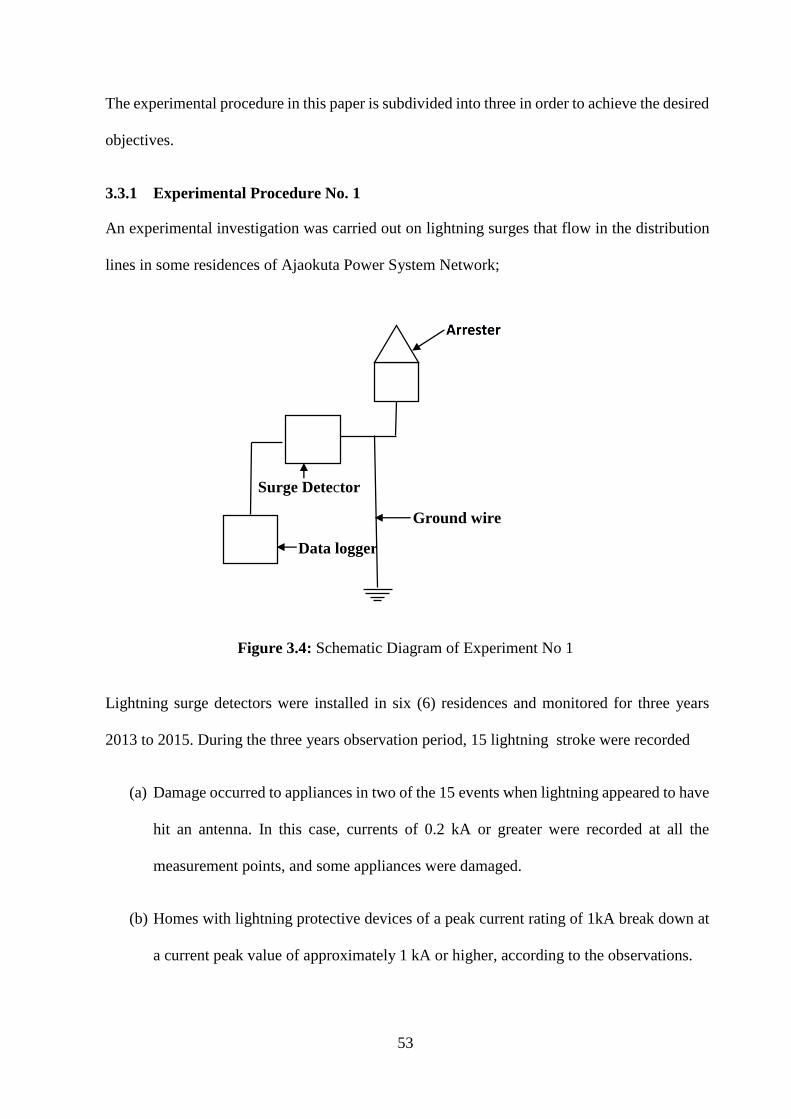
3.3.1 Experimental Procedure No. 1
An experimental investigation was carried out on lightning surges that flow in the distribution
lines in some residences of Ajaokuta Power System Network;
Figure 3.4: Schematic Diagram of Experiment No 1
Lightning surge detectors were installed in six (6) residences and monitored for three years
2013 to 2015. During the three years observation period, 15 lightning stroke were recorded
(a) Damage occurred to appliances in two of the 15 events when lightning appeared to have
hit an antenna. In this case, currents of 0.2 kA or greater were recorded at all the
measurement points, and some appliances were damaged.
(b) Homes with lightning protective devices of a peak current rating of 1kA break down at
a current peak value of approximately 1 kA or higher, according to the observations.
Surge Detector
Data logger
Ground wire
54
3.4 Data presentation
The data obtained in the experiment is presented in Tables 3.2 to 3.5; Average lightning stroke
surge recorded by surge detectors installed in 6 residents and monitored for three years, 2013
to 2015 for 15 lightning stroke events
Table 3.2: April to October, 2013
Residents 1 2 3 4 5 6
Surge current (kA) 0.64 0.7 Nil 0.9 1.27 0.84
Time (µs) 12 15 Nil 22 27 20
Table 3.3: March to October, 2014
Residents 1 2 3 4 5 6
Surge current (kA) 0.5 0.46 0.72 0.44 0.2 0.42
Time (µs) 10 10 15.4 8 5 6
Table 3.4: March to October, 2015
Residents 1 2 3 4 5 6
Surge current (kA) 0.41 0.66 1.09 0.85 Nil Nil
Time (µs) 7 15 22 18 Nil Nil
3.5 Data Bank Presentation from 2013 - 2015
This data provides objective data about lightning stroke intensity based on a scientific study.
Since 1995 the 0perations of the power system Network had set up lightning data bank to collect
55
data on the total number and magnitude of cloud to earth lightning strokes to be used as a factor
in determining the required maximum surge current of SPDs.
For this reason, the maximum surge current of an SPD is often selected based on perceived
lightning stroke levels. The data collected by Ajaokuta power system network measured the
time and the current magnitude of each positive and negative lightning stroke.
The summary of the data in which the resultant lightning storms generated 19,982 separate
cloud to earth strokes is represented in the Tables 3.5 and 3.6 which indicates the count of
current magnitudes arranged in 10kA increments and their cumulative percentage.
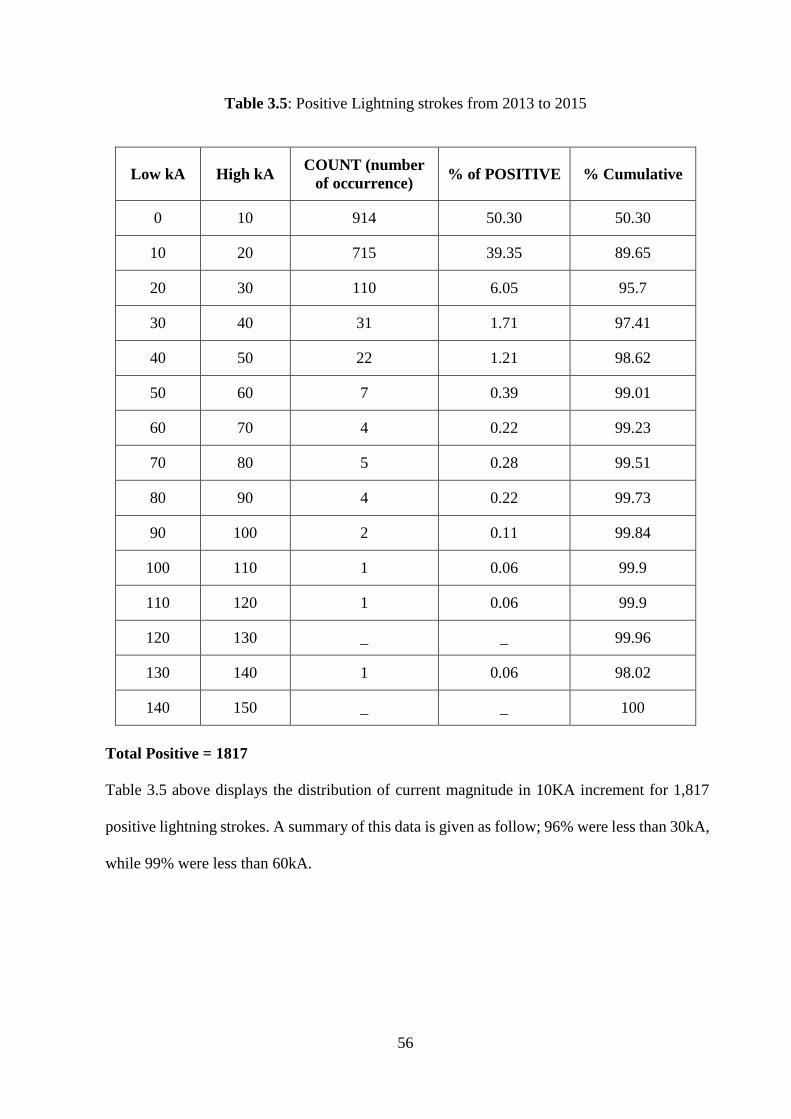
56
Table 3.5: Positive Lightning strokes from 2013 to 2015
Low kA High kA COUNT (number
of occurrence) % of POSITIVE % Cumulative
0 10 914 50.30 50.30
10 20 715 39.35 89.65
20 30 110 6.05 95.7
30 40 31 1.71 97.41
40 50 22 1.21 98.62
50 60 7 0.39 99.01
60 70 4 0.22 99.23
70 80 5 0.28 99.51
80 90 4 0.22 99.73
90 100 2 0.11 99.84
100 110 1 0.06 99.9
110 120 1 0.06 99.9
120 130 _ _ 99.96
130 140 1 0.06 98.02
140 150 _ _ 100
Total Positive = 1817
Table 3.5 above displays the distribution of current magnitude in 10KA increment for 1,817
positive lightning strokes. A summary of this data is given as follow; 96% were less than 30kA,
while 99% were less than 60kA.
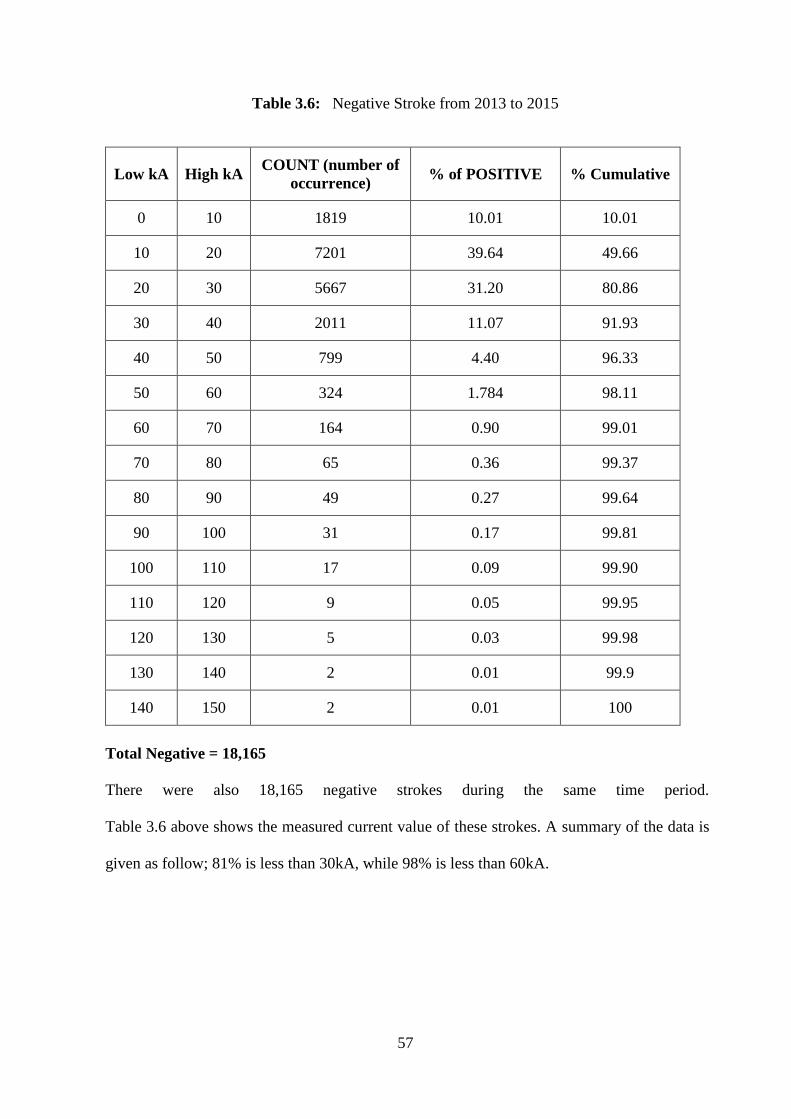
57
Table 3.6: Negative Stroke from 2013 to 2015
Low kA High kA COUNT (number of
occurrence) % of POSITIVE % Cumulative
0 10 1819 10.01 10.01
10 20 7201 39.64 49.66
20 30 5667 31.20 80.86
30 40 2011 11.07 91.93
40 50 799 4.40 96.33
50 60 324 1.784 98.11
60 70 164 0.90 99.01
70 80 65 0.36 99.37
80 90 49 0.27 99.64
90 100 31 0.17 99.81
100 110 17 0.09 99.90
110 120 9 0.05 99.95
120 130 5 0.03 99.98
130 140 2 0.01 99.9
140 150 2 0.01 100
Total Negative = 18,165
There were also 18,165 negative strokes during the same time period.
Table 3.6 above shows the measured current value of these strokes. A summary of the data is
given as follow; 81% is less than 30kA, while 98% is less than 60kA.
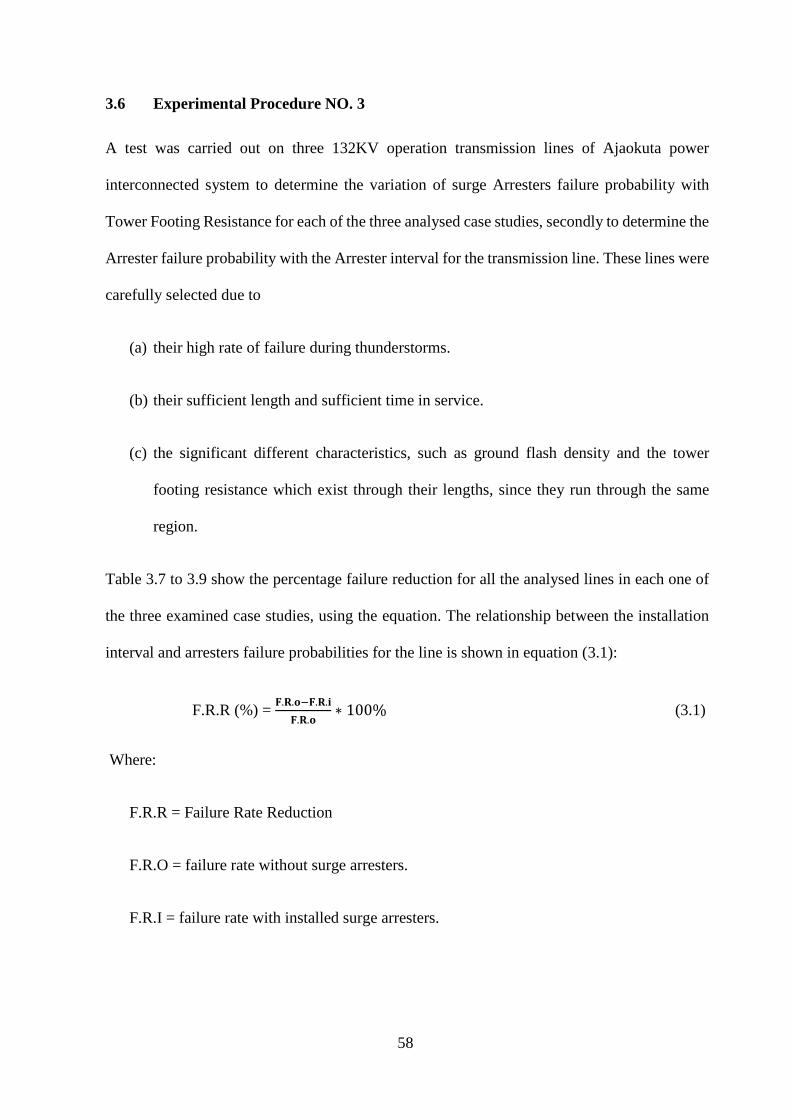
58
3.6 Experimental Procedure NO. 3
A test was carried out on three 132KV operation transmission lines of Ajaokuta power
interconnected system to determine the variation of surge Arresters failure probability with
Tower Footing Resistance for each of the three analysed case studies, secondly to determine the
Arrester failure probability with the Arrester interval for the transmission line. These lines were
carefully selected due to
(a) their high rate of failure during thunderstorms.
(b) their sufficient length and sufficient time in service.
(c) the significant different characteristics, such as ground flash density and the tower
footing resistance which exist through their lengths, since they run through the same
region.
Table 3.7 to 3.9 show the percentage failure reduction for all the analysed lines in each one of
the three examined case studies, using the equation. The relationship between the installation
interval and arresters failure probabilities for the line is shown in equation (3.1):
F.R.R (%) = 𝐅.𝐑.𝐨−𝐅.𝐑.𝐢
𝐅.𝐑.𝐨∗ 100% (3.1)
Where:
F.R.R = Failure Rate Reduction
F.R.O = failure rate without surge arresters.
F.R.I = failure rate with installed surge arresters.
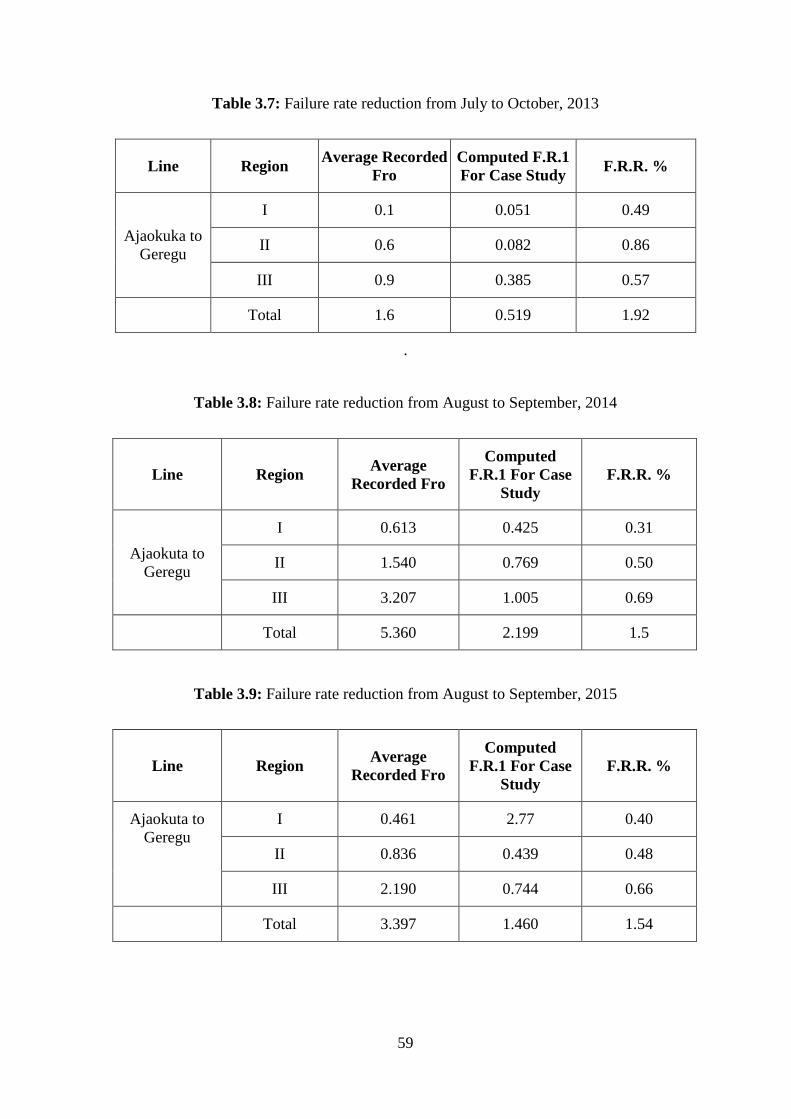
59
Table 3.7: Failure rate reduction from July to October, 2013
Line Region Average Recorded
Fro
Computed F.R.1
For Case Study F.R.R. %
Ajaokuka to
Geregu
I 0.1 0.051 0.49
II 0.6 0.082 0.86
III 0.9 0.385 0.57
Total 1.6 0.519 1.92
.
Table 3.8: Failure rate reduction from August to September, 2014
Line Region Average
Recorded Fro
Computed
F.R.1 For Case
Study
F.R.R. %
Ajaokuta to
Geregu
I 0.613 0.425 0.31
II 1.540 0.769 0.50
III 3.207 1.005 0.69
Total 5.360 2.199 1.5
Table 3.9: Failure rate reduction from August to September, 2015
Line Region Average
Recorded Fro
Computed
F.R.1 For Case
Study
F.R.R. %
Ajaokuta to
Geregu
I 0.461 2.77 0.40
II 0.836 0.439 0.48
III 2.190 0.744 0.66
Total 3.397 1.460 1.54
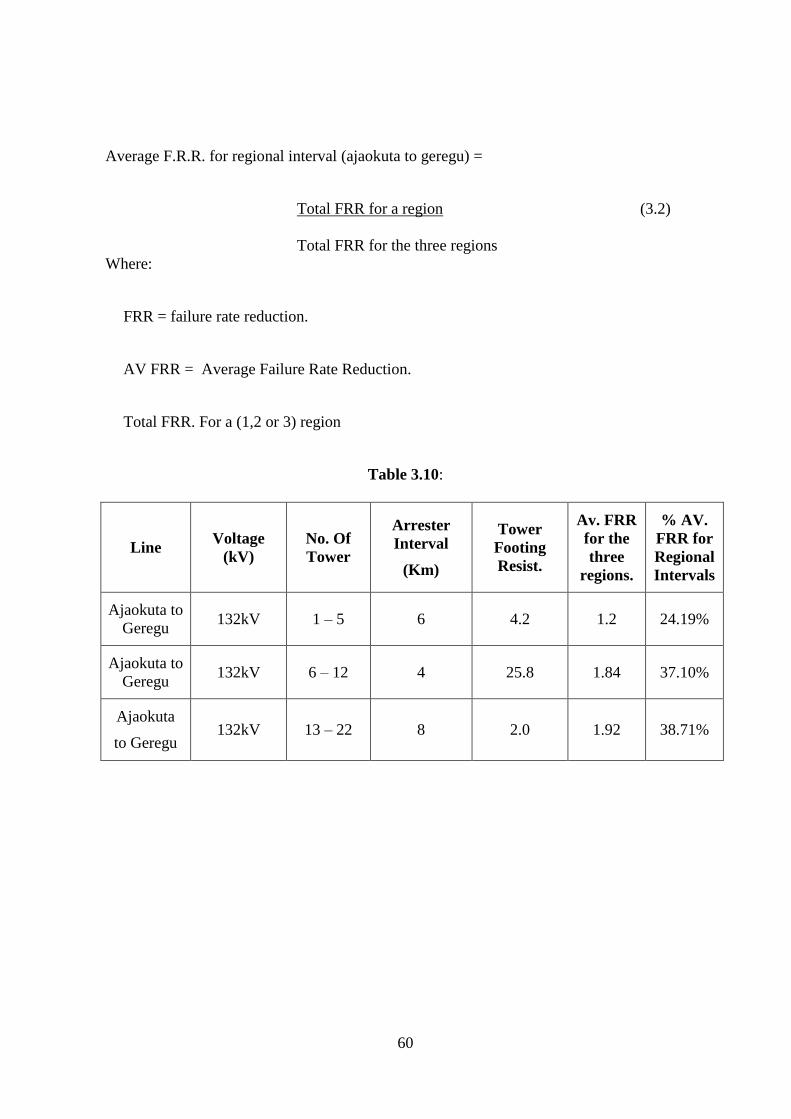
60
Average F.R.R. for regional interval (ajaokuta to geregu) =
Total FRR for a region (3.2)
Total FRR for the three regions
Where:
FRR = failure rate reduction.
AV FRR = Average Failure Rate Reduction.
Total FRR. For a (1,2 or 3) region
Table 3.10:
Line Voltage
(kV)
No. Of
Tower
Arrester
Interval
(Km)
Tower
Footing
Resist.
Av. FRR
for the
three
regions.
% AV.
FRR for
Regional
Intervals
Ajaokuta to
Geregu 132kV 1 – 5 6 4.2 1.2 24.19%
Ajaokuta to
Geregu 132kV 6 – 12 4 25.8 1.84 37.10%
Ajaokuta
to Geregu 132kV 13 – 22 8 2.0 1.92 38.71%
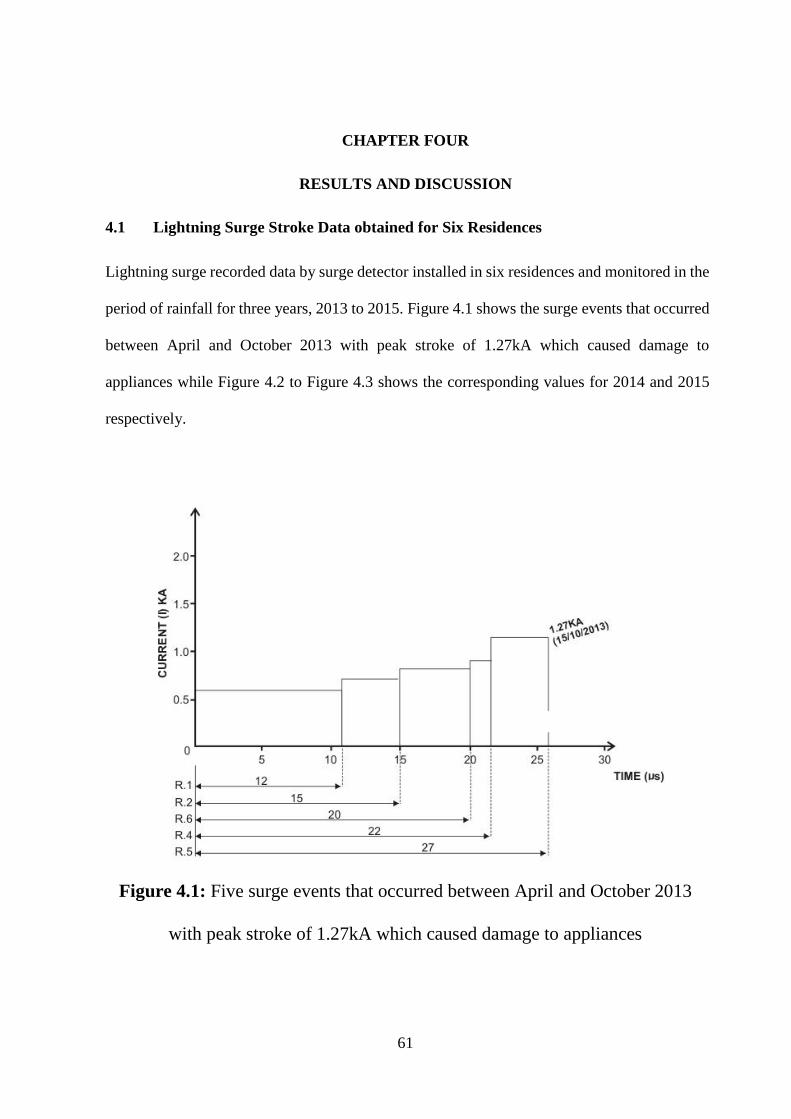
61
CHAPTER FOUR
RESULTS AND DISCUSSION
4.1 Lightning Surge Stroke Data obtained for Six Residences
Lightning surge recorded data by surge detector installed in six residences and monitored in the
period of rainfall for three years, 2013 to 2015. Figure 4.1 shows the surge events that occurred
between April and October 2013 with peak stroke of 1.27kA which caused damage to
appliances while Figure 4.2 to Figure 4.3 shows the corresponding values for 2014 and 2015
respectively.
Figure 4.1: Five surge events that occurred between April and October 2013
with peak stroke of 1.27kA which caused damage to appliances
1.27 KA
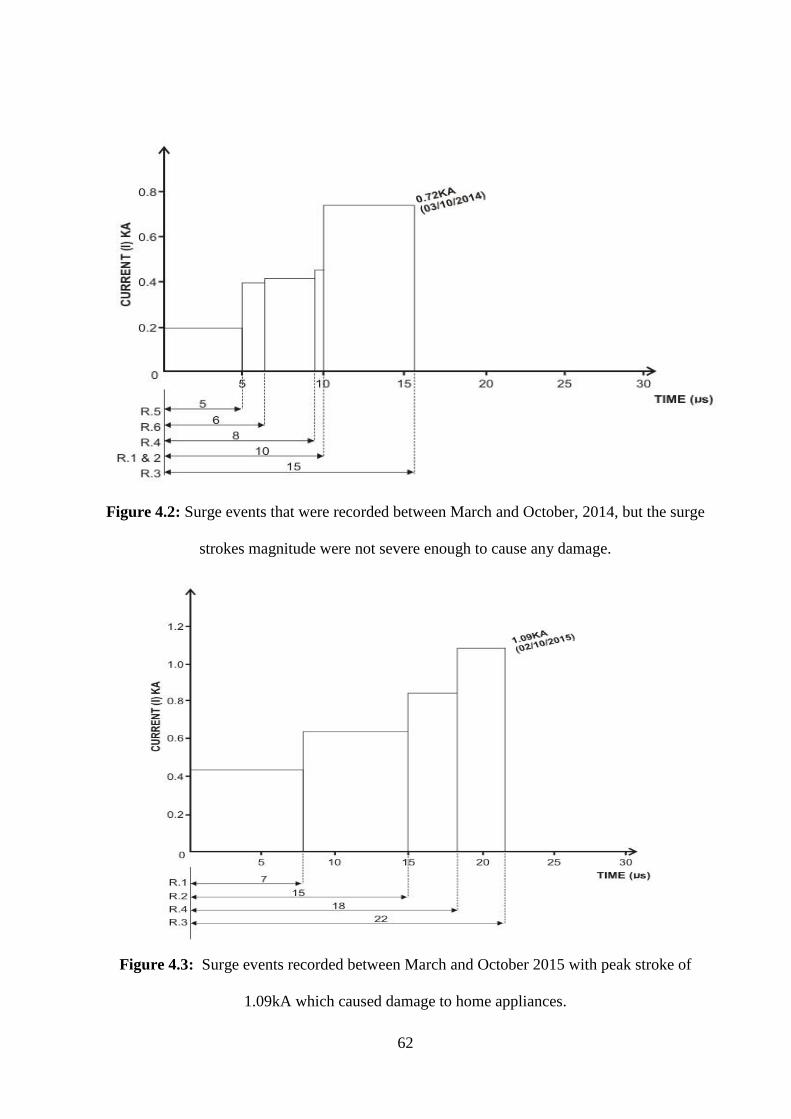
62
Figure 4.2: Surge events that were recorded between March and October, 2014, but the surge
strokes magnitude were not severe enough to cause any damage.
Figure 4.3: Surge events recorded between March and October 2015 with peak stroke of
1.09kA which caused damage to home appliances.
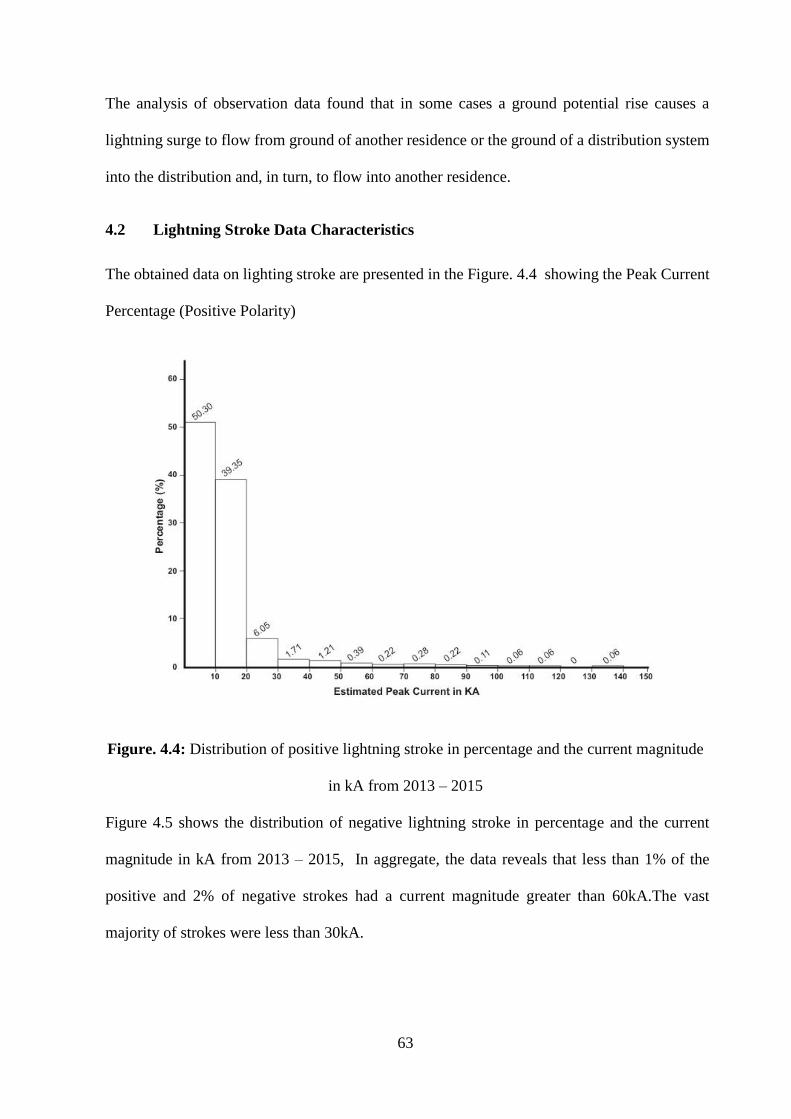
63
The analysis of observation data found that in some cases a ground potential rise causes a
lightning surge to flow from ground of another residence or the ground of a distribution system
into the distribution and, in turn, to flow into another residence.
4.2 Lightning Stroke Data Characteristics
The obtained data on lighting stroke are presented in the Figure. 4.4 showing the Peak Current
Percentage (Positive Polarity)
Figure. 4.4: Distribution of positive lightning stroke in percentage and the current magnitude
in kA from 2013 – 2015
Figure 4.5 shows the distribution of negative lightning stroke in percentage and the current
magnitude in kA from 2013 – 2015, In aggregate, the data reveals that less than 1% of the
positive and 2% of negative strokes had a current magnitude greater than 60kA.The vast
majority of strokes were less than 30kA.
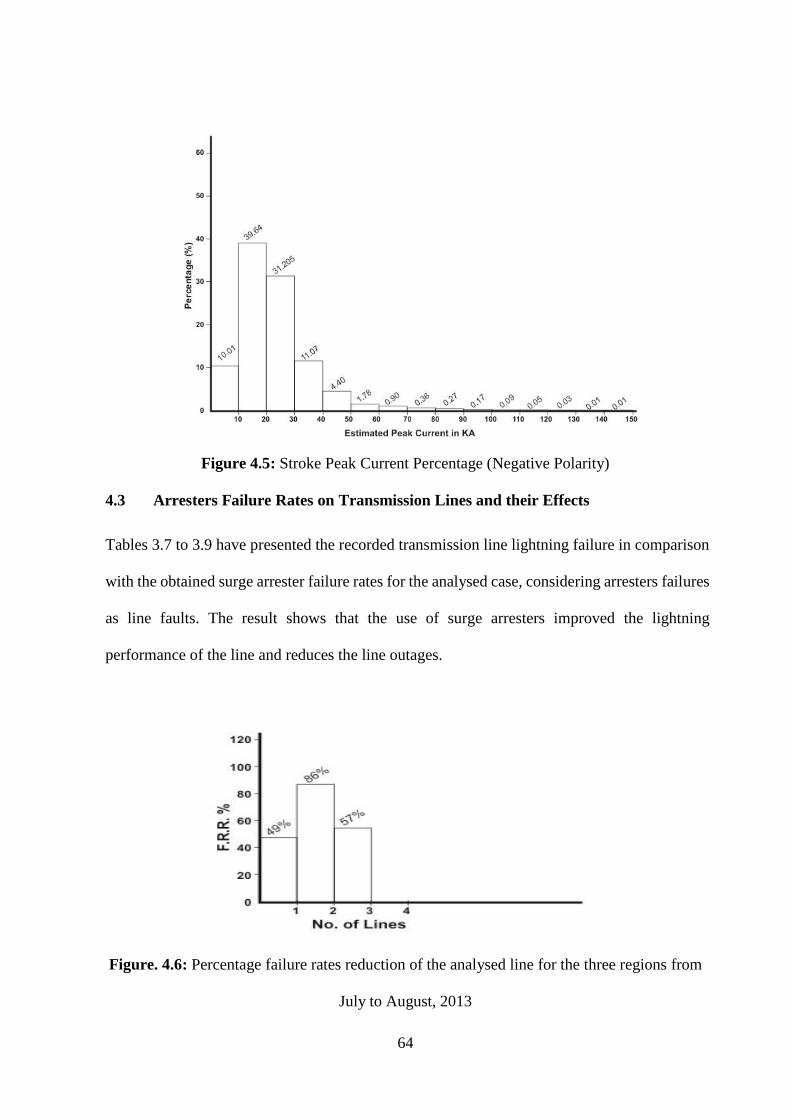
64
Figure 4.5: Stroke Peak Current Percentage (Negative Polarity)
4.3 Arresters Failure Rates on Transmission Lines and their Effects
Tables 3.7 to 3.9 have presented the recorded transmission line lightning failure in comparison
with the obtained surge arrester failure rates for the analysed case, considering arresters failures
as line faults. The result shows that the use of surge arresters improved the lightning
performance of the line and reduces the line outages.
Figure. 4.6: Percentage failure rates reduction of the analysed line for the three regions from
July to August, 2013
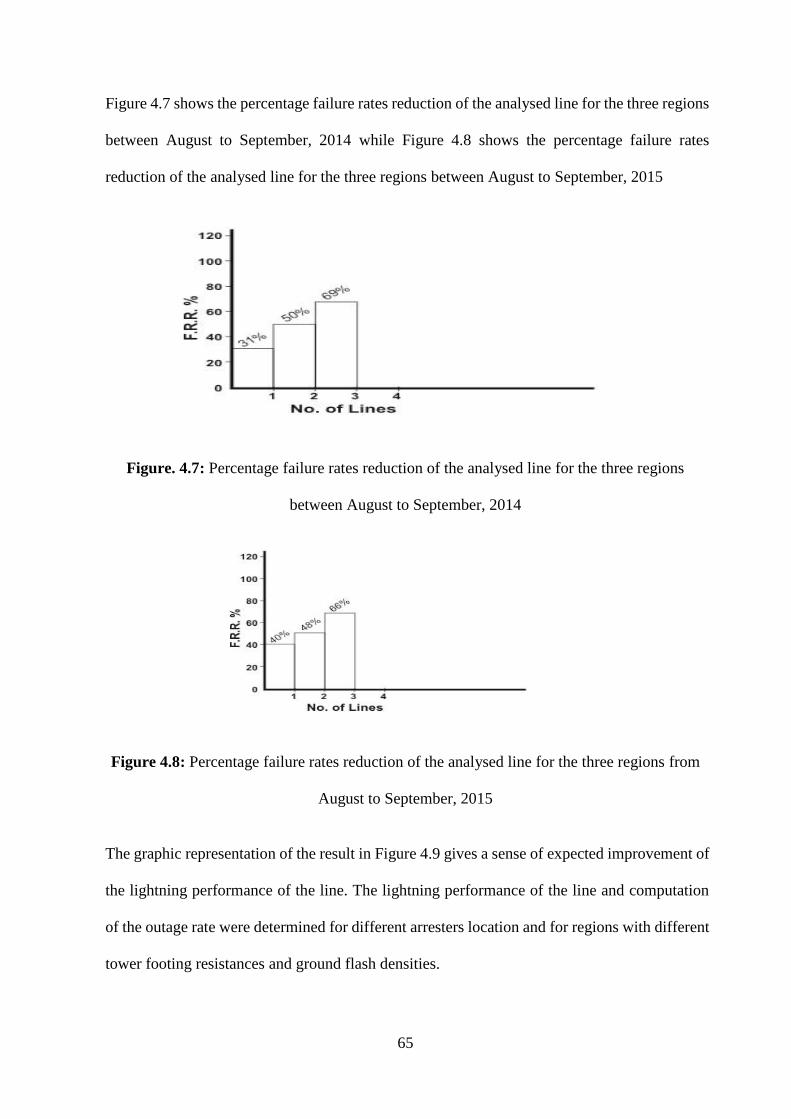
65
Figure 4.7 shows the percentage failure rates reduction of the analysed line for the three regions
between August to September, 2014 while Figure 4.8 shows the percentage failure rates
reduction of the analysed line for the three regions between August to September, 2015
Figure. 4.7: Percentage failure rates reduction of the analysed line for the three regions
between August to September, 2014
Figure 4.8: Percentage failure rates reduction of the analysed line for the three regions from
August to September, 2015
The graphic representation of the result in Figure 4.9 gives a sense of expected improvement of
the lightning performance of the line. The lightning performance of the line and computation
of the outage rate were determined for different arresters location and for regions with different
tower footing resistances and ground flash densities.
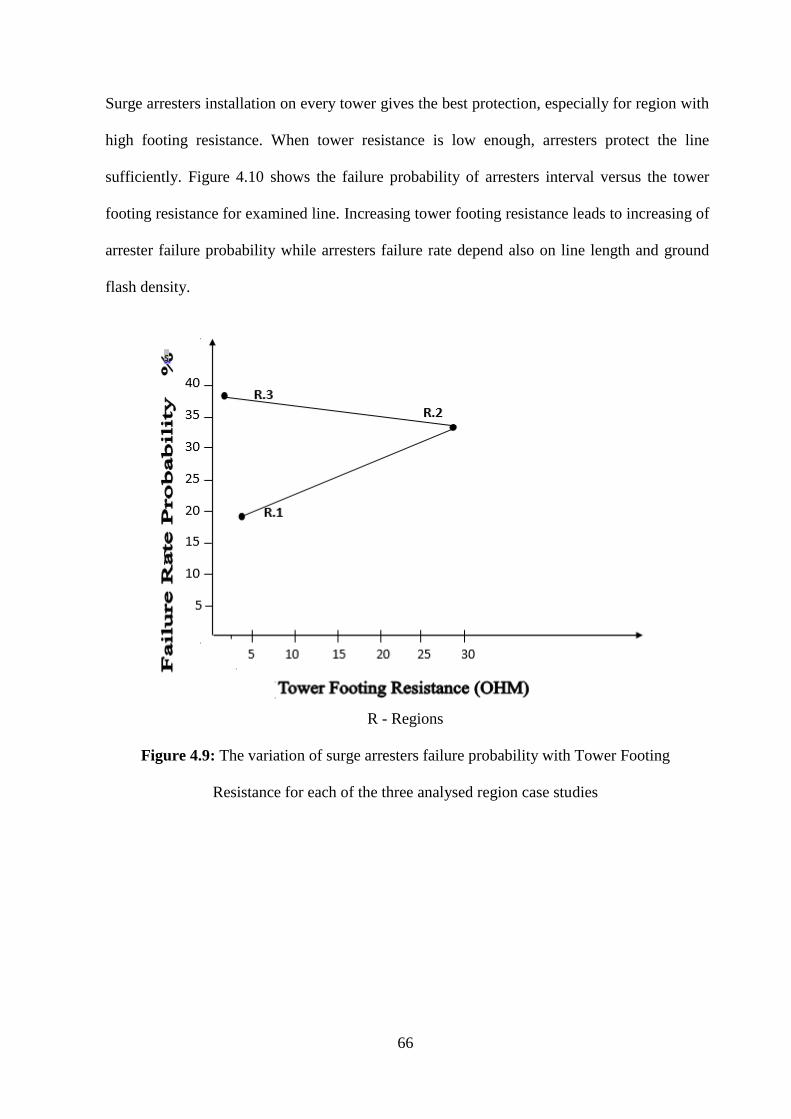
66
Surge arresters installation on every tower gives the best protection, especially for region with
high footing resistance. When tower resistance is low enough, arresters protect the line
sufficiently. Figure 4.10 shows the failure probability of arresters interval versus the tower
footing resistance for examined line. Increasing tower footing resistance leads to increasing of
arrester failure probability while arresters failure rate depend also on line length and ground
flash density.
R - Regions
Figure 4.9: The variation of surge arresters failure probability with Tower Footing
Resistance for each of the three analysed region case studies
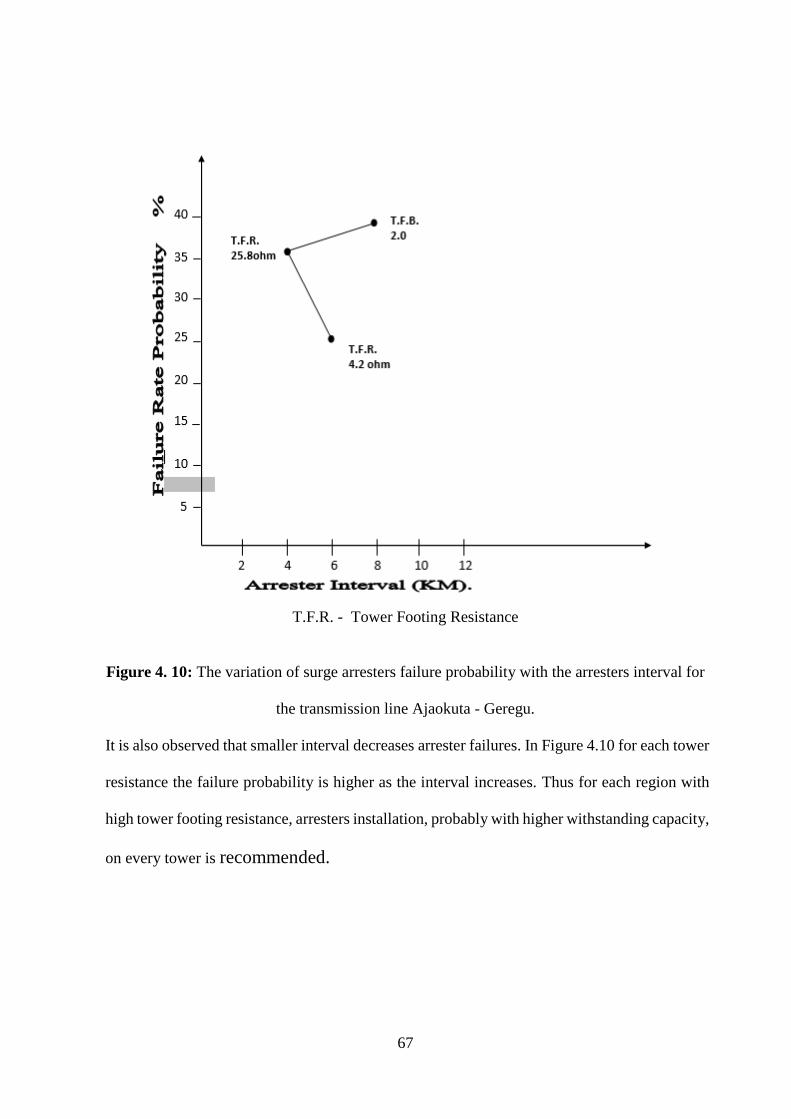
67
T.F.R. - Tower Footing Resistance
Figure 4. 10: The variation of surge arresters failure probability with the arresters interval for
the transmission line Ajaokuta - Geregu.
It is also observed that smaller interval decreases arrester failures. In Figure 4.10 for each tower
resistance the failure probability is higher as the interval increases. Thus for each region with
high tower footing resistance, arresters installation, probably with higher withstanding capacity,
on every tower is recommended.
68
4.4 Findings of the study
(a) In the three years of monitoring of six residences with 15 lightning surge events, only
two were severe enough to cause damage to appliances at current value of 1.27kA and
1.09kA in 2013 and 2015 respectively.
(b) It was observed that there is a ground potential that caused a lightning surge to flow
from ground of one residence or distribution to another.
(c) The data collected based on existing power system network of Ajaokuta revealed the
vast majority of the lightning stroke were less than 30kA.
(d) When tower resistance is low arrester protect the line sufficiently, but with high tower
resistance the protection is not impressive.
(e) Arrester failure probability also depends on arrester interval, increasing the length
increasing the failure rate.
69
4.5 Contributions to Knowledge
(a) The real data recording regarding surges is to assist the company in determining when
SPD is required and when not required.
(b) The failure rate reduction probability revealed that surge arrester installed in every
tower will give the best result.
(c) Characterization of surge events that did not cause damage, the surge events that will
cause subsequent damage and the surge events that resulted in damage were a guide to
ascertain the ratings and positioning of protective devices.
(d) For failure rate reduction the arrester intervals should be considered to be at minimum
distance as much as possible.
70
CHAPTER FIVE
CONCLUSION AND RECOMMENDATIONS
5.1 Conclusion
In this thesis the causes of overvoltage in Ajaokuta power system Network may be internal or
external. Instances of extended high voltages are rare but when they occur significant damage
is done. To maintain high quality power within the facility, it must start with a solid foundation.
This begins by ensuring wirings, grounding and bonding are up to standard, then element such
as quality surge protectors like low-pass fitters, data and signal line protectors to prevent
damage from surges and electrical noise and lightning arresters for external over-voltage can
be installed, then over-voltages can be prevented from system Network and surge damage is
reduced or eliminated.
5.2 Recommendations
Selecting the right power quality device is the optimum remedy to power surge and this involves
several issues to be considered, like your specification should focus on the essential
performance, installation and safety requirements.
It is further recommended that:
(a) The power department should consider the value of the equipment and their data to meet
customers’ satisfaction. Surge can destroy or corrupt data so that it becomes unreliable,
and it can cause significant equipment damage. Review the equipment to be protected,
the cost of repair or replacement, loss of productivity, cost of annoyed customers and
loss of business, and inconvenience to the equipment repaired or replaced.
71
(b) The level of protection needed should be known. The more protection you need, the
greater the cost will be, but keep in mind that the cost of not protecting the power supply
could be much greater still.
(c) Where surge protection is to be installed is highly important since every facility is
different, there is no method of deciding where an SPD should be installed within your
power system. Surge protection needs for a small business differ from that of larger
ones.
The recommendation is that further research should be carried out to determine the design of
the grounding system installations to meet ground resistance requirements, because without
proper grounding the protectors are useless. The soil composition, moisture content and
temperature all impact the resistivity. Soil is rarely homogenous and the resistivity of the soil
will vary geographically and at different soil depths. Also moisture changes seasonally and
varies according to the nature of the sub-layers of the earth
72
REFERENCES
Dharmender, P. (2014). Reasons for failure of transmission lines and their prevention
strategies, International Journal of Electrical, Electronics and Data Communication,
2(1): 14-19.
Gustavo, B., Bogdan, K., and Craig W. (2003). Shunt Capacitor Bank Fundamentals and
Protection, Conference for Protective Relay Engineers - Texas A&M University, April 8-
10, College Station (TX).
Hasssan, H., El-Tamaly, Ayman Yousef Nassef (2017). Study the Integrated of Wind Farm
with Utility Grid, Journal of Scientific and Engineering Research, 4(9):122-136.
Khalid, S., and Bharti Dwived (2011). Power Quality Issues, Problems, Standards & Their
Effects in industry with corrective means, International Journal of Advances in
Engineering & Technology, 1(2):1-11
Kostas, S., and Chris J. Salmas (2007), Electrical Surge Protective Device for Industrial
Faculties- a tutorial review, IEEE Transaction Industry Application, 43(1): 1-11.
Makinde, K., Enemuoh, F. O., Lawal, O. K, Umar I, Abubakar B, and Mahmood M. (2014).
Performance Analysis of Surge Current Protection Using Superconductors, European
Scientific Journal, 10(19): 183-192
Mehdi N., Ghahraman S. and Masoud J. (2014). Comparison of IEEE and Pinceti Models of
Surge Arresters, Research Journal of Engineering Sciences, 3(5), 32-34.
Mungkung N., Wongcharoen S., Tanitteerapan Tanes, Saejao C., and Arunyasot D., (2007),
Analysis of Lightning Surge Condition Effect on Surge Arrester in Electrical Power
System by using ATP/EMTP Program World Academy of Science, Engineering and
Technology, International Journal of Energy and Power Engineering, 1(4).
NEMA, 2013, U.S. Surge Protection Damage Survey. NEMA, Surge Damage Survey Results
– Wave 2.
NFPA 780, 2014, National~ Electrical Code, Standard for the Installation of Lightening
Protection Systems.
Okundamiya, M. S. (2018). Fundamentals of Digital Signal Processing. Benin City: Sciengtex
Publishing.
Okundamiya, M. S., and Nzeako, A. N. (2010). Energy storage models for optimizing
renewable power applications, Journal of Electrical and Power Engineering, 4(2): 54-65
73
Okundamiya, M. S., Udeozor, O. S., and Imade, O. J. (2009). Investigation and evaluation of
voltage drops: A case study of Guinness and Ikpoba Dam injection substations.
International Journal of Electrical and Power Engineering, 3(2), 105–111.
Osahenvemwen, O. A., Okhuomeode, M. E. & Omatahunde, B. E. (2018). Electrical Energy
Losses Reduction using Power Factor Correction Technique, Advances in Electrical and
Telecommunication Engineering, 1(1), 9-16.
Shehab A. A., (2013). Design of Lightning Arresters for Electrical Power Systems Protection.
Power Engineering and Electrical Engineering, 11(6): 433-442.
Sukhdeo Sao, K Prasada Rao. (2013). Effect of Very Fast Transient over voltages at high
frequency in a Gas Insulated Substation during switching operations, International
Journal of Scientific and Research Publications, 3(3): 2250-3153
Teru M., (2010). Field study of lighting surges propagating into residences, IEEE transactions
on electromagnetic capability, 52(4): 211-221
.


![Switching Surges Handout[1]](https://img.pdfslide.net/doc/110x75/5439dc86afaf9fbd2e8b5532/switching-surges-handout1.jpg)