Embed Size (px)
Citation preview

Public
Analysis of Electricity Forward Market
Hedging Opportunities in Finnish,
Estonian, Latvian and Lithuanian Bidding
Zones´ Borders
Commissioned by The Finnish Energy Authority
2/18/2021
THEMA Report 2021-02

THEMA-Report 2020-02 Analysis of Electricity Forward Market Hedging Opportunities in Finnish, Estonian, Latvian and Lithuanian Bidding Zones´ Borders
Page ii THEMA Consulting Group
Øvre Vollgate 6, 0158 Oslo, Norway www.thema.no
About the project About the report
Project number: EAF-20-01 Report name: Analysis of Electricity Forward Market Hedging Opportunities in Finnish, Estonian, Latvian and Lithuanian Bidding Zones´ Borders
Project name: Analysis of Electricity Forward Market Hedging Opportunities in Finnish and Baltic Zones
Report number: 2020-02
Client: The Finnish Energy Authority ISBN-number: 978-82-8368-085-0
Project leader: Marius Holm Rennesund Availability: Public
Project participants: Julian Hentschel Lars J. Berg Byenstuen Eirik Aronsveen Haavard Holta
Completed: 18/2-21
Brief summary
In this report, we examine possible measures of the sufficiency of hedging opportunities in the Finnish, Estonian, Latvian and Lithuanian bidding zones, as well as the bordering bidding zones in Sweden (SE1, SE3, SE4) and Norway (NO4).
This work follows the calculation of the measures specified in the NordREG Methodology, including open interest, the trading horizon, traded volumes, bid-ask spreads, churn rates, ex-post risk premia, correlation coefficients, and the Amihud Illiquidity ratio.
About THEMA Consulting Group
Øvre Vollgate 6 0158 Oslo, Norway Company no: NO 895 144 932 www.thema.no
THEMA Consulting Group is a Norwegian consulting firm focused on Nordic and European energy issues, and specializing in market analysis, market design and business strategy.
Disclaimer
Unless stated otherwise, the findings, analysis and recommendations in this Analysis of Electricity Forward Market Hedging Opportuni-ties in Finnish, Estonian, Latvian and Lithuanian Bidding Zones´Borders report are based on publicly available information and commercial reports. Certain statements in this report may be statements of future expectations and other forward-looking statements that are based on THEMA Consulting Group AS (THEMA) its current view, modelling and assumptions and involve known and unknown risks and uncertainties that could cause actual results, performance or events to differ materially from those expressed or implied in such statements. THEMA does not accept any liability for any omission or misstatement arising from public information or information provided by the Client. Every action undertaken on the basis of this report is made at own risk. The Client retains the right to use the information in this report in its operations, in accordance with the terms and conditions set out in terms of engagement or contract related to this report. THEMA assumes no responsibility for any losses suffered by the Client or any third party as a result of this report, or any draft report, distributed, reproduced or otherwise used in violation of the provisions of our involvement with the Client. THEMA expressly disclaims any liability whatsoever to any third party. THEMA makes no representation or warranty (express or implied) to any third party in relation to this report. Any release of this report to the public shall not constitute any permission, waiver or consent from THEMA for any third party to rely on this document.

CONTENT
1 SUMMARY ........................................................................................................................... 3
2 HEDGING OPPORTUNITIES IN THE FINNISH, ESTONIAN, LATVIAN AND LITHUANIAN BIDDING ZONES ............................................................................................................................................. 6
2.1 Hedging tools ............................................................................................................ 6
2.1.1 Power futures ............................................................................................................ 6
2.1.2 Electricity Price Area Differential (EPADs) ................................................................. 6
2.1.3 Transmission rights ................................................................................................... 6
2.1.4 Power Purchase Agreements (PPAs) ......................................................................... 7
2.1.5 Coal, gas and (carbon) emissions futures ................................................................. 7
2.2 Approaches to hedging ............................................................................................. 7
2.2.1 Suppliers, generators and consumers ....................................................................... 7
2.2.2 Hedger size ................................................................................................................ 8
3 NORDREG METRICS ............................................................................................................. 9
3.1 Data summary ........................................................................................................... 9
4 DESCRIPTIVE MEASURES ................................................................................................... 10
4.1 Open interest .......................................................................................................... 10
4.1.1 Open interest system price contracts ...................................................................... 10
4.1.2 Open interest EPADS contracts ............................................................................... 12
4.1.3 Summing up open interest ...................................................................................... 14
4.2 Open interest in relation to physical consumption ................................................ 14
4.2.1 Open interest in relation to physical consumption in system price contracts......... 14
4.2.2 Open interest in relation to physical consumption in EPAD contracts .................... 15
4.2.3 Summing up open interest in relation to physical consumption ............................. 16
4.3 Trading horizon ....................................................................................................... 16
4.4 Traded volumes....................................................................................................... 17
4.4.1 Traded volumes system price contracts .................................................................. 17
4.4.2 Traded volumes EPAD contracts ............................................................................. 17
4.4.3 Summing up daily traded volumes .......................................................................... 19
4.5 Traded volumes in relation to physical consumption/Churn rate .......................... 19
4.5.1 Traded volumes for system price contracts in relation to physical consumption/Churn rate 20
4.5.2 Traded volumes for EPAD contracts in relation to physical consumption/Churn rate20
4.5.3 Summing up churn rate ........................................................................................... 21
5 PRICE MEASURES ............................................................................................................... 22
5.1 Ex-post risk premiums ............................................................................................. 22

THEMA-Report 2020-02 Analysis of Electricity Forward Market Hedging Opportunities in Finnish, Estonian, Latvian and Lithuanian Bidding Zones´ Borders
Page 2 THEMA Consulting Group
Øvre Vollgate 6, 0158 Oslo, Norway www.thema.no
5.1.1 Summing up Ex post risk premiums ........................................................................ 29
5.2 Amihud Illiquidity ratio ........................................................................................... 29
5.2.1 Summing up the Amihud illiquidity ratio ................................................................ 31
6 TRANSACTION COST MEASURES ....................................................................................... 32
6.1 Bid-ask spreads ....................................................................................................... 32
6.1.1 Bid-ask spreads system price contracts .................................................................. 32
6.1.2 Bid-ask spreads EPAD contracts .............................................................................. 35
6.1.3 Summing up Bid-ask spreads .................................................................................. 39
7 CORRELATION .................................................................................................................... 41
7.1.1 Summing up the correlations .................................................................................. 44
8 APPENDIX .......................................................................................................................... 46
8.1 Additional metric calculations ................................................................................ 46
8.1.1 Amihud Illiquidity Ratio – EPADs ............................................................................. 46
8.1.2 Correlation analysis ................................................................................................. 50

THEMA-Report 2020-02 Analysis of Electricity Forward Market Hedging Opportunities in Finnish, Estonian, Latvian and Lithuanian Bidding Zones´ Borders
Page 3 THEMA Consulting Group
Øvre Vollgate 6, 0158 Oslo, Norway www.thema.no
1 SUMMARY
In this report, we examine possible measures of the sufficiency of hedging opportunities in the Finnish, Estonian, Latvian and Lithuanian bidding zones, as well as the bordering bidding zones in Sweden (SE1, SE3, SE4) and Norway (NO4).
This work follows the calculation of the measures specified in the NordREG Methodology, including open interest, the trading horizon, traded volumes, bid-ask spreads, churn rates, ex-post risk premia, correlation coefficients, and the Amihud Illiquidity ratio.
We find that open interest in system price contracts was stable from around 2013 to 2018 but experienced a notable decline from the start of 2019. This implies a decline in the size of exposures being hedged using such contracts and may suggest declining liquidity. Total open interest in EPAD contracts has been stable throughout the studied period. There is even a slight increase in the use of EPADs in 2020. Looking at the relevant EPAD contracts, open interest in both TAL (Tallin) and RIG (Riga) EPADs is much lower than that of the other EPADS examined, at around 0.1 TWh each. The exposures hedged using these products are therefore likely to be much smaller than for other EPADs and the liquidity of the products relatively poor in comparison. The Helsinki (HEL) EPAD has had a stable and relatively high level of open interest throughout the studied period at around 30-40 TWh. This is broadly comparable to the open interest for Stockholm EPADs, and significantly higher than open interest for Luleå, Malmö and Trondheim EPADs (with open interests in the 1-9 TWh range). This Helsinki contract is therefore likely to be significantly more liquid.
The figures for open interest in relation to physical consumption mirror the results for open interest. For system price contracts, open interest in relation to physical consumption has remained stable throughout the studied period at around 0.2-0.4. Similarly, for the HEL EPAD, this measure has remained stable throughout the studied period at around 0.3. Levels for RIG and TAL EPADs have remained low, reflecting the low absolute levels of open interest in these contracts. The values in the TAL and RIG EPADs vary between 0 and 0.05 and indicate low liquidity for these specific products. The HEL EPAD appears to be considerably more liquid in comparison.
Total traded volumes in system price contracts increased between 2014 and 2017 but have fallen back in recent years, indicating worsening liquidity. Daily traded volumes in EPADs have been varied around 0.5 TWh. For the specific EPADs, daily traded volumes have been stable throughout the period, albeit at very low levels in some areas, notably TAL and RIG. These two EPADs have daily traded volumes below 0.005 TWh (cf. numbers above 0.1 TWh for HEL and STO EPADs). For the TAL and RIG EPADs, we also see extended periods without any trading activity, which almost certainly reflects low liquidity on the exchange. Daily traded volumes for the HEL EPAD are higher, at around 0.1-0.3 TWh, suggesting relatively high liquidity.
The churn rate for system price contracts has declined in the last six years, reaching a level of around 2 in 2019. This reflects declining volumes of trade. For both the TAL and RIG EPAD, the churn rate has been below 0.2 for the last five years. For HEL, the churn rate has varied at around 0.5 to 1.5 throughout most of the studied period. These figures highlight that traded volumes for the TAL and RIG EPAD are comparatively low even when accounting for differences in the level of consumption between different bidding zones.
None of the system price contracts have ex-post risk premia that are statistically significantly different from zero at a five percent level of significance. We, therefore, conclude that there is no systematic difference in these derivatives’ prices compared to underlying spot prices. The same is true for the TAL EPAD. Both the RIG and HEL EPADS have premia that are statistically different from zero for the monthly contracts. The same is also true of the quarterly RIG EPAD contract. Consumers appear to pay a premium to buy forward in these areas using these contracts. This suggests that demand for EPADs outweighs supply in these areas, that buyers are more averse to holding power price risk than sellers, or some combination of the two.
There seems to be no clear trend in the development of bid-ask spreads for system price products, although yearly products do appear to have had lower average spreads after 2018. The system price contracts show relatively tight bid-ask spreads for the longer contracts (year, month and quarter), at around 0.5 EUR/MWh,

THEMA-Report 2020-02 Analysis of Electricity Forward Market Hedging Opportunities in Finnish, Estonian, Latvian and Lithuanian Bidding Zones´ Borders
Page 4 THEMA Consulting Group
Øvre Vollgate 6, 0158 Oslo, Norway www.thema.no
but higher spreads for the near-term contracts, on the order of 1–2 EUR/MWh. This likely reflects the relative illiquidity of near-term contracts.
We see that for all durations, the RIG and TAL EPADs have relatively high bid-ask spreads. These are around 5 EUR/MWh for the RIG EPAD and vary in the range 1–13 EUR/MWh for the TAL EPAD. The size of these spreads suggests both poor liquidity and high transaction costs for market participants. The HEL EPAD has lower spreads (below 1 EUR/MWh), comparable to some of the other EPADs studied.
Over the last five years, the correlation analysis shows that there has been a high degree of correlation between spot prices in Finland and the Baltic states, with correlation coefficients in excess of 0.8. There is also a high degree of correlation among prices within the Baltic States. The correlation between the Nordic system price and that in Finland is relatively high (greater than 0.8), while zonal prices in the Baltic States are markedly less correlated with the system price.
Looking at the trends over time, it is clear that the latter half of 2020 saw a significant decoupling in terms of the system price with area prices in Finland and the Baltic states. This is reflected in a sharply declining correlation between weekly average spot prices in this period. This change may have motivated some of the increase in open interest for EPADs noted earlier. Correlation between Finland and the Baltic states also appears to have worsened somewhat since mid-2019, potentially reducing the attractiveness of proxy hedging in the Baltic states using Helsinki EPADs. In contrast, correlation among the Baltic states as a group appears to have improved, with very close correlation in prices among the Baltic states in 2020 and correlation coefficients for weekly average among these countries prices of close to 1.
Table 1 Summing up the key findings
System price HEL EPAD RIG EPAD TAL EPAD
Open interest Stable 2013 to 2018, decline from early 2019 may suggest declining liquidity
Stable at 30-40 TWh, suggests relatively good liquidity
Broadly stable at low level (≈0.1 TWh), suggests poor liquidity. Uptick in 2020
Stable at low level (≈0.1 TWh), suggests poor liquidity
Open interest/ physical consumption
Stable at 0.2-0.4 Stable at 0.3 suggesting relatively good liquidity
Stable at 0-0.05, suggesting low liquidity
Stable at 0-0.05, suggesting low liquidity
Traded volume Increased between 2014 and 2017 but have fallen back in recent years, indicating worsening liquidity
Stable at around 0.1-0.3 TWh, suggesting relatively good liquidity
Stable at low level (<0.005 TWh), suggesting poor liquidity
Stable at low level (<0.005 TWh), suggesting poor liquidity
Churn rate Decreasing to 2 in 2019, suggesting worsening liquidity
Varying between 0.5 and 1.5 in the studied period
Stable at a low level of below 0.2, suggesting poor liquidity
Stable at a low level of below 0.2, suggesting poor liquidity
Risk premiums Not significant at a 5% level, indicating no systematic difference in these derivatives’ prices compared to the underlying spot price
Statistically different from zero for the monthly contracts. Consumers appear to pay a premium to buy forward.
Statistically different from zero for the quarterly contracts. Consumers appear to pay a premium to buy forward.
Not significant at a 5% level, indicating no systematic difference in these derivatives’ prices compared to the underlying spot price

THEMA-Report 2020-02 Analysis of Electricity Forward Market Hedging Opportunities in Finnish, Estonian, Latvian and Lithuanian Bidding Zones´ Borders
Page 5 THEMA Consulting Group
Øvre Vollgate 6, 0158 Oslo, Norway www.thema.no
System price HEL EPAD RIG EPAD TAL EPAD
Amihud illiquidity ratio
The Amihud measure should be used with caution when assessing liquidity because of the lack of empirical evidence on its use from commodity/electricity markets. The calculated ratios provide results that are counter-intuitive and conflict with some of the other indicators in this report.
Bid/Ask spreads
No clear trend. Around
0.5 EUR/MWh
Relatively low (below 1 EUR/MWh)
Relatively high (around 5 EUR/MWh) indicating both poor liquidity and high transaction costs for market participants
Relatively high (1–13 EUR/MWh) indicating both poor liquidity and high transaction costs for market participants
Correlation Generally well correlated with system price and prices in the Baltic states, albeit with marked weakening of correlation in 2020.
Less correlated with system price, but generally well correlated with other Baltic countries and Finland. Recently, correlation with Finland has weakened and correlation with other Baltic states has strengthened.
Less correlated with system price, but generally well correlated with other Baltic countries and Finland. Recently, correlation with Finland has weakened and correlation with other Baltic states has strengthened.

THEMA-Report 2020-02 Analysis of Electricity Forward Market Hedging Opportunities in Finnish, Estonian, Latvian and Lithuanian Bidding Zones´ Borders
Page 6 THEMA Consulting Group
Øvre Vollgate 6, 0158 Oslo, Norway www.thema.no
2 HEDGING OPPORTUNITIES IN THE FINNISH, ESTONIAN, LATVIAN AND LITHUANIAN BIDDING ZONES
In this section, we set out background information on the tools used to hedge power price risk. We also provide some general discussion of typical approaches to hedging price risk and how these differ among market actors based on their hedging needs.
2.1 Hedging tools
Power price risk can be managed in a variety of ways and, in this section, we outline the main tools used by market actors for this purpose. For completeness, it should be noted that firms can also manage these risk exposures through the maintenance of greater capital reserves and vertical integration, namely the joint- ownership of both generation and consumption or supply businesses. In the latter case, the firm alters its structure to help ensure that price risk exposure is offset internally within its business. These approaches to risk management, though commonly observed, are not discussed further below, since they do not constitute what are typically thought of as hedging strategies.
2.1.1 Power futures
Futures contracts are standardised financial contracts for power that effectively allow market participants to lock in a price for power delivered in future periods. Financial futures contracts do not entail any physical power supply. Rather, during the delivery period specified by the contract, cash is exchanged between the market participant and the exchange such that these payments make up for any difference between the future contract’s price before delivery and the power price during the delivery period. Changes in the value of the futures contract between the time of a trade and delivery will also be settled between the exchange and the market party, with the timing of this settlement varying between different contract types.
In some markets, forwards offer participants a similar ability to fix prices ahead of delivery, but result in the physical delivery of power, rather than cash settlement.
In most Continental European power markets, power futures are referenced against the spot price of a specific bidding zone. In the Nordic market, such contracts a reference against the Nordic system price, rather than the price of a specific bidding zone. The system price is calculated as the clearing price that would be obtain if clearing the entire Nordic region as a single bidding zone, ignoring transmission constraints between Nordic bidding zones.
Futures contracts can cover delivery periods of different lengths and may also be profiled within that period, for example covering only certain peak settlement periods.
2.1.2 Electricity Price Area Differential (EPADs)
Since Nordic futures are referenced against the Nordic system price, they cannot be used directly to hedge the power price of a specific bidding zone. EPADs are similar financial contracts that reference the spread between a specific Nordic bidding zone and the system price. They are available as baseload contracts (i.e. with no profiling). Combining an EPAD for a specific bidding zone with a system-price future contract effectively produces a futures contract referenced to the specific area price. Combing the purchase of an EPAD for one zone with the offsetting sale of an EPAD in another zone produces a financial contract (a so-called EPAD Combo) that hedges the price between the two zones.
Exchange-traded EPADs do not exist for all Nordic bidding zones and do not currently cover Lithuania, although over-the-counter (OTC) contracts may be available bilaterally.
2.1.3 Transmission rights
Transmission rights are contracts typically issued by transmission owners that provide the holder with a right or obligation to flow power in a specific direction between connected bidding zones. Such rights are typically

THEMA-Report 2020-02 Analysis of Electricity Forward Market Hedging Opportunities in Finnish, Estonian, Latvian and Lithuanian Bidding Zones´ Borders
Page 7 THEMA Consulting Group
Øvre Vollgate 6, 0158 Oslo, Norway www.thema.no
issued as Financial Transmission Rights (FTRs) and are financial in the sense that the right is cash-settled based on the price spread between the relevant zones. An FTR option provides the holder with the price spread only where this spread is positive. An FTR obligation will result in a payment between the holder and issuer of the obligation that reflects the direction of the relevant price spread. For example, if the obligation involves flowing power from a low- to a high-price zone, the obligation will be profitable and result in a payment to the holder of the obligation. If, however, the obligation is from a high- to a low-price area, the obligation holder is liable to pay the spread to the issuer.
Such contracts can be used to hedge the price spread between connected zones directly. They can also allow market participants to hedge using futures (or other hedging instruments) referenced against power prices in the other bidding zone. In the latter case, the transmission rights allow the firm to manage the risk that the reference price differs from the power price to which they are exposed (so-called basis risk).
2.1.4 Power Purchase Agreements (PPAs)
Power Purchase Agreements are bilateral agreements for the sale of power. They typically cover periods of 5-15 years and are often, though not necessarily, physical contracts, resulting in the provision of power rather than cash settlement. As bespoke contracts, the specific terms can vary from contract to contract. Often the contract will specify the profile and volume of power to be delivered, the delivery location and the agreed price. The contract may also include covenants designed to ensure the creditworthiness of the parties involved and may require that the counterparties have guarantees provided by banks or parent companies.
PPAs may be sold by specific generation projects or by utilities. In the latter case, the power is generally supplied by a portfolio of sites. Where power is sold by a variable generator, such as an onshore wind site, the volume of power sold under the PPA will often be ‘shaped’ or ‘sleeved’ by a third party that takes responsibility for correcting any mismatch between the generation project’s output and the volume of power that must be supplied under the PPA.
PPAs allow the parties involved to agree on the future price of power in advance and therefore reduce their exposure to changes in the spot price of power for the delivery period specified in the PPA.
2.1.5 Coal, gas and (carbon) emissions futures
A variety of other commodity futures exist and are used by some market actors in their power price hedging activity. These futures are similar to power futures, except that they reference the price of another traded commodity, such as coal, gas or emissions allowances. In bidding zones where the power price is strongly linked to the marginal costs of gas-fired generation, for example, there may be a strong correlation between power prices and gas prices. In this case, power prices could be hedged through the use of gas futures, with these futures acting as a proxy to hedge the actor’s fundamental power price risk exposure. Such hedges are so-called ‘proxy hedges’ and typically entail some degree of risk (so-called basis risk) due to a potential mismatch in changes between the actual price to which the actor is exposed (the power price) and the price referenced by the hedging instrument (the gas price). This risk may be justified, for example, because of the greater liquidity or lower costs associated with the use of proxy hedging instruments.
2.2 Approaches to hedging
Hedging needs and strategies vary among market actors. However, there are some commonalities in the nature of organisations’ risk exposure and hedging options that produce some common approaches to hedging. We set these out briefly here. These generalisations reflect common approaches and are not necessarily true in all cases.
2.2.1 Suppliers, generators and consumers
The hedging needs and objectives of any market actor are often largely defined by its role as a supplier, generator or consumer. As such, hedging strategies are often similar among different participants within the same group.

THEMA-Report 2020-02 Analysis of Electricity Forward Market Hedging Opportunities in Finnish, Estonian, Latvian and Lithuanian Bidding Zones´ Borders
Page 8 THEMA Consulting Group
Øvre Vollgate 6, 0158 Oslo, Norway www.thema.no
Suppliers’ risk exposure generally arises from entering into supply contracts with fixed, or partly fixed, prices. The supplier is therefore exposed to power price risk due to the need to purchase power to meet these supply obligations. Generally speaking, power price volatility is relatively large in comparison to the margin charged on the supply contract. A pure supplier will generally, therefore, seek to secure this margin by buying power sufficient to cover its supply obligations under any agreement shortly after the supply agreement is entered into. It may practice a so-called back-to-back hedging strategy, in which fixed-price supply commitments are fully or close-to-fully hedged as soon as they are made and any changes in expected volumes are quickly reflected in the volume of power hedged. Where there are significant changes in the market shares between suppliers, or rapid changes in the volumes of contracts with fixed prices, liquid hedging instruments are especially important to hedgers pursuing such a strategy. Conversely, a lack of liquid instruments may weaken competition for fixed-price supply contracts.
Generators are typically looking to hedge over relatively long timeframes, reflecting the relative certainty that their physical assets will still be available and owned by them several years into the future. Although power prices are a very significant determinant of generator revenues, the importance of revenue stability to owners and management varies. Hedging activity will often be influenced significantly by the firm’s expectations of future power price developments relative to the market.
Although consumers’ direct exposure to the power price may be lower than that of generators, business consumers and especially energy-intensive consumers often operate a margins business in which the power price can mean the difference between making a net profit and a net loss. Where power cost volatility is high relative to the margin, hedging may therefore be important, even where power costs are only one of a number of cost drivers. Like generators, hedging behaviour will also be influenced by expectations of future prices. However, hedging decisions by manufactures will also be significantly influenced by considerations related to their end market. In particular, the desired hedging horizon will reflect the business’ certainty over future orders and activity. The desire to hedge will also often be informed by an assessment of the firm’s likely future competitiveness if power costs are hedged. For example, while it might seem attractive to purchase power futures when prices are low, this wouldn’t necessarily be a good idea if you expect competitors’ power costs to sink much lower in the relevant period.
2.2.2 Hedger size
Actors’ approach to hedging is also determined to some extent by the organisation’s administrative capacity. Consumers and smaller actors will typically have fewer staff members responsible for power price hedging. For these actors, the administrative burdens of direct exchange membership may be prohibitive and therefore a bank or broker will be used to help support hedging activity. Large consumers may have sufficient resources to run periodic PPA processes themselves but may still not wish to commit to the ongoing administrative costs of direct exchange membership. In contrast, large generators are already relatively well-informed on market developments and may be able to conduct fundamental power market analysis independently. As such, they and are more likely to trade directly on the exchange or to seek to trade bilaterally using their wider network of potentially interested counterparties.
Banks, brokers and trading firms sometimes act as intermediaries, offering retail power price hedging services to smaller actors, often alongside related services such as lines of credit or balancing management.

THEMA-Report 2020-02 Analysis of Electricity Forward Market Hedging Opportunities in Finnish, Estonian, Latvian and Lithuanian Bidding Zones´ Borders
Page 9 THEMA Consulting Group
Øvre Vollgate 6, 0158 Oslo, Norway www.thema.no
3 NORDREG METRICS
In the following sections, we conduct a quantitative assessment of the sufficiency of hedging opportunities for Finnish, Estonian, Latvian and Lithuanian Bidding Zones as well as the bordering bidding zones SE1, SE3, SE4 and NO4.
This work follows the calculation of the measures specified in the NordReg Methodology, including the open interest, trading horizon, traded volumes, bid-ask spreads, churn rates, ex-post risk premia, correlation, and the Amihud Illiquidity ratio.
We have received data on both system price and EPAD products from Nasdaq. Measures have been calculated on a Nordic basis and for the different bidding zones.
3.1 Data summary
The calculation of the measures in the following section was done using data provided by Nasdaq. Three different data sets were made available. The first covered data on open interest for the time period from 04.03.2012 to 31.08.2020, including the daily open interest of individual contracts, expressed as the number of contracts and the volume and the value of the contracts. The second data set used was end-of-day trading data for the time period 02.01.2012 to 30.06.2020, including the daily trading data of individual contracts, including the volumes traded, closing/opening price, best bid/ask and high/low price. The third data set included trading data for the same time period as the end-of-day data, and included deal source, deal price, number of contracts traded, the size of the contracts and the volumes traded. All data sets covered both EPAD and Nordic system price contracts.
To give an overview of the sample size, and the number of the unique contracts in the data, Table 2 shows the count of individual contracts in the end-of-day trading data.
Table 2: Number of unique contracts included in the qualitative analysis
Day Month Quarter Week Year Total
Base
DS Futures
22 15
11 48 Futures 2
79
81
Options
227
249 476 Base Day
Futures 522
522 EPAD
DS Futures
180 82
45 307 Peak
DS Futures
18 8
2 28 Futures
78
78
Power Base
DS Futures
90 38
14 142 Futures
63 29 381 15 488
Options
2 109
119 230 Power Day
Futures 2593
2593 Power EPAD
DS Futures
936 335
80 1351 Futures
680 254 1890 96 2920
Power Peak
DS Futures
29 12
3 44 Futures
124
124
Total 3111 1994 1053 2543 571 9272

THEMA-Report 2020-02 Analysis of Electricity Forward Market Hedging Opportunities in Finnish, Estonian, Latvian and Lithuanian Bidding Zones´ Borders
Page 10 THEMA Consulting Group
Øvre Vollgate 6, 0158 Oslo, Norway www.thema.no
4 DESCRIPTIVE MEASURES
4.1 Open interest
Open interest refers to the total size of open positions with a clearing house at a given point in time. When a market participant wishes to hedge a physical exposure to the power price using financial derivatives, they will create an open position for the relevant contract and keep this position until delivery. When a speculator trades such contracts, he or she will typically open a position by buying or selling the relevant contract and then close this position at a later point using an offsetting trade. For example, they will try to buy the contract when priced low and then sell it at a higher price. As such, information on the size, distribution and dynamics of open interest can be used to infer the volume of physical exposures that are being hedged and the composition of products used to construct these hedges. Trends in the level of open interest reflect changes in the amount of money brought into the futures market and the scale of futures being used for hedging as opposed to speculation. For individual contracts, there will typically be a steady increase in open interest from the beginning of the trading period until the last trading day before delivery. This occurs as hedges are built up over time. Just ahead of contract delivery there is a sudden drop in open interest for the relevant contract caused by cascading, the process by which open positions in a specific contract are transformed into open positions in shorter contracts covering the same delivery period. For example, open positions in a yearly contract are transformed into open positions in four quarterly contracts shortly before the start of the relevant delivery year. The resulting drop in open interest in the yearly contract is therefore perfectly offset by the increase in open interest for quarterly contracts.
4.1.1 Open interest system price contracts
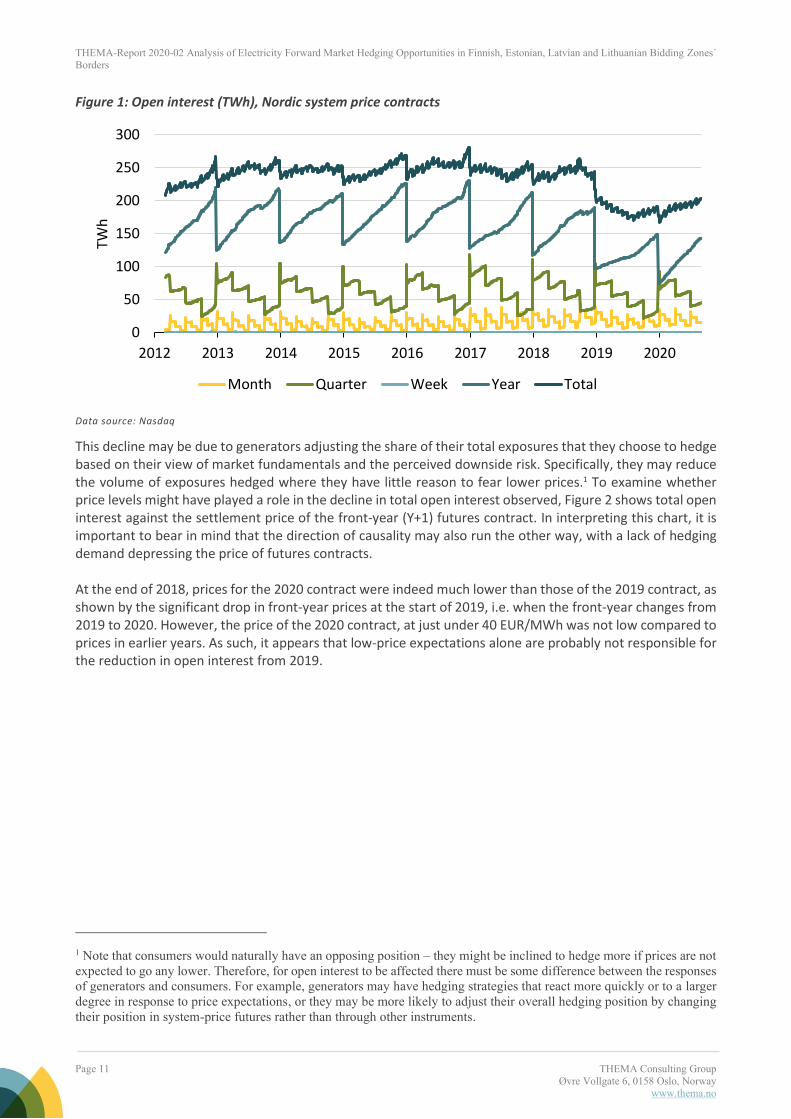
The figure shows that the bulk of open interest in Nordic system price contracts is established in yearly contracts. It also shows that total open interest was stable from around 2013 to 2018, but there is a notable decline from the start of 2019. This decline suggests that the volume of physical exposures being hedged using Nordic system price futures has fallen.
Figure 1 presents the open interest (TWh) in Nordic system price contracts for the period 2012 to 2021. Separate lines are shown for weekly, monthly, quarterly, and yearly contracts. The figure shows that the bulk of open interest in Nordic system price contracts is established in yearly contracts. It also shows that total open interest was stable from around 2013 to 2018, but there is a notable decline from the start of 2019. This decline suggests that the volume of physical exposures being hedged using Nordic system price futures has fallen.
THEMA-Report 2020-02 Analysis of Electricity Forward Market Hedging Opportunities in Finnish, Estonian, Latvian and Lithuanian Bidding Zones´ Borders
Page 11 THEMA Consulting Group
Øvre Vollgate 6, 0158 Oslo, Norway www.thema.no
Figure 1: Open interest (TWh), Nordic system price contracts
Data source: Nasdaq
This decline may be due to generators adjusting the share of their total exposures that they choose to hedge based on their view of market fundamentals and the perceived downside risk. Specifically, they may reduce the volume of exposures hedged where they have little reason to fear lower prices.1 To examine whether price levels might have played a role in the decline in total open interest observed, Figure 2 shows total open interest against the settlement price of the front-year (Y+1) futures contract. In interpreting this chart, it is important to bear in mind that the direction of causality may also run the other way, with a lack of hedging demand depressing the price of futures contracts. At the end of 2018, prices for the 2020 contract were indeed much lower than those of the 2019 contract, as shown by the significant drop in front-year prices at the start of 2019, i.e. when the front-year changes from 2019 to 2020. However, the price of the 2020 contract, at just under 40 EUR/MWh was not low compared to prices in earlier years. As such, it appears that low-price expectations alone are probably not responsible for the reduction in open interest from 2019.
1 Note that consumers would naturally have an opposing position – they might be inclined to hedge more if prices are not
expected to go any lower. Therefore, for open interest to be affected there must be some difference between the responses
of generators and consumers. For example, generators may have hedging strategies that react more quickly or to a larger
degree in response to price expectations, or they may be more likely to adjust their overall hedging position by changing
their position in system-price futures rather than through other instruments.
0
50
100
150
200
250
300
2012 2013 2014 2015 2016 2017 2018 2019 2020
TWh
Month Quarter Week Year Total

THEMA-Report 2020-02 Analysis of Electricity Forward Market Hedging Opportunities in Finnish, Estonian, Latvian and Lithuanian Bidding Zones´ Borders
Page 12 THEMA Consulting Group
Øvre Vollgate 6, 0158 Oslo, Norway www.thema.no
Figure 2: Daily total open interest (TWh) against front year daily settlement price (EUR/MWh)
Data source: Nasdaq (for open interest) and Nasdaq (via Montel, for settlement price)
4.1.2 Open interest EPADS contracts
Figure 3 shows the daily total open interest (TWh) in EPAD contracts, for all bidding zones. Total open interest in EPAD contracts has been stable throughout the studied period. There is even a slight increase in the use of EPADs in 2020. This may reflect higher perceived area price risk – 2020 was marked by a record high hydrological balance in Norway and limited transmission capacity between Norway and Sweden due to outages.
Figure 3: Total open interest (TWh) EPADs, all bidding zones
Data source: Nasdaq
Figure 4, Figure 5 and Figure 6 show the daily total open interest (TWh) in EPAD contracts for the relevant bidding zones. For both TAL (Tallin) and RIG (Riga) EPADs, open interest has been at around 0.1 TWh in recent years. There seems to have been an increase in open interest in the RIG EPAD over the last couple of years.
0
10
20
30
40
50
60
0
50
100
150
200
250
300
2017 2018 2019 2020
Sett
lem
ent
pri
ce (
EUR
/MW
h)
Tota
l op
en in
tere
st (
TWh
)
Open interest Y+1 future price
0
20
40
60
80
100
120
2012 2013 2014 2015 2016 2017 2018 2019 2020
TWh
Month Quarter Week Year Total

THEMA-Report 2020-02 Analysis of Electricity Forward Market Hedging Opportunities in Finnish, Estonian, Latvian and Lithuanian Bidding Zones´ Borders
Page 13 THEMA Consulting Group
Øvre Vollgate 6, 0158 Oslo, Norway www.thema.no
Total open interest is however low for both the TAL and RIG EPADs suggesting that they are not extensively used for hedging. Both Helsinki (HEL) and Stockholm (STO) EPADs have had a stable level of open interest through the studied period at around 30-40 TWh. Relative to other EPADs, open interest in the HEL and STO EPADs is high. They appear to be used to hedge far larger volumes and this is likely to contribute to a more liquid market. Open interest in the Malmö (MAL) EPAD has increased from about 2017 and has seen a doubling of open interest from levels of around 4 TWh to around 8 TWh by 2020. The Lulea (LUL) EPAD, has had relatively stable open interest throughout the period at around 2-4 TWh. For the Tromsø (TRO) EPAD, a short spike of open interest around 2017 was followed by a rapid decline, reaching levels of around 1 TWh in 2020.
Figure 4: Total open interest (TWh) TAL and RIG EPADs
Data source: Nasdaq
Figure 5: Total open interest (TWh) HEL and STO EPADs
Data source: Nasdaq
0.0
0.1
0.2
0.3
0.4
0.5
2012 2013 2014 2015 2016 2017 2018 2019 2020
TWh
TAL RIG
0
10
20
30
40
50
2012 2013 2014 2015 2016 2017 2018 2019 2020
TWh
HEL STO

THEMA-Report 2020-02 Analysis of Electricity Forward Market Hedging Opportunities in Finnish, Estonian, Latvian and Lithuanian Bidding Zones´ Borders
Page 14 THEMA Consulting Group
Øvre Vollgate 6, 0158 Oslo, Norway www.thema.no
Figure 6: Total open interest (TWh) LUL, MAL and TRO EPADs
Data source: Nasdaq
4.1.3 Summing up open interest
Open interest in system price contracts was stable from around 2013 to 2018 but experienced a notable decline from the start of 2019. This implies a decline in the size of exposures being hedged using such contracts and may suggest declining liquidity. Total open interest in EPAD contracts has been stable throughout the studied period. There is even a slight increase in the use of EPADs in 2020. Looking at the relevant EPAD contracts, we see that for both TAL (Tallin) and RIG (Riga) EPADs open interest is low and liquidity is likely to be poor. The Helsinki (HEL) EPAD has had a stable and relatively high level of open interest through the studied period at around 30-40 TWh. This contract is therefore likely to be significantly more liquid.
4.2 Open interest in relation to physical consumption
By dividing open interest by physical consumption, we can get an indication of the share of physical consumption that is hedged in the futures market.
4.2.1 Open interest in relation to physical consumption in system price contracts
Figure 7 shows, for monthly, quarterly and yearly contracts, the open interest recorded for the contract shortly prior to delivery divided by total physical consumption in the relevant delivery period. The results show that this measure has remained stable throughout the studied period at around 0.2-0.4. Again, this suggests that Nordic system price futures hedge something like 20-40% of physical consumption in the Nordics.
0
2
4
6
8
10
2012 2013 2014 2015 2016 2017 2018 2019 2020
TWh
LUL MAL TRO

THEMA-Report 2020-02 Analysis of Electricity Forward Market Hedging Opportunities in Finnish, Estonian, Latvian and Lithuanian Bidding Zones´ Borders
Page 15 THEMA Consulting Group
Øvre Vollgate 6, 0158 Oslo, Norway www.thema.no
Figure 7: Open interest in relation to physical consumption, Nordic system contracts
Data source: Nasdaq (for open interest) and Nord Pool (for physical consumption)
4.2.2 Open interest in relation to physical consumption in EPAD contracts
In Figure 8, we replicate the approach used in Figure 7 to show open interest in relation to physical consumption but for the EPADs of the relevant bidding zones. For EPADs, this is done only for monthly contracts.
The results show that for the HEL and STO EPAD, this measure has remained stable throughout the studied time period at around 0.3. This would imply that EPADs in these bidding zones hedge around 30% of the physical consumption in their bidding zone. However, it is important to note that some contracts, like the HEL contract for example, may be used to hedge exposure in other correlated bidding zones such that not all of the open interest in the contract is directly related to consumption in the associated zone. For the MAL and LUL EPAD, there has been an increase in this measure for the last couple of years, reaching levels of around 0.3 in 2020. The TRO EPAD had a sharp increase in this measure around 2017, before a similarly sharp decrease in early 2020. Levels for RIG and TAL EPADs have remained low throughout the studied time period, reflecting the low absolute levels of open interest in these contracts.
Figure 8: Open interest in relation to physical consumption, monthly EPADs
Data source: Nasdaq (for open interest) and Nord Pool (for physical consumption)
0.0
0.1
0.2
0.3
0.4
0.5
2013 2014 2015 2016 2017 2018 2019 2020
Year Quarter Month
0.00
0.05
0.10
0.15
0.20
0.25
0.30
0.35
0.40
0.45
0.50
2013 2014 2015 2016 2017 2018 2019 2020
HEL TAL RIG LUL STO MAL TRO
THEMA-Report 2020-02 Analysis of Electricity Forward Market Hedging Opportunities in Finnish, Estonian, Latvian and Lithuanian Bidding Zones´ Borders
Page 16 THEMA Consulting Group
Øvre Vollgate 6, 0158 Oslo, Norway www.thema.no
4.2.3 Summing up open interest in relation to physical consumption
The results show that open interest in relation to physical consumption for system price contracts has remained stable throughout the studied period at around 0.2-0.4. Similarly, for the HEL EPAD, this measure has remained stable throughout the studied period at around 0.3. Levels for RIG and TAL EPADs have remained low throughout the studied period, reflecting the low absolute levels of open interest in these contracts. There is no clear cut-off point for determining a sufficient level for these metrics and attention needs to be paid to the presence of alternative opportunities to hedge. The values in the TAL and RIG EPADs vary between 0 and 0.05 and indicate low liquidity for these specific products. The HEL EPAD appears to be considerably more liquid in comparison.
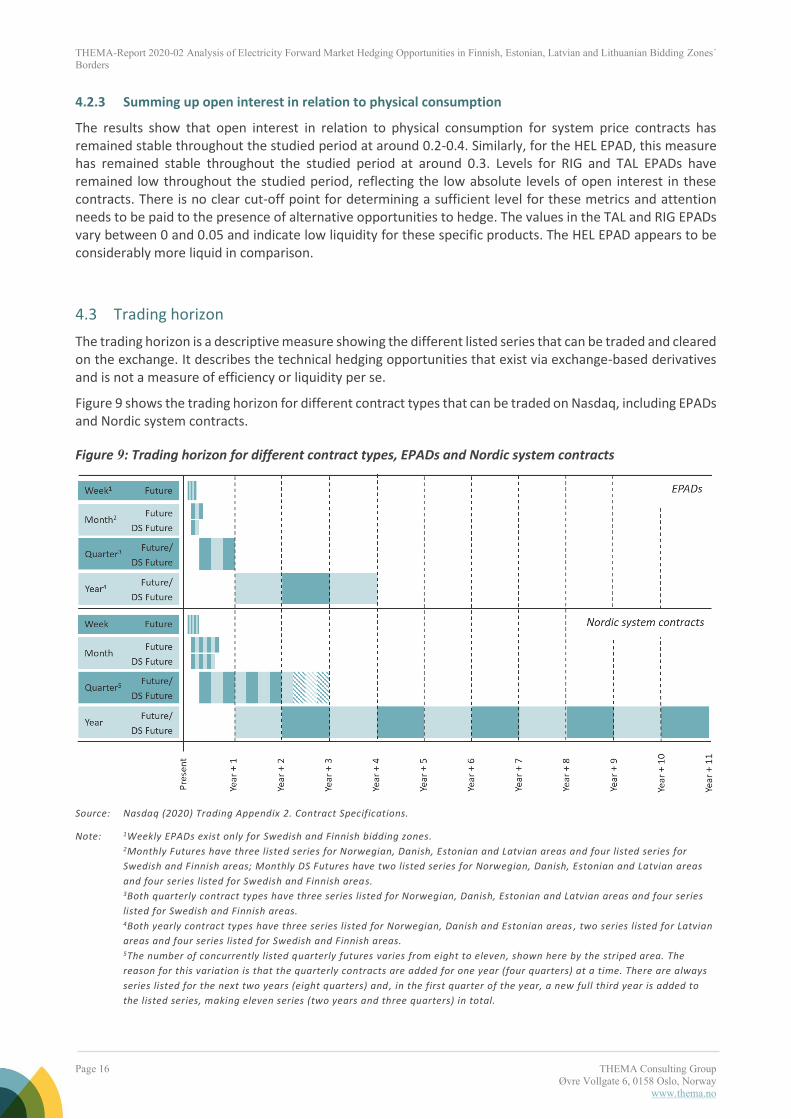
4.3 Trading horizon
The trading horizon is a descriptive measure showing the different listed series that can be traded and cleared on the exchange. It describes the technical hedging opportunities that exist via exchange-based derivatives and is not a measure of efficiency or liquidity per se.
Figure 9 shows the trading horizon for different contract types that can be traded on Nasdaq, including EPADs and Nordic system contracts.
Figure 9: Trading horizon for different contract types, EPADs and Nordic system contracts
Source: Nasdaq (2020) Trading Appendix 2. Contract Specifications.
Note: 1Weekly EPADs exist only for Swedish and Finnish bidding zones. 2Monthly Futures have three listed series for Norwegian, Danish, Estonian and Latvian areas and four listed series for
Swedish and Finnish areas; Monthly DS Futures have two listed series for Norwegian, Danish, Estonian and Latvian areas
and four series listed for Swedish and Finnish areas. 3Both quarterly contract types have three series listed for Norwegian, Danish, Estonian and Latvian areas and four series
listed for Swedish and Finnish areas. 4Both yearly contract types have three series listed for Norwegian, Danish and Estonian areas , two series listed for Latvian
areas and four series listed for Swedish and Finnish areas. 5The number of concurrently listed quarterly futures varies from eight to eleven, shown here by the striped area. The
reason for this variation is that the quarterly contracts are added for one year (four quarters) at a time. There are always
series listed for the next two years (eight quarters) and, in the first quarter of the year, a new full third year is added to
the listed series, making eleven series (two years and three quarters) in total.

THEMA-Report 2020-02 Analysis of Electricity Forward Market Hedging Opportunities in Finnish, Estonian, Latvian and Lithuanian Bidding Zones´ Borders
Page 17 THEMA Consulting Group
Øvre Vollgate 6, 0158 Oslo, Norway www.thema.no
We see that EPAD contracts have a significantly shorter time horizon than system price contracts. This might create challenges for players wanting to hedge long term area price exposure.
4.4 Traded volumes
Traded volumes are a descriptive measure used to indicate the liquidity of the market. Traded volumes show the number of MWh bought and sold during a specific period. Larger volumes will tend to indicate more active trade and suggest a larger number of transactions and a larger number of active market participants.
The analysis of traded volumes in the following section is done using end-of-day data covering the period 02.01.2012-30.06.2020. The traded volumes provided in the end-of-day data include exchange-traded volumes only and will therefore not include volumes traded Over the Counter, even if these volumes are cleared.
4.4.1 Traded volumes system price contracts
Figure 10 shows daily traded volumes (TWh) for monthly, quarterly and yearly Nordic system price contracts. Note that the traded volumes are averaged over a rolling time window of 30 days, backward from the date shown, so as to make trends easier to see.
The results show total daily traded volumes in Nordic system price contracts to be in the range of 2-6 TWh. Total volumes appeared to increase between 2014 to 2017 and to have fallen back in recent years, indicating falling liquidity.
Figure 10: Daily traded volumes (TWh) Nordic system price contracts
Data source: Nasdaq.
Note: The traded volumes are average over a rolling time window of 30 days, backward.
4.4.2 Traded volumes EPAD contracts
Figure 11 shows daily traded volumes (TWh) of EPADs for all bidding zones for weekly, monthly, quarterly and yearly contracts. The traded volumes are averaged over a rolling time window of 30 days, backward. Daily traded EPAD volumes have varied around 0.5 TWh in recent years.
0.0
1.0
2.0
3.0
4.0
5.0
6.0
7.0
2012 2013 2014 2015 2016 2017 2018 2019 2020
TWh
Month Quarter Week Year Total

THEMA-Report 2020-02 Analysis of Electricity Forward Market Hedging Opportunities in Finnish, Estonian, Latvian and Lithuanian Bidding Zones´ Borders
Page 18 THEMA Consulting Group
Øvre Vollgate 6, 0158 Oslo, Norway www.thema.no
Figure 11: Daily traded volumes (TWh) of EPADs (all bidding zones)
Data source: Nasdaq.
Note: Traded volumes are averaged over a rolling time window of 30 days, backward. There was a re-organization of the markets in
2013, in which EPADs were renamed; previously these contracts were named Contracts for Differences.
Figure 12, Figure 13 and Figure 14 show total daily traded volumes (TWh) for the relevant bidding zones. The traded volumes are averaged over a rolling time window of 30 days, backward. The results show that for the TAL and RIG EPADs, daily traded volumes have been stable at very low levels throughout the studied period. We see that there are no trade volumes for these EPADs for extended periods. This suggests that it may be difficult for market participants to get in and out of positions with these products using exchange trade. Unless these products are more actively traded Over the Counter, these products appear to be illiquid. HEL and STO EPADs have the highest traded volumes of the relevant bidding zones, with around 0.1-0.3 TWh. As such, liquidity in these products seems to be less of an issue. For LUL, MAL and TRO EPADs, traded volumes have also been stable, albeit at low levels, throughout the studied period.
Figure 12: Total daily traded volumes (TWh) TAL and RIG EPADs
Data source: Nasdaq.
Note: The traded volumes are average over a rolling time window of 30 days, backward.
0.0
0.2
0.4
0.6
0.8
1.0
1.2
2012 2013 2014 2015 2016 2017 2018 2019 2020
TWh
Month Quarter Week Year Total
0
0.005
0.01
0.015
2012 2013 2014 2015 2016 2017 2018 2019 2020
TWh
TAL RIG

THEMA-Report 2020-02 Analysis of Electricity Forward Market Hedging Opportunities in Finnish, Estonian, Latvian and Lithuanian Bidding Zones´ Borders
Page 19 THEMA Consulting Group
Øvre Vollgate 6, 0158 Oslo, Norway www.thema.no
Figure 13: Total daily traded volumes (TWh) HEL and STO EPADs
Data source: Nasdaq.
Note: The traded volumes are average over a rolling time window of 30 days, backward.
Figure 14: Total daily traded volumes (TWh) LUL, MAL and TRO EPADs
Data source: Nasdaq.
Note: The traded volumes are average over a rolling time window of 30 days, backward.
4.4.3 Summing up daily traded volumes
Total traded volumes in system price contracts increased between 2014 and 2017 but have fallen back in recent years, indicating worsening liquidity. Daily traded volumes in EPADs have been varied around 0.5 TWh. For the specific EPADs, daily traded volumes have been stable throughout the period, albeit at very low levels in some areas, notably TAL and RIG. For these EPADs, we see extended periods without any trading activity, which almost certainly reflects low liquidity on the exchange. Daily traded volumes for the HEL EPAD are higher, at around 0.1-0.3 TWh.
4.5 Traded volumes in relation to physical consumption/Churn rate
The ratio between total traded volumes of a power derivative and total electricity consumption in a given period gives the so-called ‘churn rate’. This ratio provides an indication of how many times a MWh of power is traded before it is delivered to the final consumer. Again, a higher number suggests more liquid trading.
0
0.1
0.2
0.3
0.4
0.5
0.6
2012 2013 2014 2015 2016 2017 2018 2019 2020
TWh
HEL STO
0
0.02
0.04
0.06
0.08
0.1
0.12
2012 2013 2014 2015 2016 2017 2018 2019 2020
TWh
LUL MAL TRO

THEMA-Report 2020-02 Analysis of Electricity Forward Market Hedging Opportunities in Finnish, Estonian, Latvian and Lithuanian Bidding Zones´ Borders
Page 20 THEMA Consulting Group
Øvre Vollgate 6, 0158 Oslo, Norway www.thema.no
4.5.1 Traded volumes for system price contracts in relation to physical consumption/Churn rate
Figure 15 shows daily traded volumes in Nordic system contracts in relation to daily physical consumption in the Nordic price areas. This ratio is averaged over a rolling time window of 30 days, backward. The figure shows a decline in the churn rate over the last six years, reaching a level of around 2 in 2019. This reflects the decline in traded volumes noted above.
Figure 15: Traded volumes in relation to physical consumption (Churn rate), Nordic system
Data source: Nasdaq (for traded volumes) and Nord Pool (for physical consumption).
Note: The churn rate is averaged over a rolling time window of 30 days, backward.
4.5.2 Traded volumes for EPAD contracts in relation to physical consumption/Churn rate
Figure 16, Figure 17 and Figure 18 show total daily traded volumes in relation to daily physical consumption, the churn rate, for the relevant bidding zones. The churn rate is averaged over a rolling time window of 30 days, backward.
For both the TAL and RIG EPAD, the churn rate has been below 0.2 for the last five years. For HEL and STO EPADs, the churn rate has been varying around 0.5 to 1.5 throughout most of the studied period. For the LUL, MAL and TRO EPADs, the churn rate has been stable and below 1 in recent years, with the exception of a spike for the TRO EPAD in mid-2016. These levels reflect the underlying volumes of trade in the associated derivatives as discussed in section 4.4.
Figure 16: Total traded volumes in relation to physical consumption (Churn rate) TAL and RIG EPADs
Data source: Nasdaq (for traded volumes) and Nord Pool (for physical consumption).
Note: The churn rate is averaged over a rolling time window of 30 days, backward.
0
1
2
3
4
5
6
7
8
2013 2014 2015 2016 2017 2018 2019 2020
Ch
run
rat
e
0
0.2
0.4
0.6
0.8
1
2013 2014 2015 2016 2017 2018 2019 2020
Ch
urn
rat
e
TAL RIG

THEMA-Report 2020-02 Analysis of Electricity Forward Market Hedging Opportunities in Finnish, Estonian, Latvian and Lithuanian Bidding Zones´ Borders
Page 21 THEMA Consulting Group
Øvre Vollgate 6, 0158 Oslo, Norway www.thema.no
Figure 17: Total traded volumes in relation to physical consumption (Churn rate) HEL and STO EPADs
Data source: Nasdaq (for traded volumes) and Nord Pool (for physical consumption).
Note: The churn rate is averaged over a rolling time window of 30 days, backward.
Figure 18: Total traded volumes in relation to physical consumption (Churn rate) LUL, MAL and TRO EPADs
Data source: Nasdaq (for traded volumes) and Nord Pool (for physical consumption).
Note: The churn rate is averaged over a rolling time window of 30 days, backward.
4.5.3 Summing up churn rate
The churn rate for system price contracts has declined in the last six years, reaching a level of around 2 in 2019. This reflects declining volumes of trade. For both the TAL and RIG EPAD, the churn rate has been below 0.2 for the last five years. For HEL, the churn rate has varied around 0.5 to 1.5 throughout most of the studied period. These figures highlight that traded volumes for the TAL and RIG EPAD are comparatively low even when accounting for variations in the level of consumption between different bidding zones.
0
0.5
1
1.5
2
2.5
2013 2014 2015 2016 2017 2018 2019 2020
Ch
run
rat
e
HEL STO
0
0.5
1
1.5
2
2.5
2013 2014 2015 2016 2017 2018 2019 2020
Ch
run
rat
e
LUL MAL TRO

THEMA-Report 2020-02 Analysis of Electricity Forward Market Hedging Opportunities in Finnish, Estonian, Latvian and Lithuanian Bidding Zones´ Borders
Page 22 THEMA Consulting Group
Øvre Vollgate 6, 0158 Oslo, Norway www.thema.no
5 PRICE MEASURES
5.1 Ex-post risk premiums
One way of investigating any systematic biases in the pricing of power derivatives contracts is to calculate ex-post risk premiums. The ex-post risk premium for any contract is simply the difference between the contract’s price and the spot price during its delivery period. By looking at these premia over time, we can see if there is a systematic difference between these two prices. The ex-post risk premium can be interpreted as a mark-up or reduction on the price of power that must be borne by traders, suppliers or consumers, in order to hold the price risk. Any such mark-up or discount may denote a natural behaviour of risk-averse market participants willing to pay (accept) a risk premium (discount) for transferring the risk of unfavourable spot price movements. However, it could also denote inefficiency in the market. From the available data and empirical analysis, we cannot distinguish the two directly, but we can study the magnitudes, persistency, direction, and significance of risk premiums, which then shed light on the accuracy of the market to price power derivatives.
It is important to note that there will typically be a difference between the value of a futures contract and resultant spot prices that is due purely to forecasting error. This error is captured in the calculated ex-post risk premia. As such, we can only infer the size of any ex-ante risk premium by looking at the ex-post premia over time and assuming that forecasting errors are not systematically different from zero.
To test whether the ex-post risk premia are different from zero, i.e. whether there is a systematic mark-up or reduction in prices, we use a t-test. Statistically significant results suggest that futures prices appear to be systematically different from the underlying spot prices during the delivery period.
The results from these t-tests are shown below. The ex-post risk premia for system price futures are calculated as the difference between the contract price on the last trading day before the delivery period and the average spot price over the delivery period. For the EPAD-contracts, we use the difference between the contract price on the last trading day before the delivery period and the average spread between the system price and the area price over the delivery period. We have tested whether these premia are significantly different from zero in either direction. The most interesting results from this analysis are summarised in Table 3, Table 4 and Table 5.
We have done tests for autocorrelation with Durbin Watson statistics. Some of the contracts had significant autocorrelation at a five percent level of significance. We have therefor corrected for autocorrelation by using GLS estimates and robust standard deviations for both the quarterly and monthly contracts. Since we have so few observations on the yearly contracts, we have decided to use OLS estimates and done conventional t-test for these contracts.

THEMA-Report 2020-02 Analysis of Electricity Forward Market Hedging Opportunities in Finnish, Estonian, Latvian and Lithuanian Bidding Zones´ Borders
Page 23 THEMA Consulting Group
Øvre Vollgate 6, 0158 Oslo, Norway www.thema.no
Table 3: Ex-post risk premia monthly contracts, GLS estimates and robust standard errors
Area Type Obs. Df Mean GLS est.
Min Max Robust St.Dev
Robust st.
error
t stat
t crit
(5%)
p value
Sign. 5%
level
95% CI
lower
95% CI
upper
System DS 102 101 0.40 0.40 -7.80 10.67 3.37 0.33 1.19 1.98 0.24 No -0.27 1.06
System Not Ds 58 57 0.31 0.29 -7.80 10.67 4.44 0.58 0.50 2.00 0.62 No -0.87 1.46
Helsinki DS 86 85 0.94 0.92 -9.86 12.14 2.21 0.24 3.85 1.99 0.00 Yes 0.44 1.39
Helsinki Not Ds 58 57 1.13 1.07 -9.86 12.14 1.99 0.26 4.09 2.00 0.00 Yes 0.55 1.59
Riga DS 61 60 1.75 1.70 -11.59 8.12 5.52 0.71 2.41 2.00 0.02 Yes 0.29 3.11
Riga Not Ds 58 57 1.23 1.19 -14.22 7.34 5.42 0.71 1.67 2.00 0.10 No -0.24 2.61
Tallin DS 85 84 0.84 1.10 -16.61 21.61 9.13 0.99 1.12 1.99 0.27 No -0.86 3.07
Tallin Not Ds 58 57 0.35 0.29 -16.61 6.44 6.99 0.92 0.32 2.00 0.75 No -1.54 2.13
Luleå DS 90 89 0.19 0.18 -5.13 4.22 1.98 0.21 0.86 1.99 0.39 No -0.24 0.59
Luleå Not Ds 58 57 0.25 0.25 -5.13 4.22 1.78 0.23 1.07 2.00 0.29 No -0.22 0.72
Stockholm DS 98 97 0.52 0.51 -13.20 5.43 1.94 0.20 2.60 1.98 0.01 Yes 0.12 0.90
Stockholm Not Ds 58 57 0.34 0.33 -13.20 5.43 1.88 0.25 1.33 2.00 0.19 No -0.17 0.82
Malmø DS 96 95 0.55 0.55 -12.81 4.89 2.66 0.27 2.01 1.99 0.05 Yes 0.01 1.09
Malmø Not Ds 58 57 0.28 0.28 -12.81 4.66 2.69 0.35 0.79 2.00 0.43 No -0.43 0.98
Tromsø DS 85 84 -0.30 -0.30 -4.28 3.90 2.22 0.24 1.25 1.99 0.21 No -0.78 0.18
Tromsø Not Ds 58 57 -0.50 -0.49 -4.28 3.90 2.21 0.29 1.69 2.00 0.10 No -1.07 0.09
Data source: Nasdaq
Table 4: Ex-post risk premia quarterly contracts, GLS estimates and robust standard errors
Area Type Obs. Df Mean GLS est.
Min Max Robust St.Dev
Robust st.
error
t stat
t crit (5%)
p value
Sign. 5%
level
95% CI
lower
95% CI
upper
System DS 34 33 0.50 0.50 -6.67 19.71 5.82 1.00 0.50 2.03 0.62 No -1.53 2.53
System Not Ds 20 19 -0.41 -0.41 -6.67 19.71 7.12 1.59 0.26 2.09 0.80 No -3.74 2.93
Helsinki DS 30 29 1.02 1.01 -6.67 5.56 2.69 0.49 2.06 2.05 0.05 Yes 0.01 2.02
Helsinki Not Ds 20 19 1.30 1.30 -6.67 5.56 3.18 0.71 1.83 2.09 0.08 No -0.18 2.79
Riga DS 20 19 2.37 2.37 -6.65 7.18 3.43 0.77 3.09 2.09 0.01 Yes 0.76 3.97
Riga Not Ds 20 19 1.36 1.32 -6.65 7.18 4.41 0.99 1.34 2.09 0.20 No -0.75 3.38
Tallin DS 29 28 0.99 1.22 -7.44 13.64 7.61 1.41 0.86 2.05 0.40 No -1.68 4.11
Tallin Not Ds 20 19 0.64 0.22 -7.44 6.23 8.76 1.96 0.11 2.09 0.91 No -3.88 4.32
Luleå DS 29 28 0.05 -0.08 -4.81 2.53 2.74 0.51 0.15 2.05 0.88 No -1.12 0.97
Luleå Not Ds 20 19 0.05 -0.28 -4.70 2.53 4.95 1.11 0.25 2.09 0.81 No -2.60 2.04
Stockholm DS 33 32 0.39 0.36 -6.52 3.01 2.63 0.46 0.78 2.04 0.44 No -0.57 1.29
Stockholm Not Ds 20 19 0.19 0.09 -6.52 3.01 3.70 0.83 0.10 2.09 0.92 No -1.65 1.82
Malmø DS 33 32 0.42 0.12 -8.31 5.62 5.07 0.88 0.13 2.04 0.90 No -1.68 1.91
Malmø Not Ds 20 19 -0.05 -1.63 -8.31 3.50 16.42 3.67 0.44 2.09 0.66 No -9.31 6.06
Tromsø DS 29 28 -0.03 -0.03 -4.48 4.29 1.73 0.32 0.11 2.05 0.92 No -0.69 0.62
Tromsø Not Ds 20 19 0.01 0.00 -2.51 4.29 1.80 0.40 0.00 2.09 1.00 No -0.85 0.84
Data source: Nasdaq

THEMA-Report 2020-02 Analysis of Electricity Forward Market Hedging Opportunities in Finnish, Estonian, Latvian and Lithuanian Bidding Zones´ Borders
Page 24 THEMA Consulting Group
Øvre Vollgate 6, 0158 Oslo, Norway www.thema.no
Table 5: Ex-post risk premia yearly contracts, OLS estimates and standard errors
Area Type Obs. Df Mean Min Max Std. Dev
Std. Err
t stat
t crit (5%)
p value
Sign. 5% level
95% CI lower
95% CI upper
System DS 7 6 -0.88 -18.56 10.27 9.89 3.74 0.24 2.45 0.82 No -10.03 8.26
System Not Ds 4 3 -4.86 -18.56 8.29 11.35 5.67 0.86 3.18 0.45 No -22.92 13.20
Helsinki DS 6 5 2.09 -2.18 6.40 3.19 1.30 1.61 2.57 0.17 No -1.25 5.44
Helsinki Not Ds 4 3 3.56 0.00 6.40 2.68 1.34 2.66 3.18 0.08 No -0.70 7.81
Riga DS 5 4 2.87 -4.22 9.17 4.99 2.23 1.29 2.78 0.27 No -3.33 9.06
Riga Not Ds 4 3 4.64 0.00 9.17 3.50 1.75 2.65 3.18 0.08 No -0.93 10.21
Tallin DS 6 5 2.10 -2.03 7.42 3.85 1.57 1.34 2.57 0.24 No -1.94 6.15
Tallin Not Ds 4 3 3.83 -1.02 7.42 3.55 1.77 2.16 3.18 0.12 No -1.82 9.47
Luleå DS 6 5 0.27 -1.24 1.61 1.13 0.46 0.59 2.57 0.58 No -0.92 1.46
Luleå Not Ds 4 3 0.16 -1.24 1.50 1.12 0.56 0.28 3.18 0.80 No -1.63 1.95
Stockholm DS 6 5 1.25 0.00 2.78 0.96 0.39 3.20 2.57 0.02 Yes 0.25 2.26
Stockholm Not Ds 4 3 1.33 0.00 2.78 1.20 0.60 2.22 3.18 0.11 No -0.58 3.24
Malmø DS 7 6 1.56 -0.37 3.08 1.17 0.44 3.52 2.45 0.01 Yes 0.48 2.65
Malmø Not Ds 4 3 1.25 -0.37 2.69 1.36 0.68 1.84 3.18 0.16 No -0.91 3.41
Tromsø DS 6 5 0.18 -1.78 1.65 1.47 0.60 0.29 2.57 0.78 No -1.36 1.72
Tromsø Not Ds 4 3 0.30 -1.07 1.60 1.25 0.63 0.48 3.18 0.67 No -1.69 2.29
Data source: Nasdaq
As can be seen from the tables, none of the system price contracts show premia that are significantly different from zero at a five percent level of significance. Hence, there is no systematic bias in the derivative prices compared to the underlying spot prices. The same is true for the TAL EPAD.
Both the RIG and HEL EPADS show premia that are statistically greater than zero for the monthly contracts. The same is true of the quarterly RIG EPADs. This suggests that one needs to pay a premium to buy power forward in these areas. This premium reflects the relative risk aversion of consumers and generators, as well as the volumes that consumers and generators wish to hedge in the relevant zones. A positive premium suggests that consumers are generally more risk-averse or wish to hedge a larger volume relative to generators and are therefore willing to paying a premium on power to trade forward with generators.
We include histograms for the monthly DS contracts for the price areas where we get significant risk premiums. Figure 19 to Figure 22 shows how the calculated ex-post risk premia for these areas are distributed around zero.

THEMA-Report 2020-02 Analysis of Electricity Forward Market Hedging Opportunities in Finnish, Estonian, Latvian and Lithuanian Bidding Zones´ Borders
Page 25 THEMA Consulting Group
Øvre Vollgate 6, 0158 Oslo, Norway www.thema.no
Figure 19 Ex-post risk premia Monthly DS contracts
Data source: Nasdaq

THEMA-Report 2020-02 Analysis of Electricity Forward Market Hedging Opportunities in Finnish, Estonian, Latvian and Lithuanian Bidding Zones´ Borders
Page 26 THEMA Consulting Group
Øvre Vollgate 6, 0158 Oslo, Norway www.thema.no
Figure 20 Ex-post risk premia Monthly non-DS contracts
Data source: Nasdaq

THEMA-Report 2020-02 Analysis of Electricity Forward Market Hedging Opportunities in Finnish, Estonian, Latvian and Lithuanian Bidding Zones´ Borders
Page 27 THEMA Consulting Group
Øvre Vollgate 6, 0158 Oslo, Norway www.thema.no
Figure 21 Ex-post risk premia Quarterly DS contracts
Data source: Nasdaq

THEMA-Report 2020-02 Analysis of Electricity Forward Market Hedging Opportunities in Finnish, Estonian, Latvian and Lithuanian Bidding Zones´ Borders
Page 28 THEMA Consulting Group
Øvre Vollgate 6, 0158 Oslo, Norway www.thema.no
Figure 22 Ex-post risk premia Quarterly non-DS contracts
Data source: Nasdaq

THEMA-Report 2020-02 Analysis of Electricity Forward Market Hedging Opportunities in Finnish, Estonian, Latvian and Lithuanian Bidding Zones´ Borders
Page 29 THEMA Consulting Group
Øvre Vollgate 6, 0158 Oslo, Norway www.thema.no
5.1.1 Summing up Ex post risk premiums
None of the system price contracts have ex-post risk premia that are significantly different from zero at a five percent level of significance. We, therefore, conclude that there is no systematic difference in these derivatives’ prices compared to the underlying spot prices. The same is true for the TAL EPAD.
Both the RIG and HEL EPADS have premia that are statistically different from zero for the monthly contracts. The same is also true of the quarterly RIG EPAD contract. Consumers appear to pay a premium to buy forward in these areas.
5.2 Amihud Illiquidity ratio
The Amihud illiquidity ratio is intended to capture the sensitivity of prices to larger volumes of trade and therefore to provide an indication of market liquidity. This is one of the most widely used proxies in empirical asset pricing. If contract prices move a lot in response to a small traded volume, this will lead to a high Amihud illiquidity ratio, suggesting that the asset is illiquid, and vice versa.
The Amihud illiquidity ratio is calculated daily by taking the difference between the open and closing price, expressed as an absolute value, and dividing this by the monetised volume of trade that day. These daily Amihud illiquidity ratios are then averaged over time. Due to low trading activity in some contracts, especially some of the EPADs, the calculation of the Amihud illiquidity ratio has been done in a more general way, by looking at the overall trend in the ratio across all traded contracts, meaning calculating the daily average of Amihud illiquidity of all trades, including contracts of all durations (monthly, quarterly and yearly) and both types (DS Futures and Futures).
It is important to note that while the Amihud illiquidity ratio is based on the idea that large volumes of trade push greater price changes in illiquid markets, this assumed causal chain might not underpin the changes picked up in the data. For example, new fundamental information about the power system might lead to a price correction on a day with very little trade and give rise to large illiquidity ratio even in a liquid market.
The EC Group’s “Methods for evaluation of the Nordic forward market for electricity” prepared for NordREG concludes that the empirical and theoretical application of the Amihud measure for electricity derivatives markets is limited2 and the report recommends against using the measure assessing liquidity due to the lack of empirical evidence from commodity/electricity markets. We include the calculations here for reference only.
Figure 23 shows the Amihud illiquidity ratio for the Nordic system price contracts by contract duration. We see a marked increase (worsening) in the ratio for all durations from 2017, particularly among monthly and quarterly contracts. These contracts see the ratio decrease again (improving) from 2019.
2 http://www.nordicenergyregulators.org/wp-content/uploads/2016/10/161208-Methods-for-evaluation-of-the-Nordic-forward-market-forelectricity.

THEMA-Report 2020-02 Analysis of Electricity Forward Market Hedging Opportunities in Finnish, Estonian, Latvian and Lithuanian Bidding Zones´ Borders
Page 30 THEMA Consulting Group
Øvre Vollgate 6, 0158 Oslo, Norway www.thema.no
Figure 23: Amihud Illiquidity ratio, Nordic System price contracts
Data source: Nasdaq.
Note: The Amihud Illiquidity Ratio is multiplied by 1 000. Both Futures and DS Futures are included. The ratio is average d over a time
window of 120 days, backward.
Figure 24 shows the Amihud illiquidity ratio of the EPAD contracts for all bidding zones by contract duration. As for the system price contracts, we observe an uptick in the Amihud ratio for monthly and quarterly contracts from late 2016/early 2017. These ratios fall back again from around 2018.
Figure 24: Amihud Illiquidity ratio, EPADs, all bidding zones
Data source: Nasdaq.
Note: The Amihud Illiquidity Ratio is multiplied by 1 000. Both Futures and DS Futures are included. The ratio is average d over a time
window of 120 days, backward.
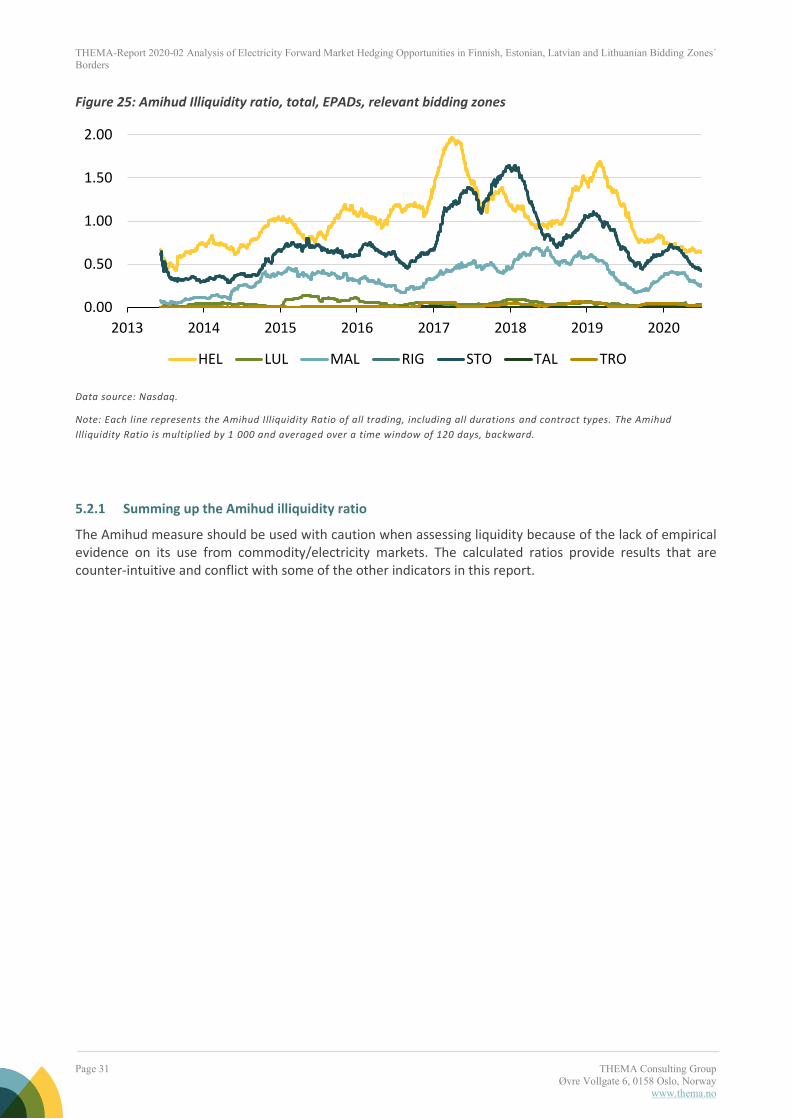
Figure 25 shows the Amihud illiquidity ratio of the EPAD contracts for the relevant bidding zones. The Amihud illiquidity ratio increases from 2013 to 2017 for the HEL EPAD, before it declines. The RIG and TAL EPADs are relatively stable at a very low level. Naively, these figures would seem to suggest that the RIG and TAL EPAD are much more liquid than the HEL EPAD, clearly in contradiction to the results of the other indicators in this report. This underlines the difficulty in meaningfully comparing this metric across areas.
0.00
0.20
0.40
0.60
0.80
2013 2014 2015 2016 2017 2018 2019 2020
Month Quarter Year
0.00
0.50
1.00
1.50
2.00
2.50
2013 2014 2015 2016 2017 2018 2019 2020
Month Quarter Year
THEMA-Report 2020-02 Analysis of Electricity Forward Market Hedging Opportunities in Finnish, Estonian, Latvian and Lithuanian Bidding Zones´ Borders
Page 31 THEMA Consulting Group
Øvre Vollgate 6, 0158 Oslo, Norway www.thema.no
Figure 25: Amihud Illiquidity ratio, total, EPADs, relevant bidding zones
Data source: Nasdaq.
Note: Each line represents the Amihud Illiquidity Ratio of all trading, including all durations and contract types. The Amihud
Illiquidity Ratio is multiplied by 1 000 and averaged over a time window of 120 days, backward.
5.2.1 Summing up the Amihud illiquidity ratio
The Amihud measure should be used with caution when assessing liquidity because of the lack of empirical evidence on its use from commodity/electricity markets. The calculated ratios provide results that are counter-intuitive and conflict with some of the other indicators in this report.
0.00
0.50
1.00
1.50
2.00
2013 2014 2015 2016 2017 2018 2019 2020
HEL LUL MAL RIG STO TAL TRO

THEMA-Report 2020-02 Analysis of Electricity Forward Market Hedging Opportunities in Finnish, Estonian, Latvian and Lithuanian Bidding Zones´ Borders
Page 32 THEMA Consulting Group
Øvre Vollgate 6, 0158 Oslo, Norway www.thema.no
6 TRANSACTION COST MEASURES
6.1 Bid-ask spreads
Bid-ask spreads are the difference between the highest bidding (buying) price and the lowest asking (selling) price. This spread represents a direct transaction costs for market participants. In markets with low bid-ask spreads, a contract can be bought and then sold at very little cost. Conversely, in markets with large bid-ask spreads, buying and then immediately selling a contract will result in a significant loss.
High bid-ask spreads may both cause and be due to low liquidity. In general, high transaction costs discourage active trading and therefore harm liquidity. Conversely, illiquidity increases the inventory management costs that traders must bear and results in them requiring a larger bid-ask spread to be encouraged to trade.
In general, lower bid-ask spreads are therefore indicative of more liquid markets.
6.1.1 Bid-ask spreads system price contracts
The bid-ask spreads below are calculated using data on daily best bids and best asks for each traded contract. For each date within each contract category (daily, weekly, monthly, quarterly and yearly contracts), the data is averaged over all traded contracts (with varying time to delivery). Then, for the remaining dates with no trading, spreads are inferred by (linear) interpolation. Figure 27 to Figure 30 show the absolute bid-ask spread for yearly, quarterly, monthly, weekly and daily power base futures and DS futures. The figures also show 30-day (backward) rolling averages of the bid-ask spread (averaged over all contracts quoted on a particular day) and show the 30-day (backward) rolling average of the maximum bid-ask spreads (maximum over all contracts quoted on a particular day).
Figure 26: Absolute bid-ask spread, Nordic yearly power futures (EUR/MWh)
Data source: Nasdaq.
0
1
2
3
4
5
Jun-13 Jun-14 Jun-15 Jun-16 May-17 May-18 May-19 May-20
Average bid-ask spread Average bid-ask spread (MA) Max bid-ask spread (MA)

THEMA-Report 2020-02 Analysis of Electricity Forward Market Hedging Opportunities in Finnish, Estonian, Latvian and Lithuanian Bidding Zones´ Borders
Page 33 THEMA Consulting Group
Øvre Vollgate 6, 0158 Oslo, Norway www.thema.no
Figure 27: Absolute bid-ask spread, Nordic quarterly power futures (EUR/MWh)
Data source: Nasdaq
Figure 28: Absolute bid-ask spread, Nordic monthly power futures (EUR/MWh)
Data source: Nasdaq
Figure 29: Absolute bid-ask spread, Nordic weekly power futures (EUR/MWh)
Data source: Nasdaq
0
0.5
1
1.5
2
2.5
Jun-13 Jun-14 Jun-15 Jun-16 May-17 May-18 May-19 May-20
Average bid-ask spread Average bid-ask spread (MA) Max bid-ask spread (MA)
0
2
4
6
Jun-13 Jun-14 Jun-15 Jun-16 May-17 May-18 May-19 May-20
Average bid-ask spread Average bid-ask spread (MA) Max bid-ask spread (MA)
0
1
2
3
4
5
Jun-13 Jun-14 Jun-15 Jun-16 May-17 May-18 May-19 May-20
Average bid-ask spread Average bid-ask spread (MA) Max bid-ask spread (MA)

THEMA-Report 2020-02 Analysis of Electricity Forward Market Hedging Opportunities in Finnish, Estonian, Latvian and Lithuanian Bidding Zones´ Borders
Page 34 THEMA Consulting Group
Øvre Vollgate 6, 0158 Oslo, Norway www.thema.no
Figure 30: Absolute bid-ask spread, Nordic daily power futures (EUR/MWh)
Data source: Nasdaq
Bid-ask spreads clearly experienced a shock around November 2016. The spreads on yearly contracts appear to have declined since 2018, suggesting the transaction costs for such contracts are lower.
Figure 31 shows bid-ask spreads vs. time to delivery for each type of system price contract. In each figure the colour hue indicates different contract durations. The solid dark lines indicate the median value, whilst the lighter shaded region indicates an estimated 95% confidence interval.
In general, we would expect the spread to decline as we approach delivery as the predictability of prices during the delivery window improves. While this effect is visible for weekly contracts, it is not obvious for other durations.
0
2
4
6
Jun-13 Jun-14 Jun-15 Jun-16 May-17 May-18 May-19 May-20
Average bid-ask spread Average bid-ask spread (MA) Max bid-ask spread (MA)

THEMA-Report 2020-02 Analysis of Electricity Forward Market Hedging Opportunities in Finnish, Estonian, Latvian and Lithuanian Bidding Zones´ Borders
Page 35 THEMA Consulting Group
Øvre Vollgate 6, 0158 Oslo, Norway www.thema.no
Figure 31 Bid-ask spread vs. time to delivery for Nordic power futures (EUR/MWh)
Data source: Nasdaq
6.1.2 Bid-ask spreads EPAD contracts
Figure 32, Figure 33 and Figure 34 show the average bid-ask spreads for yearly, quarterly and weekly Finnish and Baltic EPAD contracts. Figure 35, Figure 36 and
Figure 37 show the maximum bid-ask spreads for the same contracts. Similar to the power base futures, the bid-ask spreads are averages over all contract types and linearly interpolated for days without trading. The results shown in Figure 32 to
Figure 37 are averaged over a (backward) rolling time window of 30 days.

THEMA-Report 2020-02 Analysis of Electricity Forward Market Hedging Opportunities in Finnish, Estonian, Latvian and Lithuanian Bidding Zones´ Borders
Page 36 THEMA Consulting Group
Øvre Vollgate 6, 0158 Oslo, Norway www.thema.no
We see that for all durations the RIG and TAL EPADs have relatively high, but variable, bid-ask spreads. The HEL EPAD has a significantly lower spread that is comparable with that for some of the other areas analysed. The bid-ask spread of monthly HEL EPAD increases markedly in the first half of 2020, along with spreads for several other EPAD contracts. This could potentially reflect a loosening of market making obligations for these contracts.
Figure 32 Average best bid-ask spread for yearly EPAD contracts (EUR/MWh)
Data source: Nasdaq
Figure 33 Average best bid-ask spread for quarterly EPAD contracts (EUR/MWh).
Data source: Nasdaq
0
5
10
15
Jun-13 Jun-14 Jun-15 Jun-16 May-17 May-18 May-19 May-20
HEL LUL MAL RIG SUN TAL TRO
0
5
10
15
20
Jun-13 Jun-14 Jun-15 Jun-16 May-17 May-18 May-19 May-20
HEL LUL MAL RIG SUN TAL TRO

THEMA-Report 2020-02 Analysis of Electricity Forward Market Hedging Opportunities in Finnish, Estonian, Latvian and Lithuanian Bidding Zones´ Borders
Page 37 THEMA Consulting Group
Øvre Vollgate 6, 0158 Oslo, Norway www.thema.no
Figure 34 Average best bid-ask spread for monthly EPAD contracts (EUR/MWh)
Data source: Nasdaq
Figure 35 Maximum best bid-ask spread for yearly EPAD contracts (EUR/MWh)
Data source: Nasdaq
0
5
10
15
20
Jun-13 Jun-14 Jun-15 Jun-16 May-17 May-18 May-19 May-20
HEL LUL MAL RIG SUN TAL TRO
0
5
10
15
20
Jun-13 Jun-14 Jun-15 Jun-16 May-17 May-18 May-19 May-20
HEL LUL MAL RIG SUN TAL TRO

THEMA-Report 2020-02 Analysis of Electricity Forward Market Hedging Opportunities in Finnish, Estonian, Latvian and Lithuanian Bidding Zones´ Borders
Page 38 THEMA Consulting Group
Øvre Vollgate 6, 0158 Oslo, Norway www.thema.no
Figure 36 Maximum best bid-ask spread for quarterly EPAD contracts (EUR/MWh).
Data source: Nasdaq
Figure 37 Maximum best bid-ask spread for monthly EPAD contracts (EUR/MWh)
Data source: Nasdaq
Figure 38 shows bid-ask spreads vs. time to delivery for each type of system price contract. In each figure, the colour hue indicates different contract durations. The solid dark lines indicate the median value, whilst the lighter shaded region indicates an estimated 95% confidence interval.
0
5
10
15
20
3-Jun 2-Jun 3-Jun 1-Jun 26-May 28-May 27-May 27-May
HEL LUL MAL RIG SUN TAL TRO
0
5
10
15
20
Jun-13 Jun-14 Jun-15 Jun-16 May-17 May-18 May-19 May-20
HEL LUL MAL RIG SUN TAL TRO

THEMA-Report 2020-02 Analysis of Electricity Forward Market Hedging Opportunities in Finnish, Estonian, Latvian and Lithuanian Bidding Zones´ Borders
Page 39 THEMA Consulting Group
Øvre Vollgate 6, 0158 Oslo, Norway www.thema.no
Figure 38 Bid-ask spread vs. time to delivery for EPAD contracts (EUR/MWh)
Data source: Nasdaq
6.1.3 Summing up Bid-ask spreads
There seems to be no clear trend in the development of bid-ask spreads for system price products, although yearly products do appear to have had lower average spreads after 2018. The system price contracts show tight bid/ask spreads for the longer contracts (year, month quarter), but higher spreads for the near-term contracts. This likely reflects the relative illiquidity near-term contracts.
We see that for all durations, the RIG and TAL EPADs have relatively high bid/ask spreads, indicating both poor liquidity and high transaction costs for market participants. The HEL EPAD has lower spreads comparable to some of the other EPADs studied. It should be noted that these spreads may be limited by the

THEMA-Report 2020-02 Analysis of Electricity Forward Market Hedging Opportunities in Finnish, Estonian, Latvian and Lithuanian Bidding Zones´ Borders
Page 40 THEMA Consulting Group
Øvre Vollgate 6, 0158 Oslo, Norway www.thema.no
presence of market making arrangements on the exchange, where used. A market maker for the HEL EPAD, for example, would be obliged to post bids and offers within a maximum bid-ask spread, thereby limiting the observed spread and contributing to liquidity.

THEMA-Report 2020-02 Analysis of Electricity Forward Market Hedging Opportunities in Finnish, Estonian, Latvian and Lithuanian Bidding Zones´ Borders
Page 41 THEMA Consulting Group
Øvre Vollgate 6, 0158 Oslo, Norway www.thema.no
7 CORRELATION
The correlation analysis below helps to show the extent to which different instruments represent reasonable proxies for hedging exposure to a specific power price. Thus, we can get a sense of to what extent one can hedge the price risk of a specific zone using the EPAD of another bidding zone by examining the correlation between power prices in both zones. Good proxy hedges provide market participants with additional opportunities to hedge power price risk.
There is no clear cut-off for how high the correlation needs to be to provide market actors with sufficient hedging opportunities. Hedging opportunities that are poorly correlated may nevertheless be attractive if they enable hedging at very low costs and, conversely, proxy hedges with high correlation may be of little benefit if they are only available at high cost. That said, proxy hedges must have a correlation coefficient of at least 0.8 to qualify for hedge accounting3 and so hedging instruments with lower correlations are unlikely to be particularly good proxies.
Table 6 shows the correlation of calendar-month-average spot prices. It covers the Norwegian, Swedish, Finish, Estonian, Latvian and Lithuanian bidding zones and the Nordic System price for the period 01.01.2015 to 31.12.2020. The use of monthly average prices reflects an assumption that market participants are not concerned about deviations in prices over shorter periods and will therefore be satisfied if prices are well correlated from month to month.4
It is critical to note that this analysis is exclusively backward-looking and limited to the stated period between 2015 and 2020. It is entirely possible that changes in pricing dynamics brought about by the commissioning of new interconnectors and the development of new generation capacity will alter the extent of price correlation between zones in the future.
The results show a high degree of correlation between Finland and the Baltic states, with a correlation of 0.81 for Latvia and Lithuania, and even 0.94 for Estonia. There is also a high degree of correlation between the Baltic states, with a correlation coefficient of 0.83 between Estonia and each of the other two states and what appears to be a perfect correlation between Latvian and Lithuanian monthly average prices. The correlation between the Nordic system price and that in Finland is relatively high, whereas the zonal prices in the Baltic states are less correlated with the system price.
Table 6: Correlation, monthly average spot prices, last five years
FI EE LV LT SE1 SE3 SE4 NO4 SYS
FI 1.00
EE 0.94 1.00
LV 0.81 0.83 1.00
LT 0.81 0.83 1.00 1.00
SE1 0.89 0.77 0.62 0.62 1.00
SE3 0.94 0.86 0.68 0.68 0.96 1.00
SE4 0.93 0.90 0.79 0.70 0.90 0.97 1.00
NO4 0.83 0.73 0.61 0.61 0.94 0.88 0.82 1.00
SYS 0.86 0.75 0.61 0.61 0.97 0.92 0.86 0.98 1.00
Data source: Montel
3 Hedge accounting allows accounting entries and their offsetting hedge to be treated as one as part of an organisation’s financial
accounts and thereby helps to reduce overall volatility in accounting profits and losses. In contrast, not practicing hedge accounting or
relying on illegible proxies will result in swings in the value of these hedges in the accounts that impact accounting profit and losses,
potentially increasing their volatility. 4 See section 3.2.4 of Bjørndalen et al., “Methods for Evaluation of the Nordic Forward Market for Electricity” for a discussion of the
appropriate time thresholds for the correlation analysis.
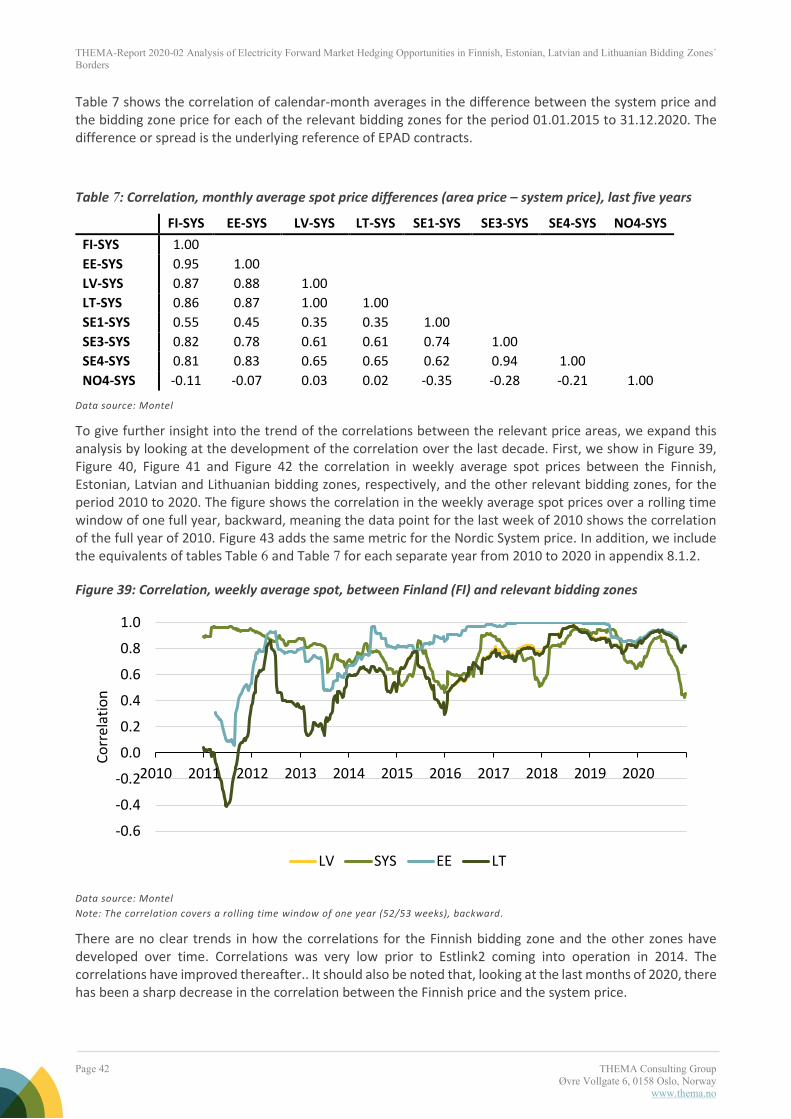
THEMA-Report 2020-02 Analysis of Electricity Forward Market Hedging Opportunities in Finnish, Estonian, Latvian and Lithuanian Bidding Zones´ Borders
Page 42 THEMA Consulting Group
Øvre Vollgate 6, 0158 Oslo, Norway www.thema.no
Table 7 shows the correlation of calendar-month averages in the difference between the system price and the bidding zone price for each of the relevant bidding zones for the period 01.01.2015 to 31.12.2020. The difference or spread is the underlying reference of EPAD contracts.
Table 7: Correlation, monthly average spot price differences (area price – system price), last five years
FI-SYS EE-SYS LV-SYS LT-SYS SE1-SYS SE3-SYS SE4-SYS NO4-SYS
FI-SYS 1.00
EE-SYS 0.95 1.00
LV-SYS 0.87 0.88 1.00
LT-SYS 0.86 0.87 1.00 1.00
SE1-SYS 0.55 0.45 0.35 0.35 1.00
SE3-SYS 0.82 0.78 0.61 0.61 0.74 1.00
SE4-SYS 0.81 0.83 0.65 0.65 0.62 0.94 1.00
NO4-SYS -0.11 -0.07 0.03 0.02 -0.35 -0.28 -0.21 1.00
Data source: Montel
To give further insight into the trend of the correlations between the relevant price areas, we expand this analysis by looking at the development of the correlation over the last decade. First, we show in Figure 39, Figure 40, Figure 41 and Figure 42 the correlation in weekly average spot prices between the Finnish, Estonian, Latvian and Lithuanian bidding zones, respectively, and the other relevant bidding zones, for the period 2010 to 2020. The figure shows the correlation in the weekly average spot prices over a rolling time window of one full year, backward, meaning the data point for the last week of 2010 shows the correlation of the full year of 2010. Figure 43 adds the same metric for the Nordic System price. In addition, we include the equivalents of tables Table 6 and Table 7 for each separate year from 2010 to 2020 in appendix 8.1.2.
Figure 39: Correlation, weekly average spot, between Finland (FI) and relevant bidding zones
Data source: Montel
Note: The correlation covers a rolling time window of one year (52/53 weeks), backward.
There are no clear trends in how the correlations for the Finnish bidding zone and the other zones have developed over time. Correlations was very low prior to Estlink2 coming into operation in 2014. The correlations have improved thereafter.. It should also be noted that, looking at the last months of 2020, there has been a sharp decrease in the correlation between the Finnish price and the system price.
-0.6
-0.4
-0.2
0.0
0.2
0.4
0.6
0.8
1.0
2010 2011 2012 2013 2014 2015 2016 2017 2018 2019 2020
Co
rrel
atio
n
LV SYS EE LT

THEMA-Report 2020-02 Analysis of Electricity Forward Market Hedging Opportunities in Finnish, Estonian, Latvian and Lithuanian Bidding Zones´ Borders
Page 43 THEMA Consulting Group
Øvre Vollgate 6, 0158 Oslo, Norway www.thema.no
Figure 40: Correlation, weekly average spot, quarterly, between Estonia (EE) and relevant bidding zones
Data source: Montel
Note: The correlation covers a rolling time window of one year (52/53 weeks), backward.
There are large variations in the correlations between the Estonian bidding zone and the surrounding bidding zones as well as the system price. It seems like the price the correlation between the price in Estonia and the system price has increased over time, indicating that the system price products are becoming more relevant for proxy hedging. The same is also true for the correlations with Finland, Latvia and Lithuania. Looking at the most recent development, the correlation between the Estonian bidding zone and the system price has fallen dramatically the last few month of 2020.
Figure 41: Correlation, weekly average spot, quarterly, between Latvia (LV) and relevant bidding zones
Data source: Montel
Note: The correlation covers a rolling time window of one year (52/53 weeks), backward.
As can be seen in Figure 41 Latvia is extremely well correlated with Lithuania during the whole period. Correlations with Estonia, the system price and to some degree the Finnish price also seems to have been increasing over time. The recent trend of decreasing correlation to the system price is also present for the Latvian bidding zone, as seen in the figures above.
-0.2
0.0
0.2
0.4
0.6
0.8
1.0
2010 2011 2012 2013 2014 2015 2016 2017 2018 2019 2020
Co
rrel
atio
n
LV SYS FI LT
-0.4
-0.2
0.0
0.2
0.4
0.6
0.8
1.0
2010 2011 2012 2013 2014 2015 2016 2017 2018 2019 2020
Co
rrel
atio
n
EE SYS FI LT

THEMA-Report 2020-02 Analysis of Electricity Forward Market Hedging Opportunities in Finnish, Estonian, Latvian and Lithuanian Bidding Zones´ Borders
Page 44 THEMA Consulting Group
Øvre Vollgate 6, 0158 Oslo, Norway www.thema.no
Figure 42: Correlation, weekly average spot, quarterly, between Lithuania (LT) and relevant bidding zones
Data source: Montel
Note: The correlation covers a rolling time window of one year (52/53 weeks), backward.
Lithuania is well correlated with Latvia. The correlations with Estonia have also increased over time as has the correlation with Finland and the system price. There is a sharp decrease in the correlation with the system price.
Figure 43: Correlation, weekly average spot, quarterly, between Nordic System price (SYS) and relevant bidding zones
Data source: Montel
Note: The correlation covers a rolling time window of one year (52/53 weeks), backward.
Figure 43 adds that the most recent development of a sharp decrease in correlation to the system price is common for the Finnish and the Baltic bidding zones.
7.1.1 Summing up the correlations
The results show that, looking at the trend over the last five years, there has been a high degree of correlation between Finland and the Baltic states. There is also a high degree of correlation among prices within the Baltic states. The correlation between the Nordic system price and that in Finland is relatively high, while zonal prices in the Baltic states are markedly less correlated with the system price. The correlation between
-0.6
-0.4
-0.2
0.0
0.2
0.4
0.6
0.8
1.0
2010 2011 2012 2013 2014 2015 2016 2017 2018 2019 2020
Co
rrel
atio
n
EE SYS FI LV
-0.6
-0.4
-0.2
0.0
0.2
0.4
0.6
0.8
1.0
2010 2011 2012 2013 2014 2015 2016 2017 2018 2019 2020
Co
rrel
atio
n
EE LT FI LV

THEMA-Report 2020-02 Analysis of Electricity Forward Market Hedging Opportunities in Finnish, Estonian, Latvian and Lithuanian Bidding Zones´ Borders
Page 45 THEMA Consulting Group
Øvre Vollgate 6, 0158 Oslo, Norway www.thema.no
prices in the Baltic states, Finland and the system price seems to have been increasing over time. It should be noted that if we focus on the last few months of 2020, there was a dramatic decrease on correlation between the system price and the Finnish and Baltic bidding zones most likely as a result of the very high precipitation pushing the Norwegian as well as the system price down.

THEMA-Report 2020-02 Analysis of Electricity Forward Market Hedging Opportunities in Finnish, Estonian, Latvian and Lithuanian Bidding Zones´ Borders
Page 46 THEMA Consulting Group
Øvre Vollgate 6, 0158 Oslo, Norway www.thema.no
8 APPENDIX
8.1 Additional metric calculations
8.1.1 Amihud Illiquidity Ratio – EPADs
Figure 44: Amihud Illiquidity ratio, HEL EPAD, individual contracts
Data source: Nasdaq.
Note: Each line represents the Amihud Illiquidity Ratio of trading in individual contracts. The Amihud Illiquidity Ratio is multiplied by
1 000.
Figure 45: Amihud Illiquidity ratio, TAL EPAD, individual contracts
Data source: Nasdaq.
Note: Each line represents the Amihud Illiquidity Ratio of trading in individual contracts. The Amihud Illiquidity Ratio is multipl ied by
1 000.
0.00
0.50
1.00
1.50
2.00
2.50
2013 2014 2015 2016 2017 2018 2019 2020
DS Future Month Future Month DS Future Quarter
Future Quarter DS Future Year Future Year
0.00
0.10
0.20
0.30
2013 2014 2015 2016 2017 2018 2019 2020
DS Future Month Future Month DS Future Quarter
Future Quarter DS Future Year Future Year

THEMA-Report 2020-02 Analysis of Electricity Forward Market Hedging Opportunities in Finnish, Estonian, Latvian and Lithuanian Bidding Zones´ Borders
Page 47 THEMA Consulting Group
Øvre Vollgate 6, 0158 Oslo, Norway www.thema.no
Figure 46: Amihud Illiquidity ratio, RIG EPAD, individual contracts
Data source: Nasdaq.
Note: Each line represents the Amihud Illiquidity Ratio of trading in individual contracts. The Amihud Illiquidity Ratio is multipl ied by
1 000.
Figure 47: Amihud Illiquidity ratio, LUL EPAD, individual contracts
Source: Nasdaq. Each line represents the Amihud Illiquidity Ratio of trading in individual contracts. The Amihud Illiquidity Ratio is
multiplied by 1 000.
0.00
0.05
0.10
0.15
2013 2014 2015 2016 2017 2018 2019 2020
DS Future Month Future Month DS Future Quarter
Future Quarter DS Future Year Future Year
0.00
0.50
1.00
1.50
2.00
2013 2014 2015 2016 2017 2018 2019 2020
DS Future Month Future Month DS Future Quarter
Future Quarter DS Future Year Future Year

THEMA-Report 2020-02 Analysis of Electricity Forward Market Hedging Opportunities in Finnish, Estonian, Latvian and Lithuanian Bidding Zones´ Borders
Page 48 THEMA Consulting Group
Øvre Vollgate 6, 0158 Oslo, Norway www.thema.no
Figure 48: Amihud Illiquidity ratio, STO EPAD, individual contracts
Data source: Nasdaq.
Note: Each line represents the Amihud Illiquidity Ratio of trading in individual contracts. The Amihud Illiquidity Ratio is multipl ied by
1 000.
Source: Nasdaq
Figure 49: Amihud Illiquidity ratio, MAL EPAD, individual contracts
Data source: Nasdaq.
Note: Each line represents the Amihud Illiquidity Ratio of trading in individual contracts. The Amihud Illiquidity Ratio is multipl ied by
1 000.
0.00
0.50
1.00
1.50
2.00
2013 2014 2015 2016 2017 2018 2019 2020
DS Future Month Future Month DS Future Quarter
Future Quarter DS Future Year Future Year
0.00
0.50
1.00
1.50
2.00
2013 2014 2015 2016 2017 2018 2019 2020
DS Future Month Future Month DS Future Quarter
Future Quarter DS Future Year Future Year

THEMA-Report 2020-02 Analysis of Electricity Forward Market Hedging Opportunities in Finnish, Estonian, Latvian and Lithuanian Bidding Zones´ Borders
Page 49 THEMA Consulting Group
Øvre Vollgate 6, 0158 Oslo, Norway www.thema.no
Figure 50: Amihud Illiquidity ratio, TRO EPAD, individual contracts
Data source: Nasdaq.
Note: Each line represents the Amihud Illiquidity Ratio of trading in individual contracts. The Amihud Illiquidity Ratio is multipl ied by
1 000.
0.00
0.20
0.40
0.60
0.80
2013 2014 2015 2016 2017 2018 2019 2020
DS Future Month Future Month DS Future Quarter
Future Quarter DS Future Year Future Year

THEMA-Report 2020-02 Analysis of Electricity Forward Market Hedging Opportunities in Finnish, Estonian, Latvian and Lithuanian Bidding Zones´ Borders
Page 50 THEMA Consulting Group
Øvre Vollgate 6, 0158 Oslo, Norway www.thema.no
8.1.2 Correlation analysis
Correlation, monthly average spot prices, by year
2010 FI EE LV LT SE1 SE3 SE4 NO4 SYS
FI 1.00
EE #N/A #N/A
LV #N/A #N/A #N/A
LT -0.08 #N/A #N/A 1.00
SE1 1.00 #N/A #N/A -0.12 1.00
SE3 1.00 #N/A #N/A -0.12 1.00 1.00
SE4 1.00 #N/A #N/A -0.12 1.00 1.00 1.00
NO4 0.99 #N/A #N/A -0.16 1.00 1.00 1.00 1.00
SYS 0.94 #N/A #N/A -0.14 0.95 0.95 0.95 0.96 1.00
2011 FI EE LV LT SE1 SE3 SE4 NO4 SYS
FI 1.00
EE 0.63 1.00
LV #N/A #N/A #N/A
LT 0.36 0.90 #N/A 1.00
SE1 0.98 0.55 #N/A 0.26 1.00
SE3 0.98 0.55 #N/A 0.26 1.00 1.00
SE4 0.95 0.51 #N/A 0.24 0.98 0.99 1.00
NO4 0.98 0.53 #N/A 0.24 1.00 0.99 0.97 1.00
SYS 0.96 0.52 #N/A 0.23 1.00 1.00 0.99 1.00 1.00
2012 FI EE LV LT SE1 SE3 SE4 NO4 SYS
FI 1.00 EE 0.80 1.00 LV #N/A #N/A #N/A LT 0.30 0.57 #N/A 1.00 SE1 0.92 0.71 #N/A 0.15 1.00 SE3 0.92 0.72 #N/A 0.19 1.00 1.00 SE4 0.82 0.61 #N/A 0.19 0.95 0.96 1.00 NO4 0.89 0.70 #N/A 0.11 1.00 0.99 0.95 1.00 SYS 0.87 0.68 #N/A 0.11 0.99 0.99 0.95 0.99 1.00
2013 FI EE LV LT SE1 SE3 SE4 NO4 SYS
FI 1.00 EE 0.52 1.00 LV #N/A #N/A #N/A LT 0.65 0.74 #N/A 1.00 SE1 0.91 0.28 #N/A 0.34 1.00 SE3 0.93 0.29 #N/A 0.38 1.00 1.00 SE4 0.89 0.27 #N/A 0.36 0.98 0.98 1.00 NO4 0.79 0.23 #N/A 0.21 0.94 0.93 0.92 1.00 SYS 0.60 0.07 #N/A -0.08 0.84 0.81 0.80 0.95 1.00

THEMA-Report 2020-02 Analysis of Electricity Forward Market Hedging Opportunities in Finnish, Estonian, Latvian and Lithuanian Bidding Zones´ Borders
Page 51 THEMA Consulting Group
Øvre Vollgate 6, 0158 Oslo, Norway www.thema.no
2014 FI EE LV LT SE1 SE3 SE4 NO4 SYS
FI 1.00
EE 0.84 1.00
LV 0.49 0.67 1.00
LT 0.49 0.67 1.00 1.00
SE1 0.81 0.63 0.57 0.57 1.00
SE3 0.83 0.61 0.57 0.57 0.99 1.00
SE4 0.81 0.58 0.52 0.52 0.98 0.99 1.00
NO4 0.79 0.62 0.50 0.51 0.95 0.94 0.93 1.00
SYS 0.73 0.63 0.17 0.17 0.57 0.56 0.59 0.67 1.00
2015 FI EE LV LT SE1 SE3 SE4 NO4 SYS
FI 1.00 EE 0.80 1.00 LV 0.28 0.35 1.00 LT 0.29 0.35 1.00 1.00 SE1 0.57 0.67 -0.32 -0.31 1.00 SE3 0.61 0.68 -0.27 -0.27 0.99 1.00 SE4 0.50 0.64 -0.25 -0.25 0.97 0.98 1.00 NO4 0.53 0.62 -0.40 -0.40 0.99 0.97 0.95 1.00 SYS 0.53 0.62 -0.34 -0.34 0.99 0.98 0.96 0.98 1.00
2016 FI EE LV LT SE1 SE3 SE4 NO4 SYS
FI 1.00 EE 0.98 1.00 LV 0.80 0.78 1.00 LT 0.78 0.76 0.99 1.00 SE1 0.91 0.88 0.56 0.52 1.00 SE3 0.95 0.92 0.64 0.61 0.99 1.00 SE4 0.95 0.91 0.62 0.59 0.99 1.00 1.00 NO4 0.93 0.88 0.69 0.67 0.93 0.95 0.95 1.00 SYS 0.93 0.92 0.61 0.59 0.91 0.93 0.94 0.95 1.00
2017 FI EE LV LT SE1 SE3 SE4 NO4 SYS
FI 1.00 EE 1.00 1.00 LV 0.63 0.64 1.00 LT 0.63 0.64 0.97 1.00 SE1 0.86 0.86 0.38 0.41 1.00 SE3 0.90 0.90 0.38 0.41 0.97 1.00 SE4 0.85 0.85 0.37 0.46 0.91 0.95 1.00 NO4 0.02 0.02 -0.23 -0.10 0.15 0.22 0.44 1.00 SYS 0.30 0.29 -0.28 -0.17 0.59 0.58 0.69 0.75 1.00

THEMA-Report 2020-02 Analysis of Electricity Forward Market Hedging Opportunities in Finnish, Estonian, Latvian and Lithuanian Bidding Zones´ Borders
Page 52 THEMA Consulting Group
Øvre Vollgate 6, 0158 Oslo, Norway www.thema.no
2018 FI EE LV LT SE1 SE3 SE4 NO4 SYS
FI 1.00 EE 0.99 1.00 LV 0.91 0.91 1.00 LT 0.90 0.91 1.00 1.00 SE1 0.99 0.97 0.88 0.88 1.00 SE3 0.99 0.98 0.89 0.88 1.00 1.00 SE4 0.96 0.96 0.94 0.94 0.95 0.96 1.00 NO4 0.96 0.95 0.88 0.88 0.98 0.97 0.94 1.00 SYS 0.98 0.98 0.87 0.86 0.99 0.99 0.95 0.98 1.00
2019 FI EE LV LT SE1 SE3 SE4 NO4 SYS
FI 1.00 EE 0.84 1.00 LV 0.79 0.99 1.00 LT 0.78 0.98 1.00 1.00 SE1 0.76 0.51 0.49 0.48 1.00 SE3 0.77 0.52 0.50 0.49 1.00 1.00 SE4 0.81 0.61 0.58 0.57 0.98 0.99 1.00 NO4 0.64 0.36 0.36 0.35 0.98 0.97 0.93 1.00 SYS 0.64 0.42 0.41 0.40 0.98 0.98 0.95 0.99 1.00
2020 FI EE LV LT SE1 SE3 SE4 NO4 SYS
FI 1.00 EE 0.88 1.00 LV 0.88 0.99 1.00 LT 0.88 1.00 1.00 1.00 SE1 0.69 0.45 0.44 0.43 1.00 SE3 0.96 0.85 0.85 0.84 0.72 1.00 SE4 0.91 0.93 0.94 0.94 0.54 0.89 1.00 NO4 0.09 -0.08 -0.13 -0.11 0.49 0.19 0.00 1.00 SYS 0.46 0.26 0.21 0.22 0.77 0.51 0.33 0.88 1.00

THEMA-Report 2020-02 Analysis of Electricity Forward Market Hedging Opportunities in Finnish, Estonian, Latvian and Lithuanian Bidding Zones´ Borders
Page 53 THEMA Consulting Group
Øvre Vollgate 6, 0158 Oslo, Norway www.thema.no
Correlation, monthly average spot price differences (area price – system price), by year
2010 FI-SYS EE-SYS LV-SYS LT-SYS SE1-SYS SE3-SYS SE4-SYS NO4-SYS
FI-SYS 1.00 EE-SYS #N/A #N/A LV-SYS #N/A #N/A #N/A LT-SYS -0.53 #N/A #N/A 1.00 SE1-SYS 0.98 #N/A #N/A -0.61 1.00 SE3-SYS 0.98 #N/A #N/A -0.61 1.00 1.00 SE4-SYS 0.98 #N/A #N/A -0.61 1.00 1.00 1.00 NO4-SYS 0.95 #N/A #N/A -0.66 0.98 0.98 0.98 1.00
2011 FI-SYS EE-SYS LV-SYS LT-SYS SE1-SYS SE3-SYS SE4-SYS NO4-SYS
FI-SYS 1.00 EE-SYS 0.82 1.00
LV-SYS #N/A #N/A #N/A
LT-SYS 0.80 0.99 #N/A 1.00
SE1-SYS 0.98 0.77 #N/A 0.77 1.00 SE3-SYS 0.88 0.76 #N/A 0.77 0.91 1.00
SE4-SYS 0.37 0.48 #N/A 0.51 0.40 0.74 1.00
NO4-SYS 0.64 0.32 #N/A 0.31 0.69 0.41 -0.23 1.00
2012 FI-SYS EE-SYS LV-SYS LT-SYS SE1-SYS SE3-SYS SE4-SYS NO4-SYS
FI-SYS 1.00 EE-SYS 0.44 1.00 LV-SYS #N/A #N/A #N/A LT-SYS 0.36 0.94 #N/A 1.00 SE1-SYS 0.79 0.45 #N/A 0.42 1.00 SE3-SYS 0.75 0.27 #N/A 0.32 0.89 1.00 SE4-SYS 0.07 0.37 #N/A 0.54 0.43 0.52 1.00 NO4-SYS 0.56 0.31 #N/A 0.21 0.87 0.74 0.40 1.00
2013 FI-SYS EE-SYS LV-SYS LT-SYS SE1-SYS SE3-SYS SE4-SYS NO4-SYS
FI-SYS 1.00 EE-SYS 0.72 1.00 LV-SYS #N/A #N/A #N/A LT-SYS 0.91 0.83 #N/A 1.00 SE1-SYS 0.93 0.50 #N/A 0.77 1.00 SE3-SYS 0.92 0.48 #N/A 0.77 0.99 1.00 SE4-SYS 0.88 0.50 #N/A 0.76 0.94 0.96 1.00 NO4-SYS 0.85 0.53 #N/A 0.86 0.83 0.87 0.84 1.00

THEMA-Report 2020-02 Analysis of Electricity Forward Market Hedging Opportunities in Finnish, Estonian, Latvian and Lithuanian Bidding Zones´ Borders
Page 54 THEMA Consulting Group
Øvre Vollgate 6, 0158 Oslo, Norway www.thema.no
2014 FI-SYS EE-SYS LV-SYS LT-SYS SE1-SYS SE3-SYS SE4-SYS NO4-SYS
FI-SYS 1.00 EE-SYS 0.68 1.00 LV-SYS 0.62 0.75 1.00 LT-SYS 0.62 0.75 1.00 1.00 SE1-SYS 0.79 0.45 0.65 0.65 1.00 SE3-SYS 0.81 0.44 0.65 0.65 0.99 1.00 SE4-SYS 0.78 0.38 0.60 0.60 0.98 0.99 1.00 NO4-SYS 0.72 0.38 0.61 0.61 0.95 0.94 0.92 1.00
2015 FI-SYS EE-SYS LV-SYS LT-SYS SE1-SYS SE3-SYS SE4-SYS NO4-SYS
FI-SYS 1.00 EE-SYS 0.91 1.00 LV-SYS 0.87 0.93 1.00 LT-SYS 0.87 0.93 1.00 1.00 SE1-SYS 0.50 0.50 0.39 0.39 1.00 SE3-SYS 0.55 0.47 0.45 0.45 0.82 1.00 SE4-SYS 0.26 0.39 0.44 0.44 0.65 0.69 1.00 NO4-SYS -0.07 -0.09 -0.30 -0.30 0.61 0.17 0.08 1.00
2016 FI-SYS EE-SYS LV-SYS LT-SYS SE1-SYS SE3-SYS SE4-SYS NO4-SYS
FI-SYS 1.00 EE-SYS 0.89 1.00 LV-SYS 0.84 0.72 1.00 LT-SYS 0.81 0.73 0.99 1.00 SE1-SYS 0.27 0.05 -0.07 -0.12 1.00 SE3-SYS 0.43 0.14 0.15 0.09 0.96 1.00 SE4-SYS 0.37 0.09 0.07 0.01 0.96 0.99 1.00 NO4-SYS 0.60 0.62 0.54 0.56 0.09 0.10 0.07 1.00
2017 FI-SYS EE-SYS LV-SYS LT-SYS SE1-SYS SE3-SYS SE4-SYS NO4-SYS
FI-SYS 1.00 EE-SYS 1.00 1.00 LV-SYS 0.87 0.87 1.00 LT-SYS 0.84 0.84 0.99 1.00 SE1-SYS 0.92 0.92 0.78 0.75 1.00 SE3-SYS 0.94 0.94 0.74 0.71 0.96 1.00 SE4-SYS 0.89 0.89 0.72 0.74 0.86 0.92 1.00 NO4-SYS -0.32 -0.32 -0.11 -0.06 -0.54 -0.42 -0.19 1.00
2018 FI-SYS EE-SYS LV-SYS LT-SYS SE1-SYS SE3-SYS SE4-SYS NO4-SYS
FI-SYS 1.00 EE-SYS 0.81 1.00 LV-SYS 0.58 0.63 1.00 LT-SYS 0.56 0.62 1.00 1.00 SE1-SYS 0.13 -0.15 0.27 0.27 1.00 SE3-SYS 0.03 0.05 0.29 0.29 0.86 1.00 SE4-SYS 0.19 0.39 0.73 0.74 0.37 0.54 1.00 NO4-SYS 0.09 -0.11 0.32 0.33 0.08 -0.17 0.14 1.00
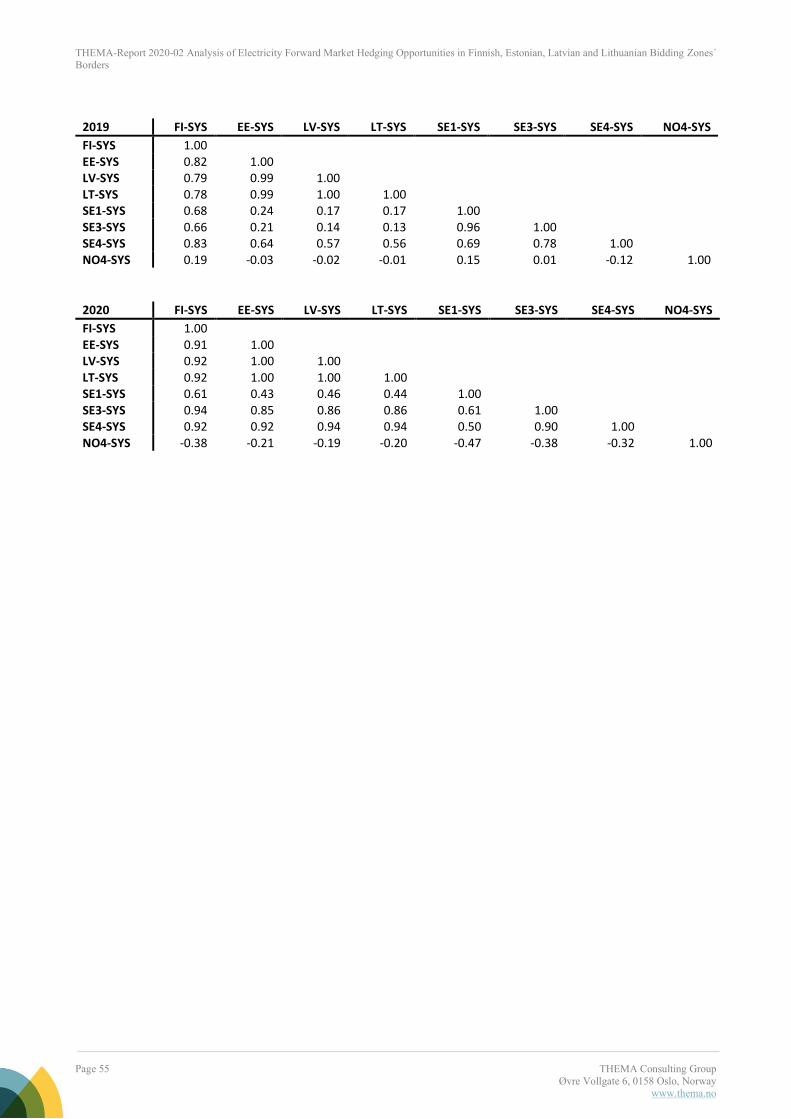
THEMA-Report 2020-02 Analysis of Electricity Forward Market Hedging Opportunities in Finnish, Estonian, Latvian and Lithuanian Bidding Zones´ Borders
Page 55 THEMA Consulting Group
Øvre Vollgate 6, 0158 Oslo, Norway www.thema.no
2019 FI-SYS EE-SYS LV-SYS LT-SYS SE1-SYS SE3-SYS SE4-SYS NO4-SYS
FI-SYS 1.00 EE-SYS 0.82 1.00 LV-SYS 0.79 0.99 1.00 LT-SYS 0.78 0.99 1.00 1.00 SE1-SYS 0.68 0.24 0.17 0.17 1.00 SE3-SYS 0.66 0.21 0.14 0.13 0.96 1.00 SE4-SYS 0.83 0.64 0.57 0.56 0.69 0.78 1.00 NO4-SYS 0.19 -0.03 -0.02 -0.01 0.15 0.01 -0.12 1.00
2020 FI-SYS EE-SYS LV-SYS LT-SYS SE1-SYS SE3-SYS SE4-SYS NO4-SYS
FI-SYS 1.00 EE-SYS 0.91 1.00 LV-SYS 0.92 1.00 1.00 LT-SYS 0.92 1.00 1.00 1.00 SE1-SYS 0.61 0.43 0.46 0.44 1.00 SE3-SYS 0.94 0.85 0.86 0.86 0.61 1.00 SE4-SYS 0.92 0.92 0.94 0.94 0.50 0.90 1.00 NO4-SYS -0.38 -0.21 -0.19 -0.20 -0.47 -0.38 -0.32 1.00