Embed Size (px)
Citation preview

Contributions to Geophysics and Geodesy Vol. 45/4, 2015 (269–283)
Analysis of evaporation from watersurface measured automatically by theEWM evaporimeter at the weatherstation in Ustı nad Orlicı between 2001and 2014
Mojmır KOHUT1, Jaroslav ROZNOVSKY1,2, Grazyna KNOZOVA1,Jachym BRZEZINA1
1 Czech Hydrometeorological Institute, branch office Brno,Kroftova 43, 616 67 Brno, Czech Republic;e-mail: [email protected]
2 Mendel University in Brno, Faculty of Horticulture,Zemedelska 1, 613 00 Brno, Czech Republic
Abstract: Evaporation from water surface at the station in Ustı nad Orlicı was mea-
sured using an automatic EWM evaporimeter. The analysed period was from May 1st to
September 30th in the years 2001 to 2014. Statistical analysis of the daily evaporation
showed that the values ranged between 0.0 mm and 7.3 mm (July 17, 2007). This max-
imum value was analysed in detail and considered to be realistic based on the unusual
weather conditions on that day. The highest average daily evaporation was observed in
July (2.8 mm), followed by August (2.5 mm). On the other hand the lowest average
daily evaporation was found to be in September (1.6 mm). Average monthly evaporation
totals in the analysed period (2001–2014) ranged from 49.1 mm (September) to 86.1 mm
(July). The absolute lowest monthly evaporation total in the analysed period was mea-
sured in September 2002 (34.4 mm), on the other end of the scale, the absolute highest
monthly evaporation in the period of interest was measured in August 2003 (114.5 mm).
Statistics of annual data show that out of the 14 years analysed, the lowest evaporation
was observed in 2005 (263.5 mm), while the highest in 2007 (426.1 mm). Average annual
(May-September) evaporation for the 14 years is 355.0 mm. The trend in evaporation
for May and August is negative, in the other months it is positive. The largest change
was seen in July, where the linear index value is +1.555. However, the trends in monthly
values are not statistically significant.
Key words: evaporation, statistical analysis, trend in evaporation, Ustı nad Orlicı
269doi: 10.1515/congeo-2015-0024

Kohut M. et al.: Analysis of evaporation from water surface . . . (269–283)
1. Introduction
Evaporation represents the outflow component within the water cycle inlandscape. The amount of water in landscape is therefore determined notonly by the amount of rainfall, but also by the level of evaporation (Kohut,2005). Evaporation occurs from various surfaces and if the surface is notcovered with vegetation it is referred to as evaporation, whereas if there isvegetation present, it is called the evapotranspiration (Allen et al., 1998).Evaporation is a meteorological variable which represents the amount ofwater, which evaporates into the air from water surface, soil and also plants(Sobısek et al., 1993).
In nature, evaporation is a very complex physical process, which takesplace at all moist surfaces depending on how much energy there is availablefor the actual evaporation (Penman, 1948). The intensity is influenced bythe physical properties of the surface, solar radiation balance determined byits transformation at this surface, humidity and air flow, vegetation coveretc. Various methods are used for the quantification of plant transpirationin correlation to environmental conditions (Klimesova et al., 2013). Besidesmodelling based on meteorological variables, instrumental methods are uti-lized as well. It is this complexity of the evaporation process which makesit difficult to measure unlike many of the other meteorological parameters(Brutsaert, 1982).
Evaporation from a water surface is the simplest case of the evaporationprocess (Novak, 1995). Unlike evaporation from the other surfaces (bare soil,grass land, plant cover, agricultural crops), evaporation from water surfaceis not limited by the amount of available water and so it can be consideredto be equal to the potential evaporation, namely the maximum possibleevaporation, the intensity of which is only dependent on atmospheric con-ditions. This means that the amount of evaporation from a water surfacein a given time span (day, month, year etc.) depends on the state andvariability of the basic meteorological variables – the air temperature andhumidity, global radiation (duration of sunlight) and wind speed (Burmanand Pochop, 1994). It can also be said that the amount of evaporationfrom a water surface is quantitatively very similar to the values of potentialevapotranspiration from grassland or reference evaporation from a hypo-thetical surface based on the FAO method (Knozova et al., 2005). Together
270
Contributions to Geophysics and Geodesy Vol. 45/4, 2015 (269–283)
with atmospheric precipitation and outflow, evaporation determines waterbalance in the landscape, where scenario calculations of potential evapo-transpiration predict a significant increase in aridity of the climate in theCzech Republic (Spacilova et al., 2014).
In the history of CHMI measurements, various instruments have beenused to measure the evaporation from a water surface. This includes theWild evaporimeter, Ron’s evaporimeter (the so-called pan or difference evap-orimeter), but also the Piche evaporimeter (Kocourek, 1972). The predeces-sor of the automatic evaporimeter EWM was the GGI 3000 evaporimeter.
Analysis of the measured values of evaporation was performed by Vasa(Vasa, 1968), data from Moravia and Silesia were also analysed by Krız(Krız, 1966) and data from Slovakia were processed by Lapin (Lapin, 1977).Analysis of the measured data, however, showed some imperfections in thecase of all the instruments, which to a lesser or higher degree influencedthe values of evaporation from the water surface, so the measurements wereended. Comparison of the measured values using several evaporimeters wasperformed at a station of the Water Research Institute Hlasivo (Buchtela,2005).
The sum of evaporation and transpiration, namely the evapotranspira-tion, represents the total evaporation from the landscape and it is the basicphase of water outflow. When we subtract evaporation from the amountof rainfall we get the amount of available water in the soil, in other wordsthe water balance (Kohut et al., 2013). Evaporation from water surfacerepresents one of the main components of the hydrological balance and sig-nificantly influences various processes that take place in the lower levels ofthe atmosphere. Within the weather station network of the CHMI, evap-oration is currently measured using the automatic EWM evaporimeter, inthe case of the station in Ustı nad Orlicı, this instrument was installed in2001 (Bares et al., 2006).
The station in Ustı nad Orlicı is located in the Podorlicka hilly area, 402m above sea level. Based on Quitt classification it is found in a slightlywarm area MW7, the Atlas of Czechoslovakian climate from 1958 assigns itto slightly warm area and slightly humid subregion B3 of slightly warm andhumid hilly region with mild winter. Based on agroclimatic division it is awarm macroregion, relatively warm region, slightly dry subregion and areawith relatively mild winters. Regular automatic measurements of evapora-
271

Kohut M. et al.: Analysis of evaporation from water surface . . . (269–283)
tion from water surface have been performed here since the beginning ofthe vegetation period of 2001, this means data are available since May 15,2001. Prior to that evaporation was measured using the manual GGI-3000evaporimeter (Fisak, 1994). Results of the analysis of GGI-3000 measure-ments were published in a work by Kohut in 2014 (Kohut et al., 2014).
The aim of the presented study is to analyse daily, monthly and seasonalvalues of evaporation from water surface at the station in Ustı nad Orlicı.
2. Methods
The presented results were obtained from an analysis of measured valuesfrom an automatic evaporimeter EWM (technical specification of this in-strument can be found in Lipina et al. (2014)).
Data from the station were analysed for a 14-year period between theyears 2001 and 2014. Values of evaporation were assessed for each year be-tween 1st May and 30th September. Before the actual assessment, the datawere verified; any potential missing values were added and the likely incor-rect values based on the comparison with values calculated by the AVISOmodel using meteorological variables, corrected (Kohut et al., 2013). Com-plete statistical analysis of the data set was performed for individual months,years and the overall period. Calculations were done using the climatologi-cal software ProClimDB (http://www.climahom.eu).
3. Results
The results of the statistical analysis of daily values of evaporation for the in-dividual months and the whole period are summarized in Table 1. The dailyevaporation amounts in the analysed period (2001–2014) ranged between 0.0mm and 7.3 mm (July 17, 2007). The course of daily values for the entireperiod and the daily minimum and maximum values are shown in Fig. 1.The maximum average daily evaporation was in July (2.8 mm), followedby August (2.5 mm). Minimum average daily evaporation was observed inSeptember (1.6 mm). When comparing the extreme values measured in theindividual months, it can be seen that with the exception of June and July
272

Contributions to Geophysics and Geodesy Vol. 45/4, 2015 (269–283)
Table 1. Statistics of the daily evaporation from water surface from automatic measure-ments from the station in Ustı nad Orlicı for the period between May and September2001 to 2014.
Month V VI VII VIII IX V–IX
Day average 2.164 2.519 2.776 2.488 1.637 2.320
Standard deviation 0.985 1.042 1.076 1.032 0.829 1.070
Coefficient of variance 45.518 41.366 38.761 41.479 50.641 46.121
Skewedness 0.187 0.232 0.225 0.297 0.337 0.322
Kurtosis −0.287 −0.068 0.450 0.060 −0.067 0.040
Day minimum 0.000 0.100 0.100 0.000 0.000 0.000
Day maximum 5.100 6.000 7.300 5.700 4.600 7.300
10th percentile 0.800 1.200 1.400 1.300 0.500 1.000
25th percentile 1.500 1.800 2.000 1.800 1.000 1.600
Median 2.100 2.500 2.800 2.500 1.600 2.300
75th percentile 2.900 3.200 3.500 3.100 2.200 3.000
90th percentile 3.400 3.900 4.100 3.910 2.700 3.700
(0.1 mm), the absolute minimum value for all the other months is equal to0.0 mm, and the absolute maximum values in the individual months rangefrom 4.6 mm (September) to 7.3 mm (July).
Fig. 1. Average, maximum and minimum values of daily evaporation from water surfacefrom automatic measurements at the station in Ustı nad Orlicı in the period between Mayand September 2001 to 2014.
273
Kohut M. et al.: Analysis of evaporation from water surface . . . (269–283)
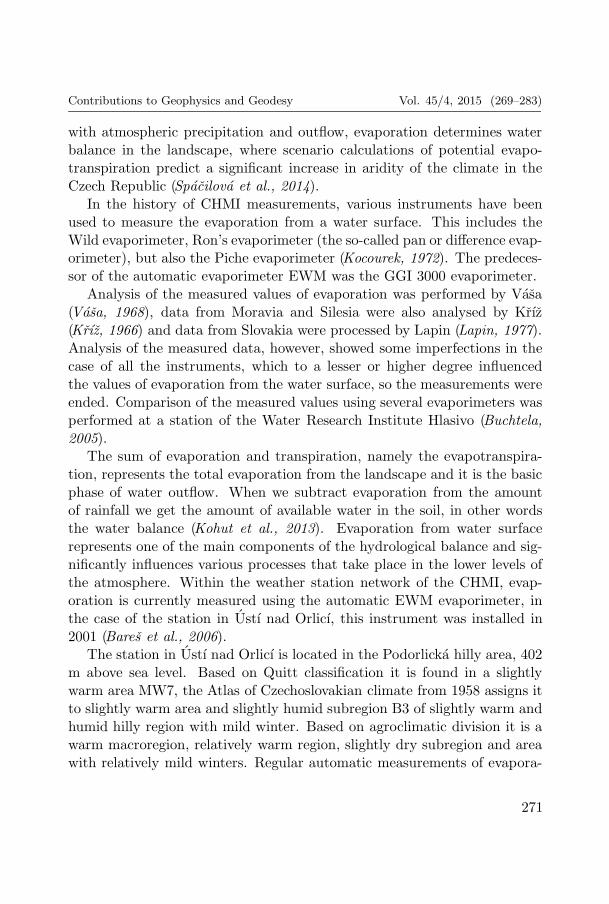
Fig. 2 shows the course of daily evaporation in 2005, when the overalltotal evaporation was the lowest out of all the years and 2007, when it wasthe highest. Both lines show the large variability in the meteorological vari-able of interest between the individual days. A very significant decrease inevaporation amount (2.4 mm) was observed from July 17th 2007 to July18th 2007. This is the largest decrease observed in the above mentioned twoyears. Such changes are associated with changes in many other meteorolog-ical variables, which determine the evaporation process. A detailed analysisof the events on July 17th, 2007 is described in the next chapter.
The results also show that 50% of all the values lie in the interval between1.6 mm and 3.0 mm. Frequency histogram (Fig. 3) and Table 1, which alsoincludes the values of kurtosis and skewedness, show that the distributioncurve is slightly shifted towards higher values (skewedness = 0.322). In com-parison to measurements from this station from previous years, which wereperformed using the manual evaporimeter GGI-3000 (Kohut et al., 2013),the value of kurtosis is lower and the daily evaporation values are in generalmore concentrated around the mean. The median value (2.3 mm) is almostequal to the mean (2.32 mm). The variability in data was analysed by cal-culating the standard deviation and coefficient of variance. The coefficientof variance for the entire period analysed is 46.12.
Fig. 2. Daily evaporation from water surface from automatic measurements at the stationin Ustı nad Orlicı in the period between May and September 2001 to 2014.
274

Contributions to Geophysics and Geodesy Vol. 45/4, 2015 (269–283)
Fig. 3. Frequency histogram of daily evaporation from water surface from automaticmeasurements at the station in Ustı nad Orlicı in the period between May and September2001 to 2014.
The highest values of standard deviation were observed during the sum-mer months, which is due to the fact that the absolute highest values of dailyevaporation occur in these months and so also the variability is greatest.
4. The extremely high evaporation value measured on July17, 2007
When analysing the daily data, close attention was paid to the extremevalues. Very low values of evaporation are actually quite common at theUstı nad Orlicı station, 2.8% of days have a value of less than 0.5 mm. Valuesexceeding 6.0 mm, on the other hand, are relatively very rare and accountfor only 0.1% of all the monitored days. It must be said however, that evensuch high values of evaporation are realistic given the climate conditions inthe Czech Republic and are also observed at other evaporation measuringstations within the CHMI network. In the past, when evaporation wasmeasured using the manual evaporimeter GGI-3000, the proportion of days
275

Kohut M. et al.: Analysis of evaporation from water surface . . . (269–283)
with evaporation over 6.0 mm measured at the station in Ustı nad Orlicıwas 0.9% (Kohut et al., 2013), however, it must be noted that this analysiswas from a 30-year period.
Extremely high evaporation is related to several factors. In order tofind the relationships between the weather conditions and evaporation atthis particular station, an in-depth analysis of the meteorological conditionsduring the day with highest evaporation measured was performed. On July17, 2007, a cold front was slowly moving from the Western Europe towardsthe East, preceded by tropical air. It was sunny in the analysed location,mostly sunny or partly cloudy in the afternoon and thunderstorms and rainshowers appeared occasionally, especially in the region of South Moravia.The course of the various meteorological variables on this day is shown inFig. 4. The weather station in Ustı nad Orlicı had direct sun light for thewhole day. The duration of sun light on this day was 13.5 hours. The airtemperature exceeded 20 ◦C in the morning and kept on increasing until theafternoon when it reached the maximum of 33.9 ◦C. The average daily airtemperature was 27.6 ◦C. This was also reflected in the air humidity, whichwas very low throughout the whole day and reached its minimum at 3 PM,with a value of 28% . The daily average humidity was only 45% . There wasa very gentle wind during the whole day, with occasional fresh gusts. During
Fig. 4. Course of precipitation (SRA), wind speed (F), solar radiation (SSV), air temper-ature (T) and relative humidity (H) in 15-minute intervals on July 17, 2007 at the stationin Ustı nad Orlicı.
276
Contributions to Geophysics and Geodesy Vol. 45/4, 2015 (269–283)
the night of July 18, 2007, a large thunderstorm system formed in Bohemia,which subsequently moved towards the southwest. The thunderstorm inUstı nad Orlicı was accompanied by intense rain and lasted from 4:30 AM to6:05 AM CET. After that the rain intensity decreased and the thunderstormmoved towards the northeast. The above described conditions are ideal forvery high values of evaporation.
5. Monthly statistics
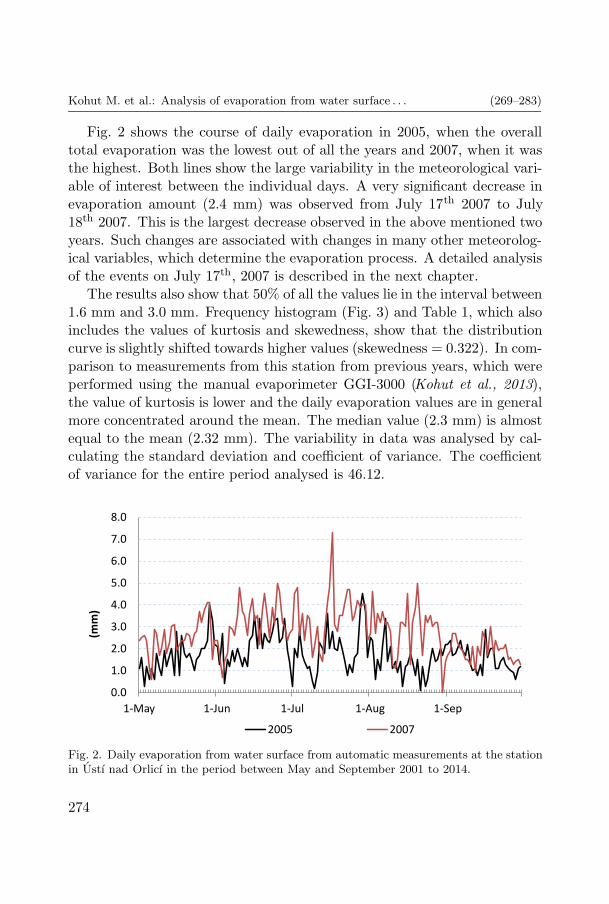
Statistical analysis of monthly data was also performed and the results forthe individual months given in Table 2. Average monthly evaporation sumsin the analysed period from 2001 to 2014 ranged from 49.1 mm (September)to 86.1 mm (July). The month with the absolute lowest evaporation outof all the measured months was September 2002, with a value of only 34.4mm. On the other side of the scale, the highest absolute monthly sum ofevaporation was measured in August 2003 (114.5 mm). It can also be seenfrom the table (Table 3) that especially during the summer months, thevariability of data is quite high, especially because the highest values of
Table 2. Statistics of monthly total evaporation from water surface from automatic mea-surements at the station in Ustı nad Orlicı from May to September 2001 to 2014.
Month V VI VII VIII IX V–IX
Average sum 67.079 75.579 86.071 77.121 49.121 70.994
Standard deviation 13.987 14.162 14.067 17.443 10.030 18.612
Coefficient of variance 20.852 18.738 16.343 22.618 20.419 26.216
Skewedness −0.265 −0.019 −0.612 0.254 −0.154 0.000
Kurtosis −1.332 −1.258 0.106 0.610 −1.058 −0.677
Monthly minimum 44.300 54.700 58.100 44.600 34.400 34.400
Monthly maximum 87.500 97.500 108.100 114.500 66.600 114.500
10th percentile 47.990 56.320 61.970 58.820 35.210 45.050
25th percentile 54.400 61.400 79.000 64.100 38.200 56.500
Median 69.250 78.300 88.050 76.650 52.550 73.300
75th percentile 78.600 86.300 93.800 89.500 56.400 86.300
90th percentile 82.190 93.990 101.080 94.250 58.410 93.500
277

Kohut M. et al.: Analysis of evaporation from water surface . . . (269–283)
Table 3. Monthly total evaporation from automatic measurements at the station in Ustınad Orlicı from the period between May and September 2001 to 2014 in the individualyears.
Month V VI VII VIII IX V–IX
2001 81.6 54.7 62.4 74.5 35.3 308.5
2002 78.4 81.5 89.3 64.1 34.4 347.7
2003 73.0 97.5 79.0 114.5 54.1 418.1
2004 48.4 61.3 82.0 89.5 53.9 335.1
2005 50.8 64.5 58.1 44.6 45.5 263.5
2006 57.4 61.4 100.3 61.5 66.6 347.2
2007 78.6 93.6 108.1 88.7 57.1 426.1
2008 65.5 86.3 86.8 92.0 51.2 381.8
2009 73.6 72.1 82.6 78.8 56.2 363.3
2010 44.3 78.6 93.8 60.4 44.5 321.6
2011 80.6 92.3 76.3 74.0 57.5 380.7
2012 87.5 78.0 93.4 90.1 56.4 405.4
2013 54.4 56.5 100.2 80.0 36.8 327.9
2014 65.0 79.8 92.7 67.0 38.2 342.7
evaporation are measured in these months due to the weather conditionscommon for this part of the year.
Monthly total evaporation over 100 mm was only measured three timesduring the analysed period and this was always during either July or August.This is then also reflected in the value of standard deviation. The lowestvariability within one month is in September (standard deviation of 10.03),highest variability on the other hand was during August (standard deviationof 17.44). Table 2 also shows the overall variability in data. 50% of values oftotal monthly evaporation lie between 56.5 mm and 86.3 mm. The overallskewedness is exactly 0, which means that data is evenly distributed anddeviations lie evenly on both sides of the mean.
It is also interesting to compare the average monthly values measuredin this study from 2001 to 2014 using the automatic evaporimeter withthe ones measured using the manual evaporimeter GGI-3000 in the yearsbetween 1971 and 2000. In general, the average of monthly total evaporationfrom water surface measured using the manual evaporimeter was higher in
278

Contributions to Geophysics and Geodesy Vol. 45/4, 2015 (269–283)
the case of all the months and thus also overall. The monthly average totalevaporation measured between 1971 to 2000 was 76.2 mm, while in the caseof the automatic measurements from 2001 to 2014 it was only 71.0 mm,which means approximately 7% less.
6. Annual statistics
Statistical analysis for the individual years in the analysed period is given inTable 4 and shown in Fig. 3. The highest total evaporation during one year(measured between May and September) in the analysed period from 2001to 2014, was observed in 2007 (426.1 mm). The lowest overall value wasobserved in 2005 with just 263.5 mm. The overall average total evaporationfrom all the 14 years analysed is 355.0 mm.
Graph 3 clearly shows the variability of the data between the individualyears. A numerical expression of this variability can be found in Table 4.50 % of the average evaporation totals for one year (May to September)lie between 327.9 mm and 381.8 mm. The table (Table 4) also shows thatthe skewedness of data is slightly negative, which means that the data isconcentrated a little bit more towards values below the mean.
Table 4. Statistics of total evaporation for the individual years (May-September) mea-sured by automatic EWM evaporimeter at the station in Ustı nad Orlicı between 2001and 2014.
Average annual (May-September) total 354.971
Standard deviation 44.782
Coefficient of variance 12.616
Skewedness −0.157
Kurtosis −0.021
Monthly minimum 263.5
Monthly maximum 426.1
10th percentile 304.0
25th percentile 327.9
Median 347.45
75th percentile 381.8
90th percentile 418.9
279

Kohut M. et al.: Analysis of evaporation from water surface . . . (269–283)
In general it can be said that during the analysed period between 2001and 2014, there was one year with exceptionally low evaporation (263.5 mm,measured in 2005) and total evaporation over 400 mm was observed duringthree years (2003, 2007 and 2012) (see Table 3 and Fig. 5).
Fig. 5. Graph of total evaporation from water surface for the individual years betweenMay and September 2001 to 2014 at the station in Ustı nad Orlicı. Line corresponds tothe linear trend in data.
7. Trends
Linear trend was calculated for the individual years (Table 5), as well asfor the particular months. The value of linear index of the annual values inthe 14-year period is +1.596. This however, is not statistically significant.A negative trend was observed in May and August, in the other analysedmonths the trend was positive. The greatest change was observed in July,
Table 5. Linear trends in evaporation from water surface for the individual months andthe whole analysed period between 2001 and 2014 at the station in Ustı nad Orlicı.
Month V VI VII VIII IX V–IX
Linear trend −0.266 0.413 1.555 −0.256 0.149 1.596
280

Contributions to Geophysics and Geodesy Vol. 45/4, 2015 (269–283)
for which the value of linear index is +1.555. The monthly trends, however,are also not statistically significant.
8. Conclusion
Statistical analysis of the values of evaporation from water surface during thevegetation period fromMay to September 2001 to 2014 at the station in Ustınad Orlicı show, that daily evaporation sums in this 14-year period rangedbetween 0.0 and 7.3 mm. The daily average was 2.32 mm and standarddeviation 1.070.
When comparing the values for the individual months it can be seen thatthe highest average monthly evaporation amount was during the summermonths of July (86.1 mm) and August (77.1 mm), while the lowest valueswere observed in September (49.1 mm). The overall average monthly totalwas 71.0 mm.
The totals from the entire vegetation period for the individual yearsvary irregularly from 263.5 mm (2005) to 426.1 mm (2007). The lineartrend of these values is slightly positive, but this increase is not statisticallysignificant and also the trends in totals for the individual months are notstatistically significant.
The fact that all the trends are not statistically significant is due tothe fact that when comparing the trends in the individual meteorologicalvariables, which determine evaporation (air temperature and humidity, windspeed, sun light duration) a slight decrease can be seen in all cases, butalways statistically insignificant.
Acknowledgments. The paper was supported by the Ministry of Agriculture of
the Czech Republic, Project No. QJ1230056 “The impact of the expected climate changes
on soils of the Czech Republic and the evaluation of their productive functions”.
References
Allen R. G., Pereira L. S., Raes D., Smith M., 1998: Crop evapotranspiration. Guidelinesfor computing crop water requirements. Food and Agriculture Organization, Rome:FAO Irrigation and Drainage Paper, 56, pp. 301.
281

Kohut M. et al.: Analysis of evaporation from water surface . . . (269–283)
Bares D., Mozny M., Stalmacher J., 2006: Automation of evaporation measurements inCHMI (Automatizace merenı vyparu v CHMU). In: “Bioclimatology and water inthe land”, Bioclimatological workshop 2006, Strecno, Slovakia, online, accessed 16August 2011, <http://www.cbks.cz/sbornikStrecno06/prispevky/PosterI. cla
nky/P1-16.pdf> (in Czech).
Brutsaert W., 1982: Evaporation into the atmosphere: theory, history, and applications.Dordrecht, Holland: D. Reidel Publishing Co., pp. 299.
Buchtela S., 2005: Evaporation measurement station in Hlasivo (Vyparomerna stan-ice Hlasivo). In: Roznovsky J., Litschmann T. “Evaporation and evapotranspi-ration“, workshop 2005, Brno, Czech Republic, online, accessed 16 August 2011,<http://cbks.cz/sbornik05/prispevky.htm> (in Czech).
Burman R., Pochop L. O., 1994: Evaporation, Evapotranspiration and Climatic Data.Amsterdam: Elsevier Science B.V., pp. 275.
Fisak J., 1994: Manual for observers at the meteorological stations. Metodological guideof CHMI No. 11. (Navod pro pozorovatele meteorologickych stanic. Metodickypredpis CHMU), 11, 3rd edition, CHMI, Prague, 115 p. (in Czech).
Klimesova J., Stredova H., Streda T., 2013: Maize transpiration in response to meteoro-logical conditions. Contributions to Geophysics and Geodesy, 43, 3, 225-236.
Knozova G., Roznovsky J., Kohut M., 2005: Comparison of evaporation time series mea-sured by evaporimeter GGI-3000 and thatcalculated by the FAO method (Srov-nanı casovych rad vyparu namereneho vyparomerem GGI-3000 a vypocıtanehopodle metodiky FAO). In: Roznovsky J., Litschmann T. (ed): “Bioclimatologyof the present and future”, Krtiny, Czech Republic, October 12–14 2005, online:<http://www.cbks.cz/sbornik05b/KnozovaRoznovskyKohut.pdf> (in Czech).
Kocourek F., 1972: Measurement methods in meteorology of lower atmospheric layers(Mericı metody v meteorologii spodnıch vrstev ovzdusı). 2nd edition, Praha. CHMI,212 p. (in Czech).
Kohut M., Roznovsky R., Knozova G., 2013: Measurements of evaporation from wa-ter surface in Czech Republic realized by GGI-3000 evaporimeter (Merenı vyparuz vodnı hladiny vyparomerem GGI-3000 v Ceske republice). Prace a studie, 35,CHMI, Praha, 96 p. (in Czech).
Kohut M., Roznovsky R., Knozova G., 2014: Comparison of actual evaporation fromwater surface measured by GGI-3000 evaporimeter with values calculated by thePenman equation, Contributions to Geophysics and Geodesy, 44, 3, 231–240.
Kohut M., 2005: Referential evapotranspiration (Referencnı evapotranspirace). In: Roz-novsky J., Litschmann T. (ed) “Evaporation and evapotranspiration”, workshop2005, Brno, Czech Republic, Brno, Czech Bioclimatological Society, 25–36, ISBN80-86690-24-5, (in Czech).
Krız H., 1966: Evaporation in drainage basins of Morava and upper Oder rivers (Vyparv povodı Moravy a hornı Odry). In: Proceedings of Hydrometeorologic Institute ofthe Czechoslovak Socialistic Republic (Sbornık pracı Hydrometeorologickeho ustavuCeskoslovenske socialisticke republiky), 8, Praha, HMI, p. 34–58 (in Czech).
Lapin M., 1977: Evaluation of evaporation GGI-3000 in Slovakia in the period 1969–1973.Meteorologicke zpravy, 30, 6, 168–174, ISSN 0026-1173.
282
Contributions to Geophysics and Geodesy Vol. 45/4, 2015 (269–283)
Lipina P., Kain I., Zidek D., 2014: Methodological guide of CHMI (Navod pro po-zorovatele automatizovanych meteorologickych stanic). Metodicky predpis, 13a,verze 2. Praha, CHMU, ISBN 978-80-87577-34-9 (in Czech).
Novak V., 1995: Evaporation of water in nature and methods of its determination (Vy-parovanie vody v prırode a metody jeho urcovania). Bratislava, SAV, 260 p. (in Slo-vak).
Penman H. L., 1948: Natural evaporation from open water, bare soil and grass. Proceed-ings of the Royal Society of London. Series A, 193, 1032, 120–145.
Sobısek B., Krska K., Munzar J. et al., 1993: Explanatory and terminology meteorologicaldictionary (Meteorologicky slovnık vykladovy a terminologicky). 1st edition. Praha,Academia, 594 p., ISBN 80-85368-45-5 (in Czech).
Spacilova B., Streda T., Thonnova P., 2014: Spatial expression of potential wind erosionthreats to arable soils in the Czech Republic. Contributions to Geophysics andGeodesy, 44, 3, 241–252.
Vasa J., 1968: Direct evaporation measurements from free water surface (Prıme merenıvyparu z volne hladiny). Prace a studie, 120, Praha, VUV, 84 p., ISSN 1211-3727(in Czech).
283


![ı¥£ı-£ı-¬flA‘b∫P-–Æ, £¿P¯ªU P«P[P-–Æ ˆuıh∫¢x ïØÿ]zx ¡∏-Qfl”⁄. £P-¡ıfl ˇ \zØ \ı¥ £ı£ı¬fl P¿¬z vmh-ïÆ Cx-uıfl. £P-¡ıfl](https://img.pdfslide.net/doc/110x75/5f9fe302a5f157619275f2ec/-i-aabap-a-pu-ppp-a-uhax-zx.jpg)