Embed Size (px)
Citation preview

ANALYSIS OF FACTORS AFFECTING THE AUDITOR
SWITCHING ON BANKING COMPANIES
LISTED IN INDONESIA STOCK EXCHANGE
PERIOD 2008 – 2014
SKRIPSI
By
Stefhany Natalia
008201200145
Presented to
The Faculty of Business, President University
In partial fulfillment of the requirements
for
Bachelor Degree in Business, Major in Accounting
PRESIDENT UNIVERSITY
Cikarang Baru - Bekasi
Indonesia
2016

i
ANALYSIS OF FACTORS AFFECTING THE AUDITOR
SWITCHING ON BANKING COMPANIES
LISTED IN INDONESIA STOCK EXCHANGE
PERIOD 2008 – 2014
SKRIPSI
By
Stefhany Natalia
008201200145
Presented to
The Faculty of Business, President University
In partial fulfillment of the requirements
for
Bachelor Degree in Business, Major in Accounting
PRESIDENT UNIVERSITY
Cikarang Baru - Bekasi
Indonesia
2016

ii
PANEL OF EXAMINERS
APPROVAL SHEET
Herewith, the Panel of Examiners declare that the skripsi entitled “Analysis Of Factors
Affecting The Auditor Switching On Banking Companies Listed In Indonesia Stock
Exchange Period 2008 – 2014” submitted by Stefhany Natalia majoring in Accounting,
Faculty of Business was assessed and proved to have passed the Oral Examination on Thursday,
January 21th, 2016
Chair, Panel of Examiner,
Misbahul Munir, Ak., MBA., CPMA., CA
Examiner I
Drs. Gatot Imam Nugroho, Ak., MBA., CA
Examiner II Co. Examiner II
Dr. Sumarno Zain, S.E., Ak., MBA Andi Ina Yustina, M.Sc

iii
SKRIPSI ADVISER
RECOMMENDATION LETTER
This skripsi entitled “Analysis Of Factors Affecting The Auditor Switching On Banking
Companies Listed In Indonesia Stock Exchange Period 2008 – 2014” prepared and
submitted by Stefhany Natalia in partial fulfillment of the requirements for Bachelor Degree in
Business - Major in Accounting, has been reviewed and found to have satisfied the
requirements for a thesis fit to be examined. We therefore recommend this thesis for Oral
Defense.
Cikarang, Indonesia, December 17th, 2016
Acknowledge
……………………………………..
Misbahul Munir, Ak., MBA.,
CPMA., CA
Head, Accounting Study Program
Skripsi Adviser,
……………………………………
Drs. Gatot Imam Nugroho, Ak.,
MBA., CA

iv
DECLARATION OF ORIGINALITY
This skripsi entitled “Analysis Of Factors Affecting The Auditor Switching On Banking
Companies Listed In Indonesia Stock Exchange Period 2008 – 2014” prepared and
submitted by Stefhany Natalia in partial fulfillment of the requirements for Bachelor Degree in
Business Major in Accounting has been reviewed and found to have satisfied the requirements
for a thesis fit to be examined. I therefore recommend this thesis for Oral Defense.
Cikarang, Indonesia, December 17th, 2016
Researcher,
Stefhany Natalia
008201200145

v
ANALYSIS OF FACTORS AFFECTING THE AUDITOR SWITCHING ON
BANKING COMPANIES LISTED IN INDONESIA STOCK EXCHANGE
PERIOD 2008 – 2014
ABSTRACT
Auditor switching is a process of public accountant firm replacement done by
the company. There are two types of auditor switching in Indonesia: voluntarily and
obligatory. Voluntarily auditor switching has brought a suspicion for stakeholder. This
research is proposed to discover the influence of auditor opinion, public accountant
firm size, management changes, and financial distress towards auditor switching in
banking companies since manufacturing companies research are many to find.
Population conducted in this research is banking companies that are
respectively listed in Indonesia Stock Exchange during 2008 – 2014. Sampling method
performed is purposive sampling where criteria are set as a benchmark of sample
compatibility which resulting in 28 banking companies. This research is exercising
secondary data and documentation technique. The data is analyzed by using descriptive
statistic and logistic regression as research method with α 0.05. Independent variables
in this research are Auditor Opinion, Public Accountant Firm Size, Management
Changes, and Financial Distress while the dependent variable is Auditor Switching.
The result of this research exhibits: auditor opinion, public accountant firm size,
management changes, and financial distress are simultaneously influencing auditor
switching. In hypothesis test, public accountant firm size hypothesis is supported with a
significant value 0.005 which is lower than α while the other variables are not. For
future researcher, the addition of some variables to attest might be proper. Moreover,
the computation of financial distress shall be attested by another method and model.
Keywords: Auditor Switching, Auditor Opinion, Public Accountant Firm Size,
Management Changes, and Financial Distress

vi
ACKNOWLEDGEMENT
Somebody once told me, “Love means giving no matter what it takes even when
you have nothing to get. Keep loving, sincerely, and whole-heartedly like it was the last
breath you can breathe.” These, are the people that hardly loving me with their best
way while whether I could repay or I even do not have a chance to. These, are the
people I am worth loving for. The one(s) who is always stand by me, giving their
shoulder for me to cry on, offering their ears to listen all my loves and grieves
obligingly, telling me impassioned words of wisdom and reminding me always that
when I can’t, He, My Jesus, is always can.
1. Papa and mama, I thank you for your understanding and support for all
things that I am doing, especially this skripsi. Thank you for waking up
every single morning and cooking me food, mam. Your ayam jahe will be
the one that I am looking for when I go to work, soon. Pap, thank you for
driving me over all places I need to go for job interview and this skripsi
thingy. No, you are not driver. You are my Superman and you will always
be.
2. Cayun and Adys, you girls are the best sister ever lived in the world and I
am grateful having you both. There is no even a person who wants to hear
my stories like you do, Cayun. Adys, thank you for being such a funny and
witty 8 years old sister and hearing my skripsi-tales. The one who always
hug me every single time I am coming home and kiss me all over my face. I
love you!
3. Mr. Misbahul Munir, MBA., Ak., CPMA as Dean of Faculty of Business
President University.
4. Mr. Gatot Imam Nugroho, AK., MBA., CA, my skripsi adviser. Thank you
sir for you time and patience encouraging me to have this skripsi finished.
5. Mr. Dr. Josep Ginting. You gave lots of food of thoughts and advices for this
skripsi. Thank you sir.
6. Mam Ina, the most friendly lecturer I have ever had and the one I came to
when I was in the middle of skripsi confusion. You are my journal helper. I
owe you a pan of pizza, mam!
7. Mr. Dr. Sumarno Zain, SE. Ak., MBA. Thank you sir for your kindness
helping me developing this skirpsi.

vii
8. My Jesus’ Bride. These girls are such a gift for me. Thank you for always
there supporting and encouraging your mom in doing this skripsi. I am proud
having you, girls.
9. Jesus’ Dizciple! I owe you lots of thank-you(s). A “father”, a best-friend(s),
a helper, the one who always I can cling to, a family who knows how hard I
am struggling. Thank you.
10. Epin, Hana, Monic, my Core Team forevermore.
11. God’s DNA Jababeka, even in the middle of this hectic skripsi-deadline you
guys are always here, head and heart.
12. Jesslin Putri, a roommate and a bestie. The craziest and finest girl I have
ever found in this universe.
13. Dian and Cecil, thank you for being a good sleepover-girl and study-mate
for these 8 semesters!
14. All accounting squads of President University, these 10 semesters
mesmerize me.
15. For all examiners, I will never pass Bachelor Degree without you.
I consciously realize that this skripsi is far from perfection and I would never
have it done with all those people I mentioned and do not able to mention one by one
above. I have a big hope that this research could become a useful matter for future
users.
Cikarang, Dec 16th 2015
Stefhany Natalia
viii
TABLE OF CONTENTS
PANEL OF EXAMINERS APPROVAL SHEET ................................................................. ii
RECOMMENDATION LETTER OF SKRIPSI ADVISER ............................................... iii
DECLARATION OF ORIGINALITY ................................................................................. iv
ABSTRACT ............................................................................................................................v
ACKNOWLEDGEMENT .................................................................................................... vi
TABLE OF CONTENTS .................................................................................................... viii
LIST OF TABLES ..................................................................................................................x
LIST OF FIGURES .............................................................................................................. xi
LIST OF APPENDICES ...................................................................................................... xii
CHAPTER 1 - INTRODUCTION ..........................................................................................1
1.1 Research Background ......................................................................................................1
1.2 Problem Statement ..........................................................................................................5
1.3 Research Objectives ........................................................................................................5
1.4 Research Benefits ............................................................................................................5
CHAPTER II – LITERATURE REVIEW.............................................................................7
2.1 Theoretical Review..........................................................................................................7
2.1.1 Agency Theory .........................................................................................................7
2.1.2 Auditor Switching ....................................................................................................8
2.1.3 Government Rule (Auditor Switching) ......................................................................9
2.1.4 Bank ....................................................................................................................... 10
2.1.5 Auditor Opinion ..................................................................................................... 11
2.1.6 Management Changes ............................................................................................. 13
2.1.7 Financial Distress ................................................................................................... 14
2.1.8 Hypothesis.............................................................................................................. 14
CHAPTER III – RESEARCH METHOD............................................................................ 19
3.1 Population and Sampling ............................................................................................... 19
3.2 Population and Sampling Design ................................................................................... 19
3.3 Research Variable and Operational Definitions Variable ................................................ 21
3.3.1 Dependent Variable ................................................................................................ 21
3.3.2 Independent Variable .............................................................................................. 22
3.4 Research Instrument ...................................................................................................... 24
3.5 Data Collection Procedures............................................................................................ 24
3.6 Data Analysis ................................................................................................................ 25
3.6.1 Descriptive Statistic ................................................................................................ 26

ix
3.6.2 Inferential Statistic Analysis ................................................................................... 28
3.6.3 Hypothesis Test ...................................................................................................... 29
CHAPTER IV – DATA ANALYSIS AND EVALUATION ................................................ 33
4.1 Research Object Description ..................................................................................... 33
4.2 Research Variable Description .................................................................................. 33
4.3 Descriptive Statistic .................................................................................................. 33
4.4 Preliminary Logistic Regression Test (Multicolinearity) ........................................... 36
4.4.1 Logistic Regression Model Test ............................................................................. 37
4.4.2 Overall Model Fit Test ........................................................................................... 38
4.4.3 Hypothesis Test ..................................................................................................... 40
4.4.4 Simultaneous Testing ............................................................................................. 41
4.4.5 Partially Testing .................................................................................................... 41
CHAPTER V – CONCLUSIONS AND RECOMMENDATIONS ..................................... 46
5.1 Conclusions ................................................................................................................... 46
5.2 Limitations .................................................................................................................... 48
5.3 Recommendations ......................................................................................................... 48
REFERENCES .......................................................................................................................
APPENDIX .............................................................................................................................

x
LIST OF TABLES Table 3.2.1 - Sample selection sample based on criteria .................................... 20
Table 3.2.2 - List of sample .............................................................................. 21
Table 3.6.1.1 - Auditor Switching observed from Auditor Opinion ................... 27
Table 3.6.1.2 - Auditor Switching observed from PAF size ............................... 27
Table 3.6.1.3 - Auditor Switching observed from Management Changes........... 27
Table 3.6.1.4 - Auditor Switching observed from Financial Distress ................. 28
Table 4.3.1 - Data Descriptive Variable – Auditor Switcing .............................. 34
Table 4.3.2 - Data Descriptive Variable – Auditor Opinion ............................... 34
Table 4.3.3 - Data Descriptive Variable – Public Accountant Firm Size ............ 35
Table 4.3.4 - Data Descriptive Variable – Management Changes ...................... 35
Table 4.3.5 - Data Descriptive Variable – Financial Distress ............................. 36
Table 4.4 - Multicolinearity Testing Result ....................................................... 37
Table 4.4.1 – Hosmer and Lemeshow Test ........................................................ 38
Table 4.4.2 – Overall Model Fit Test ................................................................ 39
Table 4.4.3 – Nagelkerke R Square value on Logistic Regression Analysis ....... 40
Table 4.4.4 – Simultaneous Testing Result on Regression Analysis .................. 41
Table 4.4.5 – Partially Testing on Logistic Regression Analysis ....................... 42

xi
LIST OF FIGURES
Figure 2.1.8.4 – Research Model....................................................................... 18
xii
LIST OF APPENDICES
Appendix 1 - List of banking companies listed in IDX year 2008 ................................. A
Appendix 2 - List of banking companies listed in IDX year 2009 ..................................B
Appendix 3 - List of banking companies listed in IDX year 2010 ..................................C
Appendix 4 - List of banking companies listed in IDX year 2011 ................................. D
Appendix 5 - List of banking companies listed in IDX year 2012 .................................. E
Appendix 6 - List of banking companies listed in IDX year 2013 .................................. F
Appendix 7 - List of banking companies listed in IDX year 2014 ................................. G
Appendix 8 – Inadequate data bank list .......................................................................... I
Appendix 9 – Sample list of bank .................................................................................. J
Appendix 10 - List of public accountant firm used ..........................................................
Appendix 11 – Financial distress computation ................................................................

1
CHAPTER I
INTRODUCTION
I.1 Research Background
In this era, the level of Indonesian companies’ need toward public accountant
services is quite high. Generally, companies that need public accountant’ services
are the ones who need their service to audit financial statements and give opinion
for their specified purposes. Financial statements are prepared by public
accountants to help stakeholders understand the financial history of the company
and use that knowledge to predict the amount, timing and uncertainty of both future
cash flows and price appreciation of the company (Mautz & Angell, 2006).
Lybrand in Webster (1986) stated that a public accountant is one engaged
professionally in the practice of accountancy; the term accountancy being
understood to cover all forms of investigations of accounts for the determination of
financial conditions, detections of frauds or prevention thereof, or whatever
purpose data obtained from the accounts may be required. Public accountant holds
the engagement with their clients to examine and report on the financial statements
which is based on the arrangement. They undertake to perform their examination in
accordance with GAAS (Generally Accepted Auditing Standards) and to report to
the shareholders and directors as to whether or not, in their opinion, the financial
statement presented fairly (Hanson, 1967). Concerning to that fact, public
accountant can be regarded as an independent party which bridging personal
interests between principals and agents as the manager of enterprises. To perform
the best practice of their job, public accountant is required to produce audit opinion
with finest quality, which is useful not only for business purposes but also public
prominence (Wibowo & Hilda, 2009). Therefore, they are required to

2
independently perform their service without emphasizing on specific party’s
interest. In this phase, independence is highly needed to be owned by a public
accountant.
After the passage of Enron and Arthur Andersen case, Sarbanas-Oxley Act is
formed since the perception of independence has become a significant factor that
influencing auditor's opinion (Smith & Minter, 2005). The auditor should be
independence in two forms: appearance and fact (Irmawan et al., 2013). Once they
do not fulfill the criteria, they could not be categorized as independent (SPAP
(Standar Profesional Akuntan Publik) 2011). Independence is one of the main keys
to become a professional public accountant. The manner of independence builds
public accountants’ character to become insusceptible (SPAP (Standar Profesional
Akuntan Publik) 2011. Therefore, the opinion given by the auditor will be
accountable and credible since all the findings reported are authentic.
In this term, the independence of auditors will lead to the fairness of financial
statement presented by the auditor. To execute their best services, public accountant
has to have ability to produce certain qualities of audit opinion that is useful for
financial statement user which is investors, creditors, and the public (Wibowo &
Hilda, 2009).
Concerning to the discussion above, the issue of auditor’s independence is
becoming one of the most well-known issues among public accountant and the
public. The “auditor switching” phenomenon has been found to have implications
for the credibility of financial reporting and the cost to monitor management
activities (Huson et al. in Nazri et al., 2012). Since 1970s, accounting professionals
and industry experts have extensively studied the massive number of auditor
switching in developed countries. However, there are few studies have been

3
conducted in Indonesia to examine the significant reasons for auditor switching
(Nazri et al., 2012)
Based on the Indonesia Ministry of Finance’s act concerning to “Jasa Akuntan
Publik” (Public Accountant Services) in Article 2 as an amendment of the Ministry
of Finance’s act No. 432/KMK/06/2002, Indonesia is stated as one of some
countries that enforces the execution of mandatory auditor switching to maintain
auditor’s independence. This act thrashes out general audit services on financial
shall be conducted by a public accountant firm for the longest 5 (five) years
accounting period respectively and by a public accountant for the longest 3 (three)
year accounting period. It is enhanced with the issuance of Indonesia Minister of
Finance act No. 17/PMK.01/2008 with some modification of the period of service
provision of a public accountant firm which is 6 (six) years respectively (Article 3,
Paragraph 1).
Furthermore, public accountant and public accountant firm are permitted to give
general audit service for the same clients at least 1 (one) fiscal year after the last
moment they executed the service (Article 3, Paragraph 2 and 3). Before the
passage of SOX, companies did auditor switching to obtain a fresh opinion that will
be stated in their financial statement. In 2002, companies were doing auditor
switching in order to evade and anticipate bad news in going-concern issue. After
the demise of Andersen, a bunch of former Andersen’s clients that were more
visible in the capital markets switched auditor to mostly Big 4 firms and
experienced a more positive reaction as a result (Brazel & Bradford, 2011). In
consequence of this case, a bunch of ex-Andersen clients released more
conservative financial statements after they switched to a new public accountant
firm. The condition in 20th centuries is not much different from the passage before
SOX.

4
Concerning to the 20th centuries fact, there are a bunch of reasons of why
companies are doing auditor switching. Some of the researchers have done their
research about auditor switching and they used some related variables: audit fees,
management changes, public accountant firm’s size, client’s firm size, audit
opinion, financial distress, the image of a public accountant, distance between
public accounting firm and the client, client satisfaction, relationship, ROA, and
etc. After considering and reviewing some of former research, most of them are
using manufacturing companies as their research object. In this research, the writer
executes the research by using banking companies listed in Indonesian Stock
Exchange for the period 2008 - 2014 as research object.
As far as the researcher concerns, bank has unique values that other business
scopes do not have. All earnings earned by another business entity are saved in
bank. Moreover, banking companies have various products offered compared to
other non-financial companies. In addition, the main activities of the bank beside
channeling funds is also raising funds while other financial institutions geared more
towards channeling funds alone. Loan is the biggest product a bank is able to offer
to their customer while another business entities do not serve it.
Referring to the complexity of bank’s business process, in this research, the
writer will conduct the research on auditor switching by using management
changes, public accounting firm’s size, auditor’s opinion, and financial distress by
using banking companies as the object of research. Based on the discussion written
above, the most proper title of this research would be “Analysis Of Factors
Affecting The Auditor Switching On Banking Companies Listed In Indonesia
Stock Exchange Period 2008 – 2014”.

5
I.2 Problem Statement
The writer has intention to find out and discover the influence of the factors
affecting the execution of auditor switching by using auditor opinion, public
accounting firm’s size, management changes, and financial distress of banking
companies listed in Indonesia Stock Exchange for the period 2008 - 2014. Based on
some arguments mentioned above, here are some matters that will be evaluated in
this research:
1. How is the influence of auditor's opinion on auditor switching done by bank
listed in IDX for the period 2008 - 2014?
2. How is the influence of public accountant firm’s size on auditor switching
done by bank listed in IDX for the period 2008 - 2014?
3. How is the influence of management changes on auditor switching done by
bank listed in IDX for the period 2008 - 2014?
4. How is the influence of financial distress on auditor switching done by bank
listed in IDX for the period 2008 - 2014?
I.3 Research Objectives
The objective of this research is generally to identify the influence of auditor’s
opinion, public accountant’s firm size, management changes, and financial distress
on auditor switching done by the bank listed in Indonesia Stock Exchange for the
period 2008 - 2014. Moreover, it is proposed to prove the hypothesis presumed by
the writers.
I.4 Research Benefits
This research is made to identify the influence of auditor’s opinion, public
accountant’s firm size, management changes, and financial distress on auditor
6
switching done by the public companies listed in Indonesia Stock Exchange for the
period 2008 - 2014.
1. For business and corporate practitioner literature, it helps them as a
reference in auditor switching determination by measuring the cost and
benefit using auditor opinion, public accountant’s firm size, management
changes, and financial distress in banking companies.
2. For students, this research is intended to give a deeper knowledge regarding
the influence of auditors opinion, public accountant’s firm size,
management changes, and financial distress on auditor switching done by
public banking companies and as a reference to make next research.
3. For stakeholders, the information provided in this research is intended to
help them in analyzing the effect of auditors opinion, public accountant’s
firm size, management changes, and financial distress on auditor switching
done by banking companies listed in Indonesia Stock Exchange for period
2008 – 2014.

7
CHAPTER II
LITERATURE REVIEW
II.1 Theoretical Review
This chapter is made to expand all theories that relate to this research. The
theories are derived from journal articles and books. This is intended to enlighten and
makes the research clearer.
II.1.1 Agency Theory
Agency theory has attracted a big space of financial accounting researcher since
this theory has caused the agency conflict between principal and agent. The agency
conflict is issued by personal conflict between principal and agent since their
purposes are not in tune. The manager who takes a role as an agent carries out a
moral responsibility to optimize the benefit of the principal. However, on different
sides manager also has the aim to maximize his welfare and interests. Therefore,
there is a concern possibility that agents do not always act on the principal’s best
interest (Jensen and Meckling, 1976). As a party who immediately manage and
handling the company, agent has internal information about the company's prospects
in the future more than the principal has. Thus, the agent has a necessity to give
signs or signals about company's condition to the principal. The financial report is
one form of signs or signals that can be given by the manager as the disclosure of
accounting information that describes the company's performance.
Jensen and Meckling (1976) described that problems may arise when
information received by interested parties are not the same as the actual condition of
the company. This situation is known as an information asymmetry (asymmetric
information) or information that is not symmetrical. Information asymmetry occurs

8
because the agent is superior in knowing and understanding the information
compared to another parties (principal and stakeholders). Principal wants a rapid
and high return as much as possible on investment while the agent has a goal to
open the door of opportunities then they could receive a profuse amount of bonuses
and incentives.
Agency theory also states that every human being will take action in accordance
with their interests. Putting personal interest on top will also give rise to agency
costs. Therefore, the auditor, which is an independent party that adhered to the
auditing standards established by the official institutions and which comply with the
code of professional conduct acts to reduce and prevent the agency costs. The
agency cost that will arise are various depend on the variables existed. Dopuch and
Simunic (1982) in Nasser and Wahid (2006) suggested that in the economy
knowledge the election of trusted and reputable public accountant firm is used as a
signal of management honesty. In addition, Watts and Zimmerman (1986) in Nasser
and Wahid (2006) states that the wider the complexity of company's operations, a
trustworthy public accountant firm with high level of independence is required to be
hired due to reducing the agency cost.
II.1.2 Auditor Switching
Auditor switching is a displacement of auditor (public accountant firm)
conducted by the client. The theoretical evidence was based on agency theory and
economic information. In both cases, demand for audit services arose mainly from
the existence of information asymmetry. In agency theory, an independent audit
function is to reduce agency costs arising from the self-interested behavior by the
agent. In the information economy, the election of trustworthy auditor is used as a
signal of management honesty (Dopuch and Simunic in Nasser et al., 2006).

9
Two approaches that can be used to explain why company does auditor
switching are the auditor-initiated and client-initiated (Nazri, 2012). Auditor
switching could be done mandatory and voluntarily. Mandatory auditor switching
could be distinguished on the basis of which party is the focus of attention from the
issue. If the change of auditor occurs voluntarily, then the main concern is on the
client side. Conversely, if the change occurs on a mandatory basis, the main concern
shifted to the auditor.
II.1.3 Government Rule (Auditor Switching)
In order to maintain independency of auditor, the government of Indonesia has
set the rule of mandatory auditor switching which is stated on Minister of Finance
act. Based on Minister of Finance act no. 359/KMK.06/2003 article 2 concerning to
Public Accountant Services (as the amendment of act no. 423/KMK.06/2002 article
6 paragraph 4), it mentioned:
“Pemberian jasa audit umum atas laporan keuangan dari suatu entitas dapat
dilakukan oleh KAP paling lama untuk 5 (lima) tahun buku berturut-turut dan oleh
seorang Akuntan Publik paling lama untuk 3 (tiga) tahun buku berturut-turut.”
(The execution of general audit service on financial statement from one entity can
be done by public accountant firm for the longest 5 (five) year book respectively
and by a public accountant for the longest 3 (three) year book respectively.)
In 2003, the 2002’s act has been amendment. The act about auditor switching
and public accountant firm switching which is stated that general audit on financial
statement still can be done by public accountant firm for maximum has reach 5
(five) year book or 3 (three) year book respectively was until 2003. In 2008,
Minister of Finance reissued the act concerning public accountant service. These are
the changes that have been done:
10
1. The execution of general audit on financial statement from an entity can be
done by public accountant firm for the longest 6 (six) year book
respectively, and by public accountant for the longest 3 (three) year book
respectively (Article 3 paragraph 1).
2. Public accountant and public accountant firm can reinstate the assignation
after 1 (one) year book not giving the service to the same client (Article 3
paragraph 2 and 3).
This act is summarized in Indonesia Minister of Finance’s act no
17/PMK.01/2008 about “Jasa Akuntan Publik” (Public Accountant Service) is a
base used in the research because the period that is used was 2008 – 2012.
II.1.4 Bank
Based on Undang-Undang Republik Indonesia no. 10 year 1998, Bank is an
enterprise that collects public funds in form of saving and channeling them to the
public in form of credit and or another forms due to the elevation of standard living
of people. Like in most cases, banking companies are also issuing financial
statement. In PSAK 31 issued by IAI (Ikatan Akuntan Indonesia), the content of
bank financial statements are:
1. Statement of Financial Position (Balance Sheet)
It contains list of assets, liabilities, and equity of the bank provided with the
amount of each explanation.
2. Statement of Income (Income Statement)
It serves in detail the income and expenses information and the source of
them: operational or non-operational sources.

11
3. Cash Flow statement
It defines the flow of banking companies’ cash following those categorized:
operating, investing, and financing.
4. Statement of Changes in Equity
It presents the increasing and decreasing of bank equity in certain period
completed with the amount.
5. Notes to Financial Statement
This part is the elaboration of all those statements and it defines all
information needed to be disclosed within certain period of financial
statement.
Those explanations served the need of information that is required to be
provided in this research: auditor opinion, organization structure, name of CEO,
name of Public Accountant firm, and company’s financial information.
II.1.5 Auditor Opinion
Based on William C. Boynton in Modern Auditing 8th Edition (Assurance
Services & The Integrity of Financial Reporting), there are four types of audit
opinions:
1. Unqualified
Often called a clean opinion, an unqualified opinion is an audit report that is
issued when an auditor determines that each of the financial records is free
of any misrepresentations. In addition, an unqualified opinion indicates that
the financial records have been maintained in accordance with the standards
known as Generally Accepted Accounting Principles (GAAP). This is the
best type of report a business can receive.

12
2. Unqualified with explanatory paragraph
This kind of opinion will be issued while there is a lack of consistent
application of GAAP and substantial doubt about going concern. Moreover,
auditor agreement concerning to the departure from a promulgated
accounting principle also recognized as the cause of this opinion issuance.
3. Qualified
In situations when a company’s financial records have not been maintained
in accordance with GAAP but no misrepresentations are identified, an
auditor will issue a qualified opinion. The writing of a qualified opinion is
extremely similar to that of an unqualified opinion. A qualified opinion,
however, will include an additional paragraph that highlights the reason why
the audit report is not unqualified.
4. Disclaimer
On some occasions, an auditor is unable to complete an accurate audit report
since there is a scope limitations in data provided. This may occur for a
variety of reasons, such as an absence of appropriate financial records. When
this happens, the auditor issues a disclaimer of opinion, stating that an
opinion of the firm’s financial status could not be determined.
5. Adverse
The worst type of financial report that can be issued to a business is an
adverse opinion. This indicates that the firm’s financial records do not
conform to GAAP. In addition, the financial records provided by the
company have been grossly misrepresented. Although this may occur by
error, it is often an indication of fraud. When this type of report is issued, a
company must correct its financial statement and have it re-audited, as
investors, lenders, and other requesting parties will generally not accept it.

13
A significant issue in relation to auditor change is the qualification of the audit
opinion, especially where one of management’s goals in an audit is to receive an
unqualified audit opinion from the auditors (Hendrickson and Espahbodi, 1991).
Managers might seek a new auditor when they perceive that their reputation is being
tarnished. The receipt of an audit opinion other than unqualified is widely
recognized as being one of the factors that might damage a manager’s reputation
(William, 1988).
While a company receives opinions other than unqualified, it also perceived to
have a negative effect on companies’ share price (Chow and Rice, 1982), and can
affect a company’s ability to source new financing (Schwartz and Menon, 1985).
Concerning to that argument, in this research the researcher will divide the opinion
classification into two parts: Unqualified and other than unqualified.
II.1.6 Management Changes
Changes in management are perceived to have a significant impact on auditor
change. Mostly, new management may be dissatisfied with the quality (and cost) of
the previous auditor and demand auditor change. In addition, new management
tends to look for new auditors who agree with new reporting methods which show
more favorable financial results. As a result, new management may change to a new
auditor with whom they had some previous association (Nazri et al., 2012). Agency
theory views the relationship between auditor and client to be a nexus of contracts
and a change in the principal-agent contract, as a result of the appointment of a new
manager (agent), may precipitate a change in auditor (Williams, 1988). An
incumbent auditor may be dismissed as he or she is viewed as being closely
associated with the former management. The new management could also request

14
an auditor change because they would like to bring in an auditor with whom they
are familiar.
Based on previous studies, changes in management consist of changes in the
management team such as the change of the chairman of board of directors,
financial controller, managing director and the chairman of audit committee. Based
on the previous research of Beattie and Fearnley (1998), they provide further
evidence in relation to management change with a report that indicates 35 percent of
auditor change companies cited top management changes as a reason for the change.
II.1.7 Financial Distress
Financial distress refers to a period when a borrower (either individual or
institutional) is unable to meet a payment obligation to lenders and other creditors.
This distress may be due to borrower specific factors like reputation, leverage,
volatility of earnings, collateral or may be due to market specific factors like the
economic condition and level of interest rates (Zaki et al., 2011). In a simple way,
financial distress is the condition while a company faces financial difficulties.
Financial distress significantly influences the decision of auditor switching
(Schwartz dan Menon, 1985). While companies do not meet ability to finance their
businesses, their going concern is value is threatened. Schwartz and Soo (1995) in
Kadek (2010) stated that a liquidated company tends to do change public accountant
firm frequently rather than a favorable company.
II.1.8 Hypothesis
II.1.8.1 The influence of Auditor Opinion on Auditor Switching
Prior research on the relationship between audit reports and auditor
change has focused on the effect of the auditors’ reports on the decision to

15
switch auditors. Roberts et al. (1990), Chow and Rice (1982) and Johnson
and Lys (1990) report that unfavorable audit reports may increase the
likelihood of an auditor change. Chow and Rice’s (1982) finding, however,
indicates that firms that change auditor after receiving a qualified opinion do
not tend to move to auditors that issue relatively fewer qualified opinions.
A Singapore study conducted by Woo and Koh (2001) found
unfavorable opinions may actually trigger auditor change which could be
traced to causes where the qualification arose due to some matter of
fundamental importance. A study conducted by Krishnan et al. (1996) also
found evidence that audit opinion influences auditor change. This study
therefore posits the following relationship between opinion other than
unqualified and auditor change:
H1: If the changes of auditor opinion influences auditor switching,
auditor opinion is positively affecting auditor switching.
II.1.8.2 The influence of Public Accountant Firm size on Auditor Switching
After the demise of Arthur Andersen, however, many former Andersen
clients that were more visible in the capital markets switched auditors sooner
mostly to Big 4 firms and experienced a more positive market reaction as a
result (Brazel and Bradford, 2011). Attestation by credible auditors may
serve the honesty signal of management since they entrust their reputation
while Non Big 4 public accountant firms are mostly not (Nasser and Wahid,
2006). Moreover, Big 4 public accountant firm is known as a reliable team
to entrust their reputation in public. In consequence of that, they have
smaller intention to execute indiscriminate audit service. In the light of the
discussion, the following hypothesis is suggested:

16
H2: If most of Big 4 clients do not move Non Big 4, public accountant
firm size is negatively influencing auditor switching.
II.1.8.3 The influence of Management Changes on Auditor Switching
As a result of change in management, new management could demand
the replacement of the incumbent auditor with a new one with whom it has
had favorable dealings in the past (Hudaib and Cooke, 2005;Williams,
1988). Empirically, Woo and Koh (2001) did not find an association
between management change and higher quality auditor selection while
Schwartz and Menon (1985) found evidence that a change in managing
director leads to switching because new management attempts to
disassociate itself from previous relationships and prefers to deal with
familiar parties. Beattie and Fearnley (1998) provide further evidence in
relation to management change. They report that 35 percent of auditor
change companies cited top management changes as a reason for the change.
In addition, Hudaib and Cooke (2005) found evidence of a positive
association between management change and the propensity to change
auditor. In Singapore, Woo and Koh (2001) indicate that management
changes are one of the main reasons for a company to change auditor. Woo
and Koh (2001) also found that director change is associated with a higher
probability of auditor change while Chow and Rice (1982), Schwartz and
Menon (1985), and Williams (1988) reported any such association.
The signaling hypothesis argues that the choice of auditor is a means by
which managers may impart to the market additional information about the
company, as well as their own behavior. This suggests that a new manager
may signal to stakeholders that companies’ management is being well

17
monitored by choosing a higher quality auditor as a replacement. However,
there is also the possibility that the new manager may bring in a lower
quality auditor, with whom he is more familiar. Given that this action might
trigger stakeholders to question the auditor’s quality and consequently the
manager’s motive, the new manager may be reluctant to choose this option.
In the light of the discussion, the following hypothesis is suggested:
H3: If management changes affect auditor switching, management
changes (CEO) is positively associated with auditor change.
II.1.8.4 The influence of Financial Distress on Auditor Switching
Schwartz and Menon, 1985 and Hudaib and Cooke, 2005 stated in their
research that a company which faces high level of financial distress tends to
change their public accountant firm compared to another healthful
companies. Auditor switching is also possible to be done while a company
does not meet ability to settle fee audit since they experience decreasing in
financial abilities. In consequence of that, company will attempt to change
their public accountant firm.
Concerning to the discussion above, the researcher concludes:
H4: Financial distress is significantly affecting auditor switching

18
Table 2.1.8.4 Research Model
Independent Variables Dependent Variables
Auditor Opinion
Public
Accountant Firm
size
Management
Changes
Financial Distress
Auditor
Switching

19
CHAPTER III
RESEARCH METHOD
III.1 Population and Sampling
Secondary data in this research is provided by Indonesia Stock Exchange website
(www.idx.co.id) and other related sources. Type of secondary data which is accessed by
the researcher is audited financial statement of banking companies listed in Indonesia
Stock Exchange. There are 28 banking companies with 7 period of year (2008-2014)
chosen as the sample of this research. The data is processed by using the Statistical
Package for Social Science (SPSS) 16.0 for Windows.
III.2 Population and Sampling Design
Population is a generalization area consisting of the object or subject that has
certain qualities and characteristics which determined by the investigators to be
studied as a tool of conclusion drawing. The population of this research is banking
companies listed in Indonesia Stock Exchange for the period 2008 – 2014. Sample
is part of the number and characteristic possessed by the population. Sampling
technique of this research is purposive sampling method (judgment sampling). This
sampling method aims are based on particular considerations by selecting the
sample that is conform to certain criteria set by the researcher. The required criteria
used for this research are as follows:
1. Banking companies that are respectively listed in Indonesia Stock Exchange
(IDX) during 2008 – 2014.
2. Banking companies that provide complete and sufficient data of the
information of the execution of auditor switching during the research period
2008 - 2014.
20
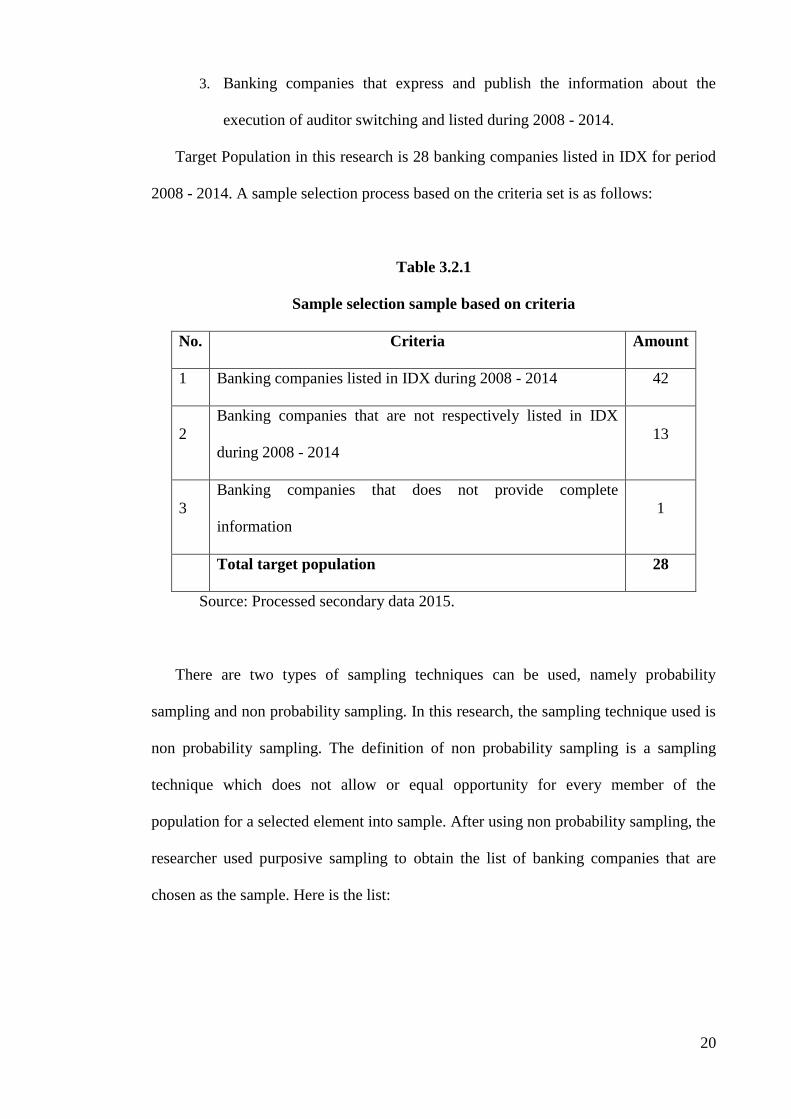
3. Banking companies that express and publish the information about the
execution of auditor switching and listed during 2008 - 2014.
Target Population in this research is 28 banking companies listed in IDX for period
2008 - 2014. A sample selection process based on the criteria set is as follows:
Table 3.2.1
Sample selection sample based on criteria
No. Criteria Amount
1 Banking companies listed in IDX during 2008 - 2014 42
2
Banking companies that are not respectively listed in IDX
during 2008 - 2014
13
3
Banking companies that does not provide complete
information
1
Total target population 28
Source: Processed secondary data 2015.
There are two types of sampling techniques can be used, namely probability
sampling and non probability sampling. In this research, the sampling technique used is
non probability sampling. The definition of non probability sampling is a sampling
technique which does not allow or equal opportunity for every member of the
population for a selected element into sample. After using non probability sampling, the
researcher used purposive sampling to obtain the list of banking companies that are
chosen as the sample. Here is the list:

21
Table 3.2.2
List of Sample
No. Bank Name Code
1 PT Bank ICB Bumiputera Tbk (formerly PT Bank Bumiputera Indonesia
Tbk) BABP
2 PT Bank Danamon Indonesia Tbk BDMN
3 PT Bank Century Tbk (formerly PT Bank CIC Internasional Tbk) BCIC
4 PT Bank Eksekutif Internasional Tbk BEKS
5 PT Bank Internasioanal Indonesia Tbk BNII
6 PT Bank Artha Graha International Tbk (formerly PT Bank Inter-Pacific
Tbk) INPC
7 PT Bank Kesawan Tbk BKSW
8 PT Bank Mandiri (Persero) Tbk BMRI
9 PT Bank Mayapada Internasional Tbk MAYA
10 PT Bank Mega Tbk MEGA
11 PT Bank Negara Indonesia (Persero) Tbk BBNI
12 PT Bank Nusantara Parahyangan Tbk BBNP
13 PT Bank Swadesi Tbk BSWD
14 PT Bank Victoria Internasional Tbk BVIC
15 PT Bank Agroniaga Tbk AGRO
16 PT Bank Ekonomi Raharja Tbk BAEK
17 PT Bank Central Asia Tbk BBCA
18 PT Bank Jabar Banten BJBR
19 PT Bank Bumi Arta Tbk BNBA
20 PT Bank Tabungan Pensiunan Nasional BTPN
21 PT Bank Windu Kentjana International Tbk (formerly PT Bank Multicor
Tbk) MCOR
22 PT Bank Himpunan Saudara 1906 Tbk SDRA
23 PT Bank Bukopin BBKP
24 PT Bank Rakyat Indonesia BBRI
25 PT Bank Niaga BNGA
26 PT Bank OCBC NISP Tbk (formerly PT Bank NISP Tbk) NISP
27 PT Bank Pan Indonesia Tbk PNBN
28 PT Bank Permata BNLI
III.3 Research Variable and Operational Definitions Variable
III.3.1 Dependent Variable
In this research, the dependent variable that will be used is auditor
switching. Auditor switching is the replacement of auditor or public accountant
firm done by the client due to several specified reasons, whether it is caused by

22
the client or the auditor. In this research, the research is trying to understand the
dependent variable, explain its variability, and predict it. Furthermore, the
auditor switching that will become the object of research is voluntary auditor
switching.
Dependent variable in this research is dummy since the score will be 1 or
0. The 1 here means this company is doing auditor switching voluntarily and the
0 means the opposite.
III.3.2 Independent Variables
Independent variable is a free variable. This variable affects the
movement of dependent variable which is auditor switching. In this research, the
writer uses auditor opinion, public accountant firm size, management changes,
and financial distress as the independent variables.
1. Auditor’s Opinion
This variable uses dummy variable. If the client receives the opinion
except Unqualified, the score will be 1. If it received Unqualified, the score
will be 0. There are 5 opinions that should be given by the auditor.
2. Public Accountant Firm size
This variable uses dummy variable. If the company tested is audited by
Big 4 audit firms, it will be scored 1. If it is audited by non Big 4, it will be
scored 0 (Nasser and Wahid, 2006).
Here is the list of Big 4 public accountant firm (based on alphabets):
1. Deloitte Touche Tohmatsu
It is affiliated with Hans Tuanakotta Mustofa & Halim; Osman Ramli
Satrio & Partners; Osman Bing Satrio and Partners.

23
2. Ernest & Young (EY)
It is affiliated with Prasetio, Sarwoko, & Sandjaja; Purwantono, Sarwoko
& Sandjaja.
3. Klynveld Peat Marwick Goerdeler (KPMG)
In Indonesia, this public accountant firm is affiliated with Siddharta and
Widjaja.
4. Pricewaterhouse Coopers (PwC)
This public accountant firm in Indonesia is affiliated with Tanudiredja,
Rintis, Wibisana, and Partners.
3. Management Changes
In this research, company will be valued doing management changes
when the CEO is changed. This variable is dummy variable. If the CEO is
changed it will be scored 1 and if it is not it will be scored 0.
4. Financial Distress
Financial distress refers to a period when a borrower (either individual or
institutional) is unable to meet a payment obligation to lenders and other
creditors. This distress may be due to borrower specific factors like
reputation, leverage, volatility of earnings, collateral or may be due to
market specific factors like the economic condition and level of interest
rates. In the previous research, Zaki et al. (2012) assessed probabilities of
financial distress of banks in UAE by using time-discrete hazard model with
Logit and Probit. In this research, the analytical method that will be used is
Z-Score Altman. This model for go public banking companies has been
determined by this model:

24
𝒁𝑺𝒄𝒐𝒓𝒆 = 𝟏,𝟐𝑿𝟏 + 𝟏,𝟒𝑿𝟐 + 𝟑,𝟑𝑿𝟑 + 𝟎,𝟔𝑿𝟒 + 𝟏,𝟎𝑿𝟓
Explanation:
Z = Index overall
X1 = Working Capital to Total Assets
X2 = Retained Earning to Total Assets
X3 = EBIT (Earning Before Interest Taxes) to Total Assets
X4 = Market Value of Equity to Book Value of Total Liabilities
X5 = Sales to Total Assets
Z-Score value will explain the condition of banking companies divided
into several levels:
1. Z-Score > 2,99 is categorized as healthful companies. There is no
financial difficulties occurred.
2. 1,81 < Z-Score < 2,99 is categorized as grey area which can be
considered experiencing financial difficulties but the probability of
safe or insolvent are depend on the decision of companies
management as the decision maker.
3. Z-Score < 1,81 is categorized as black are where company is
experiencing financial difficulties and has high risk to go into
liquidation.
Financial distress in this research can be seen by evaluating Z-Score Altman
value.
III.4 Research Instrument
In quantitative research, data testing to prove or disprove the hypothesis is
conducted by using the statistical tool called SPSS. SPSS stands for Statistical Product

25
and Service Solutions or nowadays being known as PASW or Predictive Analytics
Software. SPSS is an application program that has a high statistical analysis capabilities
as well as the data management system in a graphical environment using descriptive
menus and dialog boxes. It is therefore suitable to process all the data by using
computer software called SPSS (Statistical Package for the Social Sciences) version
16.0 for Windows.
III.5 Data Collection Procedures
Data collection being used in this research is through documentation method and
literature review. Documentation method is done through studying archives and
journals which relevant with the research conducted. The secondary data is a source of a
research which is obtained from the existing resources. The data already exist and do
not have to be collected individually by the researcher. This research use the financial
data that obtained from the published financial reports of company listed in Indonesia
Stock Exchange (IDX). The financial data that being used in this research are the
financial statements of companies listed in Indonesia Stock Exchange (IDX) from 2008
until 2014. The data are being downloaded by accessing the website of IDX itself. The
website we can find in internet the key word is Indonesia Stock Exchange
(www.idx.co.id). Later this data will be categorized based on the criteria of the samples
needed.
III.6 Data Analysis
In this research, the writer would like to use quantitative analysis. It quantifies
and transfers information become measurable and readable. Analysis tool that will be
performed in this research is logistic regression since dependent variable is naturally
dichotomy (execute auditor switching and do not execute auditor switching). The

26
execution of regression method does not need normality assumption for independent
variables. Multivariate normal distribution is unable to be performed since independent
variables are the fusion of matrix and non-matrix variable. Therefore, it is able to be
analyzed by using logistic regression since normality assumption at independent
variables is unnecessary to be performed. The purpose of this method is to get the whole
picture about the relation between the independent variables and dependent variables
for the company performance of a company in knowledge intensive industry category
for a bank in Indonesia Stock Exchange (IDX) from 2008 until 2014. The steps in doing
logistic regression are explained below:
III.6.1 Descriptive Statistic
Descriptive statistic is used to provide and define a description of the
data seen from the average (mean), standard deviation, and maximum-minimum.
The mean used to estimate the average size of population estimated from the
sample. The standard deviation is used to assess the average dispersion of the
sample. The maximum-minimum is used to view the minimum value and
maximum of the population. It needs to be done to see the entire picture of the
samples collected and qualified as research sample. This will be applied on all
independent variables:
In this research, the auditor opinion will be categorized into two types:
Unqualified and other than unqualified (qualified, disclaimer, and adverse). Here
is the table:

27
Table 3.6.1.1
Auditor Switching observed from Auditor Opinion
Variable Change PAF Does not
change PAF Total
4-4 4-N N-4 N-N ∑
Opinion
UQ
Other
than UQ
TOTAL
For this part, the size of public accountant firm (PAF) is divided into two
categories: Big 4 and Non Big 4. Here is the table:
Table 3.6.1.2
Auditor Switching observed from PAF size
Variable Change PAF Does not change
PAF Total
4-4 4-N N-4 N-N ∑
PAF size (latest
used)
Big 4
Non Big
4
TOTAL
The management changes that will be observed in this research is whether the
company change the CEO. The consideration will be parted into two which are yes and
no. Here is the table:
Table 3.6.1.3
Auditor Switching observed from Management Changes
Variable Change PAF Does not change
PAF Total
4-4 4-N N-4 N-N ∑
Management
Changes
Yes
No
TOTAL

28
Descriptive from financial distress variable can be measured with Z-Score
Altman which is divided into three categories: safe from liquidation, grey area which is
company who stands on the verge of liquidation, and black area which is company who
was experiencing financial difficulties and would experience liquidation.
Table 3.6.1.4
Auditor Switching observed from Financial Distress
Variable
Change PAF Does
not
change
PAF
Total 4-4 4-N N-4 N-N ∑
Financial Distress
Safe
Gray Area
FD
TOTAL
III.6.2 Inferential Statistic Analysis
Inferential statistic analysis that is used to test the hypothesis in this
research is multivariate with logistic regression. Logistic regression measures
the power of relationship between independent and dependent variables. The
dependent variable is assumed random which means has probabilistic
distribution. Logistic regression ignores heteroscedasticity which explains that
dependent variable does not need homoscedasticity for each independent
variable. The purpose of normality and heteroscedasticity test is to ensure that
analysis regression model used in this research is valid.
This test does not need to perform normality and heterdoscedasticity test
since before hypothesis test is executed the first step that has to be done is test
the validity of regression model and valuing fit model. Those methods are the
substitution of classic assumption test.

29
III.6.3 Hypothesis Test
The parameter estimation is using Maximum Likehood Estimation (MLE).
Ho = b1 = b2 = b3 = …= bi = 0
Ho ≠ b1 ≠ b2 ≠ b3 ≠ … ≠ bi ≠ 0
The 0 hypothesis states that independent variable (X) does not have influence on
responded variable (in population). The test over hypothesis is done by using a =
5%. The decision making rules is:
1. If probability score (sig.) < a = 5%, the alternative hypothesis is
supported.
2. If probability score (sig.) > a = 5%, the alternative hypothesis is not
supported.
III.6.3.1 Valuing Overall Model Fit
The first step of this model is to valuing overall model fit upon the data
by giving some statistic tests. The hypothesis to value this model fit is:
H0 : Hypothesized model that is fit with the data
HA : Hypothesized model that is unfit with the data
From this hypothesis, it is clear that the model fits the data. The statistics
used in this research is based on the likelihood function. Likelihood L of the
model is the probability that the hypothesized model depicts the input data.
To test null hypothesis and alternative hypothesis, L has to be transformed
into -2LogL. Decreasing of likelihood (-2LL) shows better regression model.
In other words, the hypothesized model fits the data.

30
III.6.3.2 Coefficient of Determination (Nagelkerke R Square)
Cox and Snell's R Square is a measure that seeks to imitate the size of R2
at multiple regression based on likelihood estimation techniques with a
maximum value of less than 1 (one) so it is difficult to interpret.
Nagelkerke's R-square is a modification of the coefficient Cox and Snell to
ensure that its value varies from 0 (zero) to 1 (one). This is done by dividing
the value of Cox and Snell's R2 to the maximum value. Nagelkerke's value
R2 can be interpreted as the value of R2 in the multiple regressions. A small
value means the ability of variables independent in explaining variations in
the dependent variable is very limited. A value which is close to one mean of
independent variables provides almost all the information needed to predict
the variation of the dependent variable.
III.6.3.3 Regression Model Test
The fairness of regression model was valued with Hosmer and
Lemeshow's Goodness of Fit Test. Hosmer and Lemeshow's Goodness of Fit
Test. It is used to test the null hypothesis that the empirical data is fit with
the model (there was no difference between the models with the data so that
the model can be said to be fit). If the value of statistical Hosmer and
Lemeshow's Goodness of Fit Test is equal to or less than 0.05, the null
hypothesis is rejected, which means there are significant differences between
the models with observations that the value of Goodness fit model is not
good because the model cannot predict the value of his observations. If the
statistical value of Hosmer and Lemeshow's Goodness of Fit Test is greater
than 0.05, the null hypothesis cannot be rejected and means that the model is

31
able to predict the value of observation or can be said to be acceptable as a
model fits the data observations.
The appropriateness of this regression model is using Hosemer and
Lemeshow’s Goodness of Fit Test. Hosmer and Lemeshow’s Goodness of
Fit Test attest null hypothesis that empirical data is suitable with the model
(there is no significant differences between model and data, therefore model
can be counted as suitable). If Hosmer and Lemeshow’s statistic value is
equal or less than 0.05, null hypothesis is rejected which also means there is
a significant differences between model and observation value. In result,
Goodness Fit model is categorized as bad since it is not able to predict the
value of observation. If the statistic value is higher than 0.05, null hypothesis
is accepted which means model is able to predict the value of observation or
simply said it can be accepted since it fits observation data.
III.6.3.4 Multicolinearity Test
A good regression model is the one that does not have a strong
phenomenon correlation between their independent variables. This test is
using matrix correlation between independent variables to see how big the
correlation between them. If independent variables are simultaneously
correlated, these variables are orthogonal. The orthogonal variable means
independent variable equal zero.
III.6.3.5 Matrix Classification
Matrix classification shows prediction power of regression model to
predict the possibility of auditor switching done by public accountant firm.

32
III.6.3.6 Logistic Regression Model
The analysis in this research is using the statistical parameters with
logistic regression model. The model of logistic regression in this research
is:
SWITCHt = bo + b1OPINI + b2PAF + b3MG + b4FD + e............
Explanation:
SWITCH : auditor switching
bo : constant
b1-b4 : regression coefficient
OPINI : auditor opinion
PAF : public accountant firm size
MG : management changes
FD : financial distress
e : error

33
CHAPTER IV
DATA ANALYSIS AND EVALUATION
IV.1 Research Object Description
In this research, the data used is secondary data from audited financial
statements of banking companies listed in Indonesia Stock Exchange for period
2008 – 2014. There are 42 bank listed in Indonesia Stock Exchange within
period 2008 – 2014 and 14 bank are excluded from total sample since they do
not match the criteria. In conclusion, there are 28 banking companies left within
7 periods which is from 2008 – 2014 which resulted in 196 data from 28 bank
times 7 periods. The sampling method of this data is purposive sampling which
have criteria for sample determination.
IV.2 Research Variable Description
This part is used to depict the total of sample of banking companies that
executed auditor switching during 2008 – 2014 based on independent variables
of the research: auditor opinion, public accountant firm size, management
changes, and financial distress towards auditor switching from Big 4 to Big 4,
Big 4 to Non Big 4, Non Big 4 to Big 4, and Non Big 4 to Non Big 4.
Consequently, there are 4 independent variables and 1 independent variable that
will be examined here.
IV.3 Descriptive Statistic
There are two types of descriptive statistic valuation used in this
research: Frequencies and Descriptives. Frequencies is used for dummy data
valuation and Descriptives is used for financial ratios valuation. Therefore, the

34
descriptive statistic data below is presented as the result of financial distress
variable only.
Table 4.3.1 Data Descriptive Variable
Audit Switching
Frequency Percent Valid Percent
Cumulative
Percent
Valid Non Audit Switching 148 75.5 75.5 75.5
Audit Switching 48 24.5 24.5 100.0
Total 196 100.0 100.0
This result gives an explanation that based on the analysis result of auditor
switching, most respondents did not execute auditor switching. There are 48 data of
banking companies or 24.5% from the total sample perform which performed auditor
switching and 148 data of banking companies or 75.5% of the total sample which did
not.
Table 4.3.2 Data Descriptive Variable
Auditor's Opinion
Frequency Percent Valid Percent
Cumulative
Percent
Valid Unqualified 189 96.4 96.4 96.4
Qualified 7 3.6 3.6 100.0
Total 196 100.0 100.0

35
Based on descriptive analysis result above, most of banking companies
presented as the sample obtained unqualified opinion. It reaches 189 data of banking
companies or 96.4% from the total sample while the one that obtained qualified opinion
(other than unqualified) are 7 data of banking companies or 3.6% which is only one
bank.
Table 4.3.3 Data Descriptive Variable
Public Accountant Firm Size
Frequency Percent Valid Percent
Cumulative
Percent
Valid Non Big Four 59 30.1 30.1 30.1
Big four 137 69.9 69.9 100.0
Total 196 100.0 100.0
The majority of banking companies in this research used Big 4 public
accountant firm. There are 137 data of banking companies or 69.9% from the total
sample that used the service of Big 4. On contrary, the Non Big 4 customers are 59 data
of banking companies or 30.1% in type of percentage.
Table 4.3.4 Data Descriptive Variable
Management Changes
Frequency Percent Valid Percent
Cumulative
Percent
Valid CEO not changes 137 69.9 69.9 69.9
CEO changes 59 30.1 30.1 100.0
Total 196 100.0 100.0

36
From 196 data of companies chosen as the sample of research, it is discovered
that 59 data of banking companies performed management changes while 137 of them
did not. In conclusion, most of banking companies that respectively listed in Indonesia
Stock Exchange during 2008 – 2014 research periods did not performing management
changes. In percentage, 30.1% of them did change their management and 69.9% of
them did not do so.
Table 4.3.5 Data Descriptive Variable
Financial Distress
Descriptive Statistics
N Minimum Maximum Mean Std. Deviation
Audit Switching 196 .00 1.00 .2449 .43113
Zscore 196 -.74 38.10 1.4049 4.55326
Valid N (listwise) 196
Based on the result presented above, the table shows that financial distress
variable has -0.74 for minimum value and 38.10 for maximum value. The average point
of this variable is 1.4049 and 4.55326 is shown as standard deviation.
IV.4 Preliminary Logistic Regression Test (Multicolinearity)
Multicolinearity is shown as a cause-and-effect relationship between two
or more independent variables within one analysis model. In this research,
multicolinearity test is performed toward 4 independent variables: auditor’s
opinion, public accountant firm size, management changes, and financial
distress towards auditor switching. To discover the existence of multicolinearity,
the researcher uses Variance Inflation Factor (VIF). The VIF values which
37
greater than 10 indicate multicolinearity symptoms while the smaller one
counted from 10 indicates the absence of multicolinearity symptoms. The results
of testing multicolinearity testing can be seen in the following table:
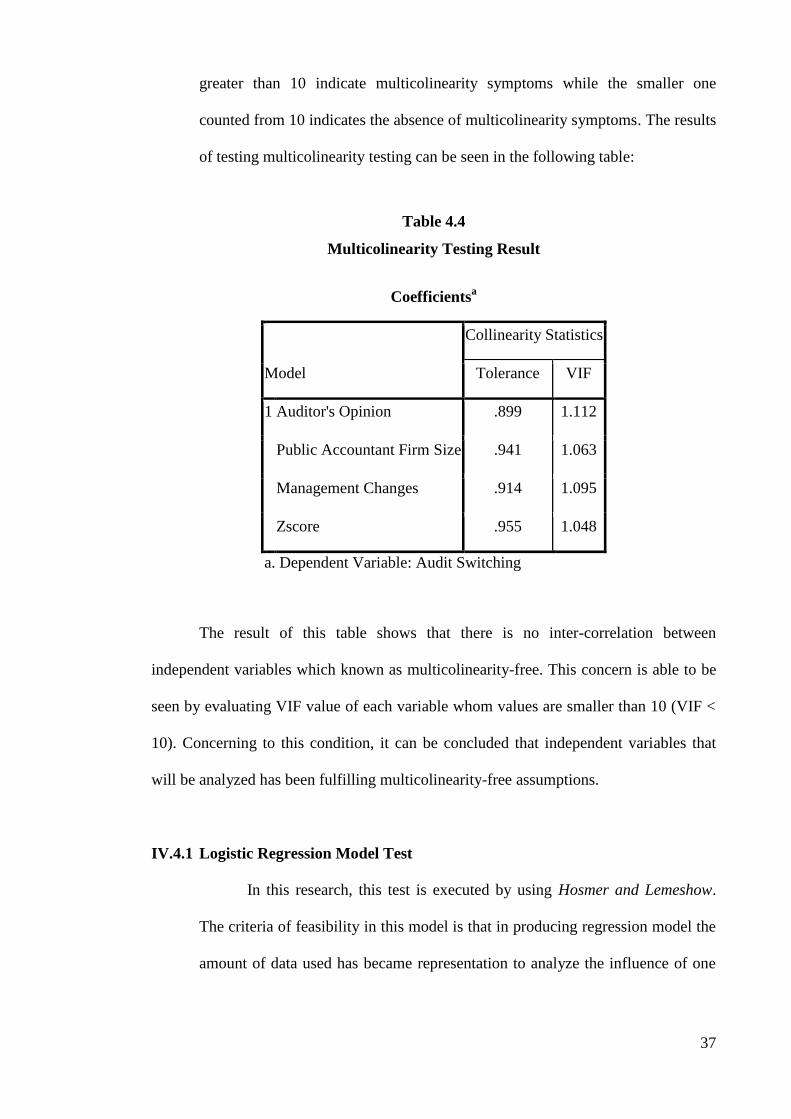
Table 4.4
Multicolinearity Testing Result
Coefficientsa
Model
Collinearity Statistics
Tolerance VIF
1 Auditor's Opinion .899 1.112
Public Accountant Firm Size .941 1.063
Management Changes .914 1.095
Zscore .955 1.048
a. Dependent Variable: Audit Switching
The result of this table shows that there is no inter-correlation between
independent variables which known as multicolinearity-free. This concern is able to be
seen by evaluating VIF value of each variable whom values are smaller than 10 (VIF <
10). Concerning to this condition, it can be concluded that independent variables that
will be analyzed has been fulfilling multicolinearity-free assumptions.
IV.4.1 Logistic Regression Model Test
In this research, this test is executed by using Hosmer and Lemeshow.
The criteria of feasibility in this model is that in producing regression model the
amount of data used has became representation to analyze the influence of one
38
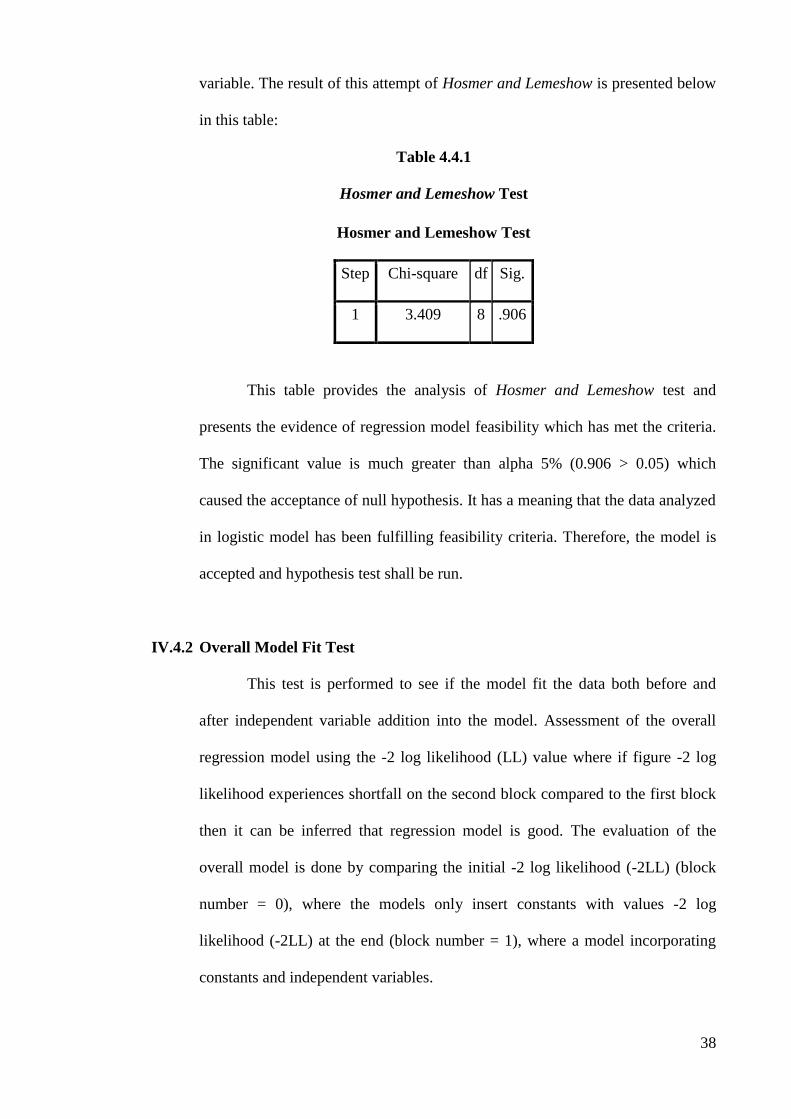
variable. The result of this attempt of Hosmer and Lemeshow is presented below
in this table:
Table 4.4.1
Hosmer and Lemeshow Test
Hosmer and Lemeshow Test
Step Chi-square df Sig.
1 3.409 8 .906
This table provides the analysis of Hosmer and Lemeshow test and
presents the evidence of regression model feasibility which has met the criteria.
The significant value is much greater than alpha 5% (0.906 > 0.05) which
caused the acceptance of null hypothesis. It has a meaning that the data analyzed
in logistic model has been fulfilling feasibility criteria. Therefore, the model is
accepted and hypothesis test shall be run.
IV.4.2 Overall Model Fit Test
This test is performed to see if the model fit the data both before and
after independent variable addition into the model. Assessment of the overall
regression model using the -2 log likelihood (LL) value where if figure -2 log
likelihood experiences shortfall on the second block compared to the first block
then it can be inferred that regression model is good. The evaluation of the
overall model is done by comparing the initial -2 log likelihood (-2LL) (block
number = 0), where the models only insert constants with values -2 log
likelihood (-2LL) at the end (block number = 1), where a model incorporating
constants and independent variables.
39
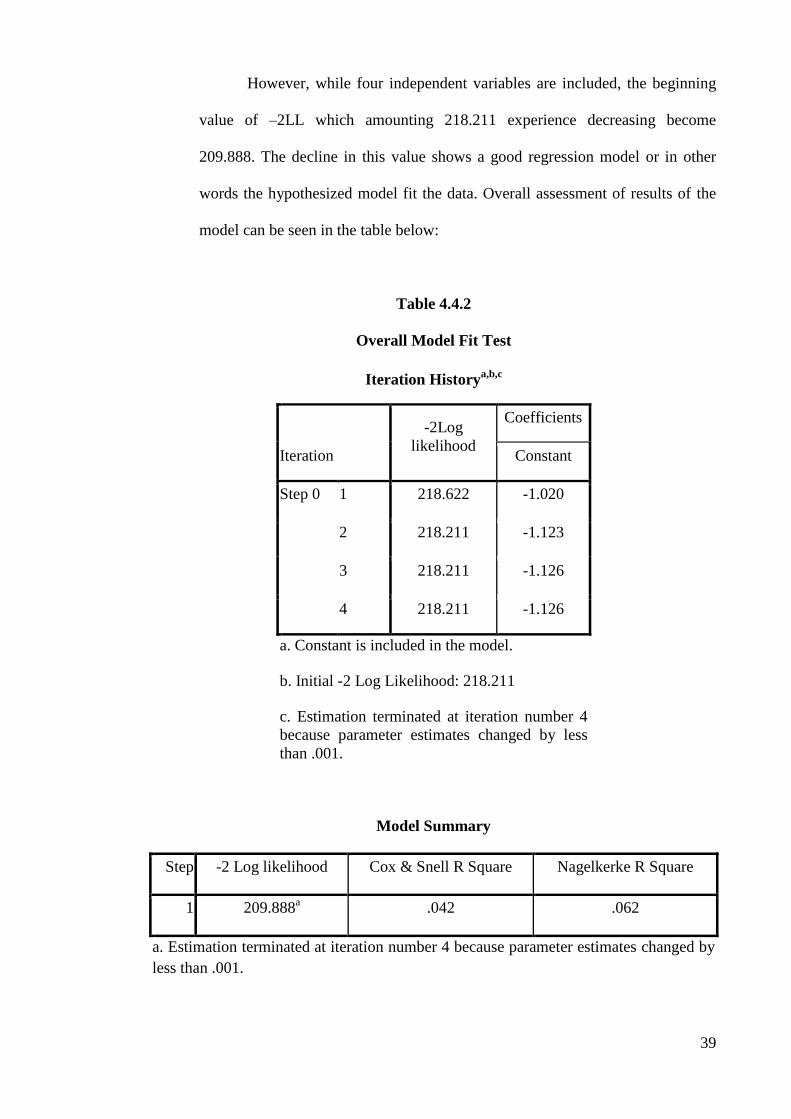
However, while four independent variables are included, the beginning
value of –2LL which amounting 218.211 experience decreasing become
209.888. The decline in this value shows a good regression model or in other
words the hypothesized model fit the data. Overall assessment of results of the
model can be seen in the table below:
Table 4.4.2
Overall Model Fit Test
Iteration Historya,b,c
Iteration
-2Log
likelihood
Coefficients
Constant
Step 0 1 218.622 -1.020
2 218.211 -1.123
3 218.211 -1.126
4 218.211 -1.126
a. Constant is included in the model.
b. Initial -2 Log Likelihood: 218.211
c. Estimation terminated at iteration number 4
because parameter estimates changed by less
than .001.
Model Summary
Step -2 Log likelihood Cox & Snell R Square Nagelkerke R Square
1 209.888a .042 .062
a. Estimation terminated at iteration number 4 because parameter estimates changed by
less than .001.

40
IV.4.3 Hypothesis Test
(Coefficient of Determination Nagelkerke R Square)
This paragraph describes the research data outcome to attest every
hypothesis of research that has been made. By performing Nagelkerke R Square,
the ability to look over the magnitude of all independent variables in affecting
and describing the diversity of dependent variable timeliness of reporting can be
observed. It can be seen by evaluating the value of Nagelkerke R Square
logistics analysis results. Hereby presented Nagelkerke R Square value in the
logistic regression models formed:
Table 4.4.3
Nagelkerke R Square value on Logistic Regression Analysis
Model Summary
Step -2 Log likelihood Cox & Snell R Square Nagelkerke R Square
1 209.888a .042 .062
a. Estimation terminated at iteration number 4 because parameter estimates changed by
less than .001.
Based on the result presented above, the value of logistic regression
model Nagelkerke R Square made is 0.062. The amount of 6.2% of Nagelkerke
R Square indicates that only 6.2% of auditor opinion, public accountant firm
size, management changes, and financial distress which describes auditor
switching out of 100%. However, the residual percentage of value which is
93.8% shows that there are another variables that also has significant influence
towards auditor switching.
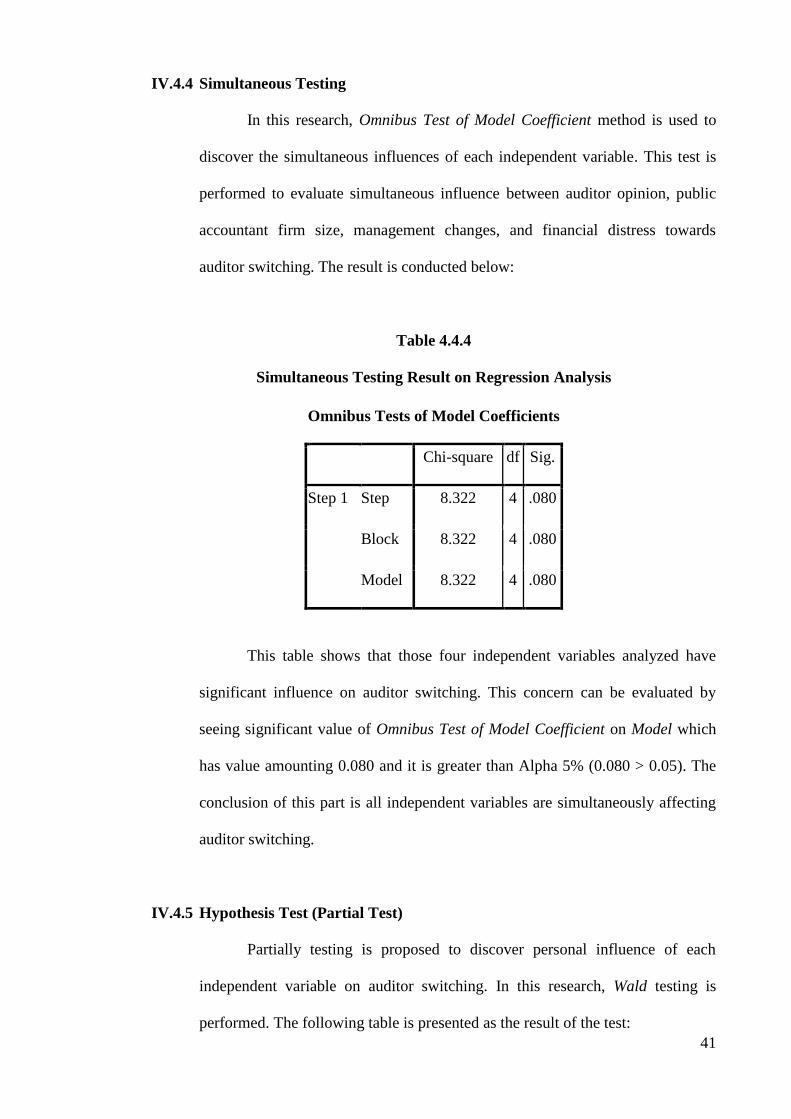
41
IV.4.4 Simultaneous Testing
In this research, Omnibus Test of Model Coefficient method is used to
discover the simultaneous influences of each independent variable. This test is
performed to evaluate simultaneous influence between auditor opinion, public
accountant firm size, management changes, and financial distress towards
auditor switching. The result is conducted below:
Table 4.4.4
Simultaneous Testing Result on Regression Analysis
Omnibus Tests of Model Coefficients
Chi-square df Sig.
Step 1 Step 8.322 4 .080
Block 8.322 4 .080
Model 8.322 4 .080
This table shows that those four independent variables analyzed have
significant influence on auditor switching. This concern can be evaluated by
seeing significant value of Omnibus Test of Model Coefficient on Model which
has value amounting 0.080 and it is greater than Alpha 5% (0.080 > 0.05). The
conclusion of this part is all independent variables are simultaneously affecting
auditor switching.
IV.4.5 Hypothesis Test (Partial Test)
Partially testing is proposed to discover personal influence of each
independent variable on auditor switching. In this research, Wald testing is
performed. The following table is presented as the result of the test:

42
Table 4.4.5
Partially Testing on Logistic Regression Analysis
Variables in the Equation
B S.E. Wald df Sig. Exp(B)
Step
1a
oa .430 .908 .224 1 .636 1.537
kap -1.014 .357 8.042 1 .005 .363
mc .179 .381 .221 1 .639 1.196
zscore -.028 .039 .503 1 .478 .973
Constant -.500 .306 2.674 1 .102 .606
a. Variable(s) entered on step 1: oa, kap, mc, zscore.
Hypothesis 1 (Auditor Opinion)
H1: If the changes of auditor opinion influences auditor switching, auditor opinion
is positively affecting auditor switching.
Based on the analysis table result presented above, the value of significant is
0.636 or 63.6%. Compare to the alpha 5%, significant value of auditor opinion is greater
than alpha (0.636 > 0.05). This concern indicates, statistically, the first hypothesis of
this research is unsupported.
The result of this research runs consistent with Huson et al. (2000) and Takiah
and Ghazali (1993). They found no significant relationship between qualified reports
and auditor change. Takiah and Ghazali examined the relationship between auditor
opinion and auditor switching yet they failed to find a significant association between
two variables since their findings may be attributable to a short study period and a small
sample size. Huson et al. made a research on the economic rationale and include auditor
opinion as his independent variable for auditor switching by Malaysian listed firms and
found no significant association between both of them.
43
However, the default of this research is suspected occur since most respondents
obtained unqualified opinion. Besides, there is a serious constraint matter while the
management intends to execute auditor switching due to discrepancy issue of auditor if
the company uses Big 4 firms. Moreover, the execution of auditor switching has
concern to the possibility of inability to obtain unqualified opinion due to better audit
quality consideration.
Hypothesis 2 (Public Accountant Firm Size)
H2: If most of Big 4 clients do not move Non Big 4, public accountant firm size is
negatively influencing auditor switching.
The result presented in table above shows 0.005 significant value of public
accountant firm size. This value is smaller than alpha 5% (0.005 > 0.05) which
interpreting that the second hypothesis of public accountant firm size in this research is
supported.
This research does not run consistent with what Bradford and Brazel (2001)
carried out. The result of this research describes public accountant firm with affiliation
proxy The Big 4 does not influence auditor switching since most banking companies
used as the sample employed reputable public accountant firm even while they commit
auditor switching. As well as bank which used Non Big 4 public accountant firms,
while they do auditor switching they still did it in the same class and did not move to
Big 4. They mostly performed auditor switching in the same class of public accountant
firm.
Hypothesis 3 (Management Changes)
H3: If management changes affect auditor switching, management changes (CEO)
is positively associated with auditor change.

44
The significant value of management changes presented in result table above
shows 0.639 or 63.9%. This significant value is higher than alpha 5% (0.693 > 0.05)
which means, statistically, the third hypothesis of management changes is unsupported.
This observation result is in line with Woo and Koh (2001). They did not find an
association between management change and higher quality auditor selection. This
outcome clarifies that if the former public accountant firm does not match management
desires, they will generally have intention to change the auditor which is compatibly in
line with company’s condition and more familiar. However, auditor switching decision
needed to be discussed further in general meeting (Rapat Umum Pemegang Saham) and
need an authorization from CEO and some parties related to the decision making of
auditor switching. However, new management’s proposal is sometimes unfulfilled. This
process, in some conditions, has becoming a specific reason behind the cancelation of
auditor switching. Moreover, the default of this research is probably occurred since the
sample used are mostly did not change their management.
Hypothesis 4 (Financial Distress)
H4: Financial Distress is significantly affecting auditor switching.
By evaluating the result table above the significant value of financial distress is
able to be observed. The significant value of financial distress is 0.478 or 47.8% which
is greater than alpha 5% (0.478 > 0.05). The greater significant value of financial
distress will be resulted in a conclusion that the fourth hypothesis of financial distress in
this research is unsupported.
This statistic result does not come consistent with the research of Schwartz and
Menon (1985). In their research, they conclude that financial distress is the factor of
auditor switching. They stated that a liquidated company tends to do change public
accountant firm frequently rather than a favorable company since their level of

45
capability to settle audit fee of bigger audit firms experiences derivation. The insolvent
clients that experienced bad financial condition have higher possibility of keeping their
predecessor auditor in order to entrust their image among stakeholders. In addition,
most of banking companies used as the sample of this research is experiencing financial
distress.

46
CHAPTER V
CONCLUSIONS AND RECOMMENDATIONS
V.1 Conclusions
In the light of the test result, analysis, and discussion presented in previous chapter,
the conclusion of factors affecting auditor switching in banking companies during audit
period 2008 - 2014 are listed below:
1. Based on simultaneous logistic regression analysis, there is simultaneous
influence from all independent variables: auditor opinion, public accountant firm
size, management changes, and financial distress on auditor switching.
2. Based on hypothesis test or partial logistic regression analysis, public accountant
firm size hypothesis is supported since the significant value is lower than alpha
(0.005 < 0.05). This is suspected occur since the researcher includes 6 banking
companies that executed mandatory auditor switching. However, another 3
independent variables are not supported since their significant values are greater
than alpha. It occurs since there is a certain possibility that banking companies
used as the sample are mostly obtaining unqualified opinion. Moreover, most of
banking companies did not change their CEO during 2008 - 2014 while the rest
did. In addition, most of banking companies used in this research experienced
financial difficulties. From that discussion, it is concluded that the data are not
quite diverse to earn significant result.
3. The first hypothesis indicates that auditor opinion variable does not significantly
influence auditor switching since it has Significant value of 0.915 or 91.5%
which is greater than Alpha 0.05 or 5%. Higher point of Significant value is a
signal of negative support for auditor opinion hypothesis. It occurs since from
the total sample there is only one bank who obtained Qualified opinion. The

47
sample of other than Qualified opinion sample is inadequate. Moreover, the
previous researchers were using manufacturing companies while this research is
using bank. Range of time used for research also different.
4. The second hypothesis indicates that public accountant firm size variable does
not significantly influence auditor switching since it has Significant value of
0.197 or 19.7% which is greater than Alpha 0.05 or 5%. This hypothesis is
proved supported by previous theories and research.
5. The third hypothesis indicates that management changes variable does
significantly influence auditor switching since it has Significant value of 0.920
or 92% which is much greater than Alpha 0.05 or 5%. This high percentage of
management changes indicates insignificant effect of management changes
towards auditor switching since sample and period range used are different with
the previous research used as the hypothesis source.
6. The fourth hypothesis indicates that financial distress does not significantly
influence auditor switching since it has Significant value of 0.797 or 79.7%
which is greater than Alpha 0.05 or 5%. Higher point of Significant value is a
signal of negative support for financial distress hypothesis. In this research, all
banking companies used as the sample of this research is experiencing financial
distress. In addition, predecessor results were using manufacturing companies as
their object while this research uses bank. The computation of banking
companies financial distress compare to manufacturing are quite different.
Those would be some excuses causing this result statistically came across.

48
V.2 Limitation
Below served the limitation of this research:
1. The researcher uses banking companies as research object. Therefore, it is not
proper to be used as an analysis tool for another business scope other than
banking companies.
2. Calculation method used for financial distress enumeration is Altman Z Score
specified for bank.
3. This research serves 7 years for range period: 2008 - 2014. Thus, result for
another period except the stated one(s) will not be seen in this research.
V.3 Recommendations
From the result of this research, below served suggested recommendations that
can be proposed:
1. For another business scope companies
This research is using financial service business scope which is banking
companies. Concerning to that fact, it is unreliable to be generalized and
improper to be used in cross-industry comprehension other than bank and or
financial services companies. Reader could use another research suitable
with business entities they are in.
2. For future researcher
Future researcher may add another independent variable to attest. Moreover,
the futures researcher should put their attention more in calculating financial
distress since bank has different characteristic compare to another business
area. In financial statement of bank, current assets and current liability that
used to compute working capital is computed manually. In addition,

49
financial distress proxy computation in this research is done by performing
Altman Z-Score specified for public banking companies and companies that
experience financial distress. Thus, the next research shall perform another
method and model to execute financial distress enumeration.

REFERENCES
Beattie, V. and Fearnley, S. (1998), “Audit Market Competition: Auditor Changes
and The Market Impact Of Tendering”, British Accounting Review, Vol.
30 No. 30, pp. 261 - 89.
Brazel, J.F, and Bradford, M. (2011). “Shedding New Light on Auditor
Switching”, Strategic Finance, January 2011.
Chow, C.W. and Rice, S.J. (1982). “Qualified Audit Opinions and Auditor
Switching”, The Accounting Review, Vol. 57 No. 2, pp. 326 - 35.
Hanson, Walter E. (1967). “Responsibilities Of Independent Public Accountants”,
The Business Lawyer, Vol. 22, No. 4 (July 1967), pp. 975-984.
Hendrickson, H. and Espahbodi, R. (1991). “Second Opinion, Opinion Shopping
and Independence”, The CPA Journal, Vol. 61 No. 3, pp. 26 - 9.
Hudaib, M. and T.E. Cooke. (2005). “The Impact of Managing Director Changes
and Financial Distress on Audit Qualification and Auditor Switching”,
Journal of Business Finance & Accounting, Vol. 32 No. 9/10, pp. 1703 -
39.
Ghozali, Imam (2009). Aplikasi Analisis Multivariate Dengan Program SPSS. 4th
edition. Semarang: Badan Penerbit UNDIP.
Huson, J., Shamsher, M., Mohd, A. and Annuar, M.N. (2000), “Audit switch
decisions of Malaysian listed firms: test of determinants of wealth effect”,
Capital Market Review, Vol. 8 Nos 1/2, pp. 1-24.
IAI (Ikatan Akuntan Indonesia). 2011. Standar Profesional Akuntan Publik.
Jakarta: Salemba Empat.
Irmawan, Y., Hudaib, M., Haniffa, R. (2013) "Exploring The Perceptions Of
Auditor Independence In Indonesia", Journal of Islamic Accounting and
Business Research, Vol. 4 Iss: 2, pp.173 - 202
Jensen, Michael C., & Meckling, William H. (1976). “Theory of the Firm:
Managerial Behavior, Agency Costs and Ownership Structure”, Journal of
Financial Economics, Vol. 3 No. 4, pp. 305 - 360.
Johnson, W.B. and Lys, T. (1990). “The Market For Audit Services: Evidence
from Voluntary Auditor Changes”, Journal of Accounting and Economics,
Vol. 12, January, pp. 281 - 308.
Kamal, Ibrah Mustafa. (2012). “Analisis Prediksi Kebangkrutan pada Perusahaan
Perbankan Go Publik di Bursa Efek Indonesia (Dengan Menggunakan
Model Altman Z-Score)”.
Krishnan, J., Krishnan, J. and Stephens, R. (1996), “The Simultaneous Relation
Between Auditor Switching And Audit Opinion: An Empirical Analysis”,
Accounting and Business Research, Vol. 26 No. 3, pp. 224-36.
Mautz, R.D, and Angell, R.J. (2006). “Understanding The Basics of Financial
Statement Analysis”, Commercial Lending Review, September-October
2006, p.p 27.
Nasser, A.T, and E.A. Wahid. (2006). “Auditor-Client Relationship: The Case Of
Audit Tenure and Auditor Switching in Malaysia”, Managerial Auditing
Journal, Vol.21 No.7, pp. 721 - 737.
Nazri, S, Smith, M and Ismail, Z. (2012). "Factors Influencing Auditor Change:
Evidence From Malaysia", Asian Review of Accounting, Vol. 20 No. 3,
pp. 222 - 240.
Peraturan Menteri Keuangan Republik Indonesia 17/PMK.01/2008, “Jasa
Akuntan Publik”
Roberts, R., Glezen,W. and Jones, T. (1990). “Determinants of Auditor Change In
The Public Sector”, Journal of Accounting Research, Vol. 28 No. 1, pp.
220 - 8.
Schwartz, K.B. and Menon, K. (1985). “Auditor Switches by Failing Firms”, The
Accounting Review, Vol. 60 No. 2, pp. 248 - 61.
Sinarwati, Ni Kadek. 2010. “Mengapa Perusahaan Manufaktur yang Terdaftar di
BEI Melakukan Pergantian Kantor Akuntan Publik?’. Simposium
Nasional Akuntansi XIII.
Smith, D.L. and Minter, Frank C. (2005). “Independence Perception or Reality?”,
Strategic Finance, Dec 2015.

Takiah, M.I. and Ghazali, S.M.W.S.A.W. (1993), “Incidence of qualified
opinions and the effects on auditor switching: an empirical study in
Malaysia”, Jurnal Pengurusan, Vol. 12, pp. 53-63.
Undang-Undang Republik Indonesia No. 10. (1998). Article 1 Paragraph 2.
Webster, Norman E. (1994). “The Meaning of "Public Accountant", The
Accounting Review, Vol. 19, No. 4 (Oct., 1944), pp. 366-376.
Wibowo, Arie and Rossieta, Hilda. (2009). “Faktor – Faktor Determinasi Kualitas
Audit-Suatu Studi dengan Pendekatan Earning Surprise Benchmark”.
Simposium Nasional Akuntansi XIII, Palembang, Page 1-34.
Williams, D.D. (1988). “The Potential Determinants Of Auditor Change”,
Journal of Business Finance & Accounting, Vol. 15 No. 2, pp. 243 - 61.
William C. Boynton. Modern Auditing 8th Edition (Assurance Services & The
Integrity of Financial Reporting)
Woo, E.-S. and Koh, H.C. (2001). “Factors associated with auditor changes: a
Singapore study”, Accounting and Business Research, Vol. 31 No. 2, pp.
133-44.
Zaki, E, Bah, R and Rao, A. (2011). "Assessing Probabilities Of Financial
Distress Of Banks In UAE", International Journal of Managerial
Finance, Vol. 7 No. 3, pp. 304 – 320
LINK
Keputusan Menteri Keuangan Republik Indonesia Nomor 423. 2002.
(http://www.ortax.org/ortax/?mod=aturan&page=show&id=386&hlm=#at
uranleft)

A
APPENDIX
Appendix 1 - List of banking companies listed in IDX year 2008
No. Bank Code
1 PT Bank Agroniaga Tbk AGRO
2 PT Bank Artha Graha International Tbk (formerly PT
Bank Inter-Pacific Tbk) INPC
3 PT Bank Bukopin Tbk BBKP
4 PT Bank Bumi Arta Tbk BNBA
5 PT Bank Bumiputera Indonesia Tbk BABP
6 PT Bank Capital Indonesia Tbk BACA
7 PT Bank Central Asia Tbk BBCA
8 PT Bank Century Tbk (formerly PT Bank CIC
Internasional Tbk) BCIC
9 PT Bank Danamon Indonesia Tbk BDMN
10 PT Bank Ekonomi Raharja Tbk BAEK
11 PT Bank Eksekutif Internasional Tbk BEKS
12 PT Bank Himpunan Saudara 1906 Tbk SDRA
13 PT Bank Internasioanal Indonesia Tbk BNII
14 PT Bank Kesawan Tbk BKSW
15 PT Bank Mandiri (Persero) Tbk BMRI
16 PT Bank Mayapada Internasional Tbk MAYA
17 PT Bank Mega Tbk MEGA
18 PT Bank Negara Indonesia (Persero) Tbk BBNI
19 PT Bank Niaga Tbk BNGA
20 PT Bank Nusantara Parahyangan Tbk BBNP
21 PT Bank OCBC NISP Tbk (formerly PT Bank NISP Tbk)
NISP
22 PT Bank Pan Indonesia Tbk PNBN
23 PT Bank Permata Tbk BNLI
24 PT Bank Rakyat Indonesia (Persero) Tbk BBRI
25 PT Bank Swadesi Tbk BSWD
26 PT Bank Tabungan Pensiunan Nasional BTPN
27 Bank Jabar Banten BJBR
28 PT Bank Victoria Internasional Tbk BVIC
29 PT Bank Windu Kentjana International Tbk (formerly
PT Bank Multicor Tbk) MCOR

B
Appendix 2 - List of banking companies listed in IDX year 2009
No. Bank Code
1 PT Bank Agroniaga Tbk AGRO
2 PT Bank Artha Graha International Tbk (formerly PT
Bank Inter-Pacific Tbk) INPC
3 PT Bank Bukopin Tbk BBKP
4 PT Bank Bumi Arta Tbk BNBA
5 PT Bank Capital Indonesia Tbk BACA
6 PT Bank Central Asia Tbk BBCA
7 PT Bank CIMB Niaga Tbk BNGA
8 PT Bank Danamon Indonesia Tbk BDMN
9 PT Bank Ekonomi Raharja Tbk BAEK
10 PT Bank Eksekutif Internasional Tbk BEKS
11 PT Bank Himpunan Saudara 1906 Tbk SDRA
12 PT Bank ICB Bumiputera Tbk (formerly PT Bank Bumiputera Indonesia Tbk)
BABP
13 PT Bank Internasioanal Indonesia Tbk BNII
14 PT Bank Kesawan Tbk BKSW
15 PT Bank Mandiri (Persero) Tbk BMRI
16 PT Bank Mayapada Internasional Tbk MAYA
17 PT Bank Mega Tbk MEGA
18 PT Bank Negara Indonesia (Persero) Tbk BBNI
19 PT Bank Nusantara Parahyangan Tbk BBNP
20 PT Bank OCBC NISP Tbk (formerly PT Bank NISP
Tbk) NISP
21 PT Bank Pan Indonesia Tbk PNBN
22 PT Bank Permata Tbk BNLI
23 PT Bank Rakyat Indonesia (Persero) Tbk BBRI
24 PT Bank Swadesi Tbk BSWD
25 PT Bank Tabungan Negara (Persero) Tbk BBTN
26 PT Bank Tabungan Pensiunan Nasional BTPN
27 PT Bank Victoria Internasional Tbk BVIC
28 PT Bank Windu Kentjana International Tbk (formerly
PT Bank Multicor Tbk) MCOR
29 PT Bank Century Tbk (Bank CIC International) BCIC
30 PT Bank Jabar Banten BJBR

C
Appendix 3 - List of banking companies listed in IDX year 2010
No. Bank Code
1 PT Bank Agroniaga Tbk AGRO
2 PT Bank Artha Graha International Tbk
(formerly PT Bank Inter-Pacific Tbk) INPC
3 PT Bank Bukopin Tbk BBKP
4 PT Bank Bumi Arta Tbk BNBA
5 PT Bank Capital Indonesia Tbk BACA
6 PT Bank CIMB Niaga Tbk BNGA
7 PT Bank Central Asia Tbk BBCA
8 PT Bank Mutiara Tbk (formerly PT Bank Century Tbk) BCIC
9 PT Bank Danamon Indonesia Tbk BDMN
10 PT Bank Ekonomi Raharja Tbk BAEK
11 PT Bank Eksekutif Internasional Tbk BEKS
12 PT Bank Himpunan Saudara 1906 Tbk SDRA
13 PT Bank ICB Bumiputera Tbk
(formerly PT Bank Bumiputera Indonesia Tbk) BABP
14 PT Bank Kesawan Tbk BKSW
15 PT Bank Mandiri (Persero) Tbk BMRI
16 PT Bank Mayapada Internasional Tbk MAYA
17 PT Bank Mega Tbk MEGA
18 PT Bank Negara Indonesia (Persero) Tbk BBNI
19 PT Bank Nusantara Parahyangan Tbk BBNP
20 PT Bank OCBC NISP Tbk (formerly PT Bank NISP Tbk) NISP
21 PT Bank Pan Indonesia Tbk PNBN
22 PT Bank Permata Tbk BNLI
23 PT Bank Rakyat Indonesia (Persero) Tbk BBRI
24 PT Bank Swadesi Tbk BSWD
25 PT Bank Tabungan Pensiunan Nasional BTPN
26 PT Bank Victoria Internasional Tbk BVIC
27 PT Bank Windu Kentjana International Tbk (formerly PT Bank Multicor Tbk)
MCOR
28 PT Bank Tabungan Negara (Persero) Tbk BBTN
29 PT Bank Jabar Banten Tbk BJBR
30 PT Bank Internasioanal Indonesia Tbk BNII
31 PT Bank Sinarmas Tbk BSIM

D
Appendix 4 - List of banking companies listed in IDX year 2011
No. Bank Code
1 PT Bank Agroniaga Tbk AGRO
2 PT Bank Artha Graha International Tbk (formerly PT Bank Inter-
Pacific Tbk) INPC
3 PT Bank Bumi Arta Tbk BNBA
4 PT Bank Capital Indonesia Tbk BACA
5 PT Bank CIMB Niaga Tbk BNGA
6 PT Bank Central Asia Tbk BBCA
7 PT Bank Danamon Indonesia Tbk BDMN
8 PT Bank Ekonomi Raharja Tbk BAEK
9 PT Bank Eksekutif Internasional Tbk BEKS
10 PT Bank Himpunan Saudara 1906 Tbk SDRA
11 PT Bank ICB Bumiputera Tbk (formerly PT Bank Bumiputera Indonesia Tbk)
BABP
12 PT Bank Internasioanal Indonesia Tbk BNII
13 PT Bank Kesawan Tbk BKSW
14 PT Bank Mandiri (Persero) Tbk BMRI
15 PT Bank Mayapada Internasional Tbk MAYA
16 PT Bank Mega Tbk MEGA
17 PT Bank Negara Indonesia (Persero) Tbk BBNI
18 PT Bank Nusantara Parahyangan Tbk BBNP
19 PT Bank OCBC NISP Tbk (formerly PT Bank NISP Tbk) NISP
20 PT Bank Pan Indonesia Tbk PNBN
21 PT Bank Permata Tbk BNLI
22 PT Bank Rakyat Indonesia (Persero) Tbk BBRI
23 PT Bank Swadesi Tbk BSWD
24 PT Bank Tabungan Pensiunan Nasional BTPN
25 PT Bank Victoria Internasional Tbk BVIC
26 PT Bank Windu Kentjana International Tbk (formerly PT Bank
Multicor Tbk) MCOR
27 PT Bank Tabungan Negara (Persero) Tbk BBTN
28 PT Bumi Citra Permai Tbk BCIP
29 PT Bank Pembangunan Daerah Jawa Barat dan Banten Tbk BJBR
30 PT Bank Sinarmas Tbk BSIM
31 PT Bank Bukopin Tbk BBKP
32 PT Bank Century Tbk (Bank CIC International) BCIC

E
Appendix 5 - List of banking companies listed in IDX year 2012
No. Bank Name Code
1 PT Bank Agroniaga Tbk AGRO
2 PT Bank ICB Bumiputera Tbk (formerly PT Bank Bumiputera
Indonesia Tbk) BABP
3 PT Bank Capital Indonesia Tbk BACA
4 PT Bank Ekonomi Raharja Tbk BAEK
5 PT Bank Central Asia Tbk BBCA
6 PT Bank Bukopin Tbk BBKP
7 PT Bank Negara Indonesia (Persero) Tbk BBNI
8 PT Bank Nusantara Parahyangan Tbk BBNP
9 PT Bank Rakyat Indonesia (Persero) Tbk BBRI
10 PT Bank Tabungan Negara (Persero) Tbk BBTN
11 PT Bank Century Tbk (Bank CIC International) BCIC
12 PT Bank Danamon Indonesia Tbk BDMN
13 PT Bank Eksekutif Internasional Tbk BEKS
14 PT Bank Pembangunan Daerah Jawa Barat dan Banten Tbk BJBR
15 PT Bank Pembangunan Daerah Jawa Timur Tbk BJTM
16 PT Bank Kesawan Tbk BKSW
17 PT Bank Mandiri (Persero) Tbk BMRI
18 PT Bank Bumi Arta Tbk BNBA
19 PT Bank CIMB Niaga Tbk BNGA
20 PT Bank Internasioanal Indonesia Tbk BNII
21 PT Bank Permata Tbk BNLI
22 PT Bank Sinarmas Tbk BSIM
23 PT Bank Swadesi Tbk BSWD
24 PT Bank Tabungan Pensiunan Nasional BTPN
25 PT Bank Victoria Internasional Tbk BVIC
26 PT Bank Artha Graha International Tbk (formerly PT Bank
Inter-Pacific Tbk) INPC
27 PT Bank Mayapada Internasional Tbk MAYA
28 PT Bank Windu Kentjana International Tbk (formerly PT Bank
Multicor Tbk) MCOR
29 PT Bank Mega Tbk MEGA
30 PT Bank OCBC NISP Tbk (formerly PT Bank NISP Tbk) NISP
31 PT Bank National Nobu Tbk NOBU
32 PT Bank Pan Indonesia Tbk PNBN
33 PT Bank Himpunan Saudara 1906 Tbk SDRA

F
Appendix 6 - List of banking companies listed in IDX year 2013
No. Bank Name Code
1 PT Bank Agroniaga Tbk AGRO
2 PT Bank ICB Bumiputera Tbk (formerly PT Bank Bumiputera Indonesia Tbk) BABP
3 PT Bank Capital Indonesia Tbk BACA
4 PT Bank Ekonomi Raharja Tbk BAEK
5 PT Bank Central Asia Tbk BBCA
6 PT Bank Mestika Dharma Tbk BBMD
7 PT Bank Bukopin Tbk BBKP
8 PT Bank Negara Indonesia (Persero) Tbk BBNI
9 PT Bank Nusantara Parahyangan Tbk BBNP
10 PT Bank Rakyat Indonesia (Persero) Tbk BBRI
11 PT Bank Tabungan Negara (Persero) Tbk BBTN
12 PT Bank Century Tbk (Bank CIC International) BCIC
13 PT Bank Danamon Indonesia Tbk BDMN
14 PT Bank Eksekutif Internasional Tbk BEKS
15 PT Bank Ina Perdana Tbk BINA
16 PT Bank Pembangunan Daerah Jawa Barat dan Banten Tbk BJBR
17 PT Bank Pembangunan Daerah Jawa Timur Tbk BJTM
18 PT Bank Kesawan Tbk BKSW
19 PT Bank Maspion Indonesia Tbk BMAS
20 PT Bank Mandiri (Persero) Tbk BMRI
21 PT Bank Bumi Arta Tbk BNBA
22 PT Bank CIMB Niaga Tbk BNGA
23 PT Bank Internasioanal Indonesia Tbk BNII
24 PT Bank Permata Tbk BNLI
25 PT Bank Sinarmas Tbk BSIM
26 PT Bank Swadesi Tbk BSWD
27 PT Bank Tabungan Pensiunan Nasional BTPN
28 PT Bank Victoria Internasional Tbk BVIC
29 PT Bank Artha Graha International Tbk (formerly PT Bank Inter-Pacific Tbk) INPC
30 PT Bank Mayapada Internasional Tbk MAYA
31 PT Bank Windu Kentjana International Tbk (formerly PT Bank Multicor Tbk) MCOR
32 PT Bank Mega Tbk MEGA
33 PT Bank Nagari Tbk NAGA
34 PT Bank OCBC NISP Tbk (formerly PT Bank NISP Tbk) NISP
35 PT Bank National Nobu Tbk NOBU
36 PT Bank Pan Indonesia Tbk PNBN
37 PT Bank Panin Syariah Tbk PNBS
38 PT Bank Himpunan Saudara 1906 Tbk SDRA

G
Appendix 7 - List of banking companies listed in IDX year 2014
No. Bank Name Code
1 PT Bank Agroniaga Tbk AGRO
2 PT Bank Agris Tbk AGRS
3 PT Bank ICB Bumiputera Tbk (formerly PT Bank Bumiputera Indonesia Tbk)
BABP
4 PT Bank Capital Indonesia Tbk BACA
5 PT Bank Ekonomi Raharja Tbk BAEK
6 PT Bank Central Asia Tbk BBCA
7 PT Bank Mestika Dharma Tbk BBKP
8 PT Bank Bukopin Tbk BBMD
9 PT Bank Negara Indonesia (Persero) Tbk BBNI
10 PT Bank Nusantara Parahyangan Tbk BBNP
11 PT Bank Rakyat Indonesia (Persero) Tbk BBRI
12 PT Bank Tabungan Negara (Persero) Tbk BBTN
13 PT Bank Yudha Bakti Tbk BBYB
14 PT Bank Century Tbk (Bank CIC International) BCIC
15 PT Bank Danamon Indonesia Tbk BDMN
16 PT Bank Eksekutif Internasional Tbk BEKS
17 PT Bank Ina Perdana Tbk BINA
18 PT Bank Pembangunan Daerah Jawa Barat dan Banten Tbk BJBR
19 PT Bank Pembangunan Daerah Jawa Timur Tbk BJTM
20 PT Bank Kesawan Tbk BKSW
21 PT Bank Maspion Indonesia Tbk BMAS
22 PT Bank Mandiri (Persero) Tbk BMRI
23 PT Bank Bumi Arta Tbk BNBA
24 PT Bank CIMB Niaga Tbk BNGA
25 PT Bank Internasioanal Indonesia Tbk BNII
26 PT Bank Permata Tbk BNLI
27 PT Bank Sinarmas Tbk BSIM
28 PT Bank Swadesi Tbk BSWD
29 PT Bank Tabungan Pensiunan Nasional BTPN
30 PT Bank Victoria Internasional Tbk BVIC
31 PT Bank Dinar Indonesia Tbk DNAR
32 PT Bank Artha Graha International Tbk (formerly PT Bank
Inter-Pacific Tbk) INPC
33 PT Bank Mayapada Internasional Tbk MAYA
34 PT Bank Windu Kentjana International Tbk (formerly PT
Bank Multicor Tbk) MCOR
35 PT Bank Mega Tbk MEGA

H
36 PT Bank Nagari Tbk NAGA
37 PT Bank OCBC NISP Tbk (formerly PT Bank NISP Tbk)
NISP
38 PT Bank National Nobu Tbk NOBU
39 PT Bank Pan Indonesia Tbk PNBN
40 PT Bank Panin Syariah Tbk PNBS
41 PT Bank Himpunan Saudara 1906 Tbk SDRA

I
Appendix 8 - List of banking company which does not have adequate data to
be evaluated as research sample
No. Bank Name Code
1 PT Bank Capital Indonesia BACA

J
Appendix 9 - Sample list of banking companies that respectively listed on
Indonesia Stock Exchange during 2008 – 2014
No. Bank Name Code
1 PT Bank Agroniaga Tbk AGRO
2 PT Bank ICB Bumiputera Tbk (formerly PT Bank Bumiputera Indonesia
Tbk) BABP
3 PT Bank Ekonomi Raharja Tbk BAEK
4 PT Bank Central Asia Tbk BBCA
5 PT Bank Negara Indonesia (Persero) Tbk BBNI
6 PT Bank Nusantara Parahyangan Tbk BBNP
7 PT Bank Century Tbk (formerly PT Bank CIC Internasional Tbk) BCIC
8 PT Bank Danamon Indonesia Tbk BDMN
9 PT Bank Eksekutif Internasional Tbk BEKS
10 PT Bank Jabar Banten BJBR
11 PT Bank Kesawan Tbk BKSW
12 PT Bank Mandiri (Persero) Tbk BMRI
13 PT Bank Bumi Arta Tbk BNBA
14 PT Bank Internasioanal Indonesia Tbk BNII
15 PT Bank Swadesi Tbk BSWD
16 PT Bank Tabungan Pensiunan Nasional BTPN
17 PT Bank Victoria Internasional Tbk BVIC
18 PT Bank Artha Graha International Tbk (formerly PT Bank Inter-Pacific
Tbk) INPC
19 PT Bank Mayapada Internasional Tbk MAYA
20 PT Bank Windu Kentjana International Tbk (formerly PT Bank Multicor
Tbk) MCOR
21 PT Bank Mega Tbk MEGA
22 PT Bank Himpunan Saudara 1906 Tbk SDRA
23 PT Bank Bukopin BBKP
24 PT Bank Rakyat Indonesia BBRI
25 PT Bank Niaga BNGA
26 PT Bank OCBC NISP Tbk (formerly PT Bank NISP Tbk) NISP
27 PT Bank Pan Indonesia Tbk PNBN
28 PT Bank Permata BNLI

Appendix 10 - List of public accountant firms used by each of sample during 2008 – 2014
Voluntarily Auditor Switching
No. Bank Code Year Opinion KAP Name KAP Size
1 Bank MNC Internasional (ICB Bumiputera) BABP 2008 UQ Purwanto, Sarwoko, & Sandjaja Big 4
2009 UQ Purwanto, Sarwoko, & Sandjaja Big 4
2010 UQ Purwantono, Suharman, &Surja Big 4
2011 UQ Purwantono, Suharman, &Surja Big 4
2012 UQ Purwantono, Suharman, &Surja Big 4
2013 UQ Purwantono, Suharman, &Surja Big 4
2014 UQ Osman Bing Satrio & Enny Big 4
2 Bank Danamon Indonesia BDMN 2008 UQ Siddharta Siddharta & Widjaja Big 4
2009 UQ Siddharta Siddharta & Widjaja Big 4
2010 UQ Siddharta Siddharta & Widjaja Big 4
2011 UQ Siddharta Siddharta & Widjaja Big 4
2012 UQ Purwantono, Suherman, & Surja Big 4
2013 UQ Purwantono, Suherman, & Surja Big 4
2014 UQ Purwantono, Suherman, & Surja Big 4
3 Bank Mutiara (formerly Bank Century) BCIC 2008 Q Aryanto, Amir Jusuf, & Mawar Non Big 4
2009 UQ Aryanto, Amir Jusuf, Mawar, & Saptoto Non Big 4
2010 UQ Aryanto, Amir Jusuf, Mawar, & Saptoto Non Big 4
2011 UQ Aryanto, Amir Jusuf, Mawar, & Saptoto Non Big 4
2012 UQ Tjahjadi & Tamara Non Big 4
2013 UQ Tjahjadi & Tamara Non Big 4
2014 UQ Tjahjadi & Tamara Non Big 4

4 Bank Eksekutif International (Bank Pundi) BEKS 2008 UQ Ishak, Saleh, Soewondo & Rekan Non Big 4
2009 UQ Kosasih, Nurdiyaman, Tjahjo & Partners Non Big 4
2010 UQ Kosasih, Nurdiyaman, Tjahjo & Partners Non Big 4
2011 UQ Kosasih, Nurdiyaman, Tjahjo & Partners Non Big 4
2012 UQ Kosasih, Nurdiyaman, Tjahjo & Partners Non Big 4
2013 UQ Hendrawinata, Eddhy, & Siddharta Non Big 4
2014 UQ Hendrawinata, Eddhy, Siddharta, & Tanzil Non Big 4
5 Bank International Indonesia BNII 2008 UQ Haryanto Sahari & Partners Big 4
2009 UQ Purwanto, Sarwoko, & Sandjaja Big 4
2010 UQ Purwantono, Suherman, & Surja Big 4
2011 UQ Purwantono, Suherman, & Surja Big 4
2012 UQ Purwantono, Suherman, & Surja Big 4
2013 UQ Purwantono, Suherman, & Surja Big 4
2014 UQ Purwantono, Suherman, & Surja Big 4
6 PT Bank Artha Graha International Tbk (formerly
PT Bank Inter-Pacific Tbk) INPC 2008 UQ Arifin, Halid, & Partners Non Big 4
2009 UQ Tjahjadi, Pradhono, & Teramihardja Non Big 4
2010 UQ Tjahjadi, Pradhono, & Teramihardja Non Big 4
2011 UQ Tjahjadi & Tamara Non Big 4
2012 UQ Tjahjadi & Tamara Non Big 4
2013 UQ Tjahjadi & Tamara Non Big 4
2014 UQ Tjahjadi & Tamara Non Big 4
7 Bank QNB Kesawan Tbk (Bank Kesawan) BKSW 2008 UQ Hananta, Budianto, & Partners Non Big 4
2009 UQ Aryanto, Amir Jusuf, Mawar, & Saptoto Non Big 4
2010 UQ Aryanto, Amir Jusuf, Mawar, & Saptoto Non Big 4
2011 UQ Siddharta & Widjaja Big 4

2012 UQ Siddharta & Widjaja Big 4
2013 UQ Purwantono, Suherman, & Surja Big 4
2014 UQ Purwantono, Suherman, & Surja Big 4
8 Bank Mandiri BMRI 2008 UQ Purwantono, Sarwoko, & Sandjaja Big 4
2009 UQ Haryanto, Sahari, & Partners Big 4
2010 UQ Tanudiredja, Wibisana, & Partners Big 4
2011 UQ Tanudiredja, Wibisana, & Partners Big 4
2012 UQ Tanudiredja, Wibisana, & Partners Big 4
2013 UQ Tanudiredja, Wibisana, & Partners Big 4
2014 UQ Tanudiredja, Wibisana, & Partners Big 4
9 Bank Mayapada International MAYA 2008 UQ Hendrawinata, Gani, & Hidayat Non Big 4
2009 UQ Hendrawinata, Gani, & Hidayat Non Big 4
2010 UQ Hendrawinata, Gani, & Hidayat Non Big 4
2011 UQ Hendrawinata, Eddy, & Siddharta Non Big 4
2012 UQ Hendrawinata, Eddy, & Siddharta Non Big 4
2013 UQ Hendrawinata, Eddy, & Siddharta Non Big 4
2014 UQ Hendrawinata, Eddy, Siddharta, & Tanzil Non Big 4
10 Bank Mega Tbk MEGA 2008 UQ Purwantono, Sarwoko, & Sandjaja Big 4
2009 UQ Siddharta & Widjadja Big 4
2010 UQ Siddharta & Widjadja Big 4
2011 UQ Siddharta & Widjadja Big 4
2012 UQ Purwantono, Suherman, & Surja Big 4
2013 UQ Purwantono, Suherman, & Surja Big 4
2014 UQ Purwantono, Suherman, & Surja Big 4
11 Bank Negara Indonesia BBNI 2008 UQ Purwantono, Sarwoko, & Sandjaja Big 4
2009 UQ Purwantono, Sarwoko, & Sandjaja Big 4

2010 UQ Purwantono, Suherman, & Surja Big 4
2011 UQ Purwantono, Suherman, & Surja Big 4
2012 UQ Tanudiredja, Wibisana, & Partners Big 4
2013 UQ Tanudiredja, Wibisana, & Partners Big 4
2014 UQ Tanudiredja, Wibisana, & Partners Big 4
12 Bank Nusantara Parahyangan BBNP 2008 UQ Sanusi, Supardi, & Soegiharto Non Big 4
2009 UQ Tanubrata, Sutanto, & Partners Non Big 4
2010 UQ Hendrawinata, Gani, & Hidayat Non Big 4
2011 UQ Gani, Mulyadi, & Handayani Non Big 4
2012 UQ Gani, Mulyadi, & Handayani Non Big 4
2013 UQ Gani Sigiro & Handayani Non Big 4
2014 UQ Doli, Bambang, Sulistiyanto, Dadang & Ali Non Big 4
13 Bank Swadesi Tbk BSWD 2008 UQ Osman Bing Satrio & Partners Big 4
2009 UQ Osman Bing Satrio & Partners Big 4
2010 UQ Osman Bing Satrio & Partners Big 4
2011 UQ Gani Mulyadi & Handayani Non Big 4
2012 UQ Gani Mulyadi & Handayani Non Big 4
2013 UQ Gani Sigiro & Handayani Non Big 4
2014 UQ Gani Sigiro & Handayani Non Big 4
14 Bank Victoria International BVIC 2008 UQ Hendrawinata, Gani, & Hidayat Non Big 4
2009 UQ Hendrawinata, Gani, & Hidayat Non Big 4
2010 UQ Eddy Siddharta & Partners Non Big 4
2011 UQ Tjahjadi & Tamara Non Big 4
2012 UQ Tjahjadi & Tamara Non Big 4
2013 UQ Tjahjadi & Tamara Non Big 4
2014 UQ Tanudiredja, Wibisana, & Partners Big 4

15 Bank Agroniaga AGRO 2008 UQ Tasnim Ali Widjanarko & Partners Non Big 4
2009 UQ Kanaka Puradiredja, Suhartono Non Big 4
2010 UQ Aryanto, Amir Jusuf, Mawar, & Saptoto Non Big 4
2011 UQ Purwantono, Suherman, & Surja Big 4
2012 UQ Purwantono, Suherman, & Surja Big 4
2013 UQ Purwantono, Suherman, & Surja Big 4
2014 UQ Purwantono, Suherman, & Surja Big 4
16 Bank Ekonomi Raharja BAEK 2008 UQ Osman Bing Satrio & Partners Big 4
2009 UQ Siddharta & Widjaja Big 4
2010 UQ Siddharta & Widjaja Big 4
2011 UQ Siddharta & Widjaja Big 4
2012 UQ Siddharta & Widjaja Big 4
2013 UQ Siddharta & Widjaja Big 4
2014 UQ Siddharta & Widjaja Big 4
17 Bank Central Asia BBCA 2008 UQ Purwantono, Sarwoko, & Sandjaja Big 4
2009 UQ Purwantono, Sarwoko, & Sandjaja Big 4
2010 UQ Purwantono, Suherman, & Surja Big 4
2011 UQ Purwantono, Suherman, & Surja Big 4
2012 UQ Siddharta & Widjaja Big 4
2013 UQ Siddharta & Widjaja Big 4
2014 UQ Siddharta Widjaja & Partners Big 4
18 Bank Jabar Banten BJBR 2008 UQ Haryanto Sahari & Partners Big 4
2009 UQ Purwantono, Sarwoko, & Sandjaja Big 4
2010 UQ Purwantono, Suherman, & Surja Big 4
2011 UQ Purwantono, Suherman, & Surja Big 4
2012 UQ Purwantono, Suherman, & Surja Big 4
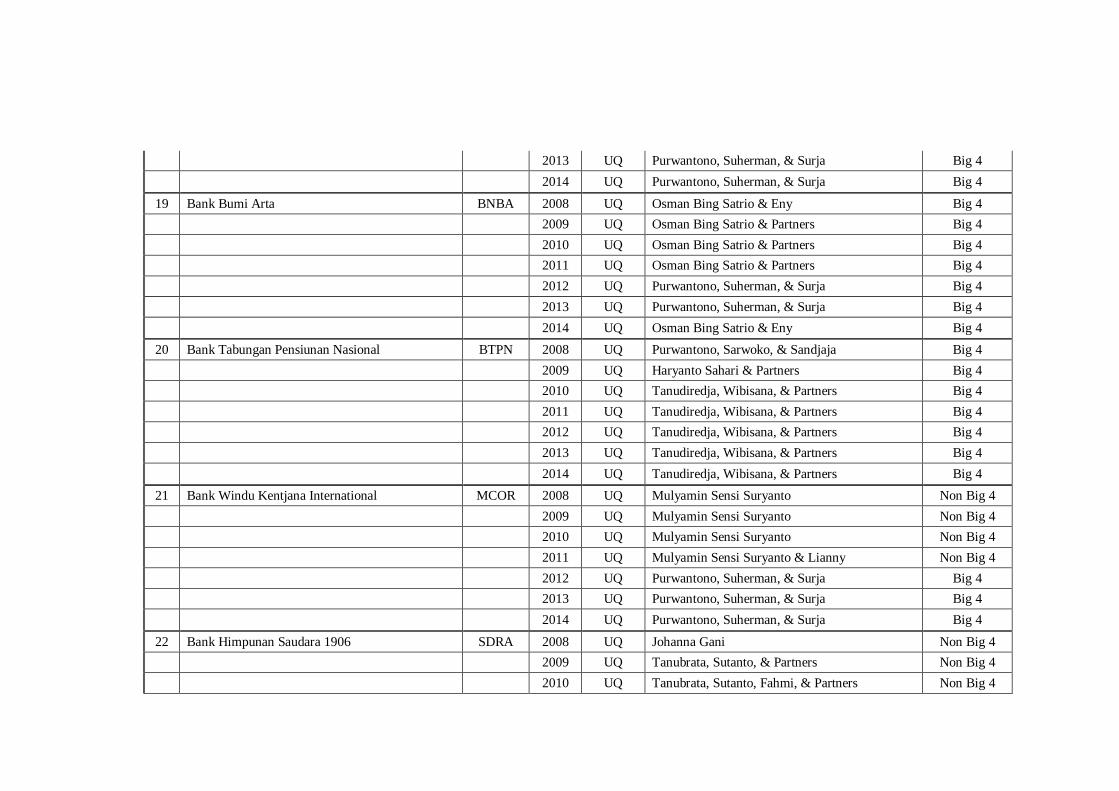
2013 UQ Purwantono, Suherman, & Surja Big 4
2014 UQ Purwantono, Suherman, & Surja Big 4
19 Bank Bumi Arta BNBA 2008 UQ Osman Bing Satrio & Eny Big 4
2009 UQ Osman Bing Satrio & Partners Big 4
2010 UQ Osman Bing Satrio & Partners Big 4
2011 UQ Osman Bing Satrio & Partners Big 4
2012 UQ Purwantono, Suherman, & Surja Big 4
2013 UQ Purwantono, Suherman, & Surja Big 4
2014 UQ Osman Bing Satrio & Eny Big 4
20 Bank Tabungan Pensiunan Nasional BTPN 2008 UQ Purwantono, Sarwoko, & Sandjaja Big 4
2009 UQ Haryanto Sahari & Partners Big 4
2010 UQ Tanudiredja, Wibisana, & Partners Big 4
2011 UQ Tanudiredja, Wibisana, & Partners Big 4
2012 UQ Tanudiredja, Wibisana, & Partners Big 4
2013 UQ Tanudiredja, Wibisana, & Partners Big 4
2014 UQ Tanudiredja, Wibisana, & Partners Big 4
21 Bank Windu Kentjana International MCOR 2008 UQ Mulyamin Sensi Suryanto Non Big 4
2009 UQ Mulyamin Sensi Suryanto Non Big 4
2010 UQ Mulyamin Sensi Suryanto Non Big 4
2011 UQ Mulyamin Sensi Suryanto & Lianny Non Big 4
2012 UQ Purwantono, Suherman, & Surja Big 4
2013 UQ Purwantono, Suherman, & Surja Big 4
2014 UQ Purwantono, Suherman, & Surja Big 4
22 Bank Himpunan Saudara 1906 SDRA 2008 UQ Johanna Gani Non Big 4
2009 UQ Tanubrata, Sutanto, & Partners Non Big 4
2010 UQ Tanubrata, Sutanto, Fahmi, & Partners Non Big 4

2011 UQ Tanudiredja, Wibisana, & Partners Big 4
2012 UQ Tanudiredja, Wibisana, & Partners Big 4
2013 UQ Tanudiredja, Wibisana, & Partners Big 4
2014 UQ Osman Bing Satrio & Eny Big 4

Appendix 11 - Computation result of sample bank list during 2008 – 2014
Voluntarily Auditor Switching
No Code Year Working Capital Total Asset Retained Earnings EBIT
1 INPC 2008 919,533,766,813 12,845,448,000,000 (448,056,000,000) 40,329,000,000
2009 963,068,170,154 15,432,373,000,000 (406,198,000,000) 64,407,000,000
2010 1,054,457,381,815 17,063,094,000,000 (315,681,000,000) 117,551,000,000
2011 1,154,340,786,358 19,185,436,000,000 (215,251,000,000) 125,738,000,000
2012 1,937,327,000,000 20,558,770,000,000 63,116,000,000 139,810,000,000
2013 193,296,999,000,000 211,885,820,000,000 740,541,000,000 293,613,000,000
2014 213,799,399,000,000 234,533,470,000,000 851,126,000,000 177,777,000,000
2 BBCA 2008 23,279,310,000,000 245,569,856,000,000 18,338,392,000,000 7,720,043,000,000
2009 27,856,693,000,000 282,392,294,000,000 22,587,283,000,000 8,945,092,000,000
2010 34,568,009,000,000 324,419,069,000,000 28,528,020,000,000 10,653,269,000,000
2011 42,742,847,000,000 381,908,353,000,000 36,581,874,000,000 13,618,758,000,000
2012 52,926,953,000,000 442,994,197,000,000 45,534,178,000,000 14,686,046,000,000
2013 65,410,580,000,000 496,304,573,000,000 56,928,028,000,000 17,815,606,000,000
2014 79,873,115,000,000 552,423,892,000,000 70,332,010,000,000 20,741,121,000,000
3 BABP 2008 (1,115,121,675,000) 4,667,760,357,000 31,349,911,000 550,837,000,000
2009 (1,277,073,122,000) 5,188,764,128,000 36,393,349,000 520,333,000,000
2010 700,768,946,000 8,667,938,558,000 27,711,831,000 667,065,000,000
2011 604,801,588,000 7,281,534,934,000 (74,036,859,000) (143,293,000,000)
2012 713,839,761,000 7,433,803,459,000 (73,000,424,000) 6,010,000,000

2013 763,878,000,000 8,165,865,000,000 (154,741,000,000) (66,541,000,000)
2014 1,234,569,000,000 9,430,264,000,000 (209,291,000,000) (70,033,000,000)
4 BDMN 2008 11,109,265,000,000 107,268,363,000,000 6,989,413,000,000 2,677,837,000,000
2009 15,901,986,000,000 98,597,953,000,000 7,890,479,000,000 2,370,560,000,000
2010 18,609,028,000,000 118,206,573,000,000 10,007,647,000,000 4,001,531,000,000
2011 25,836,501,000,000 141,934,432,000,000 12,334,684,000,000 4,611,556,000,000
2012 28,733,311,000,000 155,791,308,000,000 15,231,383,000,000 4,551,581,000,000
2013 31,552,983,000,000 184,237,348,000,000 31,251,473,000,000 5,530,213,000,000
2014 33,017,524,000,000 195,708,593,000,000 32,779,526,000,000 3,553,534,000,000
5 BCIC 2008 3,580,598,000,000 5,585,890,000,000 (8,630,286,000,000) (7,180,684,000,000)
2009 6,518,568,000,000 7,531,145,000,000 (8,638,230,000,000) 246,289,000,000
2010 9,674,994,000,000 10,783,886,000,000 (8,412,323,000,000) 218,241,000,000
2011 10,732,465,000,000 11,657,791,000,000 (8,150,876,000,000) 40,511,000,000
2012 14,705,454,000,000 15,240,091,000,000 (8,003,589,000,000) 144,081,000,000
2013 12,933,130,000,000 14,576,094,000,000 (9,133,835,000,000) (1,112,976,000,000)
2014 12,046,796,000,000 12,682,021,000,000 (9,792,323,000,000) (669,934,000,000)
6 BEKS 2008 88,176,000,000 1,492,166,000,000 (4,865,000,000) (28,018,000,000)
2009 (46,695,000,000) 1,425,575,000,000 (139,735,000,000) (112,690,000,000)
2010 256,563,000,000 1,561,622,000,000 (341,617,000,000) (166,312,000,000)
2011 463,241,000,000 5,993,039,000,000 (459,608,000,000) (171,575,000,000)
2012 654,184,000,000 7,682,938,000,000 (445,353,000,000) 68,220,000,000
2013 717,916,000,000 9,003,124,000,000 (381,621,000,000) 102,429,000,000
2014 636,146,000,000 9,044,046,000,000 (463,291,000,000) (14,855,000,000)
7 BNII 2008 6,114,925,000,000 56,855,129,000,000 1,957,463,000,000 653,322,000,000
2009 7,292,683,000,000 60,965,774,000,000 1,718,926,000,000 39,237,000,000
2010 13,525,453,000,000 75,130,433,000,000 2,179,915,000,000 789,736,000,000

2011 17,600,938,000,000 94,919,111,000,000 2,802,779,000,000 985,306,000,000
2012 19,237,646,000,000 115,772,908,000,000 602,066,355,588 1,695,869,000,000
2013 23,424,868,000,000 140,546,751,000,000 1,087,400,838,874 2,184,224,000,000
2014 14,915,083,000,000 143,318,466,000,000 1,467,845,756,842 959,834,000,000
8 BKSW 2008 135,440,000,000 2,162,228,000,000 11,722,000,000 4,778,000,000
2009 178,485,000,000 2,347,783,000,000 14,776,000,000 6,387,000,000
2010 178,124,000,000 2,589,915,000,000 13,211,000,000 4,058,000,000
2011 892,573,000,000 3,593,817,000,000 19,029,000,000 15,550,000,000
2012 863,068,000,000 4,644,654,000,000 (7,929,000,000) (34,424,000,000)
2013 1,513,028,000,000 11,047,615,000,000 (4,567,000,000) 5,087,000,000
2014 2,280,924,000,000 20,839,018,000,000 116,265,000,000 161,911,000,000
9 BMRI 2008 30,513,678,000,000 358,438,678,000,000 13,179,144,000,000 8,068,560,000,000
2009 35,108,604,000,000 394,616,604,000,000 17,858,633,000,000 10,824,074,000,000
2010 41,542,551,000,000 449,774,551,000,000 24,442,187,000,000 13,972,162,000,000
2011 62,654,704,000,000 551,891,704,000,000 33,505,527,000,000 16,512,035,000,000
2012 76,532,708,000,000 635,618,708,000,000 93,100,000,000,000 20,504,268,000,000
2013 88,790,596,000,000 733,099,762,000,000 15,504,067,000,000 24,061,837,000,000
2014 104,844,562,000,000 855,039,673,000,000 18,203,753,000,000 26,008,015,000,000
10 MAYA 2008 950,345,000,000 5,512,694,000,000 105,041,000,000 60,151,000,000
2009 993,521,000,000 7,629,928,000,000 130,681,000,000 59,697,000,000
2010 1,483,398,000,000 10,102,287,000,000 211,865,447,000 105,755,000,000
2011 1,663,595,000,000 12,951,201,000,000 383,140,884,000 230,477,000,000
2012 1,845,737,000,000 17,166,551,000,000 562,950,574,000 351,140,000,000
2013 2,412,323,000,000 24,015,571,000,000 849,363,244,000 509,628,000,000
2014 2,852,233,000,000 36,173,590,000,000 1,284,925,186,000 580,328,000,000
11 MEGA 2008 5,479,872,000,000 34,860,872,000,000 1,251,960,000,000 674,841,000,000

2009 6,880,622,000,000 39,684,622,000,000 3,403,242,000,000 640,749,000,000
2010 9,512,960,000,000 51,596,960,000,000 2,695,921,000,000 1,041,115,000,000
2011 12,770,027,000,000 61,909,027,000,000 1,665,749,000,000 1,191,316,000,000
2012 6,263,108,000,000 65,219,108,000,000 3,043,108,000,000 1,566,014,000,000
2013 6,118,698,000,000 66,475,698,000,000 524,730,000,000 632,550,000,000
2014 6,956,891,000,000 66,647,891,000,000 1,141,188,000,000 697,981,000,000
12 BBNI 2008 15,462,069,000,000 201,741,069,000,000 2,597,420,000,000 1,932,385,000,000
2009 18,905,452,000,000 227,227,452,000,000 6,802,568,000,000 3,443,949,000,000
2010 33,149,529,000,000 248,580,529,000,000 9,990,436,000,000 5,485,460,000,000
2011 37,843,161,000,000 299,058,161,000,000 14,422,051,000,000 7,461,308,000,000
2012 43,525,506,000,000 333,303,506,000,000 20,070,536,000,000 8,899,562,000,000
2013 47,682,815,000,000 386,654,815,000,000 27,011,835,000,000 11,278,165,000,000
2014 61,020,708,000,000 416,573,708,000,000 35,078,159,000,000 13,524,310,000,000
13 BBNP 2008 340,026,258,000 3,694,814,000,000 173,741,000,000 40,702,000,000
2009 369,425,299,000 3,896,398,000,000 203,141,000,000 41,135,000,000
2010 519,512,157,000 5,280,892,000,000 245,760,000,000 68,122,000,000
2011 582,909,831,000 6,572,646,000,000 318,158,000,000 91,757,000,000
2012 661,259,173,000 8,212,208,000,000 416,528,618,000 115,153,000,000
2013 1,052,397,532,000 9,985,735,000,000 492,943,804,000 141,923,000,000
2014 1,138,101,000,000 9,468,873,000,000 578,646,957,000 130,448,000,000
14 BSWD 2008 282,672,550,359 1,359,880,000,000 80,170,000,000 30,197,000,000
2009 302,477,857,101 1,537,377,000,000 99,761,000,000 50,640,000,000
2010 318,714,467,662 1,570,331,000,000 113,801,000,000 48,067,000,000
2011 346,487,584,500 2,080,427,000,000 141,910,000,000 64,541,000,000
2012 373,768,093,210 2,540,740,000,000 169,558,427,759 73,921,000,000
2013 454,860,675,545 3,601,335,000,000 251,053,773,999 109,583,000,000

2014 560,586,928,418 5,199,184,000,000 357,221,503,997 142,022,000,000
15 BVIC 2008 527,959,329,000 5,625,107,000,000 184,247,000,000 44,786,000,000
2009 629,361,187,000 7,359,018,000,000 203,496,000,000 62,604,000,000
2010 742,689,258,000 10,304,852,000,000 315,458,000,000 131,657,000,000
2011 1,212,112,703,000 11,802,562,000,000 502,857,000,000 239,238,000,000
2012 1,469,191,824,000 14,352,840,000,000 708,426,682,000 252,594,000,000
2013 2,673,736,043,000 19,153,130,000,000 915,941,424,000 311,950,000,000
2014 2,930,258,905,000 21,364,882,000,000 1,023,544,641,000 121,532,000,000
16 AGRO 2008 231,638,776,000 2,578,439,431,000 (5,128,215,000) 2,845,000,000
2009 347,894,492,000 2,981,696,000,000 (2,929,275,000) 4,603,000,000
2010 278,285,330,000 3,054,092,000,000 (82,263,160,000) 19,381,000,000
2011 347,615,823,000 3,481,155,000,000 (32,856,381,000) 44,985,000,000
2012 371,924,321,000 4,040,140,000,000 (16,380,201,000) 51,471,000,000
2013 836,906,498,000 5,124,070,000,000 37,225,140,000 71,589,000,000
2014 904,021,109,000 6,385,191,000,000 88,948,065,000 85,353,000,000
17 BAEK 2008 1,628,486,000,000 18,211,455,000,000 1,103,876,000,000 382,026,000,000
2009 2,008,270,000,000 21,591,830,000,000 1,435,451,000,000 451,981,000,000
2010 2,302,859,000,000 21,522,321,000,000 1,772,162,000,000 396,703,000,000
2011 2,600,403,000,000 24,156,715,000,000 2,014,719,000,000 326,825,000,000
2012 2,678,107,000,000 25,365,299,000,000 2,158,752,000,000 246,890,000,000
2013 2,966,162,000,000 28,750,162,000,000 2,442,506,000,000 324,728,000,000
2014 3,023,856,000,000 29,726,856,000,000 2,498,023,000,000 89,154,000,000
18 BJBR 2008 2,481,870,000,000 26,040,869,000,000 940,769,000,000 831,394,000,000
2009 3,138,218,000,000 32,457,004,000,000 1,279,389,000,000 985,377,000,000
2010 4,996,047,000,000 43,445,700,000,000 1,743,497,000,000 1,219,628,000,000
2011 5,387,099,000,000 54,448,658,000,000 2,127,146,000,000 1,319,816,000,000

2012 9,193,619,000,000 70,958,233,000,000 2,727,657,000,000 1,512,499,000,000
2013 10,061,408,000,000 70,958,233,000,000 3,436,725,000,000 1,752,874,000,000
2014 11,951,812,000,000 75,836,537,000,000 1,526,786,000,000 1,438,490,000,000
19 BNBA 2008 393,302,992,086 2,044,367,000,000 151,313,618,449 41,573,000,000
2009 414,610,080,079 2,403,186,000,000 172,620,395,174 41,158,000,000
2010 440,436,500,155 2,661,902,000,000 198,446,731,591 37,681,000,000
2011 476,130,654,070 2,963,148,000,000 234,141,327,817 57,015,000,000
2012 522,504,758,046 3,483,516,000,000 280,515,567,137 77,467,000,000
2013 564,402,493,749 4,045,672,000,000 322,412,991,595 78,854,000,000
2014 602,138,963,091 5,155,422,000,000 360,149,827,924 70,541,000,000
20 BTPN 2008 1,617,222,000,000 13,697,461,000,000 1,503,950,000,000 575,159,000,000
2009 2,038,313,000,000 22,272,246,000,000 1,924,373,000,000 622,218,000,000
2010 4,217,291,000,000 34,522,573,000,000 2,808,743,000,000 1,127,264,000,000
2011 5,617,198,000,000 46,651,141,000,000 4,208,806,000,000 1,771,620,000,000
2012 7,733,927,000,000 59,090,132,000,000 6,187,792,000,000 2,485,314,000,000
2013 9,904,456,000,000 69,661,464,000,000 8,318,897,000,000 2,868,855,000,000
2014 14,264,837,000,000 75,014,737,000,000 10,171,919,000,000 2,522,528,000,000
21 MCOR 2008 261,990,000,000 2,094,665,000,000 - 4,822,000,000
2009 301,392,000,000 2,798,874,000,000 - 23,079,000,000
2010 521,420,000,000 4,354,460,000,000 - 37,813,000,000
2011 557,634,000,000 6,452,794,000,000 - 48,375,000,000
2012 755,665,000,000 6,495,246,000,000 148,608,000,000 128,018,000,000
2013 1,035,379,000,000 7,917,214,000,000 226,914,000,000 118,708,000,000
2014 1,220,139,000,000 9,769,591,000,000 294,334,000,000 71,448,000,000
22 SDRA 2008 200,525,973,357 1,977,150,000,000 69,477,807,829 55,300,000,000
2009 253,623,871,709 2,403,695,000,000 59,940,848,049 51,115,000,000

2010 393,644,000,000 3,245,762,000,000 114,780,000,000 81,604,000,000
2011 473,174,000,000 5,085,762,000,000 182,194,000,000 121,807,000,000
2012 537,907,000,000 7,621,309,000,000 262,322,000,000 160,367,000,000
2013 577,820,000,000 8,230,842,000,000 355,334,000,000 168,095,000,000
2014 3,904,265,000,000 16,432,776,000,000 4,039,480,000,000 188,798,000,000
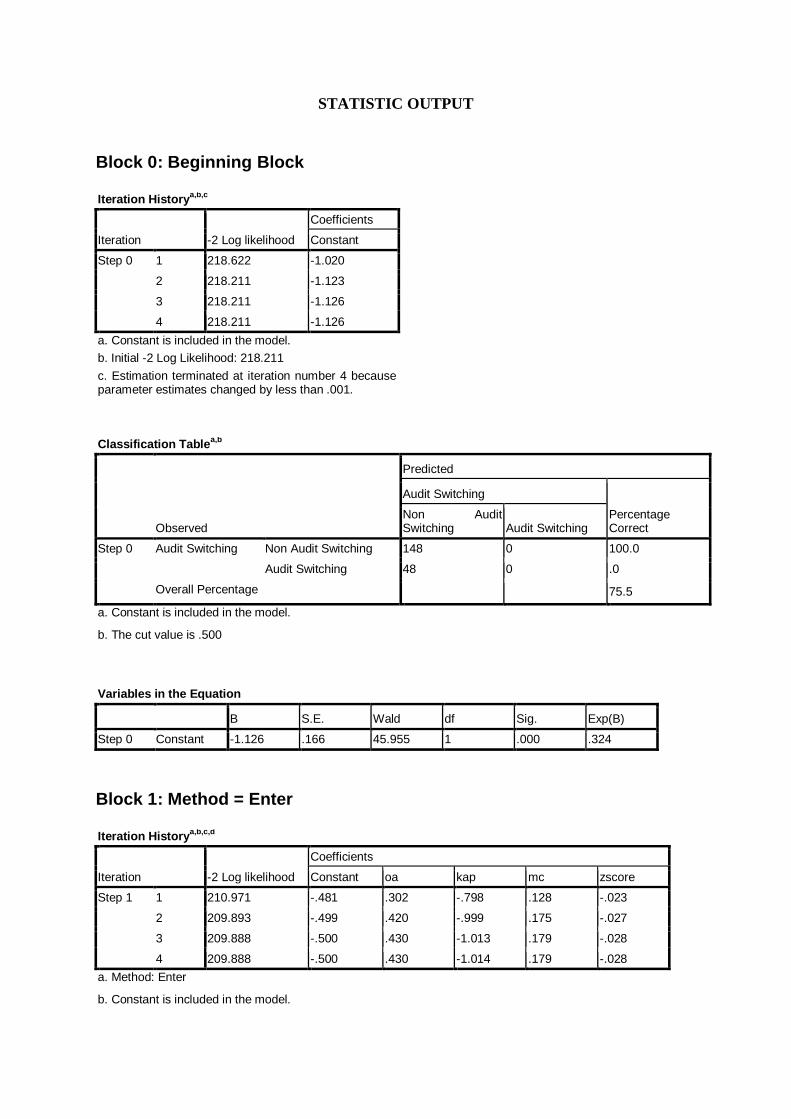
STATISTIC OUTPUT
Block 0: Beginning Block
Iteration History
a,b,c
Iteration -2 Log likelihood
Coefficients
Constant
Step 0 1 218.622 -1.020
2 218.211 -1.123
3 218.211 -1.126
4 218.211 -1.126
a. Constant is included in the model.
b. Initial -2 Log Likelihood: 218.211
c. Estimation terminated at iteration number 4 because parameter estimates changed by less than .001.
Classification Table
a,b
Observed
Predicted
Audit Switching
Percentage Correct
Non Audit Switching Audit Switching
Step 0 Audit Switching Non Audit Switching 148 0 100.0
Audit Switching 48 0 .0
Overall Percentage 75.5
a. Constant is included in the model.
b. The cut value is .500
Variables in the Equation
B S.E. Wald df Sig. Exp(B)
Step 0 Constant -1.126 .166 45.955 1 .000 .324
Block 1: Method = Enter
Iteration History
a,b,c,d
Iteration -2 Log likelihood
Coefficients
Constant oa kap mc zscore
Step 1 1 210.971 -.481 .302 -.798 .128 -.023
2 209.893 -.499 .420 -.999 .175 -.027
3 209.888 -.500 .430 -1.013 .179 -.028
4 209.888 -.500 .430 -1.014 .179 -.028
a. Method: Enter
b. Constant is included in the model.

Iteration Historya,b,c,d
Iteration -2 Log likelihood
Coefficients
Constant oa kap mc zscore
Step 1 1 210.971 -.481 .302 -.798 .128 -.023
2 209.893 -.499 .420 -.999 .175 -.027
3 209.888 -.500 .430 -1.013 .179 -.028
4 209.888 -.500 .430 -1.014 .179 -.028
a. Method: Enter
b. Constant is included in the model.
c. Initial -2 Log Likelihood: 218.211
d. Estimation terminated at iteration number 4 because parameter estimates changed by less than .001.
Omnibus Tests of Model Coefficients
Chi-square df Sig.
Step 1 Step 8.322 4 .080
Block 8.322 4 .080
Model 8.322 4 .080
Model Summary
Step -2 Log likelihood Cox & Snell R Square
Nagelkerke R Square
1 209.888a .042 .062
a. Estimation terminated at iteration number 4 because parameter estimates changed by less than .001.
Hosmer and Lemeshow Test
Step Chi-square df Sig.
1 3.409 8 .906
Variables in the Equation
B S.E. Wald df Sig. Exp(B)
Step 1a oa .430 .908 .224 1 .636 1.537
kap -1.014 .357 8.042 1 .005 .363
mc .179 .381 .221 1 .639 1.196
zscore -.028 .039 .503 1 .478 .973
Constant -.500 .306 2.674 1 .102 .606
a. Variable(s) entered on step 1: oa, kap, mc, zscore.

Correlation Matrix
Constant oa kap mc zscore
Step 1 Constant 1.000 .104 -.717 -.366 -.287
oa .104 1.000 -.156 -.297 .017
kap -.717 -.156 1.000 .002 .162
mc -.366 -.297 .002 1.000 -.005
zscore -.287 .017 .162 -.005 1.000
.