Embed Size (px)
Citation preview

CDH Energy Corp. 1 March 26, 2012
Analysis of Flow Meters at CT Transit, Hartford, CT CDH was on site on August 23, 2012 and September 27, 2012 to check the water flow sensors at the site. Flow readings were compared against a strap-on ultrasonic flow meter. The specs for the instruments are given below: Ultrasonic Flow Meter Fuji PortaFlow-C Ultrasonic (transit-time) meter
FSD22 sensing element
FL, FH
FCH
Onicon F-1211 Flow Meter, 4-20mA signal
Onicon F-1111 Flow Meter, 4-20mA signal
Pipe dimensions FL 3 in Schedule 40 steel FH 3 in Schedule 40 steel FCH 2 in Type L Copper
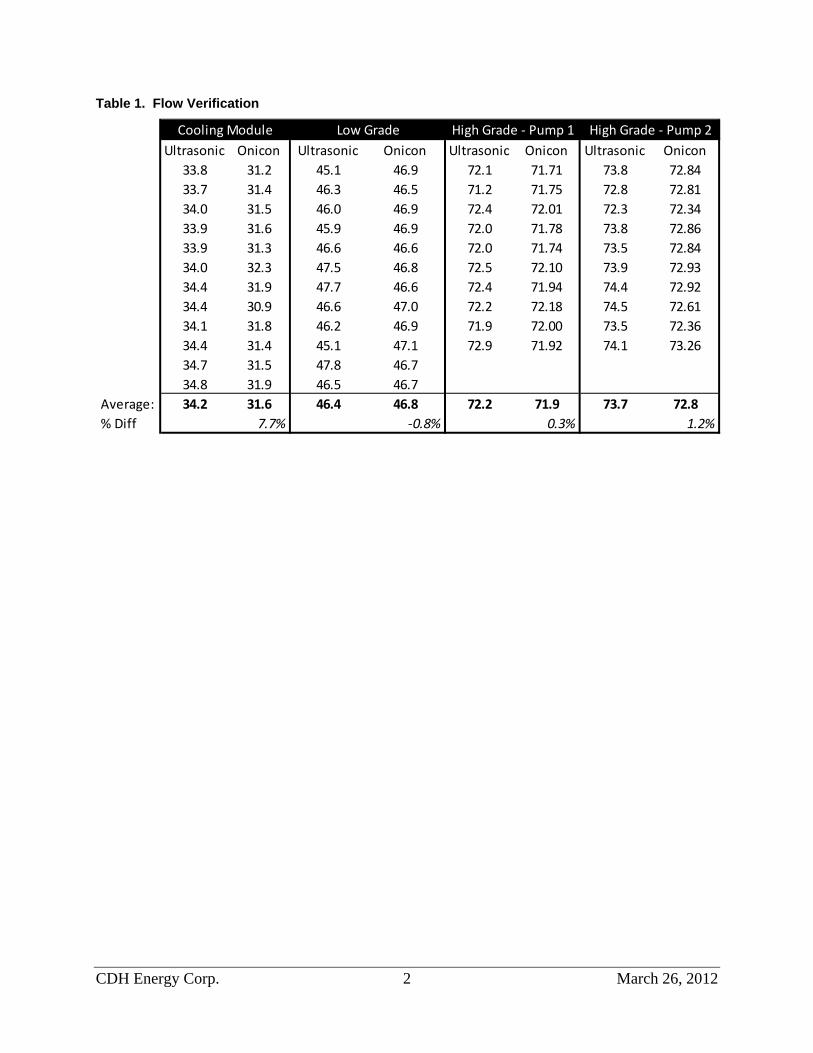
Flow Verification The ultrasonic flow meter was used to verify the readings produced by the Onicon meters. The meter was strapped to the pipe in each loop and a set of readings was taken. High grade flow was verified on August 23 by comparing the flows read by the Onicon flow meter to the flows read by the ultrasonic flow meter. Also on this visit, water damage was discovered in the cooling module flow meter, which was then removed, to be replaced at a later date. Low grade flow was not verified on this date due to the ultrasonic flow meter not being able to get a consistent signal when strapped to the low grade pipe. During Testing and Balancing, the high and low grade flows were measured to be approximately 70 gpm using a Hydrodata flow meter, which measures the pressure differential before and after the pump. On September 27, CDH installed a replacement flow meter for the cooling module and verified the flows produced with the new flow meter by comparing the flows read by the Onicon flow meter to the flows read by the ultrasonic flow meter. Low grade flow was also verified with the ultrasonic flow meter. However, in order to verify the flows, it was necessary to repeatedly bleed air out of the low grade pipe by opening the ball valve slightly. This allowed the ultrasonic flow meter to get a consistent signal until more air built up in the pipe. At this point, more air was bled from the system. However, the low grade flow read by the Onicon flow meter verified within one percent when compared to the ultrasonic flow meter.
CDH Energy Corp. 2 March 26, 2012
Table 1. Flow Verification
Ultrasonic Onicon Ultrasonic Onicon Ultrasonic Onicon Ultrasonic Onicon33.8 31.2 45.1 46.9 72.1 71.71 73.8 72.8433.7 31.4 46.3 46.5 71.2 71.75 72.8 72.8134.0 31.5 46.0 46.9 72.4 72.01 72.3 72.3433.9 31.6 45.9 46.9 72.0 71.78 73.8 72.8633.9 31.3 46.6 46.6 72.0 71.74 73.5 72.8434.0 32.3 47.5 46.8 72.5 72.10 73.9 72.9334.4 31.9 47.7 46.6 72.4 71.94 74.4 72.9234.4 30.9 46.6 47.0 72.2 72.18 74.5 72.6134.1 31.8 46.2 46.9 71.9 72.00 73.5 72.3634.4 31.4 45.1 47.1 72.9 71.92 74.1 73.2634.7 31.5 47.8 46.734.8 31.9 46.5 46.7
Average: 34.2 31.6 46.4 46.8 72.2 71.9 73.7 72.8% Diff 7.7% ‐0.8% 0.3% 1.2%
Cooling Module Low Grade High Grade ‐ Pump 1 High Grade ‐ Pump 2

CDH Ene
Appen
Figure 1.
ergy Corp.
ndix A —
System Tem
— Histor
mperature Re
rical Dat
eadings Ove
3
ta Chart
er Life of Pro
ts & Gra
oject
aphs
March 26, 2012

CDH Ene
Figure 2.
ergy Corp.
High Gradee, Low Gradee, and Coolin
4
ng Module Flow Rates Ovver Life of Pr
March 26,
roject
2012

CDH Ene
Figure 3.
ergy Corp.
Heat Recovvery in Each Loop Over t
5
he Life of thee Project
March 26, 2012

CDH Energy Corp. 6 March 26, 2012
Appendix B — Calibration Certificates for Onicon Flow Meters
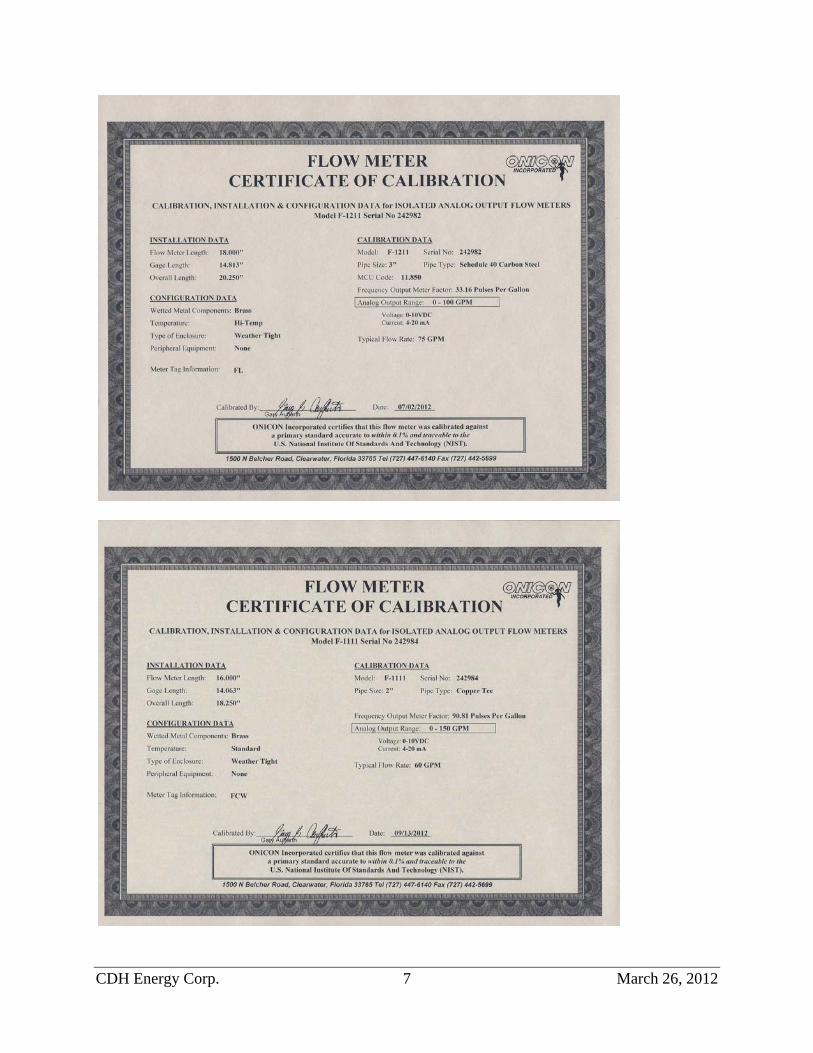
CDH Energy Corp. 7 March 26, 2012


![The Hartford republican. (Hartford, KY) 1903-03-06 [p ]](https://img.pdfslide.net/doc/110x75/61a0afc1d05d2f067c3828b5/the-hartford-republican-hartford-ky-1903-03-06-p-.jpg)