Embed Size (px)
Citation preview
An advance, unedited version
Draft funding report of the Secretary-General
Analysis of funding of operational activities for
development of the United Nations system for the year
2011
Development Cooperation Policy Branch Department of Economic and Social Affairs United Nations
14 June 2013
ii
SUMMARY
(a) Contributions
Real-term decline in total contributions in 2011
Total contributions to operational activities for development of the United Nations system in 2011
amounted to some $22.8 billion, about the same as in 2010 in nominal terms and 6.9 per cent less in
real terms. Total contributions were equivalent to about 15 per cent of total official development
assistance (ODA) (excluding debt relief) as reported by the OECD/DAC. About 67 per cent of funding
was directed to longer-term development-related activities against 33 per cent to activities with a
humanitarian assistance focus. This is similar to the distribution in 2010.
Most of the decline attributed to non-core funding
Total core contributions to operational activities for development amounted to $6.3 billion in 2011,
about the same in real terms as in 2010. A decline of 3 per cent in core funding for development-related
activities was offset by an increase of 12 per cent in core funding for humanitarian assistance-related
activities. Non-core funding for operational activities for development and development-related
activities declined in real terms by 9 and 11 per cent, respectively, in 2011.
Imbalance between core and non-core funding continues
Some 72 per cent of total funding for operational activities for development in 2011 were non-core
against 74 per cent in 2010. As can be expected, the non-core component of funding for humanitarian
assistance-related activities was at 81 per cent, or higher than the 68 per cent for development-related
activities. The global imbalance between core and non-core resources for development-related activities
is not primarily driven by direct contributions by DAC governments but by funding from other sources
like the European Commission and global funds.
Longer-term funding trends positive
In the period from 1996 to 2011, overall trends have been positive for both development- and
humanitarian assistance-related activities. In this 15-year period, funding for development-related
activities and humanitarian assistance-related activities more than doubled in real terms; the non-core
component of development-related contributions grew strongest, by about three-and-half times.
Overall, contributions for United Nations operational activities for development grew at a faster rate
during this 15-year period than total ODA as reported by the OECD/DAC. Almost all of this growth was in
the form of non-core resources, resulting in the core ratio for operational activities for development as a
whole declining from 50 per cent in 1996 to 28 per cent in 2011 and for development-related activities
alone from 60 per cent in 1996 to 32 per cent in 2011.
Shorter-term funding trends more even
Since 2006, total funding for UN-OAD has grown for the first time at a slower pace than total ODA
pointing at a declining trend in the share of total ODA being channelled through the United Nations
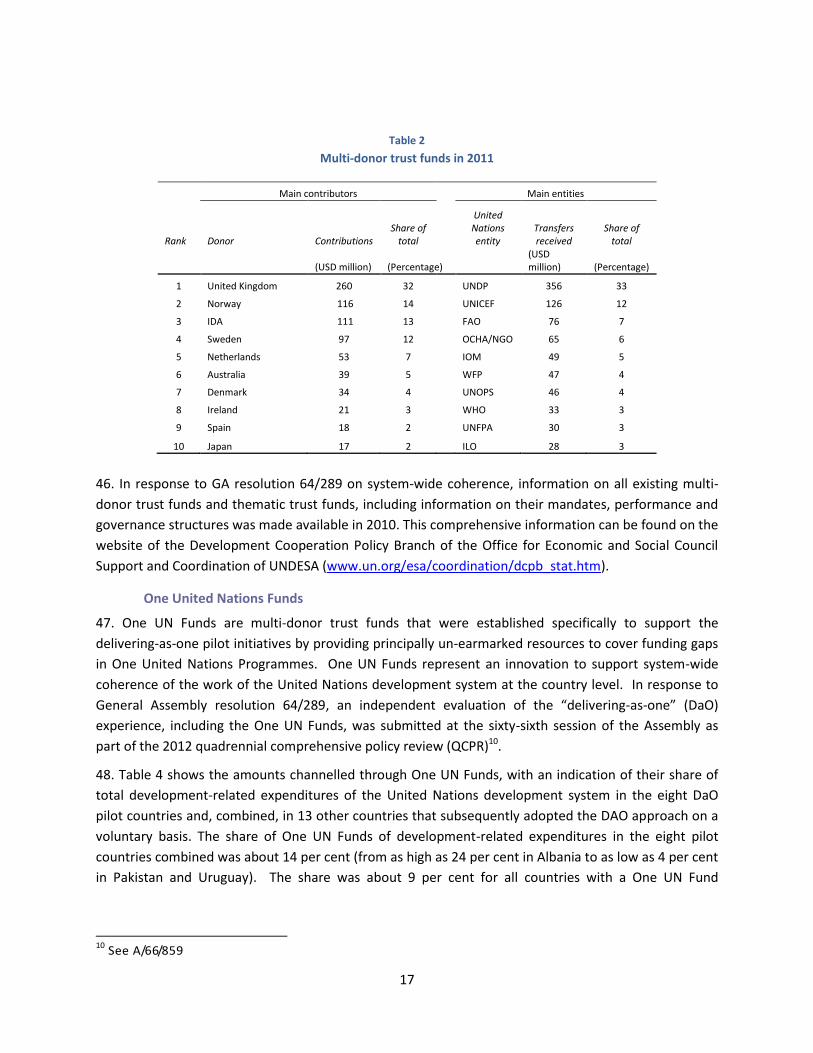
development system. Over the last four years, total contributions in nominal terms remained at
iii
approximately the same level with some modest nominal growth in development-related funding offset
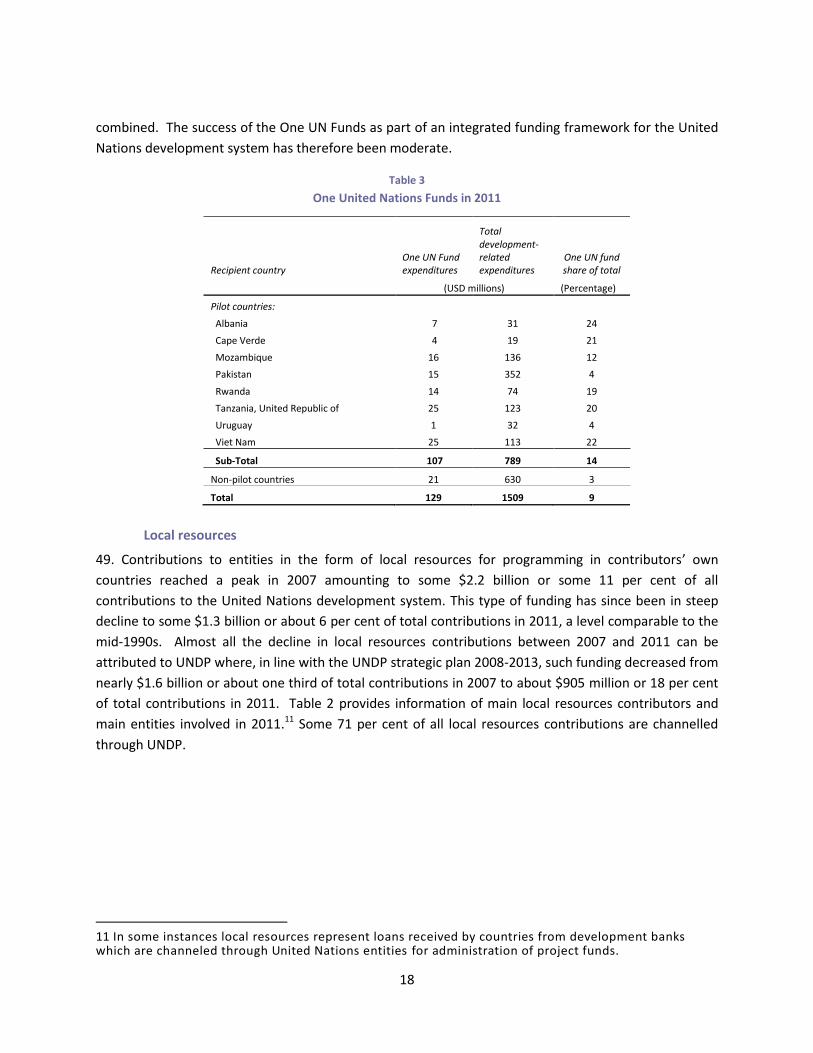
by a decrease in humanitarian assistance-related activities.
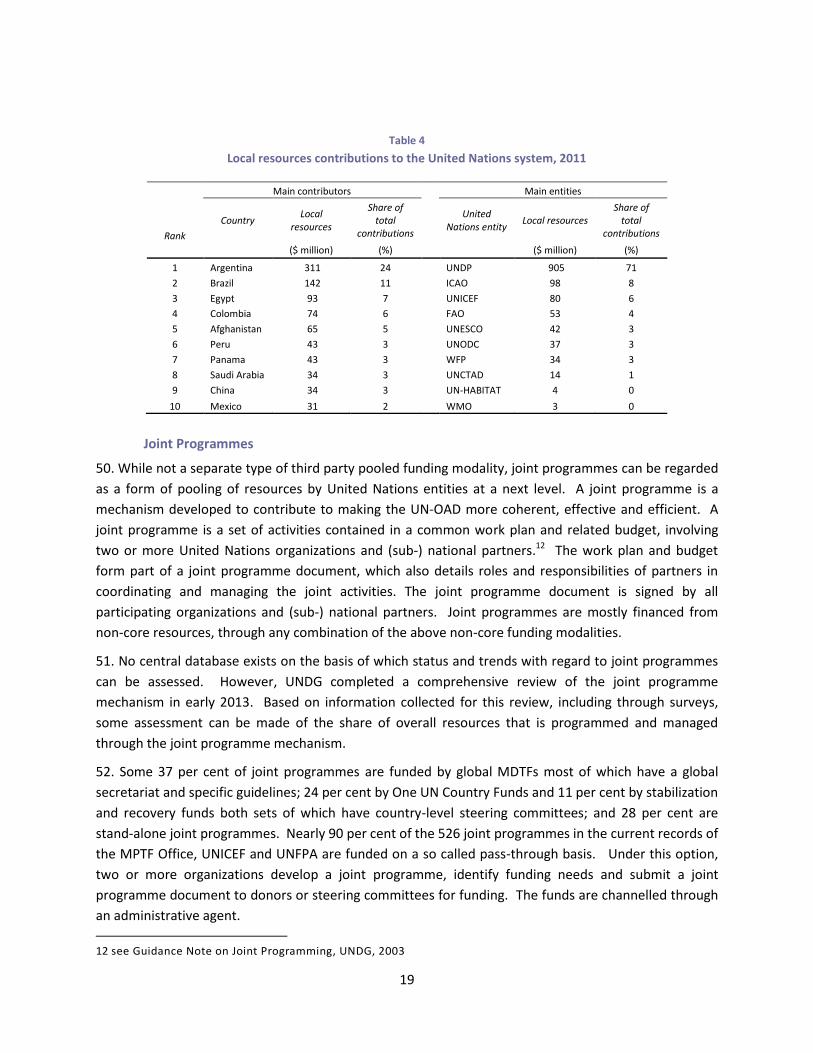
Funding base broadened
The funding base for operational activities for development has seen general broadening. While the
absolute volume of direct contributions of OECD/DAC countries increased by 83 per cent in real terms
between 1995 and 2011, its overall share of total funding has declined from 76 to 63 per cent. Similarly,
for development-related activities alone the OECD/DAC share has declined from 71 per cent in 1995 to
60 per cent to 2011. The share of contributions from non-governmental organizations, public-private
partnerships and other multilateral institutions (including global funds) for development-related
activities increased from 9 per cent in 1995 to 21 per cent in 2011. In 2005, the share was 17 per cent
indicating that the broadening of the funding base has continued in the shorter-term.
United Nations system the largest multilateral partner of OECD/DAC countries
Some 27 per cent of all direct contributions to the multilateral system in 2011 as reported by the
OECD/DAC were channelled through the United Nations development system, making the Organization
the largest multilateral partner of DAC countries.
Contributions from developing countries growing
Contributions from developing countries (excluding local resources) for operational activities for
development were $562 million in 2011 and have increased by some 16 per cent in nominal terms since
2006. About half of this funding was in the form of core contributions.
Non-core pooled funding and joint programmes still a small share of total non-core
Some 90 per cent of non-core funding for development-related activities in 2011 was predominantly
single-donor and programme- and project-specific, thereby contributing to the fragmentation of
resources flows, with a consequent impact on overall programme coherence, efficiencies and
transaction costs. Contributions to pooled funding arrangements like multi-donor trust funds, including
One UN Funds and thematic funds of entities, accounted for the remaining 10 per cent of non-core
resource flows. The value of newly approved joint programmes in 2011 financed from any combination
of the above modalities was less than 3 per cent of total non-core funding in 2011.
(b) Expenditures
General
Some 72 per cent of the total expenditures of $25.1 billion for operational activities for development in
2011 focused on programme activities at the country level of which 47 per cent or $8.5 billion in Africa.
The remaining 28 per cent of total expenditures related to global and regional programme activities and
programme support and management activities. Some entities refer to programme support as
development effectiveness. Programme support and management costs are those that in QCPR-related
discussions on cost recovery have been referred to as so-called non-programme costs.
iv
Expenditures on development-related activities reached $17.2 billion in 2011, an increase of 19 per cent
in real terms since 2006. About half of development-related expenditures (excluding local resources) at
country-level were spent in low-income countries in 2011.
(c) Selected Issues
No significant change in predictability of resources flows
Annual changes in donor contributions can be quite significant, including as a result of volatility in
exchange rates. The combined negative effect of fluctuations in contributions on the overall availability
of resources has been limited during the recent period of general growth. However, this relative stability
seems to be the result of coincidence rather than of a well-functioning funding system that has built-in
mechanisms to address the challenges that are intrinsic to a heavy dependency on annual voluntary
contributions. By and large, no significant change has occurred in predictability, reliability and stability of
funding flows, despite the adoption of integrated strategic and multi-year financing frameworks by
entities of the United Nations development system.
Introduction of common budgetary frameworks at country level
Common budgetary frameworks (CBFs) to strengthen the quality of system-wide resource planning and
mobilization and to enhance transparency at the country level have been introduced in 30 countries, or
28 per cent of the countries covered by a survey of resident coordinators, two-and-a-half years after
UNDG issued specific guidance in this regard. The countries with CBFs so far include the eight DaO pilot
countries, 14 self-starters, and eight others. This take-up is to be welcomed considering that the use of
a CBF has hitherto been optional. With the QCPR resolution, the CBF has become a requirement in all
countries. Much remains to be done with regard to United Nations entities providing the necessary
information on funding commitments and programme implementation in general.
Burden-sharing among OECD/DAC countries uneven
OECD/DAC countries accounted for 83 per cent of total core resources for development-related
activities in 2011, with a significant difference in individual contributions if measured as a share of gross
national income. If the 2011 median ratio between core development-related funding and gross
national income (DEV/GNI) were to be set as a minimum target for a successful system of negotiated
pledges, total core contributions would increase by some $2.4 billion or 58 per cent to $6.7 billion.
Alignment of newly approved cost recovery frameworks with resolution A/67/226
There is a significant difference in the distribution of total programme support and management costs
(non-programme costs) between core and non-core funding sources. In its resolution 67/226, the
General Assembly reaffirmed that the guiding principle governing the financing of all non-programme
costs should be based on full cost recovery, proportionally, from core and non-core funding sources.
It should be noted that the QCPR coincided with a review by UNDP, UNICEF, UNFPA and UN-Women of a
harmonized cost recovery rate and new calculation methodology as part of a joint roadmap to the first
integrated budgets that these entities will submit for approval to their respective Executive Boards in
v
2013 and that will cover the period 2014-2017 . The intention of the new cost recovery methodology,
which was subsequently approved by the respective Executive Boards in January 2013, is to better align
the funding of organizational costs between core and non-core resources in similar proportions as
corresponding programme resources. These four entities combined account for some 58 per cent of all
development-related operational activities (54 per cent of all core and 60 per cent of all non-core).
Work of the United Nations development system only moderately concentrated
The United Nations development system as a whole is moderately concentrated, with 50 programme
countries, or 34 per cent of the total, accounting for some 80 per cent of all country-level expenditures
in 2011. In 59 programme countries, or 40 per cent of the total, operational activities for development
accounted for less than 10 per cent of total ODA in 2011.
The entities of the United Nations development system that reported country-level expenditures
together had 1,998 relationships with 147 programme countries in 2011. About half of those
relationships were significant in financial terms. In 2011, about one-third of operational activities for
development were carried out by entities whose operations can be characterized by a degree of
concentration that was above average.
Concept of critical mass under consideration
General Assembly resolution 67/226 requests the funds and programmes to develop common principles
for the concept of critical mass of core resources and to present specific proposals to their respective
governing bodies by the end of 2013 with a view to decision by 2014. At the time of finalizing the
current report, the issue of critical mass of core resources has not yet been taken up by the Executive
Boards of the funds and programmes. However, entities report that discussions on critical mass are
taking place in preparation for their eventual presentation to the Executive Boards in keeping with the
timeline in the QCPR resolution.
RECOMMENDATIONS
1. Takes note (with appreciation) of the report of the Secretary-General on Analysis of funding of
operational activities for development of the United Nations system for the year 2011.
2. Welcomes the Secretary-General’s continuous efforts to strengthen the coverage, timeliness,
reliability, quality and comparability of system-wide data, including with regard to definitions and
classifications, for financial reporting on operational activities for development.
3. Recognizes that the report contains, amongst others, the information, context and analyses that are
relevant for the assessment of progress in the implementation of funding related provisions of
resolution 67/226 on the Quadrennial comprehensive policy review of United Nations operational
activities for development (section II, paragraphs 24-56).
vi
4. Reaffirms in this regard those provisions of resolution 67/226 and which cover (i) general principles;
(ii) enhanced overall funding, particularly core resources; (iii) the improvement of the predictability and
quality of resources; and (iv) the ensuring of full cost recovery.
5. Approves the approach and methodology developed in the report for assessing progress in
implementation and as summarized in the indicator framework (Annex 1) which itself forms part of the
broader framework that has been developed for the assessment of progress in the implementation of
resolution 67/226 in general.
6. Recognizes that the report contains already some of the baseline data and information against which
progress in implementation of resolution 67/226 can be measured and that these will be further
developed in the next edition of the report which will be based on 2012 data.
vi
TABLE OF CONTENTS
LIST OF ACRONYMS ............................................................................................................................................ ix
1. INTRODUCTION ............................................................................................................................................. 1
2. OVERVIEW ..................................................................................................................................................... 4
3. MORE DETAILED ANALYSIS ......................................................................................................................... 10
(a) Contributions .............................................................................................................................. 10
(b) Expenditures ............................................................................................................................... 20
4. SELECTED ISSUES ......................................................................................................................................... 28
(a) Predictability of core and non-core funding ............................................................................... 28
(b) Burden-sharing ............................................................................................................................ 33
(c) Non-core funding and cost recovery .......................................................................................... 35
(d) Concentration and fragmentation .............................................................................................. 39
(e) Critical mass of core funding ....................................................................................................... 42
5. ANNEXES ........................................................................................................................................................ 43
Annex I: Indicator Framework ................................................................................................................ 43
Annex II: Technical note on definitions, sources and coverage .............................................................. 47
Annex III: Differences in OECD/DAC and United Nations system reporting ........................................... 50
Annex IV: Total ODA flows, 2011 ............................................................................................................ 52
Annex V: Burden sharing......................................................................................................................... 53
Annex VI: Concentration ratio of United Nations entities, 2011 ............................................................ 54
Annex VII: Country groupings ................................................................................................................. 55
Annex VIII: List of statistical tables posted on the web site of DCPB/OESC/ UNDESA ........................... 60
vii
Page
List of tables and figures
Tables
1. Change over time of funding for UN-OAD, 1996-2011 . . . . . . . . . . . . . . . . . . . . . . . . . . . . . . . . 11
2. Multi-donor trust funds, 2011 . . . . . . . . . . . . . . . . . . . . . . . . . . . . . . . . . . . . . . . . . . . . . . . . . . . . 17
3. One United Nations Funds in 2011 . . . . . . . . . . . . . . . . . . . . . . . . . . . . . . . . . . . . . . . . . . . . . . . . 18
4. Local resources contributions to the United Nations system, 2011 . . . . . . . . . . . . . . . . . . . . . 19
5. Expenditures on operational activities for development, 2006-2011 . . . . . . . . . . . . . . . . . . . 21
6. Top 10 programme countries, 2011 . . . . . . . . . . . . . . . . . . . . . . . . . . . . . . . . . . . . . . . . . . . . . . . 22
7. Programme expenditures in top 10 programme countries, 2011 . . . . . . . . . . . . . . . . . . . . . . . 24
8. Programme expenditures in top 10 programme countries in terms of core resources, 2011 27
9. High-level breakdown of development-related operational activities, 2011 . . . . . . . . . . . . . 37
10. Fragmentation ratio in programme countries, 2011 41
11. Country-level UN-OAD as a share of ODA, 2011 42
Figures
1. Financing of UN system-wide activities: 2011 . . . . . . . . . . . . . . . . . . . . . . . . . . . . . . . . . . . . . . . 2
2. Funding for UN-OAD, by type: 2011 4
3. Real change over time of funding for UN-OAD, 1996-2011 . . . . . . . . . . . . . . . . . . . . . . . . . . . . 5
4. Channels of multilateral aid, 2011 . . . . . . . . . . . . . . . . . . . . . . . . . . . . . . . . . . . . . . . . . . . . . . . . 6
5. Sources of funding for UN-OAD, 2011 6
6. Main contributors to UN-OAD, 2011 7
7. Main entities for UN-OAD, 2011 8
8. UN-OAD expenditures by region, 2011 9
9. UN-OAD expenditures in the top 50 programme countries 9
10. Country-level UN-OAD as a share of ODA, 2011 . . . . . . . . . . . . . . . . . . . . . . . . . . . . . . . . . . . . 10
11. Average annual growth-rates of ODA and UN-OAD . . . . . . . . . . . . . . . . . . . . . . . . . . . . . . . . . . 11
12. Main sources of funding, 1995-2011 13
13. Main contributors to UN development-related activities, 2011 . . . . . . . . . . . . . . . . . . . . . . . . 14
viii
14. Main entities for UN development-related activities, 2011 15
15. Non-core funding modalities for UN development-related activities, 2011 . . . . . . . . . . . . . . 15
16. UN-OAD expenditures by main entities . . . . . . . . . . . . . . . . . . . . . . . . . . . . . . . . . . . . . . . . . . . 21
17. Expenditures on development-related activities, by region: 2011 . . . . . . . . . . . . . . . . . . . . . . 23
18. Development-related expenditures – top 120 countries, 2011 23
19. Development-related operational activities by major country groupings, 2011 . . . . . . . . . . . 25
20. Development-related operational activities by major country groupings, 2011: comparison
of core, non-core and total funding . . . . . . . . . . . . . . . . . . . . . . . . . . . . . . . . . . . . . . . . . . . . . . . 25
21. Development-related expenditures – top 120 countries (core resources), 2011 . . . . . . . . . . 26
22. Correlation between core and non-core components, 2011 27
23. Voluntary contributions, 2005-2011: changes relative to 2005 29
24. Changes in core contributions by top donors, 2006-2011 29
25. Changes in non-core contributions by top donors, 2006-2011 29
26. Currency exchange rates, 2005-2011 30
27. UNICEF contributions - core 31
28. Core contributions by DAC countries relative to GNI, 2011 34
Tables — Annex I
Indicator Framework 44
Tables — Annex II
1. Percentage of assessed or regular budget contributions defined as being for UN-OAD . . . . 47
2. Terms used by different entities for core and non-core contributions . . . . . . . . . . . . . . . . . . 48
Table — Annex III
Differences between United Nations and OECD/DAC reporting on contributions for UN-
OAD, 2011 50
Table – Annex IV
Total ODA flows, 2011 52
Table – Annex V
Burden-sharing, 2011 53
Table – Annex VI
ix
Concentration ratio of United Nations entities, 2011 ............................................................. 54
Table – Annex VII
Country groupings 55
Table – Annex VIII
List of statistical tables posted on the web site of DCPB/OESC/ UNDESA ............................... 59
LIST OF ACRONYMS
CEB United Nations Chief Executives Board for Coordination
CBF Common Budgetary Framework
CRS Creditor Reporting System
DAC Development Assistance Committee
DaO Delivering as One
DEV Development-related activities
ECA Economic Commission for Africa
ECE Economic Commission for Europe
ECLAC Economic Commission for Latin America and the Caribbean
ESCAP Economic and Social Commission for Asia and the Pacific
ESCWA Economic and Social Commission for Western Asia
FAO Food and Agriculture Organization of the United Nations
GEF Global Environment Facility
GFATM The Global Fund to Fight AIDS, Tuberculosis and Malaria
GNI Gross national income
HDI Human Development Index
IAEA International Atomic Energy Agency
ICAO International Civil Aviation Organization
IFAD International Fund for Agricultural Development
ILO International Labour Organization
IMO International Maritime Organization
ITC International Trade Centre
ITU International Telecommunication Union
LDC Least developed country
LLDC Landlocked developing country
MDTF Multi-donor trust fund
x
MPTF Multi-partner trust fund
ODA Official Development Assistance
OECD Organization for Economic Cooperation and Development
OHCHR Office of the United Nations High Commissioner for Human Rights
PPMC Pearson product-moment correlation coefficient
QCPR Quadrennial comprehensive policy review
SSC South-South Development Cooperation
UNAIDS Joint United Nations Programme on HIV/AIDS
UNCDF United Nations Capital Development Fund
UNCTAD United Nations Conference on Trade and Development
UNDAF United Nations Development Assistance Framework
UNDESA United Nations Department of Economic and Social Affairs
UNDS United Nations Development System
UNDG United Nations Development Group
UNDP United Nations Development Programme
UNEP United Nations Environment Programme
UNESCO United Nations Educational, Scientific and Cultural Organization
UNFPA United Nations Population Fund
UN-Habitat United Nations Human Settlements Programme
UNHCR Office of the United Nations High Commissioner for Refugees
UNICEF United Nations Children’s Fund
UNIDO United Nations Industrial Development Organization
UN-IMCs United Nations integrated mission countries
UN-OAD United Nations operational activities for development
UNODC United Nations Office on Drugs and Crime
UNRWA United Nations Relief and Works Agency for Palestine Refugees in the Near East
UNV United Nations Volunteers
UNWTO World Tourism Organization
UPU Universal Postal Union
USD United States dollars
WB World Bank
WFP World Food Programme
WHO World Health Organization
WIPO World Intellectual Property Organization
WMO World Meteorological Organization
1
1. INTRODUCTION
Structure and coverage of the report
1. This report focuses on the thirty-seven United Nations system entities (funds, programmes and
agencies) that received funding for operational activities for development in 2011. These entities
constitute what is generally referred to as the United Nations development system and together
accounted for over 95 per cent of all United Nations system-wide operational activities for development.
Detailed statistical data used as the basis for the presentations and analyses in the present report are
contained in the Statistical Annex which is available on the web site of the Development Cooperation
Policy Branch of the Office for ECOSOC Support and Coordination of UNDESA.1
System-wide reporting: opportunities and challenges
2. There are currently three main actors who report on funding for the United Nations system: the
United Nations Department of Economic and Social Affairs (UNDESA), the United Nations Chief
Executives Board for Coordination (CEB) and the Development Assistance Committee of the
Organization for Economic Co-operation and Development (OECD/DAC). UNDESA and OECD/DAC focus
on operational activities for development, each from a different perspective. CEB focuses more
generally on the overall budgetary and financial situation of the entities of the United Nations system.
3. With regard to access to information, in resolution 63/311, the General Assembly requested the
Secretary-General to establish a central repository of information on United Nations operational
activities for development. The first phase of this central repository became operational in 2012 as
part of the financial statistics database and reporting system that is being developed by the CEB.
Through collaboration, the Department and the CEB secretariat already rationalized and harmonized
part of the data collection for the present report. Work continues to further streamline and harmonize
data collection processes in order to reduce the workload on the data providers as much as possible.
4. Annex II contains a technical note on issues and challenges pertaining to system-wide reporting.
These relate to the use of terminology, sources and coverage, as well as comparability of data and
information between the different United Nations entities. Annex III looks at the differences in the way
the United Nations system and OECD/DAC report on core and non-core contributions and expenditures
for United Nations operational activities for development.
Operational activities for development
5. United Nations operational activities for development (UN-OAD) are activities that United Nations
entities carry out with the promotion of development as the primary objective. A number of entities
have specific mandates in this regard. UN-OAD cover both longer-term development activities
(development-related) as well as those with a shorter-term humanitarian assistance (humanitarian
assistance-related) focus.
6. With regard to the distinction between development- and humanitarian assistance-related activities,
no harmonized system-wide classification exists. For purposes of the present report, and pending the
1 http://www.un.org/esa/coordination/
2
introduction of a harmonized classification system, all activities of UNHCR, UNRWA, and OCHA,
emergency operations of UNICEF (some 26 per cent of all UNICEF activities) and humanitarian
operations of WFP (some 92 per cent of all WFP activities) are considered to be humanitarian
assistance-related. Accordingly all other activities are treated as being development-related. Many of
the more detailed analyses contained in the current report concern the development-related activities
in particular.
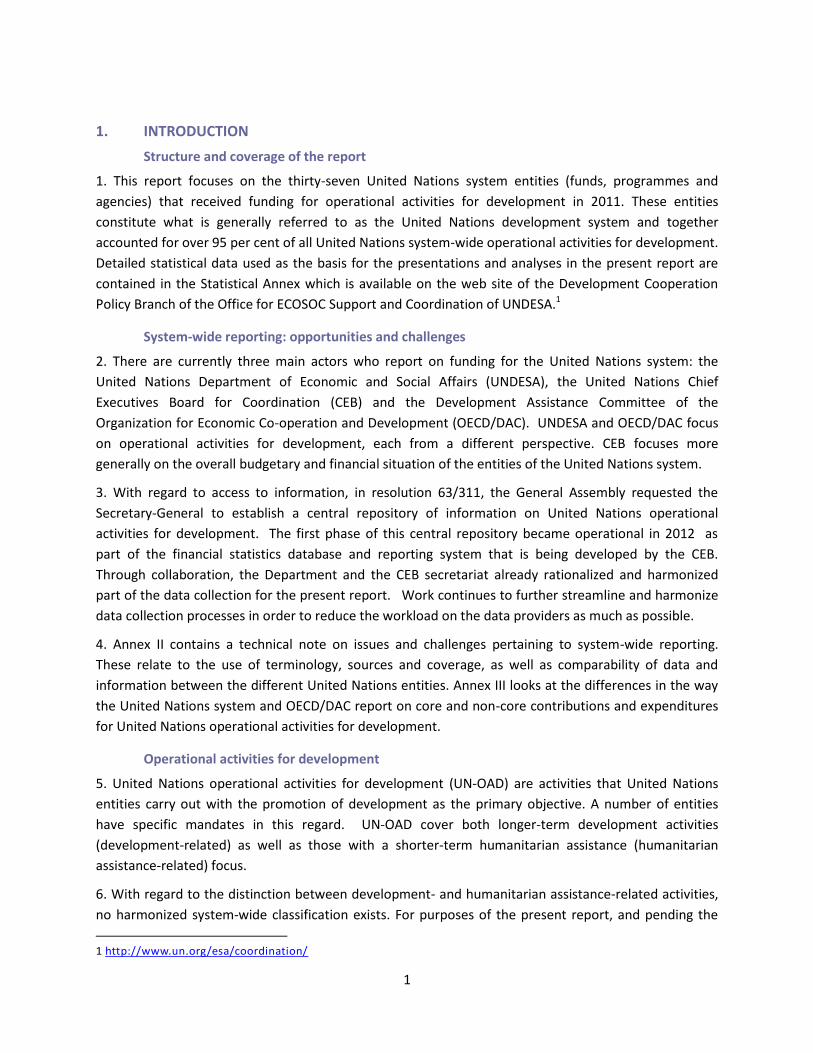
7. As reflected in Figure 1, UN-OAD in 2011 accounted for about 63 per cent ($22.8 billion) of all United
Nations system-wide activities ($36 billion). Peacekeeping operations accounted for 21 per cent ($7.6
billion) and the global norm and standard-setting, policy and advocacy functions of the United Nations
system accounted for the remaining 16 per cent ($5.6 billion).
Figure 1
Core and non-core resources
8. UN-OAD are funded by a combination of so-called core and non-core resources. Core resources are
those that are commingled without restrictions and whose use and application are directly linked to the
entities’ multilateral mandates and strategic plans that are approved by the respective governing bodies
as part of an established intergovernmental process.
9. In contrast, and as determined by the contributors, non-core resources are mostly earmarked and
thus restricted with regard to their use and application. There is therefore not necessarily a direct link
between activities financed by non-core resources and the multilateral mandates and strategic plans
approved by governing bodies. In some instances governing bodies formally approve the use of core
resources while “taking note” of the use of non-core resources.
10. Core or unrestricted aid is generally seen as the most efficient way of building relevant and effective
partnerships with programme countries in the delivery of operational activities for development. Core
resources provide the highest quality, flexibility and efficiency of pooled funding. They are critical for
ensuring that entities have adequate capacity to deliver on their multilateral mandates and provide
continued substantive leadership and innovation around specific goals, advocacy and policy work in
addition to programmatic implementation on the ground. Core resources are central to ensuring the
3
United Nations development system’s independence, neutrality and role as a trusted partner in a rapidly
changing development cooperation landscape.
11. Restricted aid in the form of non-core resources, on the other hand, is often seen as potentially
distorting programme priorities by limiting the proportion of funding that is directly regulated by
intergovernmental governing bodies and processes. Restricted aid is further seen as contributing to
fragmentation, competition and overlap among entities and providing a disincentive for pursuing United
Nations system-wide focus, strategic positioning and coherence. In addition, restricted aid is found to
increase transaction costs, especially because of its predominantly single-donor and programme- and
project-specific nature.
12. Financing of UN-OAD in the form of non-core resources has grown significantly over time and
accounted for some 72 per cent of total resources in 2011 as compared to 50 per cent in 1996. Looking
at development-related activities alone, non-core resources accounted for some 68 per cent of total
resources in 2011 as compared to 40 per cent in 1996.
13. Some 8 per cent of non-core resources are in the form of so-called local resources, i.e. resources that
programme countries contribute to entities for programming in the country itself. Whenever so
indicated and deemed appropriate, this component is excluded in some of the analyses presented in the
current report.
Official development assistance (ODA) and other aid
14. The report makes several references to Official Development Assistance (ODA) when analyses are
made to compare UN-OAD with other development assistance. Two versions of ODA (excluding debt
relief) are being used, both as defined by OECD/DAC: (i) ODA provided by OECD/DAC governments only
(2011: $129.5 billion); and (ii) total ODA (2011: $139.2 billion). Total ODA includes aid flows that are
reported to OECD/DAC by countries that are not members of OECD/DAC. Annex IV provides further
information on the different components of total ODA. It is understood that neither one of the above
versions of ODA captures the totality of development cooperation2.
Current versus real terms
15. In this report, comparisons and trend analyses in “real terms” are based on amounts expressed in
constant 2010 United States dollars by applying deflators published by OECD/DAC. These deflators take
into account the combined effect of inflation and exchange rate movements.
Quadrennial comprehensive policy review - follow up
16. In January 2013 the General Assembly passed resolution A/67/226 on the Quadrennial
comprehensive policy review of United Nations operational activities for development (QCPR). This
regular report on funding of UN-OAD contains the information, context and analyses that are relevant
for the assessment of progress in the implementation of funding-related provisions contained in the
2 In this connection, the UN Secretariat estimates that private flows amounted to some $25 billion and South-
South development cooperation to between $12.6 and $14.4 billion in 2010, expanding the notion of total development cooperation already to some $178 billion.
4
resolution (section II, paragraphs 24-56). As such, this report contains already some of the baseline data
and information against which progress can be measured. These will be further developed in the next
edition of the present report which will be based on 2012 data. In order to facilitate the assessment of
progress a framework has been developed that identifies relevant information and analyses in the body
of the current report according to how they relate to (i) QCPR resolution main topics and (ii) aspects of
UN-OAD to which the comprehensive policy review attached particular importance, i.e. overall
coherence, relevance, effectiveness and efficiency. This framework is reflected in Annex I to the present
document and forms part of the broader framework that has been developed for the assessment of
progress in the implementation of resolution A/67/226 in general3. Each of the areas of information and
analysis identified in the framework contains references to the relevant paragraphs in the present
document. Similarly, and where appropriate, text in the body of the report refers to the framework. In
future reports, the framework itself will contain a depiction to illustrate the general status of change
and progress.
2. OVERVIEW
17. The present section provides a general overview of selected aspects of the funding for UN-OAD.
Subsequent sections provide more detailed analyses, including of key trends, issues and perspectives.
Contributions
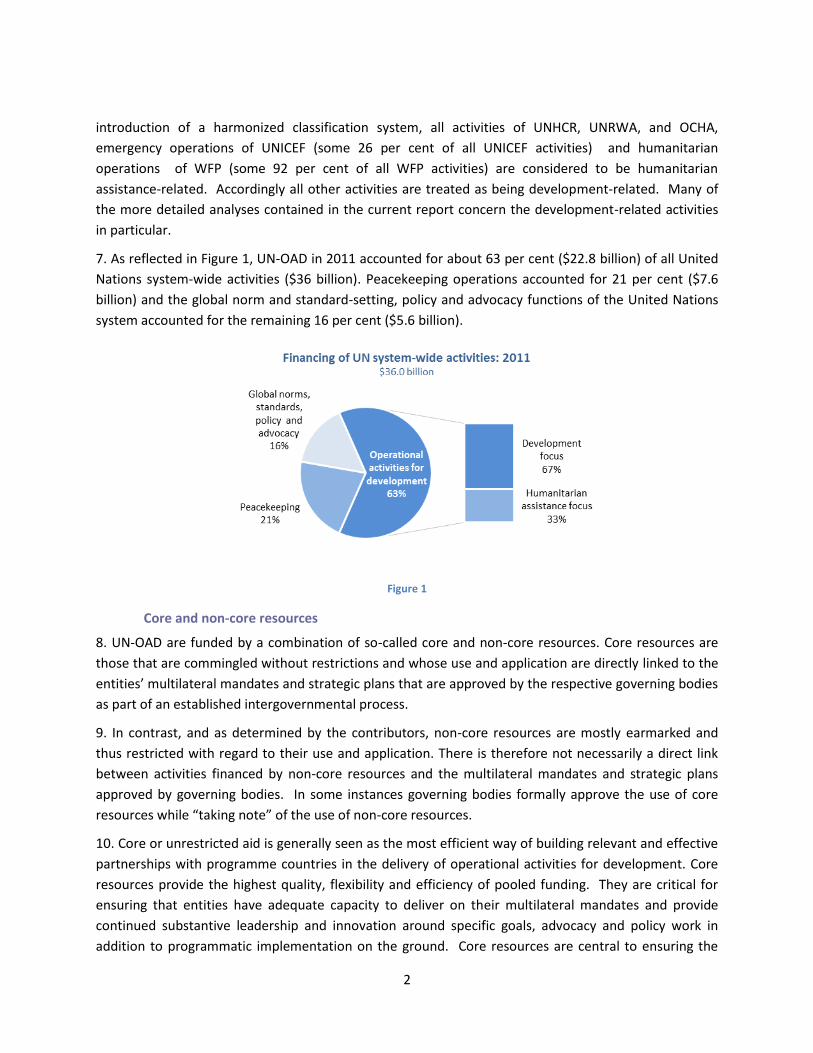
18. Total contributions for operational activities for development amounted to $22.8 billion in 2011.
About two-thirds ($15.2 billion) of this amount was directed towards development-related activities
with the other one-third ($7.6 billion) spent on humanitarian assistance-related activities (see Figure 2
below). Some 68 per cent of development-related contributions and 81 per cent of humanitarian
assistance-related contributions were non-core and thus earmarked.
Figure 2
3 A/68/…. –E/2013/…. Implementation of General Assembly Resolution 67/226 on the quadrennial
comprehensive policy review of operational activities for development of the United Nations system (QCPR)
5
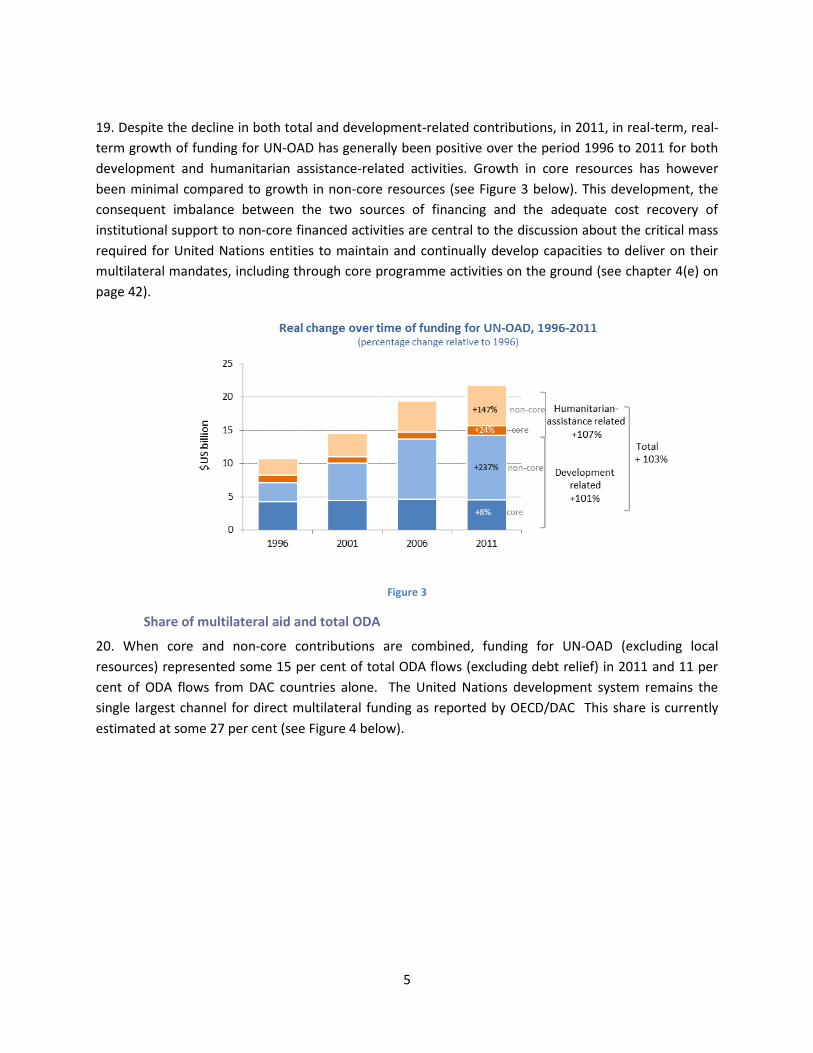
19. Despite the decline in both total and development-related contributions, in 2011, in real-term, real-
term growth of funding for UN-OAD has generally been positive over the period 1996 to 2011 for both
development and humanitarian assistance-related activities. Growth in core resources has however
been minimal compared to growth in non-core resources (see Figure 3 below). This development, the
consequent imbalance between the two sources of financing and the adequate cost recovery of
institutional support to non-core financed activities are central to the discussion about the critical mass
required for United Nations entities to maintain and continually develop capacities to deliver on their
multilateral mandates, including through core programme activities on the ground (see chapter 4(e) on
page 42).
Figure 3
Share of multilateral aid and total ODA
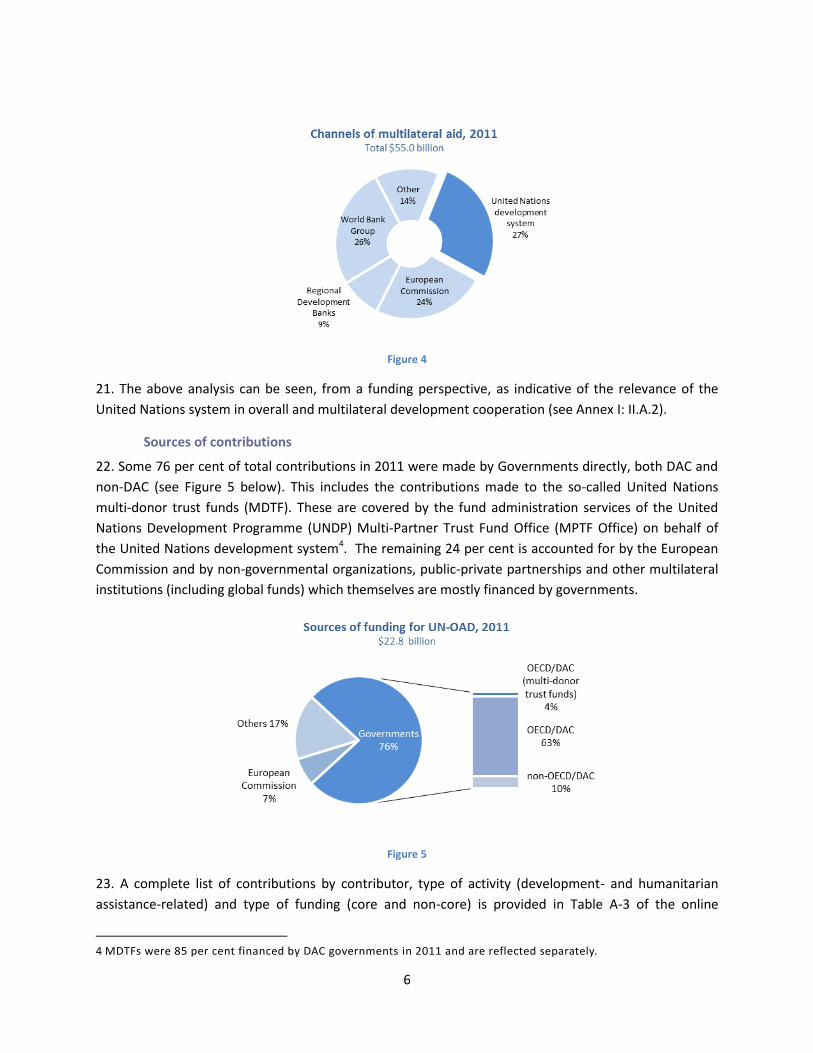
20. When core and non-core contributions are combined, funding for UN-OAD (excluding local
resources) represented some 15 per cent of total ODA flows (excluding debt relief) in 2011 and 11 per
cent of ODA flows from DAC countries alone. The United Nations development system remains the
single largest channel for direct multilateral funding as reported by OECD/DAC This share is currently
estimated at some 27 per cent (see Figure 4 below).
6
Figure 4
21. The above analysis can be seen, from a funding perspective, as indicative of the relevance of the
United Nations system in overall and multilateral development cooperation (see Annex I: II.A.2).
Sources of contributions
22. Some 76 per cent of total contributions in 2011 were made by Governments directly, both DAC and
non-DAC (see Figure 5 below). This includes the contributions made to the so-called United Nations
multi-donor trust funds (MDTF). These are covered by the fund administration services of the United
Nations Development Programme (UNDP) Multi-Partner Trust Fund Office (MPTF Office) on behalf of
the United Nations development system4. The remaining 24 per cent is accounted for by the European
Commission and by non-governmental organizations, public-private partnerships and other multilateral
institutions (including global funds) which themselves are mostly financed by governments.
Figure 5
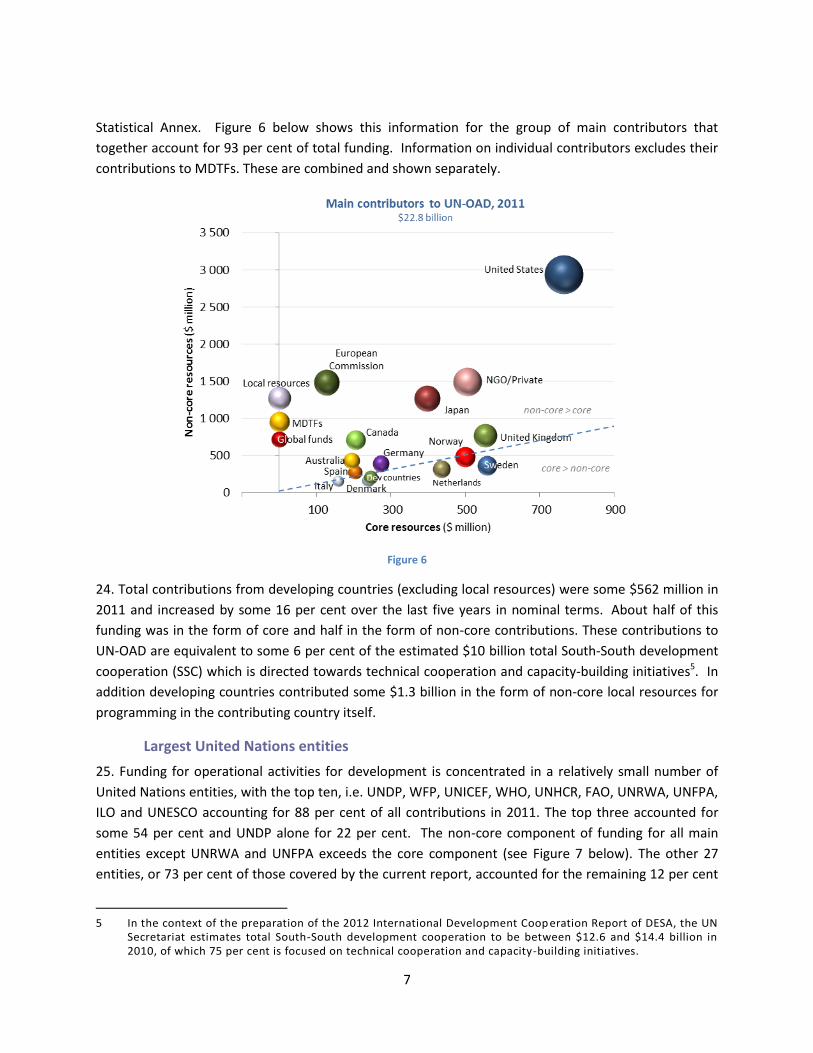
23. A complete list of contributions by contributor, type of activity (development- and humanitarian
assistance-related) and type of funding (core and non-core) is provided in Table A-3 of the online
4 MDTFs were 85 per cent financed by DAC governments in 2011 and are reflected separately.
7
Statistical Annex. Figure 6 below shows this information for the group of main contributors that
together account for 93 per cent of total funding. Information on individual contributors excludes their
contributions to MDTFs. These are combined and shown separately.
Figure 6
24. Total contributions from developing countries (excluding local resources) were some $562 million in
2011 and increased by some 16 per cent over the last five years in nominal terms. About half of this
funding was in the form of core and half in the form of non-core contributions. These contributions to
UN-OAD are equivalent to some 6 per cent of the estimated $10 billion total South-South development
cooperation (SSC) which is directed towards technical cooperation and capacity-building initiatives5. In
addition developing countries contributed some $1.3 billion in the form of non-core local resources for
programming in the contributing country itself.
Largest United Nations entities
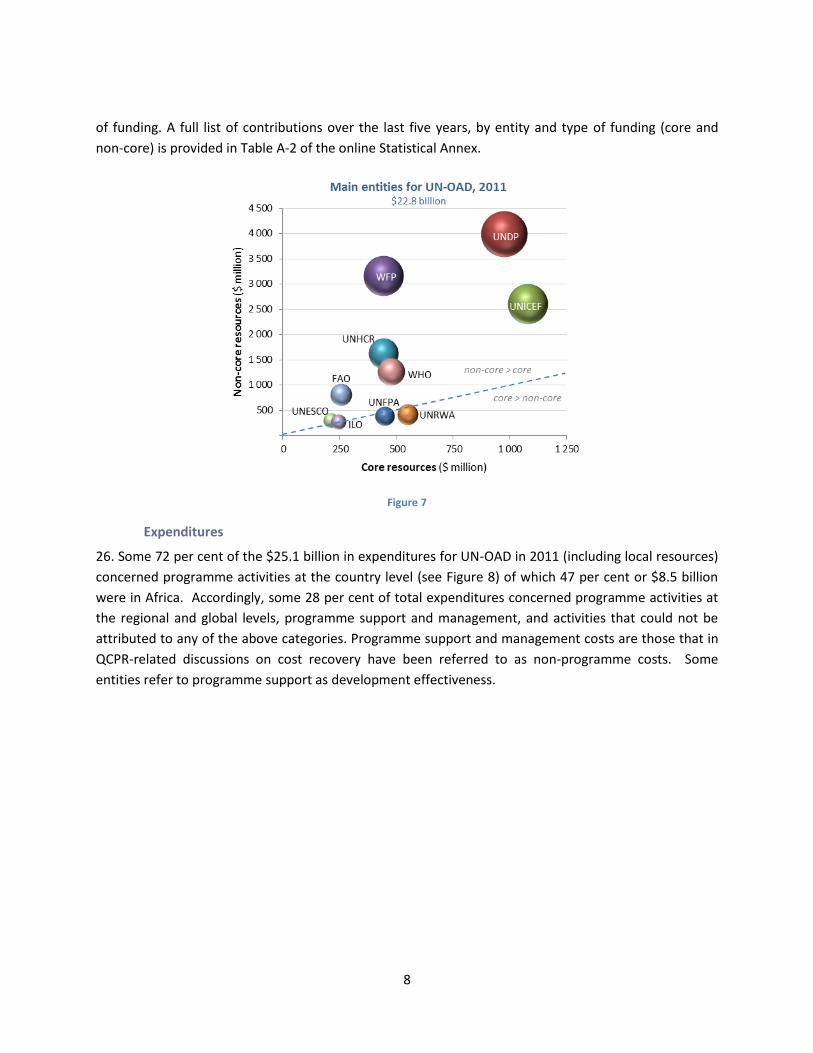
25. Funding for operational activities for development is concentrated in a relatively small number of
United Nations entities, with the top ten, i.e. UNDP, WFP, UNICEF, WHO, UNHCR, FAO, UNRWA, UNFPA,
ILO and UNESCO accounting for 88 per cent of all contributions in 2011. The top three accounted for
some 54 per cent and UNDP alone for 22 per cent. The non-core component of funding for all main
entities except UNRWA and UNFPA exceeds the core component (see Figure 7 below). The other 27
entities, or 73 per cent of those covered by the current report, accounted for the remaining 12 per cent
5 In the context of the preparation of the 2012 International Development Coop eration Report of DESA, the UN
Secretariat estimates total South-South development cooperation to be between $12.6 and $14.4 billion in 2010, of which 75 per cent is focused on technical cooperation and capacity-building initiatives.
8
of funding. A full list of contributions over the last five years, by entity and type of funding (core and
non-core) is provided in Table A-2 of the online Statistical Annex.
Figure 7
Expenditures
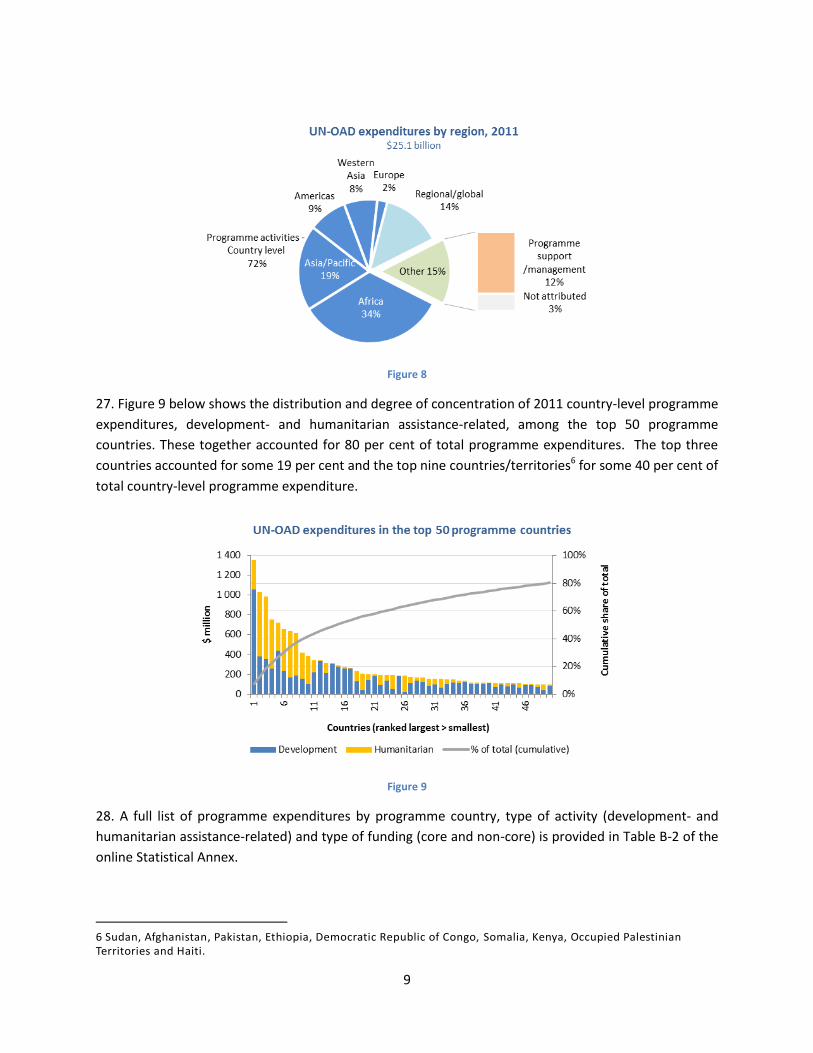
26. Some 72 per cent of the $25.1 billion in expenditures for UN-OAD in 2011 (including local resources)
concerned programme activities at the country level (see Figure 8) of which 47 per cent or $8.5 billion
were in Africa. Accordingly, some 28 per cent of total expenditures concerned programme activities at
the regional and global levels, programme support and management, and activities that could not be
attributed to any of the above categories. Programme support and management costs are those that in
QCPR-related discussions on cost recovery have been referred to as non-programme costs. Some
entities refer to programme support as development effectiveness.
9
Figure 8
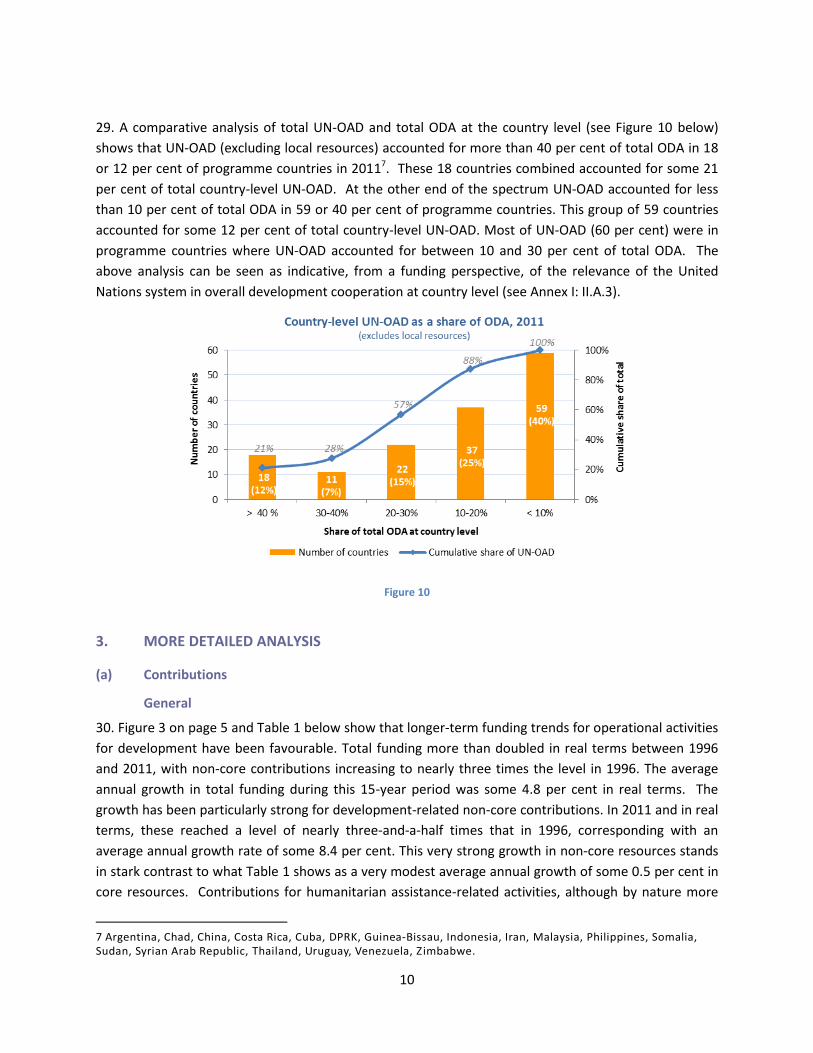
27. Figure 9 below shows the distribution and degree of concentration of 2011 country-level programme
expenditures, development- and humanitarian assistance-related, among the top 50 programme
countries. These together accounted for 80 per cent of total programme expenditures. The top three
countries accounted for some 19 per cent and the top nine countries/territories6 for some 40 per cent of
total country-level programme expenditure.
Figure 9
28. A full list of programme expenditures by programme country, type of activity (development- and
humanitarian assistance-related) and type of funding (core and non-core) is provided in Table B-2 of the
online Statistical Annex.
6 Sudan, Afghanistan, Pakistan, Ethiopia, Democratic Republic of Congo, Somalia, Kenya, Occupied Palestinian Territories and Haiti.
10
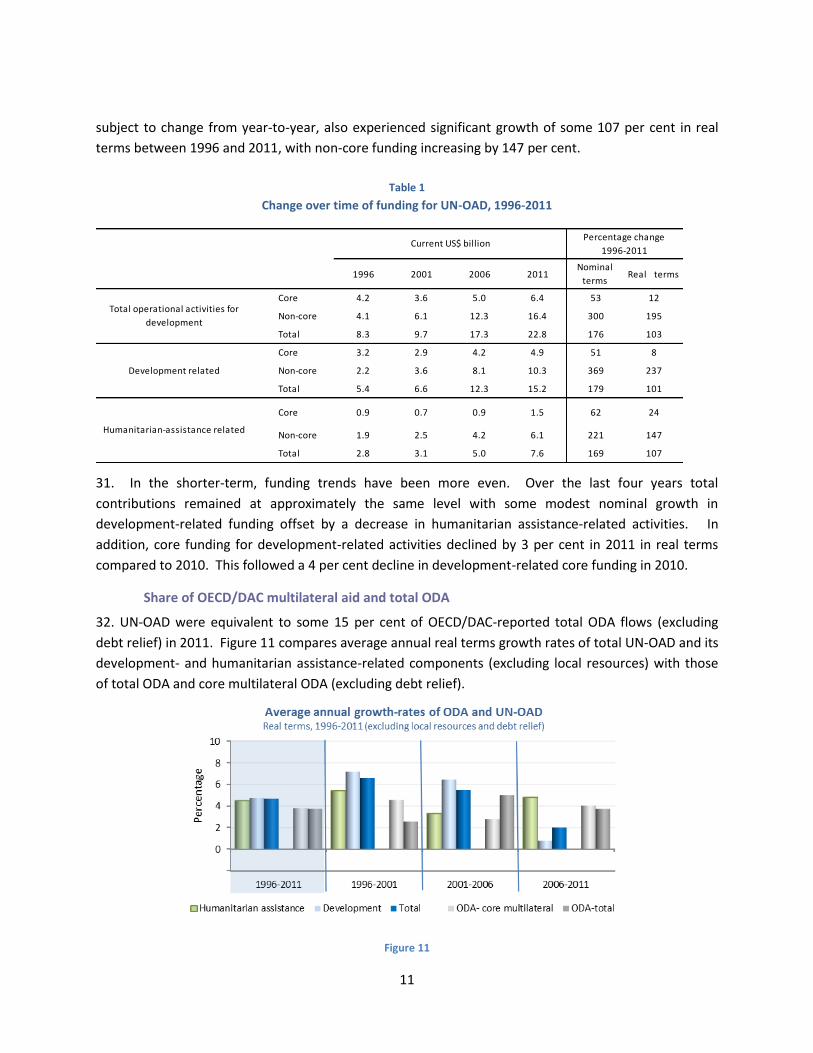
29. A comparative analysis of total UN-OAD and total ODA at the country level (see Figure 10 below)
shows that UN-OAD (excluding local resources) accounted for more than 40 per cent of total ODA in 18
or 12 per cent of programme countries in 20117. These 18 countries combined accounted for some 21
per cent of total country-level UN-OAD. At the other end of the spectrum UN-OAD accounted for less
than 10 per cent of total ODA in 59 or 40 per cent of programme countries. This group of 59 countries
accounted for some 12 per cent of total country-level UN-OAD. Most of UN-OAD (60 per cent) were in
programme countries where UN-OAD accounted for between 10 and 30 per cent of total ODA. The
above analysis can be seen as indicative, from a funding perspective, of the relevance of the United
Nations system in overall development cooperation at country level (see Annex I: II.A.3).
Figure 10
3. MORE DETAILED ANALYSIS
(a) Contributions
General
30. Figure 3 on page 5 and Table 1 below show that longer-term funding trends for operational activities
for development have been favourable. Total funding more than doubled in real terms between 1996
and 2011, with non-core contributions increasing to nearly three times the level in 1996. The average
annual growth in total funding during this 15-year period was some 4.8 per cent in real terms. The
growth has been particularly strong for development-related non-core contributions. In 2011 and in real
terms, these reached a level of nearly three-and-a-half times that in 1996, corresponding with an
average annual growth rate of some 8.4 per cent. This very strong growth in non-core resources stands
in stark contrast to what Table 1 shows as a very modest average annual growth of some 0.5 per cent in
core resources. Contributions for humanitarian assistance-related activities, although by nature more
7 Argentina, Chad, China, Costa Rica, Cuba, DPRK, Guinea-Bissau, Indonesia, Iran, Malaysia, Philippines, Somalia, Sudan, Syrian Arab Republic, Thailand, Uruguay, Venezuela, Zimbabwe.
11
subject to change from year-to-year, also experienced significant growth of some 107 per cent in real
terms between 1996 and 2011, with non-core funding increasing by 147 per cent.
Table 1
Change over time of funding for UN-OAD, 1996-2011
1996 2001 2006 2011Nominal
termsReal terms
Core 4.2 3.6 5.0 6.4 53 12
Non-core 4.1 6.1 12.3 16.4 300 195
Total 8.3 9.7 17.3 22.8 176 103
Core 3.2 2.9 4.2 4.9 51 8
Non-core 2.2 3.6 8.1 10.3 369 237
Total 5.4 6.6 12.3 15.2 179 101
Core 0.9 0.7 0.9 1.5 62 24
Non-core 1.9 2.5 4.2 6.1 221 147
Total 2.8 3.1 5.0 7.6 169 107
Humanitarian-assistance related
Current US$ billionPercentage change
1996-2011
Total operational activities for
development
Development related
31. In the shorter-term, funding trends have been more even. Over the last four years total
contributions remained at approximately the same level with some modest nominal growth in
development-related funding offset by a decrease in humanitarian assistance-related activities. In
addition, core funding for development-related activities declined by 3 per cent in 2011 in real terms
compared to 2010. This followed a 4 per cent decline in development-related core funding in 2010.
Share of OECD/DAC multilateral aid and total ODA
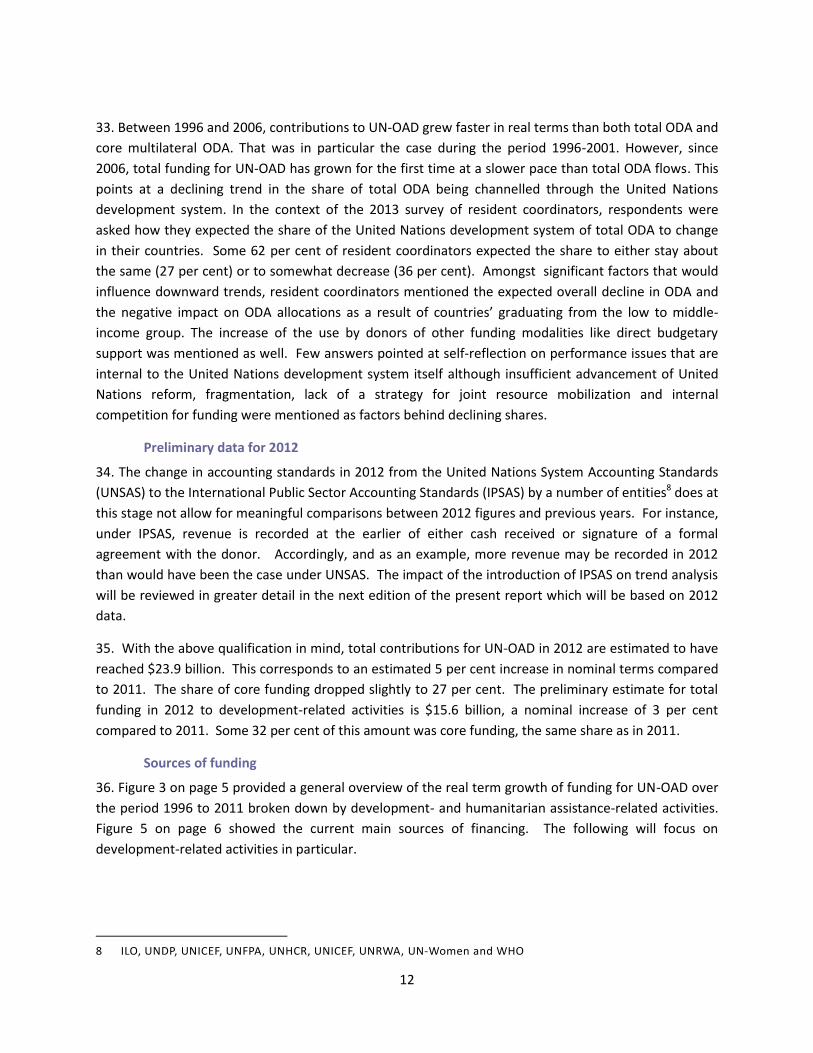
32. UN-OAD were equivalent to some 15 per cent of OECD/DAC-reported total ODA flows (excluding
debt relief) in 2011. Figure 11 compares average annual real terms growth rates of total UN-OAD and its
development- and humanitarian assistance-related components (excluding local resources) with those
of total ODA and core multilateral ODA (excluding debt relief).
Figure 11
12
33. Between 1996 and 2006, contributions to UN-OAD grew faster in real terms than both total ODA and
core multilateral ODA. That was in particular the case during the period 1996-2001. However, since
2006, total funding for UN-OAD has grown for the first time at a slower pace than total ODA flows. This
points at a declining trend in the share of total ODA being channelled through the United Nations
development system. In the context of the 2013 survey of resident coordinators, respondents were
asked how they expected the share of the United Nations development system of total ODA to change
in their countries. Some 62 per cent of resident coordinators expected the share to either stay about
the same (27 per cent) or to somewhat decrease (36 per cent). Amongst significant factors that would
influence downward trends, resident coordinators mentioned the expected overall decline in ODA and
the negative impact on ODA allocations as a result of countries’ graduating from the low to middle-
income group. The increase of the use by donors of other funding modalities like direct budgetary
support was mentioned as well. Few answers pointed at self-reflection on performance issues that are
internal to the United Nations development system itself although insufficient advancement of United
Nations reform, fragmentation, lack of a strategy for joint resource mobilization and internal
competition for funding were mentioned as factors behind declining shares.
Preliminary data for 2012
34. The change in accounting standards in 2012 from the United Nations System Accounting Standards
(UNSAS) to the International Public Sector Accounting Standards (IPSAS) by a number of entities8 does at
this stage not allow for meaningful comparisons between 2012 figures and previous years. For instance,
under IPSAS, revenue is recorded at the earlier of either cash received or signature of a formal
agreement with the donor. Accordingly, and as an example, more revenue may be recorded in 2012
than would have been the case under UNSAS. The impact of the introduction of IPSAS on trend analysis
will be reviewed in greater detail in the next edition of the present report which will be based on 2012
data.
35. With the above qualification in mind, total contributions for UN-OAD in 2012 are estimated to have
reached $23.9 billion. This corresponds to an estimated 5 per cent increase in nominal terms compared
to 2011. The share of core funding dropped slightly to 27 per cent. The preliminary estimate for total
funding in 2012 to development-related activities is $15.6 billion, a nominal increase of 3 per cent
compared to 2011. Some 32 per cent of this amount was core funding, the same share as in 2011.
Sources of funding
36. Figure 3 on page 5 provided a general overview of the real term growth of funding for UN-OAD over
the period 1996 to 2011 broken down by development- and humanitarian assistance-related activities.
Figure 5 on page 6 showed the current main sources of financing. The following will focus on
development-related activities in particular.
8 ILO, UNDP, UNICEF, UNFPA, UNHCR, UNICEF, UNRWA, UN-Women and WHO
13
Development-related activities
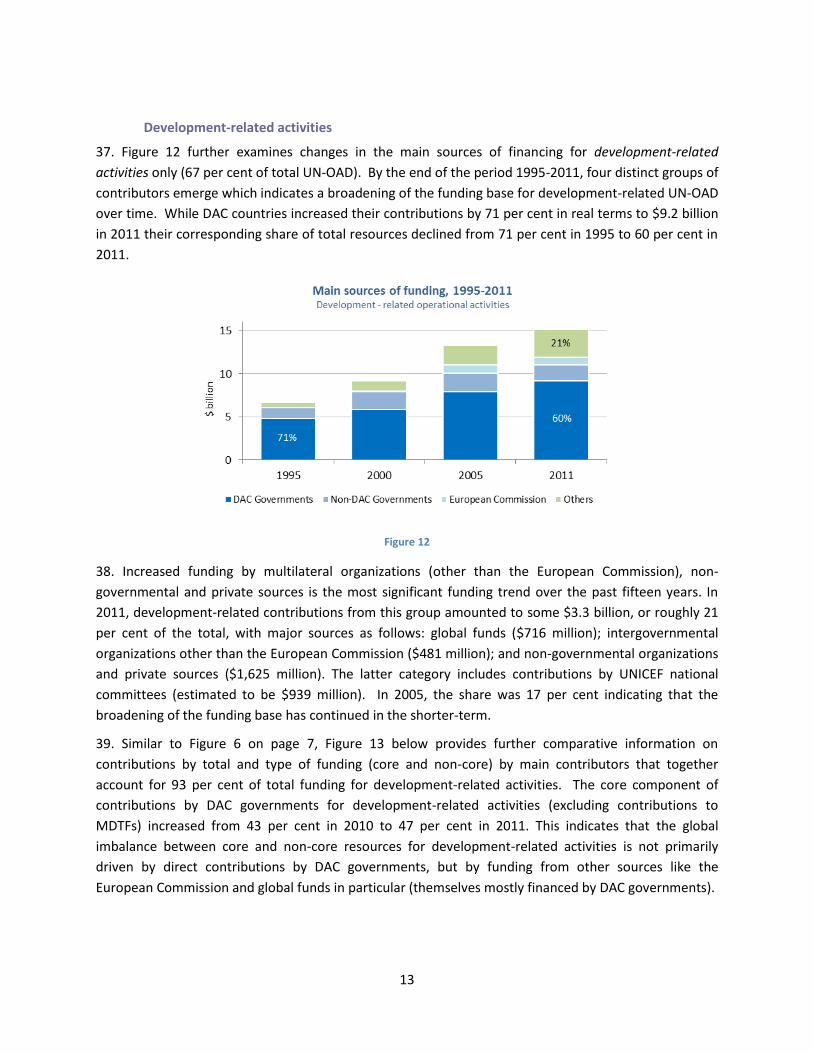
37. Figure 12 further examines changes in the main sources of financing for development-related
activities only (67 per cent of total UN-OAD). By the end of the period 1995-2011, four distinct groups of
contributors emerge which indicates a broadening of the funding base for development-related UN-OAD
over time. While DAC countries increased their contributions by 71 per cent in real terms to $9.2 billion
in 2011 their corresponding share of total resources declined from 71 per cent in 1995 to 60 per cent in
2011.
Figure 12
38. Increased funding by multilateral organizations (other than the European Commission), non-
governmental and private sources is the most significant funding trend over the past fifteen years. In
2011, development-related contributions from this group amounted to some $3.3 billion, or roughly 21
per cent of the total, with major sources as follows: global funds ($716 million); intergovernmental
organizations other than the European Commission ($481 million); and non-governmental organizations
and private sources ($1,625 million). The latter category includes contributions by UNICEF national
committees (estimated to be $939 million). In 2005, the share was 17 per cent indicating that the
broadening of the funding base has continued in the shorter-term.
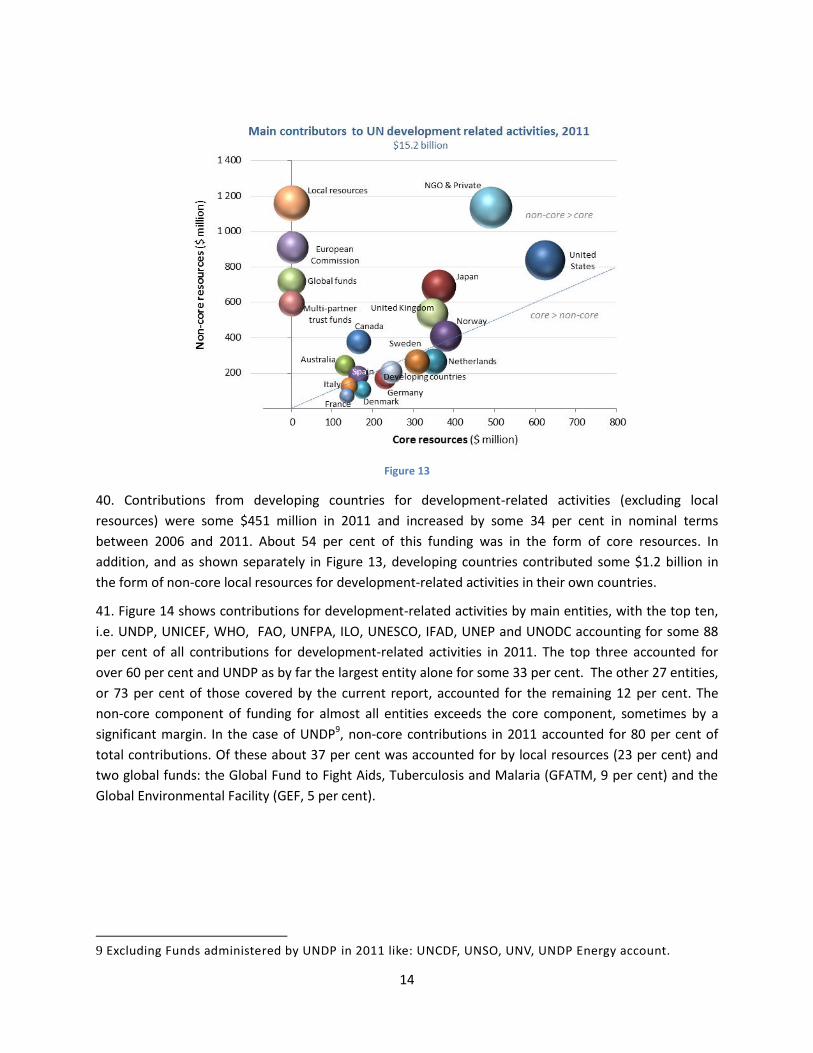
39. Similar to Figure 6 on page 7, Figure 13 below provides further comparative information on
contributions by total and type of funding (core and non-core) by main contributors that together
account for 93 per cent of total funding for development-related activities. The core component of
contributions by DAC governments for development-related activities (excluding contributions to
MDTFs) increased from 43 per cent in 2010 to 47 per cent in 2011. This indicates that the global
imbalance between core and non-core resources for development-related activities is not primarily
driven by direct contributions by DAC governments, but by funding from other sources like the
European Commission and global funds in particular (themselves mostly financed by DAC governments).
14
Figure 13
40. Contributions from developing countries for development-related activities (excluding local
resources) were some $451 million in 2011 and increased by some 34 per cent in nominal terms
between 2006 and 2011. About 54 per cent of this funding was in the form of core resources. In
addition, and as shown separately in Figure 13, developing countries contributed some $1.2 billion in
the form of non-core local resources for development-related activities in their own countries.
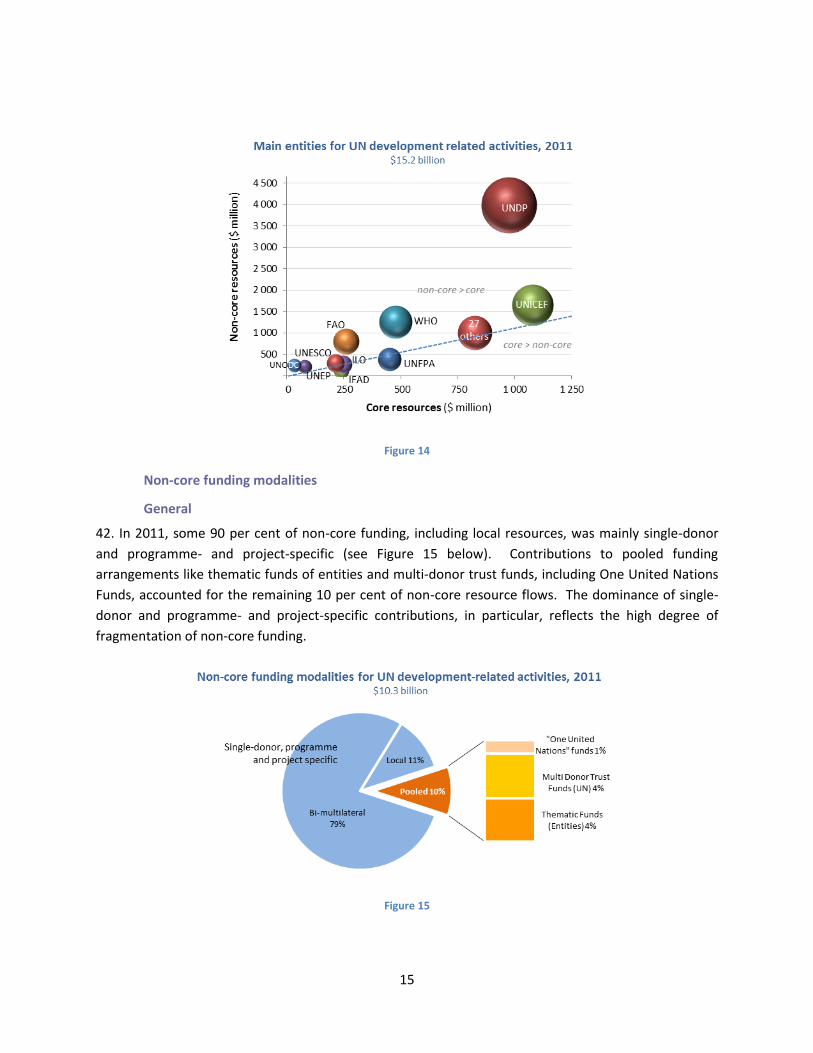
41. Figure 14 shows contributions for development-related activities by main entities, with the top ten,
i.e. UNDP, UNICEF, WHO, FAO, UNFPA, ILO, UNESCO, IFAD, UNEP and UNODC accounting for some 88
per cent of all contributions for development-related activities in 2011. The top three accounted for
over 60 per cent and UNDP as by far the largest entity alone for some 33 per cent. The other 27 entities,
or 73 per cent of those covered by the current report, accounted for the remaining 12 per cent. The
non-core component of funding for almost all entities exceeds the core component, sometimes by a
significant margin. In the case of UNDP9, non-core contributions in 2011 accounted for 80 per cent of
total contributions. Of these about 37 per cent was accounted for by local resources (23 per cent) and
two global funds: the Global Fund to Fight Aids, Tuberculosis and Malaria (GFATM, 9 per cent) and the
Global Environmental Facility (GEF, 5 per cent).
9 Excluding Funds administered by UNDP in 2011 like: UNCDF, UNSO, UNV, UNDP Energy account.
15
Figure 14
Non-core funding modalities
General
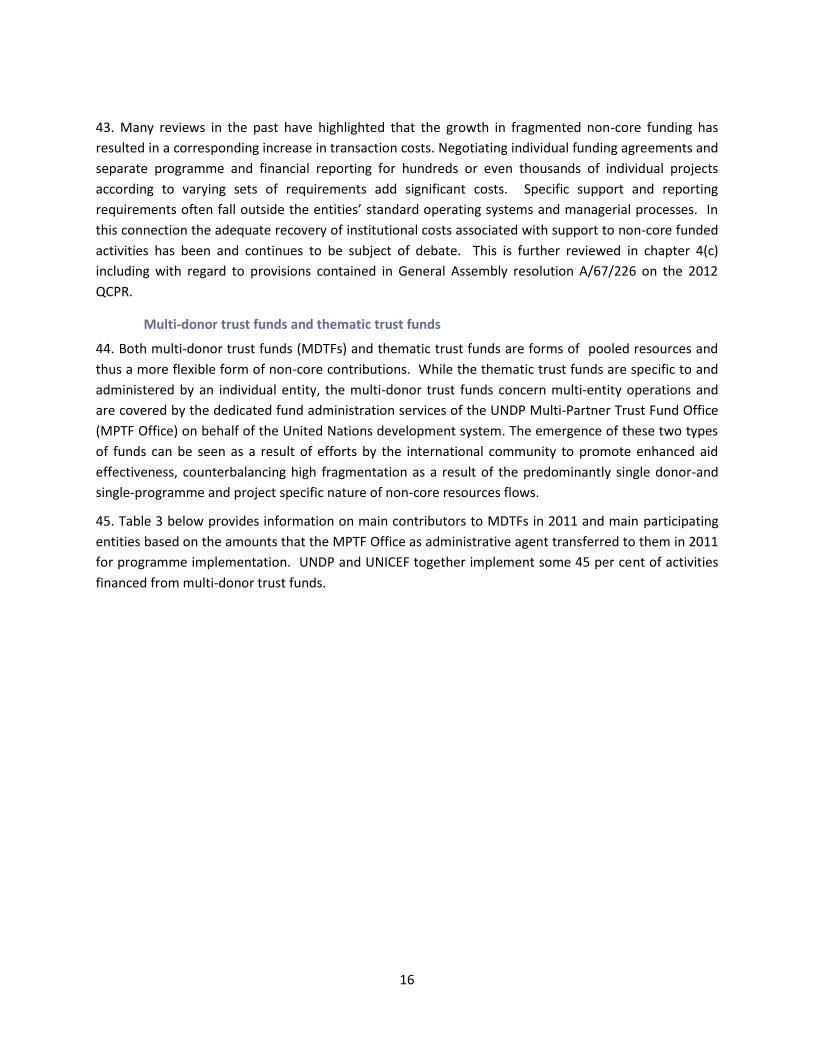
42. In 2011, some 90 per cent of non-core funding, including local resources, was mainly single-donor
and programme- and project-specific (see Figure 15 below). Contributions to pooled funding
arrangements like thematic funds of entities and multi-donor trust funds, including One United Nations
Funds, accounted for the remaining 10 per cent of non-core resource flows. The dominance of single-
donor and programme- and project-specific contributions, in particular, reflects the high degree of
fragmentation of non-core funding.
Figure 15
16
43. Many reviews in the past have highlighted that the growth in fragmented non-core funding has
resulted in a corresponding increase in transaction costs. Negotiating individual funding agreements and
separate programme and financial reporting for hundreds or even thousands of individual projects
according to varying sets of requirements add significant costs. Specific support and reporting
requirements often fall outside the entities’ standard operating systems and managerial processes. In
this connection the adequate recovery of institutional costs associated with support to non-core funded
activities has been and continues to be subject of debate. This is further reviewed in chapter 4(c)
including with regard to provisions contained in General Assembly resolution A/67/226 on the 2012
QCPR.
Multi-donor trust funds and thematic trust funds
44. Both multi-donor trust funds (MDTFs) and thematic trust funds are forms of pooled resources and
thus a more flexible form of non-core contributions. While the thematic trust funds are specific to and
administered by an individual entity, the multi-donor trust funds concern multi-entity operations and
are covered by the dedicated fund administration services of the UNDP Multi-Partner Trust Fund Office
(MPTF Office) on behalf of the United Nations development system. The emergence of these two types
of funds can be seen as a result of efforts by the international community to promote enhanced aid
effectiveness, counterbalancing high fragmentation as a result of the predominantly single donor-and
single-programme and project specific nature of non-core resources flows.
45. Table 3 below provides information on main contributors to MDTFs in 2011 and main participating
entities based on the amounts that the MPTF Office as administrative agent transferred to them in 2011
for programme implementation. UNDP and UNICEF together implement some 45 per cent of activities
financed from multi-donor trust funds.
17
Table 2
Multi-donor trust funds in 2011
Main contributors Main entities
Rank Donor Contributions Share of
total
United Nations entity
Transfers received
Share of total
(USD million) (Percentage) (USD million) (Percentage)
1 United Kingdom 260 32 UNDP 356 33
2 Norway 116 14 UNICEF 126 12
3 IDA 111 13 FAO 76 7
4 Sweden 97 12 OCHA/NGO 65 6
5 Netherlands 53 7 IOM 49 5
6 Australia 39 5 WFP 47 4
7 Denmark 34 4 UNOPS 46 4
8 Ireland 21 3 WHO 33 3
9 Spain 18 2 UNFPA 30 3
10 Japan 17 2 ILO 28 3
46. In response to GA resolution 64/289 on system-wide coherence, information on all existing multi-
donor trust funds and thematic trust funds, including information on their mandates, performance and
governance structures was made available in 2010. This comprehensive information can be found on the
website of the Development Cooperation Policy Branch of the Office for Economic and Social Council
Support and Coordination of UNDESA (www.un.org/esa/coordination/dcpb_stat.htm).
One United Nations Funds
47. One UN Funds are multi-donor trust funds that were established specifically to support the
delivering-as-one pilot initiatives by providing principally un-earmarked resources to cover funding gaps
in One United Nations Programmes. One UN Funds represent an innovation to support system-wide
coherence of the work of the United Nations development system at the country level. In response to
General Assembly resolution 64/289, an independent evaluation of the “delivering-as-one” (DaO)
experience, including the One UN Funds, was submitted at the sixty-sixth session of the Assembly as
part of the 2012 quadrennial comprehensive policy review (QCPR)10.
48. Table 4 shows the amounts channelled through One UN Funds, with an indication of their share of
total development-related expenditures of the United Nations development system in the eight DaO
pilot countries and, combined, in 13 other countries that subsequently adopted the DAO approach on a
voluntary basis. The share of One UN Funds of development-related expenditures in the eight pilot
countries combined was about 14 per cent (from as high as 24 per cent in Albania to as low as 4 per cent
in Pakistan and Uruguay). The share was about 9 per cent for all countries with a One UN Fund
10
See A/66/859
18
combined. The success of the One UN Funds as part of an integrated funding framework for the United
Nations development system has therefore been moderate.
Table 3
One United Nations Funds in 2011
Recipient country One UN Fund expenditures
Total development-related expenditures
One UN fund share of total
(USD millions) (Percentage)
Pilot countries:
Albania 7 31 24
Cape Verde 4 19 21
Mozambique 16 136 12
Pakistan 15 352 4
Rwanda 14 74 19
Tanzania, United Republic of 25 123 20
Uruguay 1 32 4
Viet Nam 25 113 22
Sub-Total 107 789 14
Non-pilot countries 21 630 3
Total 129 1509 9
Local resources
49. Contributions to entities in the form of local resources for programming in contributors’ own
countries reached a peak in 2007 amounting to some $2.2 billion or some 11 per cent of all
contributions to the United Nations development system. This type of funding has since been in steep
decline to some $1.3 billion or about 6 per cent of total contributions in 2011, a level comparable to the
mid-1990s. Almost all the decline in local resources contributions between 2007 and 2011 can be
attributed to UNDP where, in line with the UNDP strategic plan 2008-2013, such funding decreased from
nearly $1.6 billion or about one third of total contributions in 2007 to about $905 million or 18 per cent
of total contributions in 2011. Table 2 provides information of main local resources contributors and
main entities involved in 2011.11 Some 71 per cent of all local resources contributions are channelled
through UNDP.
11 In some instances local resources represent loans received by countries from development banks which are channeled through United Nations entities for administration of project funds.
19
Table 4
Local resources contributions to the United Nations system, 2011
Main contributors Main entities
Rank
Country Local
resources
Share of total
contributions
United Nations entity
Local resources Share of
total contributions
($ million) (%) ($ million) (%)
1 Argentina 311 24 UNDP 905 71
2 Brazil 142 11 ICAO 98 8
3 Egypt 93 7 UNICEF 80 6
4 Colombia 74 6 FAO 53 4
5 Afghanistan 65 5 UNESCO 42 3
6 Peru 43 3 UNODC 37 3
7 Panama 43 3 WFP 34 3
8 Saudi Arabia 34 3 UNCTAD 14 1
9 China 34 3 UN-HABITAT 4 0
10 Mexico 31 2 WMO 3 0
Joint Programmes
50. While not a separate type of third party pooled funding modality, joint programmes can be regarded
as a form of pooling of resources by United Nations entities at a next level. A joint programme is a
mechanism developed to contribute to making the UN-OAD more coherent, effective and efficient. A
joint programme is a set of activities contained in a common work plan and related budget, involving
two or more United Nations organizations and (sub-) national partners.12 The work plan and budget
form part of a joint programme document, which also details roles and responsibilities of partners in
coordinating and managing the joint activities. The joint programme document is signed by all
participating organizations and (sub-) national partners. Joint programmes are mostly financed from
non-core resources, through any combination of the above non-core funding modalities.
51. No central database exists on the basis of which status and trends with regard to joint programmes
can be assessed. However, UNDG completed a comprehensive review of the joint programme
mechanism in early 2013. Based on information collected for this review, including through surveys,
some assessment can be made of the share of overall resources that is programmed and managed
through the joint programme mechanism.
52. Some 37 per cent of joint programmes are funded by global MDTFs most of which have a global
secretariat and specific guidelines; 24 per cent by One UN Country Funds and 11 per cent by stabilization
and recovery funds both sets of which have country-level steering committees; and 28 per cent are
stand-alone joint programmes. Nearly 90 per cent of the 526 joint programmes in the current records of
the MPTF Office, UNICEF and UNFPA are funded on a so called pass-through basis. Under this option,
two or more organizations develop a joint programme, identify funding needs and submit a joint
programme document to donors or steering committees for funding. The funds are channelled through
an administrative agent.
12 see Guidance Note on Joint Programming, UNDG, 2003
20
53. The UNDG review estimated the value of new joint programmes established in 2011 at $272 million,
confirming a downward trend since 2008 when the value reached a peak of $618 million. On the
assumption that most joint programmes cover development-related activities, the 2011 value is
equivalent to less than 3 per cent of total non-core contributions for development-related activities.
From a financial perspective, the share of contributions that are programmed and managed through
joint programmes is therefore not significant and declining.
54. The results of the separate 2013 survey of resident coordinators confirm that the share of funds
programmed and managed under joint programmes is not significant. Some 92 per cent of resident
coordinators indicated, however, that opportunities exist to make more use of the mechanism.
Amongst the top four factors that according to resident coordinators interfere with the success of joint
programmes is the fact that joint programmes are primarily treated as an opportunity for resources
mobilization. Other top four factors identified as interfering with success are the focus of agencies on
their own mandate and results rather than on joint programmes; that there is a general lack of
accountability to joint programme management; and that results frameworks are unclear and
monitoring is weak. The findings of the survey of resident coordinators affirm the generally held view
that there exist very limited incentives for United Nations entities to engage in joint programmes.
55. Also because of their relevance to the assessment of the implementation of resolution A/67/226 on
the 2012 QCPR, status and trends of joint programmes and pooled funding will continue to be reviewed
in the context of future editions of the present report (see Annex I: II.B.6)
(b) Expenditures
Total expenditures
56. Table 5 below provides an overview of expenditures over the period 2006-2011 by total and by type
of activities (development-related and humanitarian assistance-related). Figure 8 on page 9 showed
that some 72 per cent of expenditures for UN-OAD in 2011 concerned programme activities at the
country level of which 47 per cent or $8.5 billion, were in Africa. Accordingly, some 28 per cent of total
expenditures related to programme activities at the regional and global levels, programme support and
management, and activities that could not be attributed to any of the above categories.
57. Development-related expenditures grew by some 19 per cent in real terms, or 4 per cent annually on
average, between 2006 and 2011, with the most significant annual increase (16 per cent in real terms)
recorded in 2009. This illustrates that the United Nations development system is able to sizeably scale-
up its operations when called upon by the international community to do so.
21
Table 5
Expenditures on operational activities for development, 2006-2011
Current US$ (billion) Percentage change
2006-2011
2006 2007 2008 2009 2010 2011
Nominal terms
Real terms
Development related 12.1 13.1 13.9 15.7 16.3 17.2 42 19
Humanitarian-assistance related 4.9 5.2 6.6 7.1 7.5 7.9 62 36
Total expenditures 17.0 18.4 20.5 22.8 23.9 25.1 48 24
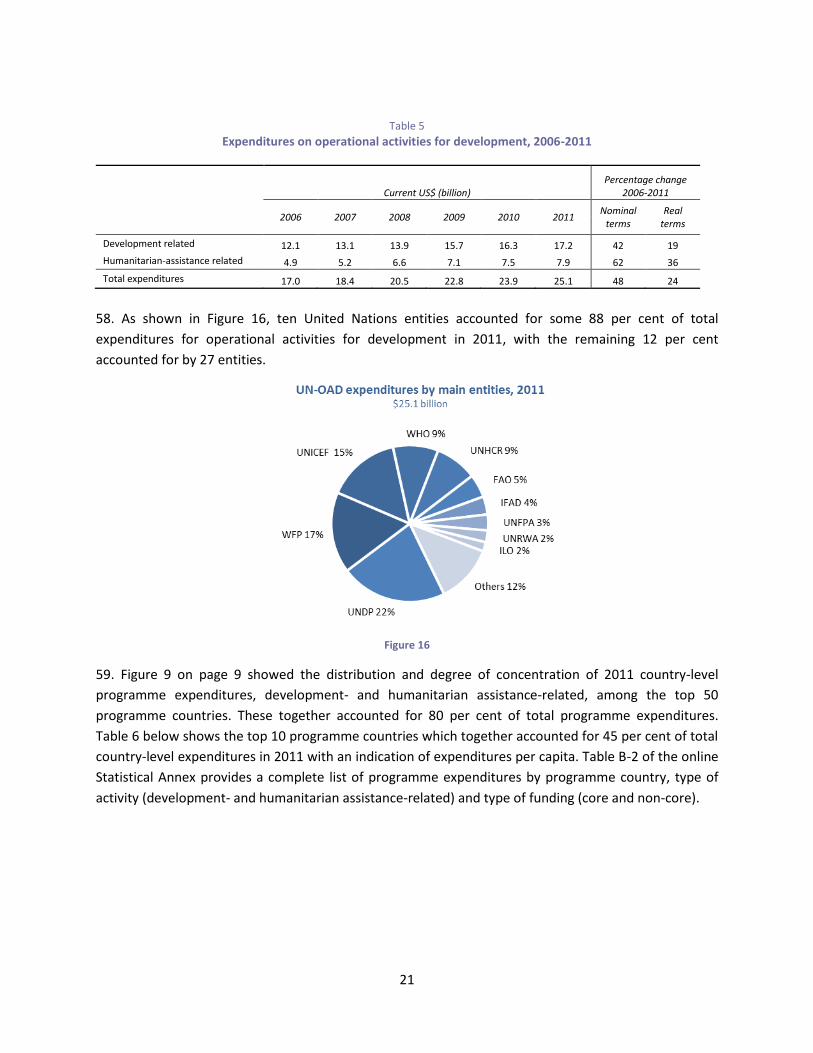
58. As shown in Figure 16, ten United Nations entities accounted for some 88 per cent of total
expenditures for operational activities for development in 2011, with the remaining 12 per cent
accounted for by 27 entities.
Figure 16
59. Figure 9 on page 9 showed the distribution and degree of concentration of 2011 country-level
programme expenditures, development- and humanitarian assistance-related, among the top 50
programme countries. These together accounted for 80 per cent of total programme expenditures.
Table 6 below shows the top 10 programme countries which together accounted for 45 per cent of total
country-level expenditures in 2011 with an indication of expenditures per capita. Table B-2 of the online
Statistical Annex provides a complete list of programme expenditures by programme country, type of
activity (development- and humanitarian assistance-related) and type of funding (core and non-core).
22
Table 6
Top 10 programme countries, 2011
Rank Programme country
Expenditures ($ million)
Total expenditures per capita
($) Total
Development-related
Humanitarian assistance
related
1 Afghanistan 1 352 1 054 299 38
2 Sudan13 1 031 380 651 30
3 Pakistan 985 352 633 6
4 Ethiopia 753 257 496 9
5 Dem Rep of the Congo 719 439 279 11
6 Somalia 660 232 428 69
7 Kenya 638 170 468 15
8 Occupied Palestinian Territory 622 189 432 155
9 Haiti 416 153 263 41
10 Chad 386 102 285 34
Development-related activities
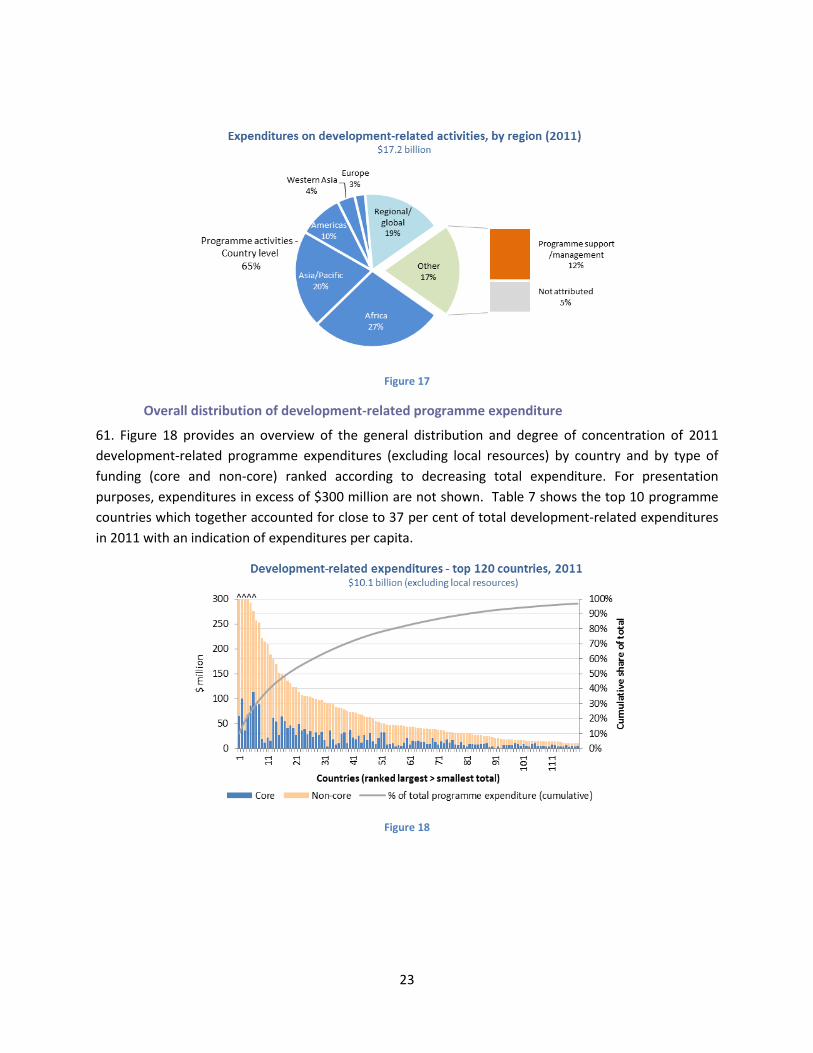
60. While Figure 8 on page 9 analyzed expenditure components for UN-OAD as a whole, Figure 17 shows
the analysis for development-related expenditures (including local resources) only. Some 65 per cent of
development-related expenditures in 2011 concerned programme activities at the country level of
which 42 per cent or $4.7 billion, were in Africa. Accordingly, some 35 per cent of total expenditures
concerned programme activities at the regional and global levels, programme support and
management, and activities that could not be attributed to any of the above categories. As mentioned
earlier, programme support and management costs are those that in discussions on cost recovery have
been referred to as non-programme costs. Some entities refer to programme support as development
effectiveness.
13 South Sudan gained independence from Sudan in July of 2011; therefore some of the expenditures shown
under Sudan were spent in what is now part of South Sudan.
23
Figure 17
Overall distribution of development-related programme expenditure
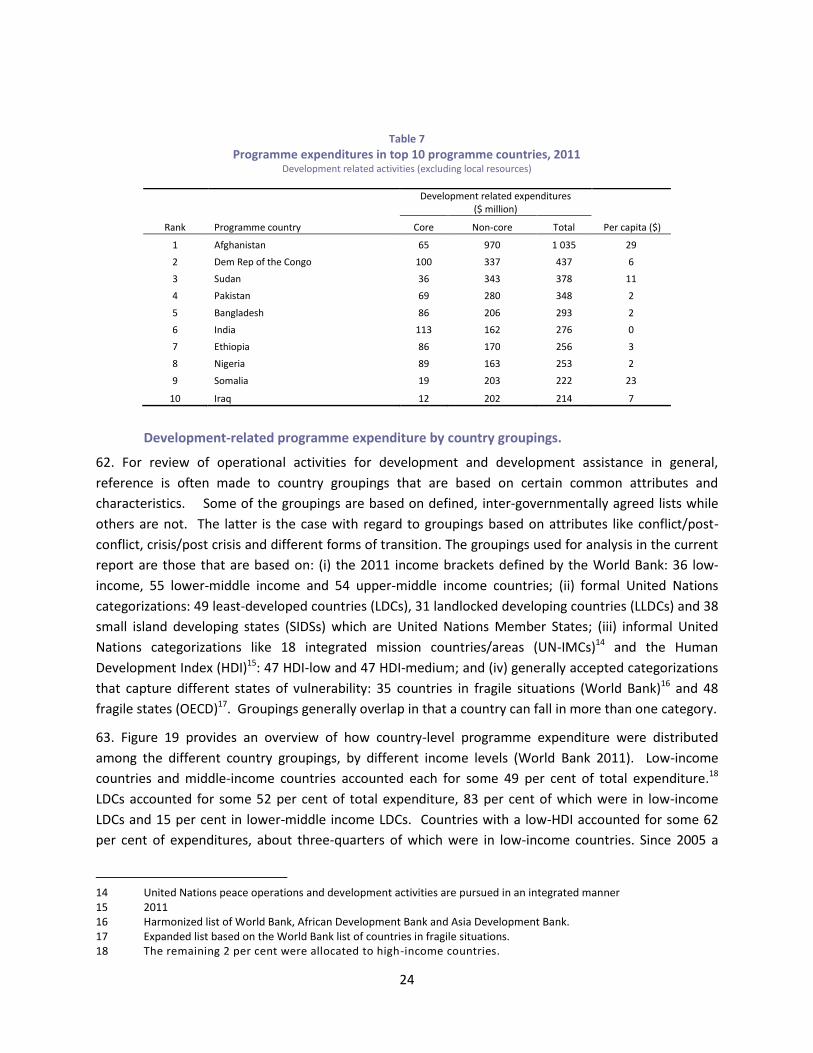
61. Figure 18 provides an overview of the general distribution and degree of concentration of 2011
development-related programme expenditures (excluding local resources) by country and by type of
funding (core and non-core) ranked according to decreasing total expenditure. For presentation
purposes, expenditures in excess of $300 million are not shown. Table 7 shows the top 10 programme
countries which together accounted for close to 37 per cent of total development-related expenditures
in 2011 with an indication of expenditures per capita.
Figure 18
24
Table 7
Programme expenditures in top 10 programme countries, 2011 Development related activities (excluding local resources)
Rank Programme country
Development related expenditures ($ million)
Per capita ($) Core Non-core Total
1 Afghanistan 65 970 1 035 29
2 Dem Rep of the Congo 100 337 437 6
3 Sudan 36 343 378 11
4 Pakistan 69 280 348 2
5 Bangladesh 86 206 293 2
6 India 113 162 276 0
7 Ethiopia 86 170 256 3
8 Nigeria 89 163 253 2
9 Somalia 19 203 222 23
10 Iraq 12 202 214 7
Development-related programme expenditure by country groupings.
62. For review of operational activities for development and development assistance in general,
reference is often made to country groupings that are based on certain common attributes and
characteristics. Some of the groupings are based on defined, inter-governmentally agreed lists while
others are not. The latter is the case with regard to groupings based on attributes like conflict/post-
conflict, crisis/post crisis and different forms of transition. The groupings used for analysis in the current
report are those that are based on: (i) the 2011 income brackets defined by the World Bank: 36 low-
income, 55 lower-middle income and 54 upper-middle income countries; (ii) formal United Nations
categorizations: 49 least-developed countries (LDCs), 31 landlocked developing countries (LLDCs) and 38
small island developing states (SIDSs) which are United Nations Member States; (iii) informal United
Nations categorizations like 18 integrated mission countries/areas (UN-IMCs)14 and the Human
Development Index (HDI)15: 47 HDI-low and 47 HDI-medium; and (iv) generally accepted categorizations
that capture different states of vulnerability: 35 countries in fragile situations (World Bank)16 and 48
fragile states (OECD)17. Groupings generally overlap in that a country can fall in more than one category.
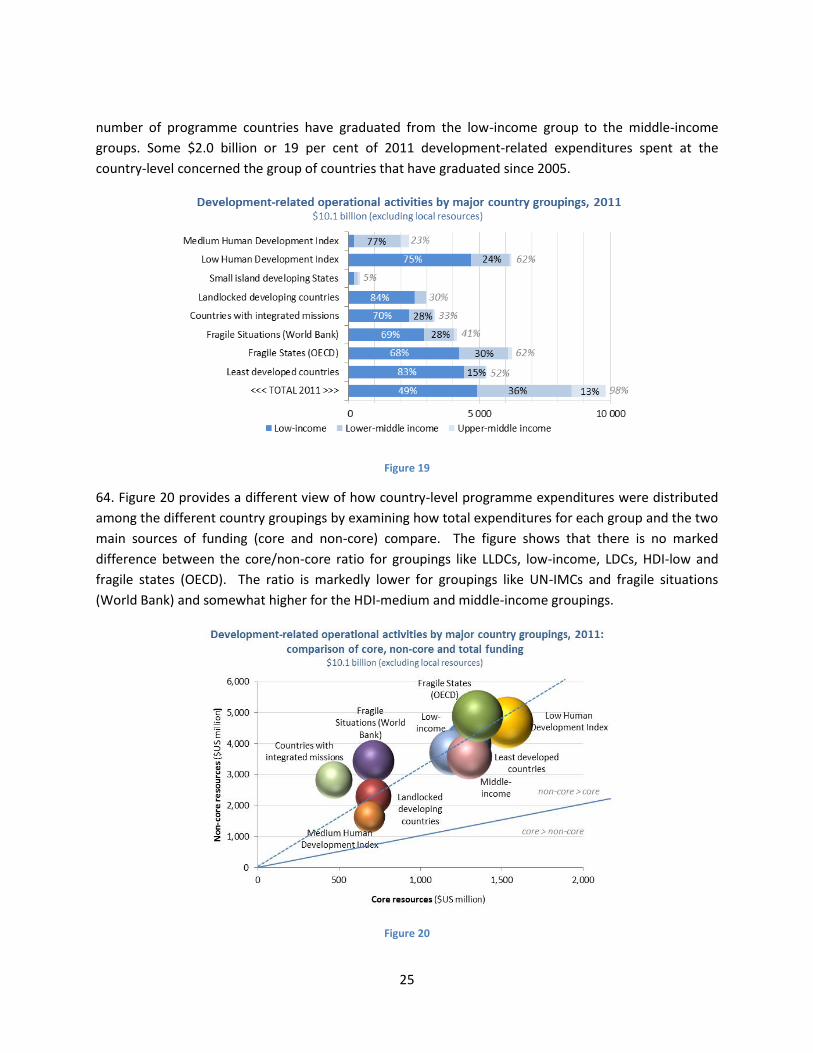
63. Figure 19 provides an overview of how country-level programme expenditure were distributed
among the different country groupings, by different income levels (World Bank 2011). Low-income
countries and middle-income countries accounted each for some 49 per cent of total expenditure.18
LDCs accounted for some 52 per cent of total expenditure, 83 per cent of which were in low-income
LDCs and 15 per cent in lower-middle income LDCs. Countries with a low-HDI accounted for some 62
per cent of expenditures, about three-quarters of which were in low-income countries. Since 2005 a
14 United Nations peace operations and development activities are pursued in an integrated manner 15 2011 16 Harmonized list of World Bank, African Development Bank and Asia Development Bank. 17 Expanded list based on the World Bank list of countries in fragile situations. 18 The remaining 2 per cent were allocated to high-income countries.
25
number of programme countries have graduated from the low-income group to the middle-income
groups. Some $2.0 billion or 19 per cent of 2011 development-related expenditures spent at the
country-level concerned the group of countries that have graduated since 2005.
Figure 19
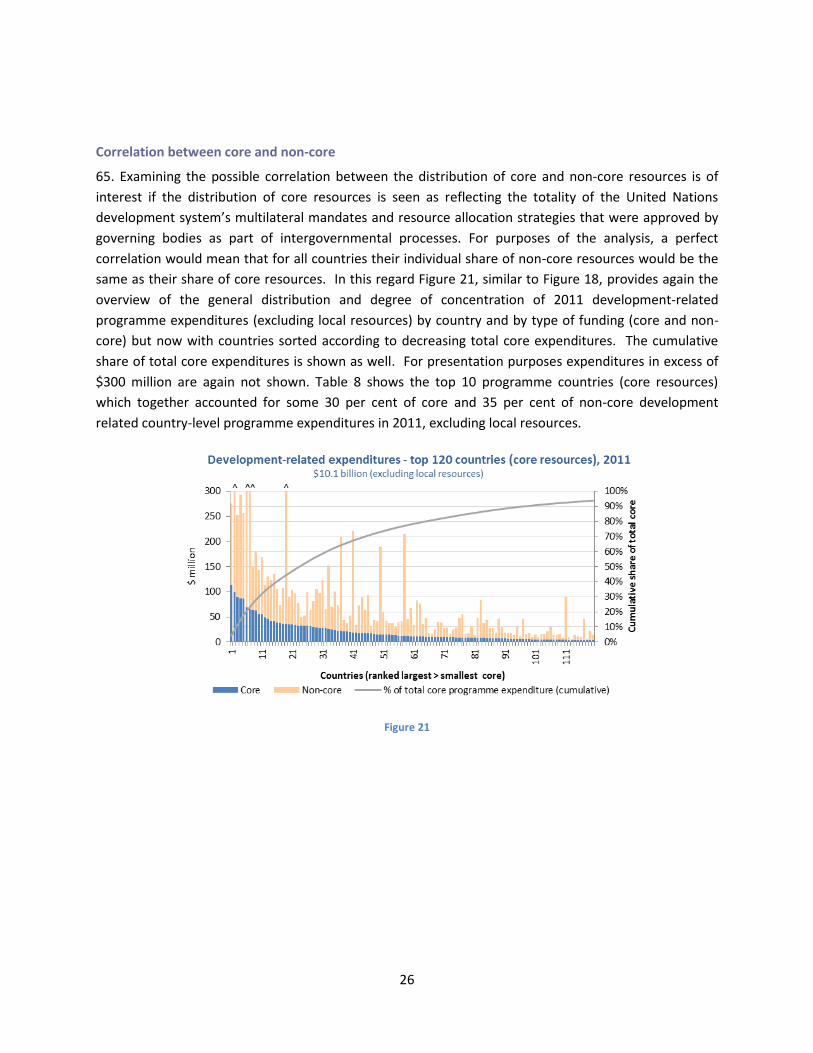
64. Figure 20 provides a different view of how country-level programme expenditures were distributed
among the different country groupings by examining how total expenditures for each group and the two
main sources of funding (core and non-core) compare. The figure shows that there is no marked
difference between the core/non-core ratio for groupings like LLDCs, low-income, LDCs, HDI-low and
fragile states (OECD). The ratio is markedly lower for groupings like UN-IMCs and fragile situations
(World Bank) and somewhat higher for the HDI-medium and middle-income groupings.
Figure 20
26
Correlation between core and non-core
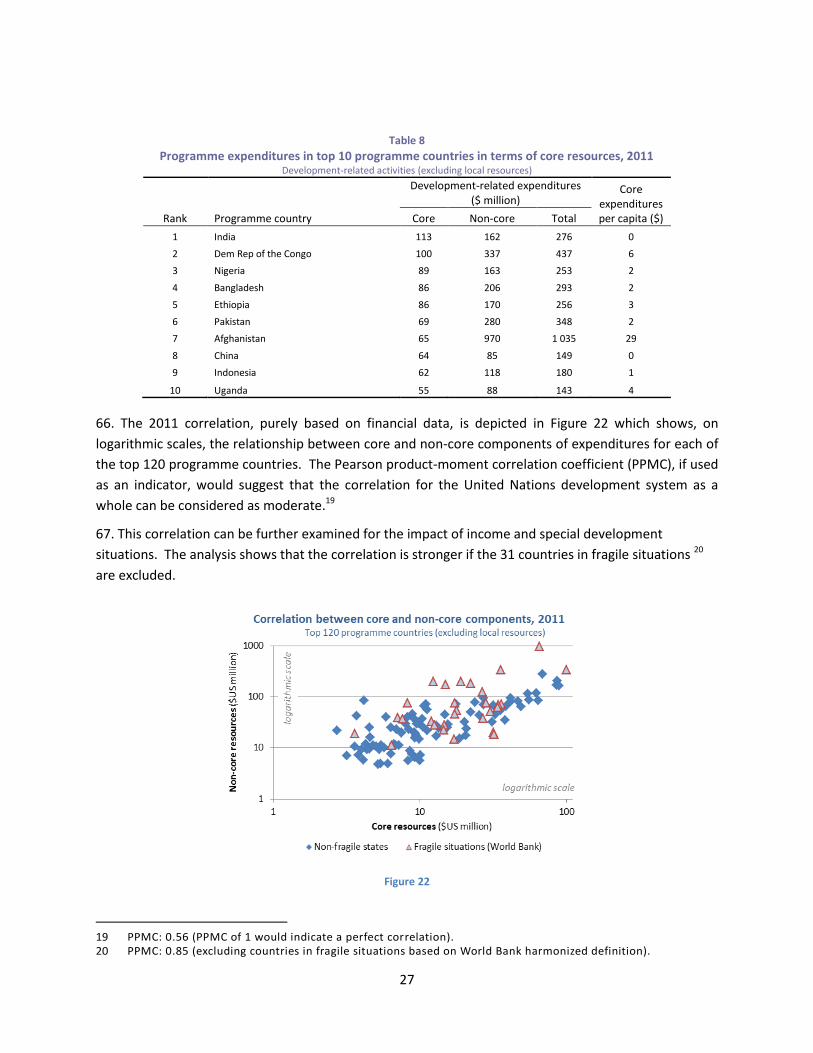
65. Examining the possible correlation between the distribution of core and non-core resources is of
interest if the distribution of core resources is seen as reflecting the totality of the United Nations
development system’s multilateral mandates and resource allocation strategies that were approved by
governing bodies as part of intergovernmental processes. For purposes of the analysis, a perfect
correlation would mean that for all countries their individual share of non-core resources would be the
same as their share of core resources. In this regard Figure 21, similar to Figure 18, provides again the
overview of the general distribution and degree of concentration of 2011 development-related
programme expenditures (excluding local resources) by country and by type of funding (core and non-
core) but now with countries sorted according to decreasing total core expenditures. The cumulative
share of total core expenditures is shown as well. For presentation purposes expenditures in excess of
$300 million are again not shown. Table 8 shows the top 10 programme countries (core resources)
which together accounted for some 30 per cent of core and 35 per cent of non-core development
related country-level programme expenditures in 2011, excluding local resources.
Figure 21
27
Table 8
Programme expenditures in top 10 programme countries in terms of core resources, 2011 Development-related activities (excluding local resources)
Rank Programme country
Development-related expenditures ($ million)
Core expenditures per capita ($) Core Non-core Total
1 India 113 162 276 0
2 Dem Rep of the Congo 100 337 437 6
3 Nigeria 89 163 253 2
4 Bangladesh 86 206 293 2
5 Ethiopia 86 170 256 3
6 Pakistan 69 280 348 2
7 Afghanistan 65 970 1 035 29
8 China 64 85 149 0
9 Indonesia 62 118 180 1
10 Uganda 55 88 143 4
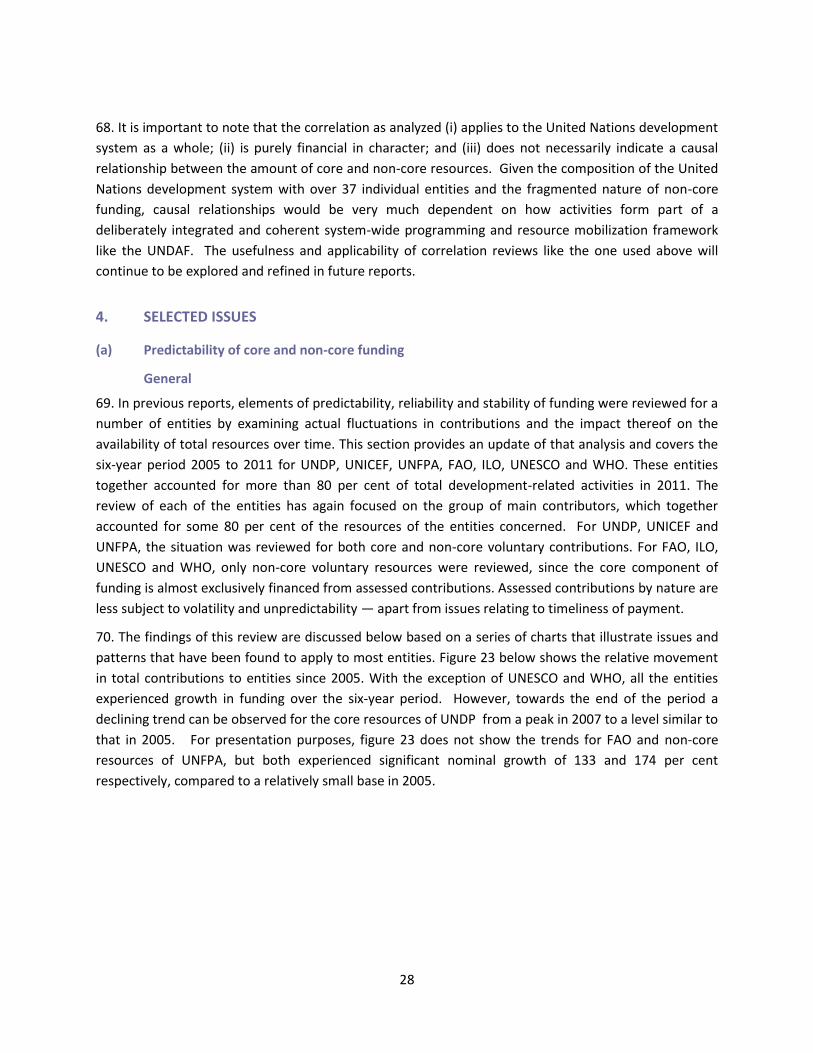
66. The 2011 correlation, purely based on financial data, is depicted in Figure 22 which shows, on
logarithmic scales, the relationship between core and non-core components of expenditures for each of
the top 120 programme countries. The Pearson product-moment correlation coefficient (PPMC), if used
as an indicator, would suggest that the correlation for the United Nations development system as a
whole can be considered as moderate.19
67. This correlation can be further examined for the impact of income and special development
situations. The analysis shows that the correlation is stronger if the 31 countries in fragile situations 20
are excluded.
Figure 22
19 PPMC: 0.56 (PPMC of 1 would indicate a perfect correlation). 20 PPMC: 0.85 (excluding countries in fragile situations based on World Bank harmonized definition).
28
68. It is important to note that the correlation as analyzed (i) applies to the United Nations development
system as a whole; (ii) is purely financial in character; and (iii) does not necessarily indicate a causal
relationship between the amount of core and non-core resources. Given the composition of the United
Nations development system with over 37 individual entities and the fragmented nature of non-core
funding, causal relationships would be very much dependent on how activities form part of a
deliberately integrated and coherent system-wide programming and resource mobilization framework
like the UNDAF. The usefulness and applicability of correlation reviews like the one used above will
continue to be explored and refined in future reports.
4. SELECTED ISSUES
(a) Predictability of core and non-core funding
General
69. In previous reports, elements of predictability, reliability and stability of funding were reviewed for a
number of entities by examining actual fluctuations in contributions and the impact thereof on the
availability of total resources over time. This section provides an update of that analysis and covers the
six-year period 2005 to 2011 for UNDP, UNICEF, UNFPA, FAO, ILO, UNESCO and WHO. These entities
together accounted for more than 80 per cent of total development-related activities in 2011. The
review of each of the entities has again focused on the group of main contributors, which together
accounted for some 80 per cent of the resources of the entities concerned. For UNDP, UNICEF and
UNFPA, the situation was reviewed for both core and non-core voluntary contributions. For FAO, ILO,
UNESCO and WHO, only non-core voluntary resources were reviewed, since the core component of
funding is almost exclusively financed from assessed contributions. Assessed contributions by nature are
less subject to volatility and unpredictability — apart from issues relating to timeliness of payment.
70. The findings of this review are discussed below based on a series of charts that illustrate issues and
patterns that have been found to apply to most entities. Figure 23 below shows the relative movement
in total contributions to entities since 2005. With the exception of UNESCO and WHO, all the entities
experienced growth in funding over the six-year period. However, towards the end of the period a
declining trend can be observed for the core resources of UNDP from a peak in 2007 to a level similar to
that in 2005. For presentation purposes, figure 23 does not show the trends for FAO and non-core
resources of UNFPA, but both experienced significant nominal growth of 133 and 174 per cent
respectively, compared to a relatively small base in 2005.
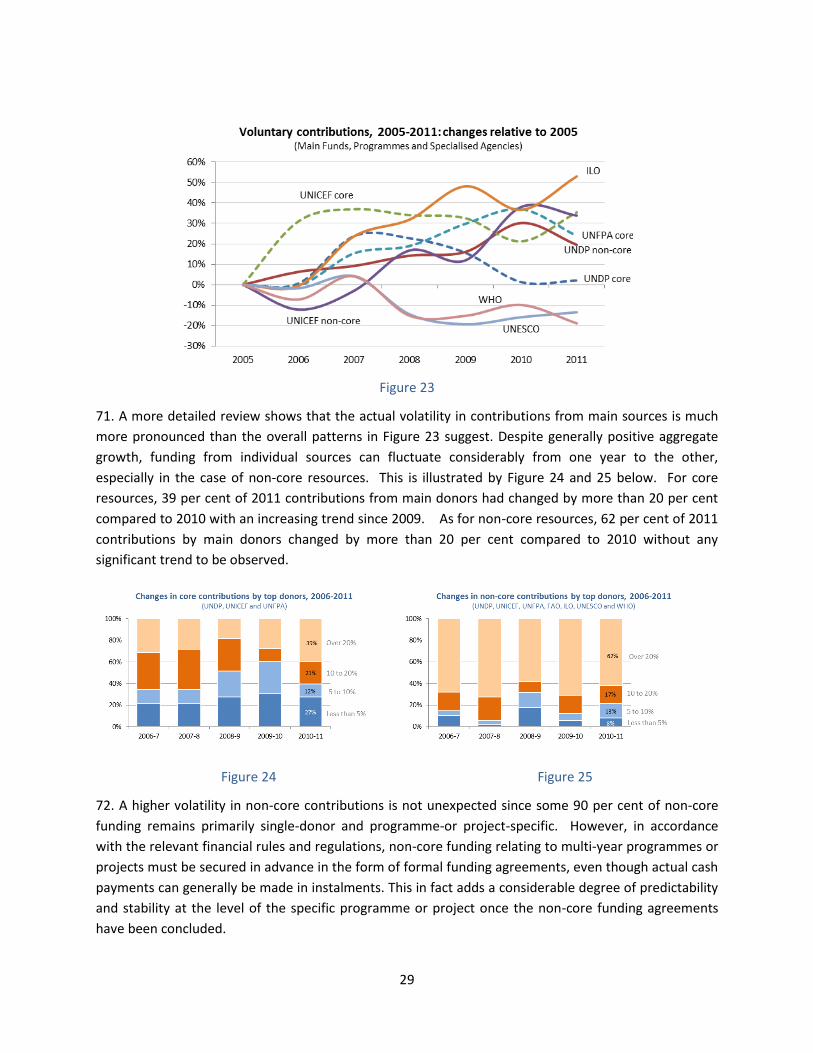
29
Figure 23
71. A more detailed review shows that the actual volatility in contributions from main sources is much
more pronounced than the overall patterns in Figure 23 suggest. Despite generally positive aggregate
growth, funding from individual sources can fluctuate considerably from one year to the other,
especially in the case of non-core resources. This is illustrated by Figure 24 and 25 below. For core
resources, 39 per cent of 2011 contributions from main donors had changed by more than 20 per cent
compared to 2010 with an increasing trend since 2009. As for non-core resources, 62 per cent of 2011
contributions by main donors changed by more than 20 per cent compared to 2010 without any
significant trend to be observed.
Figure 24 Figure 25
72. A higher volatility in non-core contributions is not unexpected since some 90 per cent of non-core
funding remains primarily single-donor and programme-or project-specific. However, in accordance
with the relevant financial rules and regulations, non-core funding relating to multi-year programmes or
projects must be secured in advance in the form of formal funding agreements, even though actual cash
payments can generally be made in instalments. This in fact adds a considerable degree of predictability
and stability at the level of the specific programme or project once the non-core funding agreements
have been concluded.
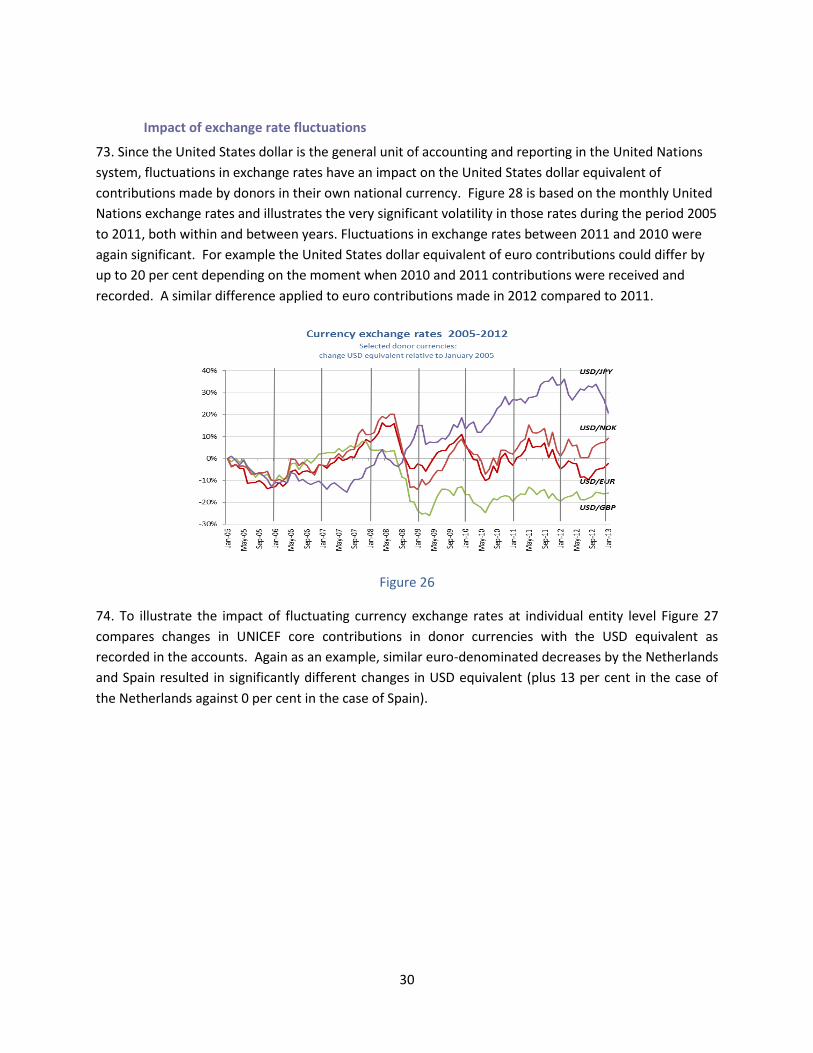
30
Impact of exchange rate fluctuations
73. Since the United States dollar is the general unit of accounting and reporting in the United Nations
system, fluctuations in exchange rates have an impact on the United States dollar equivalent of
contributions made by donors in their own national currency. Figure 28 is based on the monthly United
Nations exchange rates and illustrates the very significant volatility in those rates during the period 2005
to 2011, both within and between years. Fluctuations in exchange rates between 2011 and 2010 were
again significant. For example the United States dollar equivalent of euro contributions could differ by
up to 20 per cent depending on the moment when 2010 and 2011 contributions were received and
recorded. A similar difference applied to euro contributions made in 2012 compared to 2011.
Figure 26
74. To illustrate the impact of fluctuating currency exchange rates at individual entity level Figure 27
compares changes in UNICEF core contributions in donor currencies with the USD equivalent as
recorded in the accounts. Again as an example, similar euro-denominated decreases by the Netherlands
and Spain resulted in significantly different changes in USD equivalent (plus 13 per cent in the case of
the Netherlands against 0 per cent in the case of Spain).
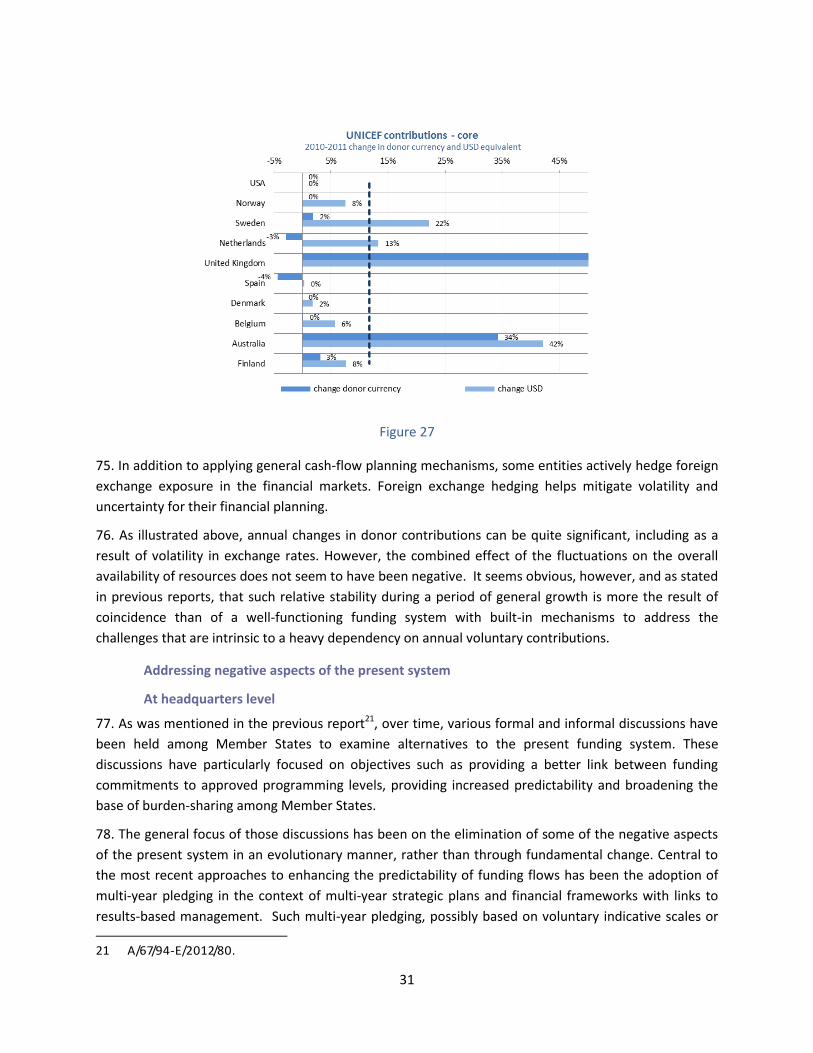
31
Figure 27
75. In addition to applying general cash-flow planning mechanisms, some entities actively hedge foreign
exchange exposure in the financial markets. Foreign exchange hedging helps mitigate volatility and
uncertainty for their financial planning.
76. As illustrated above, annual changes in donor contributions can be quite significant, including as a
result of volatility in exchange rates. However, the combined effect of the fluctuations on the overall
availability of resources does not seem to have been negative. It seems obvious, however, and as stated
in previous reports, that such relative stability during a period of general growth is more the result of
coincidence than of a well-functioning funding system with built-in mechanisms to address the
challenges that are intrinsic to a heavy dependency on annual voluntary contributions.
Addressing negative aspects of the present system
At headquarters level
77. As was mentioned in the previous report21, over time, various formal and informal discussions have
been held among Member States to examine alternatives to the present funding system. These
discussions have particularly focused on objectives such as providing a better link between funding
commitments to approved programming levels, providing increased predictability and broadening the
base of burden-sharing among Member States.
78. The general focus of those discussions has been on the elimination of some of the negative aspects
of the present system in an evolutionary manner, rather than through fundamental change. Central to
the most recent approaches to enhancing the predictability of funding flows has been the adoption of
multi-year pledging in the context of multi-year strategic plans and financial frameworks with links to
results-based management. Such multi-year pledging, possibly based on voluntary indicative scales or
21 A/67/94-E/2012/80.
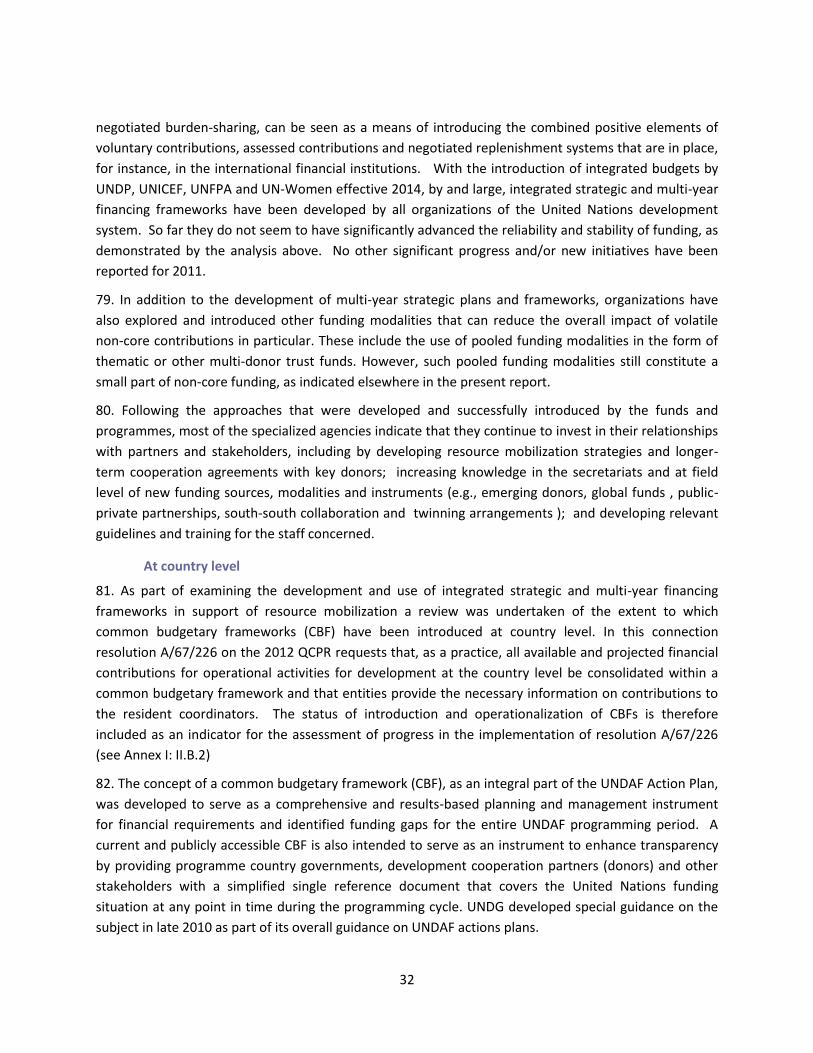
32
negotiated burden-sharing, can be seen as a means of introducing the combined positive elements of
voluntary contributions, assessed contributions and negotiated replenishment systems that are in place,
for instance, in the international financial institutions. With the introduction of integrated budgets by
UNDP, UNICEF, UNFPA and UN-Women effective 2014, by and large, integrated strategic and multi-year
financing frameworks have been developed by all organizations of the United Nations development
system. So far they do not seem to have significantly advanced the reliability and stability of funding, as
demonstrated by the analysis above. No other significant progress and/or new initiatives have been
reported for 2011.
79. In addition to the development of multi-year strategic plans and frameworks, organizations have
also explored and introduced other funding modalities that can reduce the overall impact of volatile
non-core contributions in particular. These include the use of pooled funding modalities in the form of
thematic or other multi-donor trust funds. However, such pooled funding modalities still constitute a
small part of non-core funding, as indicated elsewhere in the present report.
80. Following the approaches that were developed and successfully introduced by the funds and
programmes, most of the specialized agencies indicate that they continue to invest in their relationships
with partners and stakeholders, including by developing resource mobilization strategies and longer-
term cooperation agreements with key donors; increasing knowledge in the secretariats and at field
level of new funding sources, modalities and instruments (e.g., emerging donors, global funds , public-
private partnerships, south-south collaboration and twinning arrangements ); and developing relevant
guidelines and training for the staff concerned.
At country level
81. As part of examining the development and use of integrated strategic and multi-year financing
frameworks in support of resource mobilization a review was undertaken of the extent to which
common budgetary frameworks (CBF) have been introduced at country level. In this connection
resolution A/67/226 on the 2012 QCPR requests that, as a practice, all available and projected financial
contributions for operational activities for development at the country level be consolidated within a
common budgetary framework and that entities provide the necessary information on contributions to
the resident coordinators. The status of introduction and operationalization of CBFs is therefore
included as an indicator for the assessment of progress in the implementation of resolution A/67/226
(see Annex I: II.B.2)
82. The concept of a common budgetary framework (CBF), as an integral part of the UNDAF Action Plan,
was developed to serve as a comprehensive and results-based planning and management instrument
for financial requirements and identified funding gaps for the entire UNDAF programming period. A
current and publicly accessible CBF is also intended to serve as an instrument to enhance transparency
by providing programme country governments, development cooperation partners (donors) and other
stakeholders with a simplified single reference document that covers the United Nations funding
situation at any point in time during the programming cycle. UNDG developed special guidance on the
subject in late 2010 as part of its overall guidance on UNDAF actions plans.
33
83. Information on the current status of CBFs was collected through the 2013 survey of resident
representatives and thus describes the situation at about two and half years after introduction of the
UNDG guidance. Analysis based on the survey reveals that a CBF had been introduced in 30 countries, or
28 per cent of the countries covered by the survey of RCs. The countries with CBFs so far include the
eight DaO pilot countries, 14 self-starters, and eight others. Of those, 20 per cent reported that their
CBF was formally updated more than once a year while 80 per cent reported to update the CBF once a
year (50 per cent) or even less frequently (30 per cent). While in close to 100 per cent of the cases CBFs
were reported to be accessible at all times to host governments, such accessibility for development
cooperation partners (donors) and other stakeholders was less (82 per cent and 74 per cent
respectively). In only 48 per cent of the countries where a CBF exists was it used to a moderate or large
extent as the basis of a deliberate United Nations system joint resource mobilization strategy.
84. In conclusion, the take-up of CBFs in 30 countries is welcomed considering that the use of a CBF has
hitherto been optional. However, with the QCPR resolution, the CBF has become a requirement in all
countries. Much remains to be done including with regard to entities providing the necessary
information on funding commitments and programme implementation in general.
(b) Burden-sharing
85. Figure 13 on page 14 and Table A-5 in the online Statistical Annex provide information about 2011
development-related contributions by main source and type of funding (core and non-core). Some 59
per cent of total contributions were made by OECD/DAC countries.22 This share is the combined result of
DAC countries’ contributing 83 per cent of total development-related core and 47 per cent of
development-related non-core resources.
86. In order to examine the issue of burden-sharing, development-related core contributions by
individual OECD/DAC countries were reviewed relative to their GNI as expressed by a core-DEV/GNI
ratio. Figure 28 shows the outcome of this review including how country-specific core-DEV/GNI ratios
compare to the median ratio of 0.0127 per cent for the group of DAC countries as a whole. It should be
noted that a logarithmic scale is used on the horizontal axis in Figure 28. As a result, countries that
provide significantly different amounts of core contributions may appear relatively close to each other in
the graph. The analysis confirms that burden-sharing is uneven. The eleven countries that show a core-
DEV/GNI ratio in excess of the median ratio (group A) together contributed $2.0 billion or 50 per cent of
total OECD/DAC core contributions while their share of total OECD/DAC GNI was only 15 per cent. The
eleven countries that show a core-DEV/GNI ratio below the median ratio (group B) contributed some 47
per cent of total OECD/DAC core contributions but their share of total OECD/DAC GNI was 83 per cent.23
This uneven burden-sharing has added importance in view of the fact that core resources are found to
subsidize the support to and management of activities financed from non-core resources. This is further
reviewed in Part 4 (c) on page 35.
22 Excluding contributions to Multi-donor trust funds (MDTFs). Figure 12 on page 13 shows the OECD/DAC share when MDTFs are included. 23 Remaining 3 per cent of core contributions and 2 per cent of total GNI on account of country with median ratio.
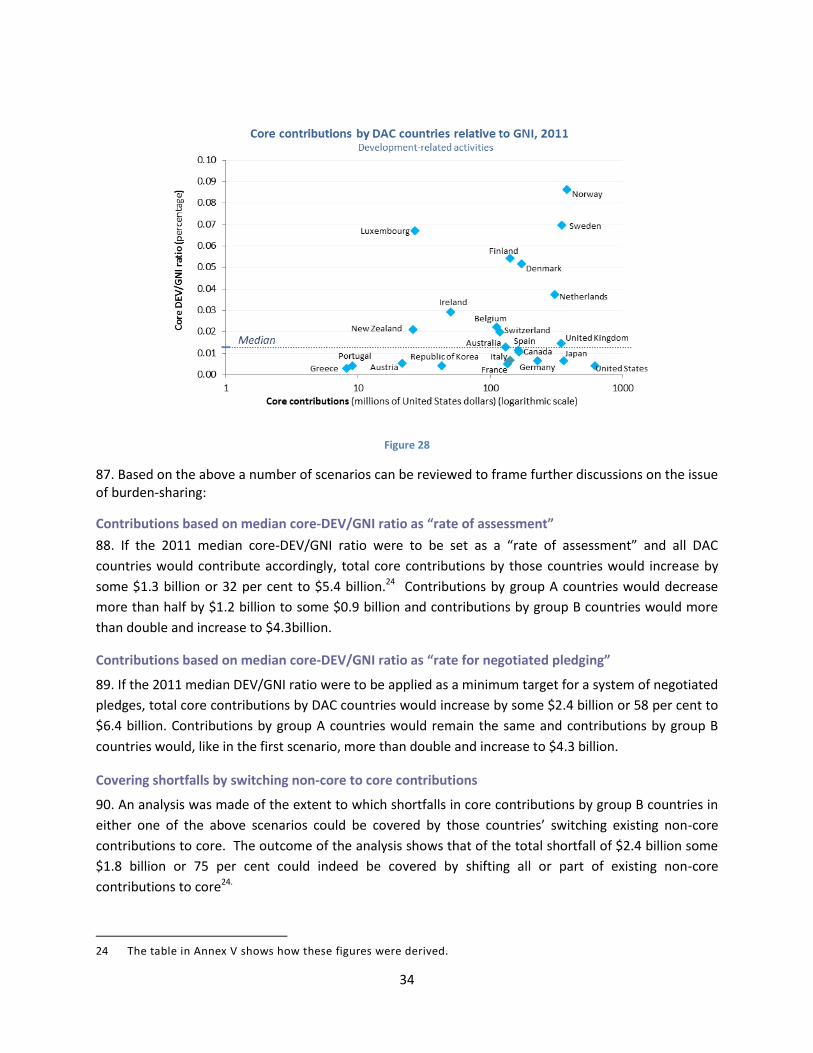
34
Figure 28
87. Based on the above a number of scenarios can be reviewed to frame further discussions on the issue of burden-sharing:
Contributions based on median core-DEV/GNI ratio as “rate of assessment”
88. If the 2011 median core-DEV/GNI ratio were to be set as a “rate of assessment” and all DAC
countries would contribute accordingly, total core contributions by those countries would increase by
some $1.3 billion or 32 per cent to $5.4 billion.24 Contributions by group A countries would decrease
more than half by $1.2 billion to some $0.9 billion and contributions by group B countries would more
than double and increase to $4.3billion.
Contributions based on median core-DEV/GNI ratio as “rate for negotiated pledging”
89. If the 2011 median DEV/GNI ratio were to be applied as a minimum target for a system of negotiated
pledges, total core contributions by DAC countries would increase by some $2.4 billion or 58 per cent to
$6.4 billion. Contributions by group A countries would remain the same and contributions by group B
countries would, like in the first scenario, more than double and increase to $4.3 billion.
Covering shortfalls by switching non-core to core contributions
90. An analysis was made of the extent to which shortfalls in core contributions by group B countries in
either one of the above scenarios could be covered by those countries’ switching existing non-core
contributions to core. The outcome of the analysis shows that of the total shortfall of $2.4 billion some
$1.8 billion or 75 per cent could indeed be covered by shifting all or part of existing non-core
contributions to core24.
24 The table in Annex V shows how these figures were derived.
35
91. On a number of occasions, various governing bodies have called for or discussed the desirability of a
major shift of donor countries’ contributions from non-core to core. A number of factors may play a
role. As the strategic priorities of the United Nations system have become more complex over the
decades, so have those of the major donor countries. In general, donor country aid policies are much
more targeted today than in the past - either by theme or beneficiary or by some combination of the
two. Donor aid ministries have also added over the years many new targeted funding lines to their
institutional and budgetary structures. Core resources generally come from a budget line used to sustain
long-term strategic partnerships with multilateral organizations. Here, the competition for resources has
increased dramatically, with the EU and the global funds being but two examples.
92. While further research is necessary to confirm the details, most of the non-core funding does not
come from these same multilateral budget lines, but from “country-targeted” or “theme-targeted”
funding lines that may even be controlled by different line ministries. Most of these budget lines have
legislative or regulatory conditions that govern their use – with some combination of beneficiary or
thematic targeting. Whether purpose-limited by legislation or ministry-internal regulation, these funds
may not easily cross budget lines.
93. In the near future, a sample survey is planned to be carried out with OECD/DAC donor countries to
attempt to understand more fully the nature and importance of these legislative or regulatory
restrictions.
(c) Non-core funding and cost recovery
Background and context
94. The exponential growth in non-core funded activities over the past 15 years made the adequate
recovery of institutional costs associated with the support to those activities an issue of growing
concern. It has been the subject of review amongst others by entities and their governing bodies
individually, at the level of the High-level Committee on Management of the CEB and as part of
comprehensive policy reviews, including the most recent 2012 QCPR. The concern centres on the fact
that institutional support (substantive and operational) to non-core funded activities may in fact be
subsidized by core resources with a consequent negative effect on the availability of remaining core
resources for programme activities, in particular at country level.
95. Recent reports of the Secretary-General on the funding of operational activities for development
have therefore reviewed and analysed non-core funding and cost recovery in more detail25. These
reviews have been based, amongst others, on a high-level comparison between the use of core and non-
core resources for (a) programme activities (programme costs); and (b) programme support and
management activities (non-programme costs). Some entities26 refer to programme support as
“development effectiveness”.
96. In line with commonly accepted and generally harmonized definitions, programme costs can be
traced to specific programme components or projects, which contribute directly to the delivery of
25 See A/67/94-E/2012/80, A/66/79-E/2011/77, A/65/79-E/2010/76 26 UNDP, UNICEF, UNFPA, UN-Women.
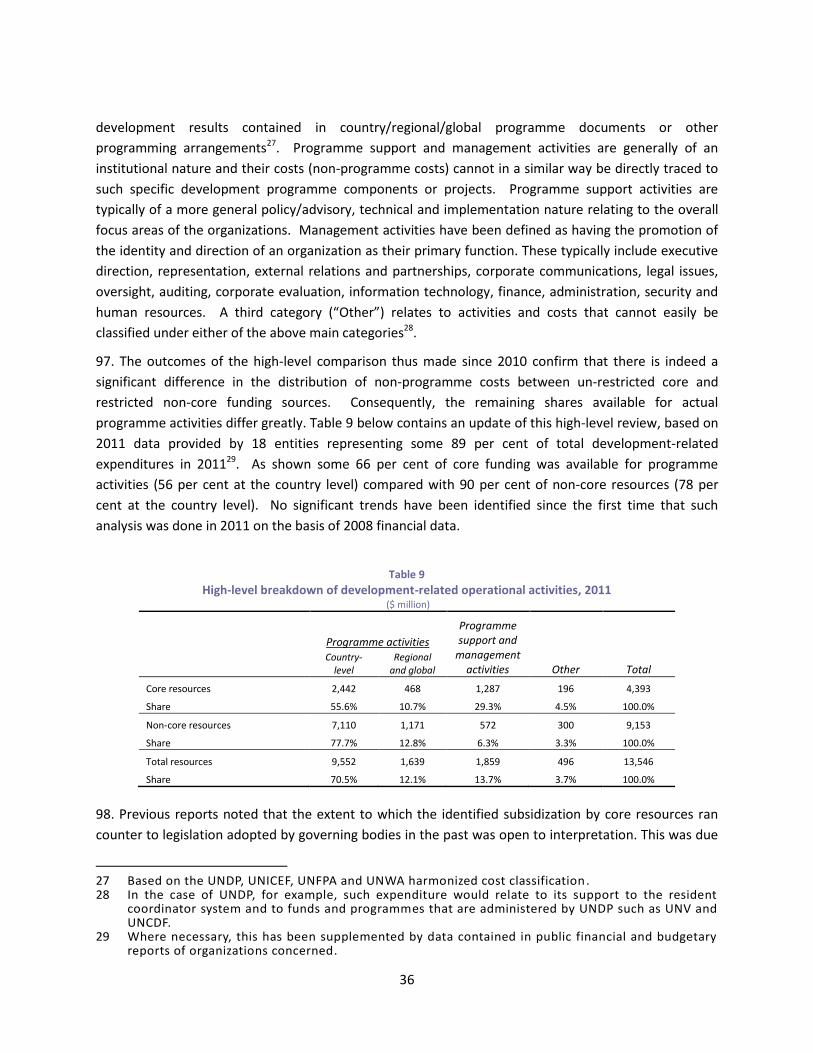
36
development results contained in country/regional/global programme documents or other
programming arrangements27. Programme support and management activities are generally of an
institutional nature and their costs (non-programme costs) cannot in a similar way be directly traced to
such specific development programme components or projects. Programme support activities are
typically of a more general policy/advisory, technical and implementation nature relating to the overall
focus areas of the organizations. Management activities have been defined as having the promotion of
the identity and direction of an organization as their primary function. These typically include executive
direction, representation, external relations and partnerships, corporate communications, legal issues,
oversight, auditing, corporate evaluation, information technology, finance, administration, security and
human resources. A third category (“Other”) relates to activities and costs that cannot easily be
classified under either of the above main categories28.
97. The outcomes of the high-level comparison thus made since 2010 confirm that there is indeed a
significant difference in the distribution of non-programme costs between un-restricted core and
restricted non-core funding sources. Consequently, the remaining shares available for actual
programme activities differ greatly. Table 9 below contains an update of this high-level review, based on
2011 data provided by 18 entities representing some 89 per cent of total development-related
expenditures in 201129. As shown some 66 per cent of core funding was available for programme
activities (56 per cent at the country level) compared with 90 per cent of non-core resources (78 per
cent at the country level). No significant trends have been identified since the first time that such
analysis was done in 2011 on the basis of 2008 financial data.
Table 9
High-level breakdown of development-related operational activities, 2011 ($ million)
Programme activities
Programme support and
management activities Other Total
Country-
level Regional
and global
Core resources 2,442 468 1,287 196 4,393
Share 55.6% 10.7% 29.3% 4.5% 100.0%
Non-core resources 7,110 1,171 572 300 9,153
Share 77.7% 12.8% 6.3% 3.3% 100.0%
Total resources 9,552 1,639 1,859 496 13,546
Share 70.5% 12.1% 13.7% 3.7% 100.0%
98. Previous reports noted that the extent to which the identified subsidization by core resources ran
counter to legislation adopted by governing bodies in the past was open to interpretation. This was due
27 Based on the UNDP, UNICEF, UNFPA and UNWA harmonized cost classification. 28 In the case of UNDP, for example, such expenditure would relate to its support to the resident
coordinator system and to funds and programmes that are administered by UNDP such as UNV and UNCDF.
29 Where necessary, this has been supplemented by data contained in public financial and budgetary reports of organizations concerned.
37
to legislative ambiguity about which costs — full or incremental costs — were expected to be fully
recovered. As stated in previous reports, a principle of full cost recovery would be based on the premise
that all activities, regardless of the source of financing and level of earmarking equally benefit, either
directly or indirectly, from the totality of substantive and operational capacities of entities. Table 9
shows that applying such principle of full cost recovery (without further differentiation) would require a
recovery rate in the order of 17 per cent if all such cost would indeed be recovered through an upfront
percentage cost recovery rate only. Applying such a rate across the board would result in a release of
some $719 million in core resources for programme activities, or the equivalent of some 25 per cent of
the current level of core programme activities. WFP is an example of an entity that achieves full cost
recovery of its equivalent of non-programme costs by financing its entire Programme Support and
Administrative Budget (PSA) by charging the same cost recovery rate to WFPs equivalent of un-
earmarked core resources (“multilateral contributions”) and earmarked non-core contributions
(“directed multilateral contributions”).
2012 QCPR
99. The 2012 QCPR again reviewed the issue of non-core funding and cost recovery. This review was
informed by the background information and analyses contained in the 2012 and previous reports on
the funding of operational activities for development. In its resolution A/67/226 the General Assembly
“noted with concern that the non-programme costs relating to non-core programme activities continue
to draw resources from core resources for programme activities” and reaffirmed “that the guiding
principle governing the financing of all non-programme cost should be based on full cost recovery,
proportionally, from core and non-core funding sources”.
100. Accordingly the Assembly requested the Executive Boards of the United Nations funds and
programmes, and encouraged the governing bodies of the specialized agencies “to adopt cost recovery
frameworks by 2013, with a view to their full implementation in 2014, based on the guiding principle of
full cost recovery, proportionally, from core and non-core resources, and a simple, transparent and
harmonized methodology”. It further requested the funds and programmes, and urged the specialized
agencies, to include estimated amounts to be recovered in their budgets and to report on actual cost
recovery amounts as part of their regular financial reporting. The Assembly requested the Secretary-
General to report on the progress made in the context of his annual report on the funding of operational
activities for development.
UNDP, UNICEF, UNFPA, UN-Women
101. The 2012 QCPR coincided with a review by UNDP, UNICEF, UNFPA and UN-Women of a harmonized
cost recovery rate and calculation methodology as part of a joint roadmap to the first-ever integrated
budgets that these entities will submit to their Executive Boards in the second half of 2013 and that will
cover the period 2014-201730. These four entities combined account for some 58 per cent of all
development related operational activities (54 per cent of all core and 60 per cent of all non-core
resources).
30 See DP-FPA/2013/1-E/ICEF/2013/8 of 16 January 2013
38
102. The entities proposed to their Boards what would seem a two-pronged approach to the recovery of
institutional non-programme costs as follows: (a) the application of a percentage recovery rate to cover
what they defined as “eligible costs”; and (b) the recovery of all programme support / development
effectiveness costs through direct charges to core and non-core funded programmes and projects.
Orders of magnitude of what has been defined as eligible costs for the application of a percentage cost
recovery rate ranges from 39 per cent of the institutional budget in the case of UN-Women to 54 per
cent in the case of UNICEF. Programme support/development effectiveness costs range from 15 per
cent of the institutional budget in the case of UNDP to 27 per cent in the case of UNICEF. Like in the
past the above eligible costs exclude, amongst others, what has been defined as “critical cross-cutting
functions”. These costs range from 6 per cent of the institutional budget for UNDP to 28 per cent in the
case of UN-Women. Resolution A/67/226 which established the guiding principle that the financing of
all non-programme costs should be based on full cost recovery, proportionally, from core and non-core
funding sources, did not make a provision for such exclusion.
103. The Boards approved the harmonized methodology for calculating the cost-recovery rates31. With
regard to the application of a percentage recovery rate to cover what, as part of total non-programme
costs, has been defined as “eligible costs”, the Executive Boards of UNDP, UNICEF, UNPFA and UN-
Women endorsed “a general, harmonized cost-recovery rate of 8 per cent for non-core contributions.
This rate will be reviewed in 2016, with the possibility of increasing it if it is not consistent with the
principle of full cost recovery, proportionally from core and non-core funding sources, as mandated by
the quadrennial comprehensive policy review of operational activities for development of the United
Nations system”.
104. The Boards requested that the entities “include in the midterm review of their integrated budgets,
information on the implementation of the approved cost-recovery rates, including the approved
underlying calculation methodology and the inclusion of each cost category; their actual cost recovery
rates for the two previous financial years; and an analysis of compliance with the principle of full cost
recovery, funded proportionally from core and non-core resources, as mandated in General Assembly
resolution 67/226”. The Boards further requested that “ an independent and external assessment be
performed in 2016 on the consistency and alignment of the new cost-recovery methodology with
General Assembly resolution 67/226”.
105. The Boards did not review impact scenarios to assess implications of the approved methodology
and cost recovery rate on available resources for programme activities under core and non-core. Also,
at the time of preparing the present report, the UNDP, UNICEF, UNFPA and UN-Women integrated
budget proposals for 2014-2017 were not finalized as yet. Accordingly, and in the context of the present
report, no assessment could be made on the exact impact of the two-pronged cost recovery proposals
on core and non-core funded programme activities, and thus on the consistency and alignment of the
approved cost-recovery methodology with General Assembly resolution 67/226. At this point in time
the alignment is not evident. The manner in which programme support/development effectiveness
31 See DP/2013/10 of 12 February 2013 and E/ICEF/2013/9 of 13 February 2013
39
costs will in practice be covered by core and non-core funding sources will be a determining factor in
this regard.
106. As to entities other than UNDP, UNICEF, UNFPA and UN-Women mention was made of WFP as a
programme that already operates a system of full cost recovery, proportionally, from its equivalent of
core and non-core funding sources. FAO will present a comprehensive report on all aspects of FAO’s
support cost policy to its Finance Committee in 2013.
Follow-up
107. As requested by the General Assembly in resolution A/67/226 performance and progress will
continue to be reviewed in the context of future editions of the present report on the funding of
operational activities for development. This will continue to be based, amongst others, on the high-level
comparison between the use of core and non-core resources for (a) programme activities (programme
costs); and (b) programme support and management activities (non-programme costs). This is reflected
in the framework that has been developed to facilitate the assessment of the progress being made in
the implementation of funding related provisions contained in resolution 67/226 (see Annex I: II.D.1,
II.D.2 and II.D.3)
(d) Concentration and fragmentation
108. In this section, financial indicators and statistical methods are used to further examine the level of
significance, concentration and fragmentation of operational activities for development in 2011. Such
an analysis based on financial information has inherent limitations as it does not cover the qualitative
aspects of the outcomes of the relationships between United Nations entities and programme countries.
For example, the amount of support extended by a particular entity to a given country may be very
small in terms of expenditures, but be highly relevant and effective in its impact on addressing broader
priority needs.
109. Despite its limitations, an analysis on the basis of financial information can provide insights into the
relative importance of UN-OAD compared to total development assistance at programme country level,
and into the way that individual United Nations development system entities differ in their distribution
of resources.
110. The methodology applied in this section follows the one developed and applied by OECD/DAC to
assess the degree of fragmentation of ODA from its members to recipient countries. While this
methodology was not specifically designed to be applied in a multilateral context, an analysis of this kind
can provide useful information on aspects and context of relationships between the United Nations
development system and programme countries and hence inform reviews of UN-OAD at different levels.
111. The methodology as applied to the review of UN-OAD is summarised in Box 1. The analysis is based
on total operational activities for development, thus comprising both development-related and
humanitarian assistance-related activities, and all types of funding i.e. core and non-core combined.
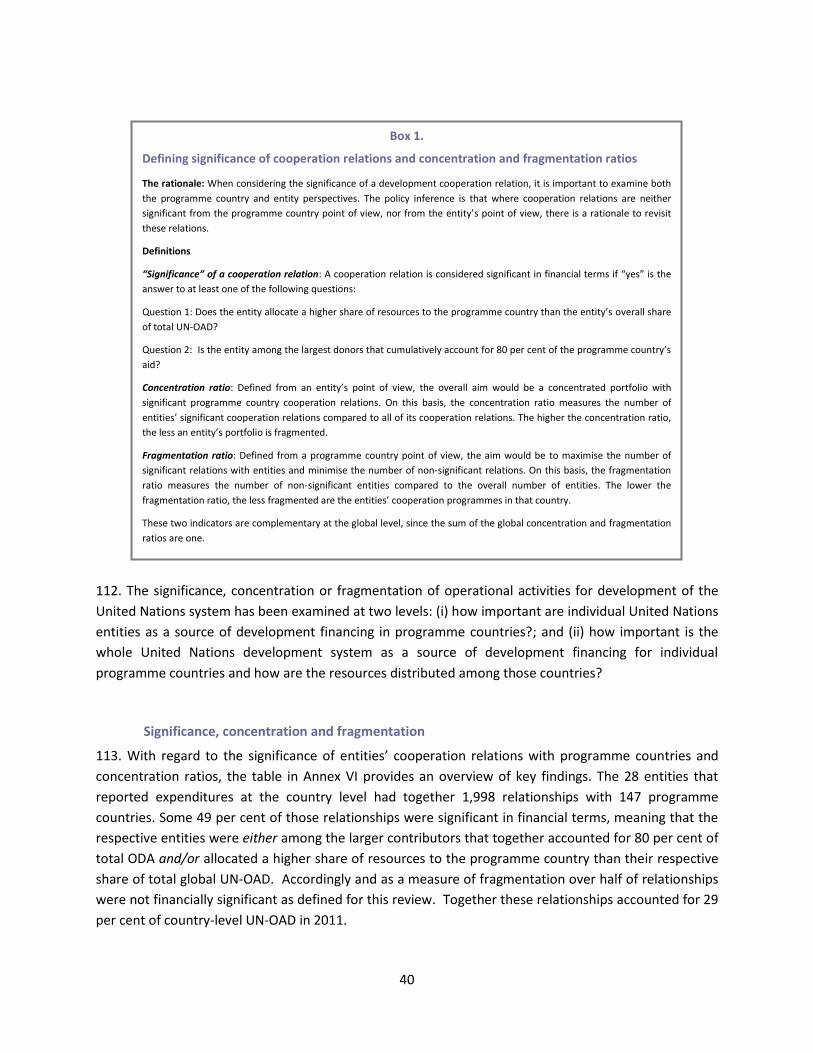
40
112. The significance, concentration or fragmentation of operational activities for development of the
United Nations system has been examined at two levels: (i) how important are individual United Nations
entities as a source of development financing in programme countries?; and (ii) how important is the
whole United Nations development system as a source of development financing for individual
programme countries and how are the resources distributed among those countries?
Significance, concentration and fragmentation
113. With regard to the significance of entities’ cooperation relations with programme countries and
concentration ratios, the table in Annex VI provides an overview of key findings. The 28 entities that
reported expenditures at the country level had together 1,998 relationships with 147 programme
countries. Some 49 per cent of those relationships were significant in financial terms, meaning that the
respective entities were either among the larger contributors that together accounted for 80 per cent of
total ODA and/or allocated a higher share of resources to the programme country than their respective
share of total global UN-OAD. Accordingly and as a measure of fragmentation over half of relationships
were not financially significant as defined for this review. Together these relationships accounted for 29
per cent of country-level UN-OAD in 2011.
Box 1.
Defining significance of cooperation relations and concentration and fragmentation ratios
The rationale: When considering the significance of a development cooperation relation, it is important to examine both
the programme country and entity perspectives. The policy inference is that where cooperation relations are neither
significant from the programme country point of view, nor from the entity’s point of view, there is a rationale to revisit
these relations.
Definitions
“Significance” of a cooperation relation: A cooperation relation is considered significant in financial terms if “yes” is the
answer to at least one of the following questions:
Question 1: Does the entity allocate a higher share of resources to the programme country than the entity’s overall share
of total UN-OAD?
Question 2: Is the entity among the largest donors that cumulatively account for 80 per cent of the programme country’s
aid?
Concentration ratio: Defined from an entity’s point of view, the overall aim would be a concentrated portfolio with
significant programme country cooperation relations. On this basis, the concentration ratio measures the number of
entities’ significant cooperation relations compared to all of its cooperation relations. The higher the concentration ratio,
the less an entity’s portfolio is fragmented.
Fragmentation ratio: Defined from a programme country point of view, the aim would be to maximise the number of
significant relations with entities and minimise the number of non-significant relations. On this basis, the fragmentation
ratio measures the number of non-significant entities compared to the overall number of entities. The lower the
fragmentation ratio, the less fragmented are the entities’ cooperation programmes in that country.
These two indicators are complementary at the global level, since the sum of the global concentration and fragmentation
ratios are one.
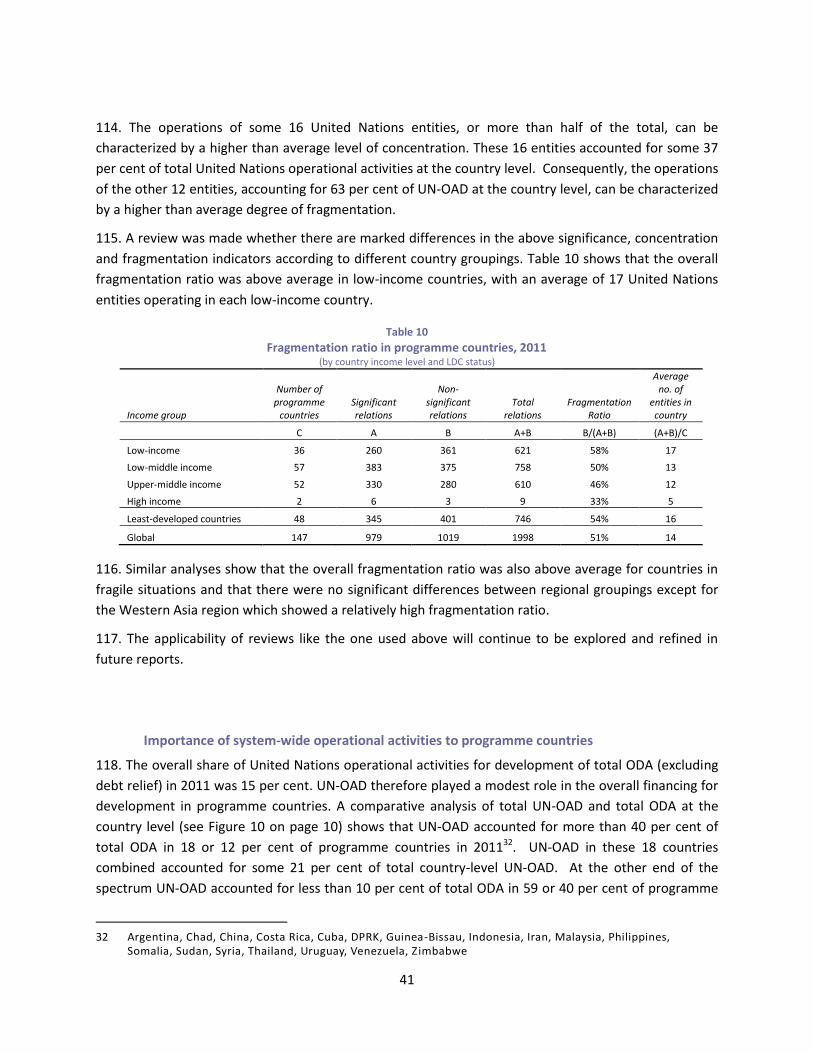
41
114. The operations of some 16 United Nations entities, or more than half of the total, can be
characterized by a higher than average level of concentration. These 16 entities accounted for some 37
per cent of total United Nations operational activities at the country level. Consequently, the operations
of the other 12 entities, accounting for 63 per cent of UN-OAD at the country level, can be characterized
by a higher than average degree of fragmentation.
115. A review was made whether there are marked differences in the above significance, concentration
and fragmentation indicators according to different country groupings. Table 10 shows that the overall
fragmentation ratio was above average in low-income countries, with an average of 17 United Nations
entities operating in each low-income country.
Table 10
Fragmentation ratio in programme countries, 2011 (by country income level and LDC status)
Income group
Number of programme
countries Significant relations
Non-significant relations
Total relations
Fragmentation Ratio
Average no. of
entities in country
C A B A+B B/(A+B) (A+B)/C
Low-income 36 260 361 621 58% 17
Low-middle income 57 383 375 758 50% 13
Upper-middle income 52 330 280 610 46% 12
High income 2 6 3 9 33% 5
Least-developed countries 48 345 401 746 54% 16
Global 147 979 1019 1998 51% 14
116. Similar analyses show that the overall fragmentation ratio was also above average for countries in
fragile situations and that there were no significant differences between regional groupings except for
the Western Asia region which showed a relatively high fragmentation ratio.
117. The applicability of reviews like the one used above will continue to be explored and refined in
future reports.
Importance of system-wide operational activities to programme countries
118. The overall share of United Nations operational activities for development of total ODA (excluding
debt relief) in 2011 was 15 per cent. UN-OAD therefore played a modest role in the overall financing for
development in programme countries. A comparative analysis of total UN-OAD and total ODA at the
country level (see Figure 10 on page 10) shows that UN-OAD accounted for more than 40 per cent of
total ODA in 18 or 12 per cent of programme countries in 201132. UN-OAD in these 18 countries
combined accounted for some 21 per cent of total country-level UN-OAD. At the other end of the
spectrum UN-OAD accounted for less than 10 per cent of total ODA in 59 or 40 per cent of programme
32 Argentina, Chad, China, Costa Rica, Cuba, DPRK, Guinea-Bissau, Indonesia, Iran, Malaysia, Philippines,
Somalia, Sudan, Syria, Thailand, Uruguay, Venezuela, Zimbabwe
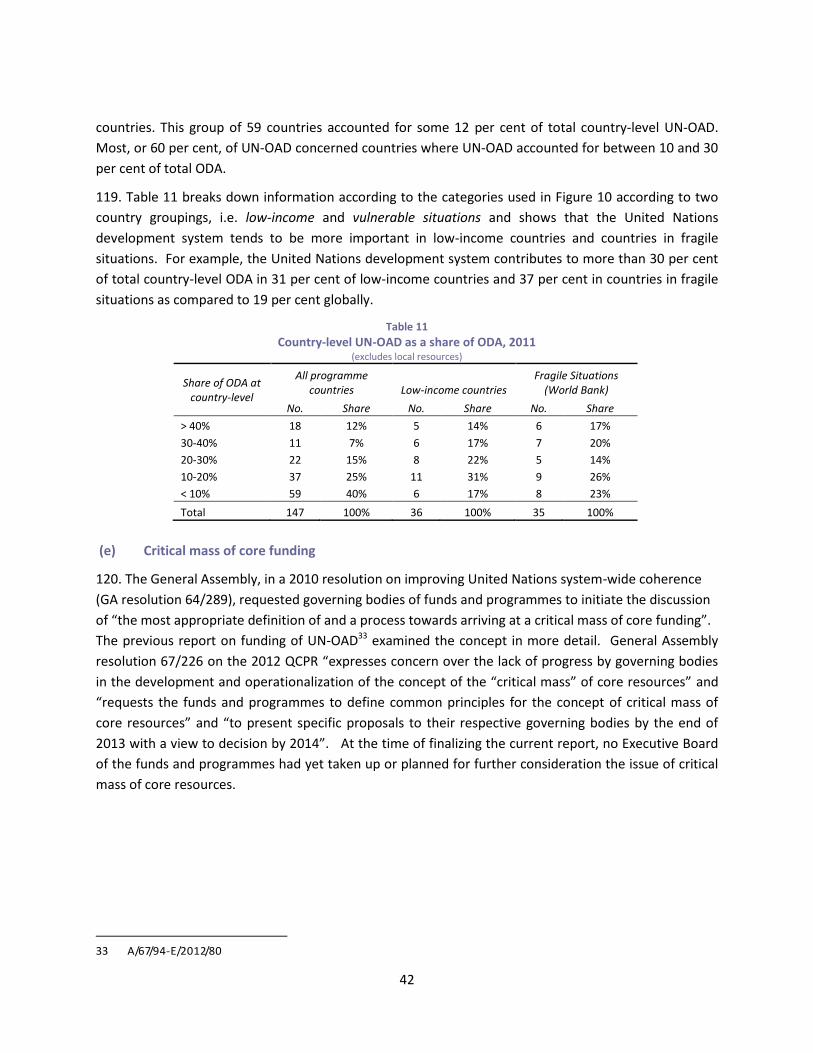
42
countries. This group of 59 countries accounted for some 12 per cent of total country-level UN-OAD.
Most, or 60 per cent, of UN-OAD concerned countries where UN-OAD accounted for between 10 and 30
per cent of total ODA.
119. Table 11 breaks down information according to the categories used in Figure 10 according to two
country groupings, i.e. low-income and vulnerable situations and shows that the United Nations
development system tends to be more important in low-income countries and countries in fragile
situations. For example, the United Nations development system contributes to more than 30 per cent
of total country-level ODA in 31 per cent of low-income countries and 37 per cent in countries in fragile
situations as compared to 19 per cent globally.
Table 11
Country-level UN-OAD as a share of ODA, 2011 (excludes local resources)
Share of ODA at country-level
All programme countries Low-income countries
Fragile Situations (World Bank)
No. Share No. Share No. Share
> 40% 18 12% 5 14% 6 17%
30-40% 11 7% 6 17% 7 20%
20-30% 22 15% 8 22% 5 14%
10-20% 37 25% 11 31% 9 26%
< 10% 59 40% 6 17% 8 23%
Total 147 100% 36 100% 35 100%
(e) Critical mass of core funding
120. The General Assembly, in a 2010 resolution on improving United Nations system-wide coherence
(GA resolution 64/289), requested governing bodies of funds and programmes to initiate the discussion
of “the most appropriate definition of and a process towards arriving at a critical mass of core funding”.
The previous report on funding of UN-OAD33 examined the concept in more detail. General Assembly
resolution 67/226 on the 2012 QCPR “expresses concern over the lack of progress by governing bodies
in the development and operationalization of the concept of the “critical mass” of core resources” and
“requests the funds and programmes to define common principles for the concept of critical mass of
core resources” and “to present specific proposals to their respective governing bodies by the end of
2013 with a view to decision by 2014”. At the time of finalizing the current report, no Executive Board
of the funds and programmes had yet taken up or planned for further consideration the issue of critical
mass of core resources.
33 A/67/94-E/2012/80
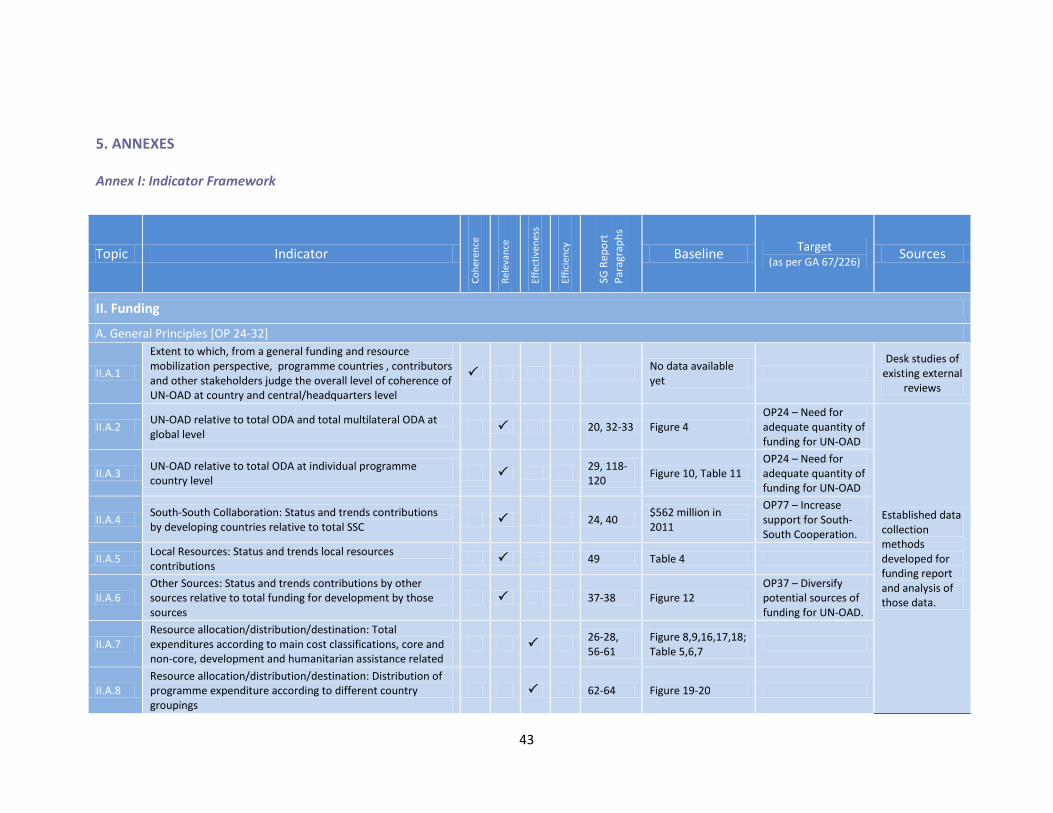
43
5. ANNEXES
Annex I: Indicator Framework
Topic Indicator
Co
her
ence
Rel
evan
ce
Effe
ctiv
enes
s
Effi
cien
cy
SG R
epo
rt
Par
agra
ph
s
Baseline Target
(as per GA 67/226) Sources
II. Funding
A. General Principles [OP 24-32]
II.A.1
Extent to which, from a general funding and resource mobilization perspective, programme countries , contributors and other stakeholders judge the overall level of coherence of UN-OAD at country and central/headquarters level
No data available yet
Desk studies of
existing external reviews
II.A.2 UN-OAD relative to total ODA and total multilateral ODA at global level
20, 32-33 Figure 4 OP24 – Need for adequate quantity of funding for UN-OAD
Established data collection methods developed for funding report and analysis of those data.
II.A.3 UN-OAD relative to total ODA at individual programme country level
29, 118-120
Figure 10, Table 11 OP24 – Need for adequate quantity of funding for UN-OAD
II.A.4 South-South Collaboration: Status and trends contributions by developing countries relative to total SSC
24, 40 $562 million in 2011
OP77 – Increase support for South-South Cooperation.
II.A.5 Local Resources: Status and trends local resources contributions
49 Table 4
II.A.6 Other Sources: Status and trends contributions by other sources relative to total funding for development by those sources
37-38 Figure 12 OP37 – Diversify potential sources of funding for UN-OAD.
II.A.7 Resource allocation/distribution/destination: Total expenditures according to main cost classifications, core and non-core, development and humanitarian assistance related
26-28, 56-61
Figure 8,9,16,17,18; Table 5,6,7
II.A.8 Resource allocation/distribution/destination: Distribution of programme expenditure according to different country groupings
62-64 Figure 19-20
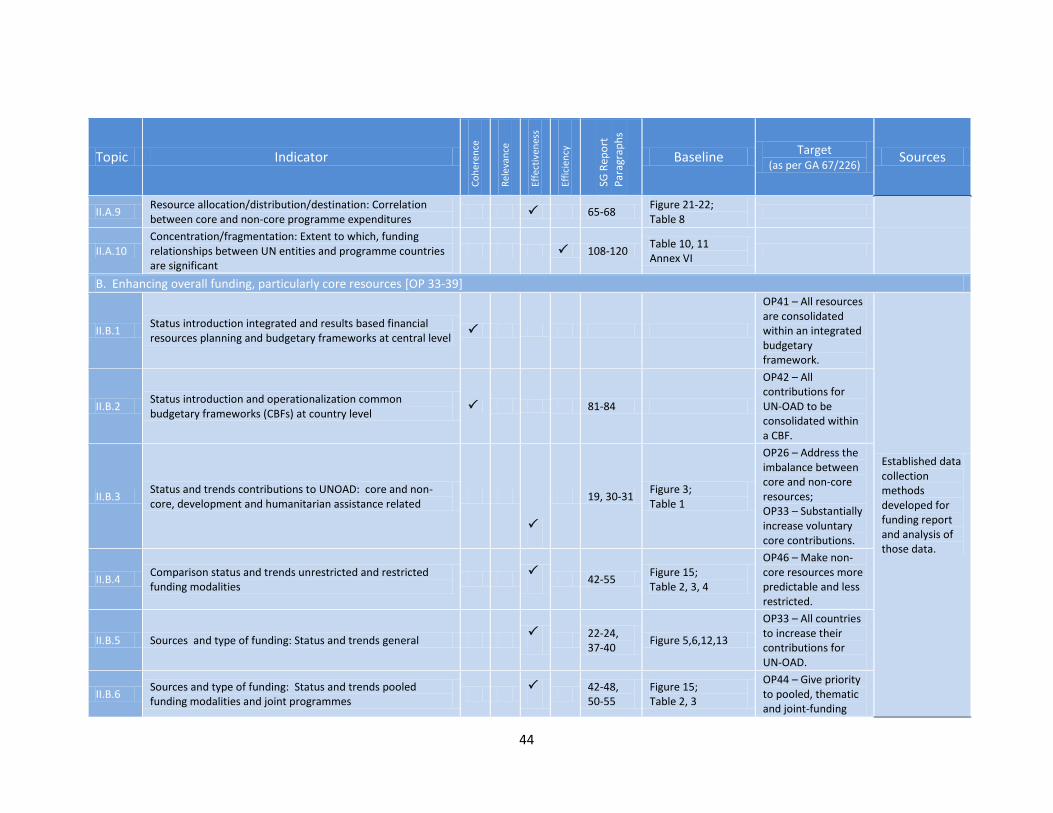
44
Topic Indicator
Co
her
ence
Rel
evan
ce
Effe
ctiv
enes
s
Effi
cien
cy
SG R
epo
rt
Par
agra
ph
s
Baseline Target
(as per GA 67/226) Sources
II.A.9 Resource allocation/distribution/destination: Correlation between core and non-core programme expenditures
65-68 Figure 21-22; Table 8
II.A.10 Concentration/fragmentation: Extent to which, funding relationships between UN entities and programme countries are significant
108-120 Table 10, 11 Annex VI
B. Enhancing overall funding, particularly core resources [OP 33-39]
II.B.1 Status introduction integrated and results based financial resources planning and budgetary frameworks at central level
OP41 – All resources are consolidated within an integrated budgetary framework.
Established data collection methods developed for funding report and analysis of those data.
II.B.2 Status introduction and operationalization common budgetary frameworks (CBFs) at country level
81-84
OP42 – All contributions for UN-OAD to be consolidated within a CBF.
II.B.3 Status and trends contributions to UNOAD: core and non-core, development and humanitarian assistance related
19, 30-31 Figure 3; Table 1
OP26 – Address the imbalance between core and non-core resources; OP33 – Substantially increase voluntary core contributions.
II.B.4 Comparison status and trends unrestricted and restricted funding modalities
42-55 Figure 15; Table 2, 3, 4
OP46 – Make non-core resources more predictable and less restricted.
II.B.5 Sources and type of funding: Status and trends general
22-24, 37-40
Figure 5,6,12,13
OP33 – All countries to increase their contributions for UN-OAD.
II.B.6 Sources and type of funding: Status and trends pooled funding modalities and joint programmes
42-48, 50-55
Figure 15; Table 2, 3
OP44 – Give priority to pooled, thematic and joint-funding

45
Topic Indicator
Co
her
ence
Rel
evan
ce
Effe
ctiv
enes
s
Effi
cien
cy
SG R
epo
rt
Par
agra
ph
s
Baseline Target
(as per GA 67/226) Sources
mechanisms.
II.B.7 Sources of funding: Status actions taken by entities to broaden donor base
77-78 OP35 – Report to governing bodies at first session in 2014
II.B.8 Critical mass of core funding: Status actions taken by entities to develop and operationalize concept of critical mass of core funding
121
OP39 – Present specific proposals to governing bodies by end of 2013 for decision in 2014
II.B.9 Burden sharing: Status and trends contributions relative to GNIs
85-93 Figure 28; Annex V
OP33 – Increase voluntary contributions for UN-OAD in a manner consistent with donor countries’ capacities.
C. . Improving the predictability and quality of resources (OP 40-46)
II.C.1 Planning frameworks at central level: Status introduction integrated and results based financial resources planning and budgetary frameworks
OP41 – All resources are consolidated within an integrated budgetary framework.
Established data collection methods developed for funding report and analysis of those data.
II.C.2 Planning Frameworks at country level: status of introduction and operationalization common budgetary frameworks (CBFs)
81-84
OP42 – All contributions for UN-OAD to be consolidated within a CBF.
II.C.3 Stability/volatility resources: Analysis fluctuations in contributions by source and impact overall resources availability
69-72 Figure 23, 24, 25
OP33 – Contribute on a multi-year basis, in a sustained and predictable manner; OP40 – Prioritize the allocation of
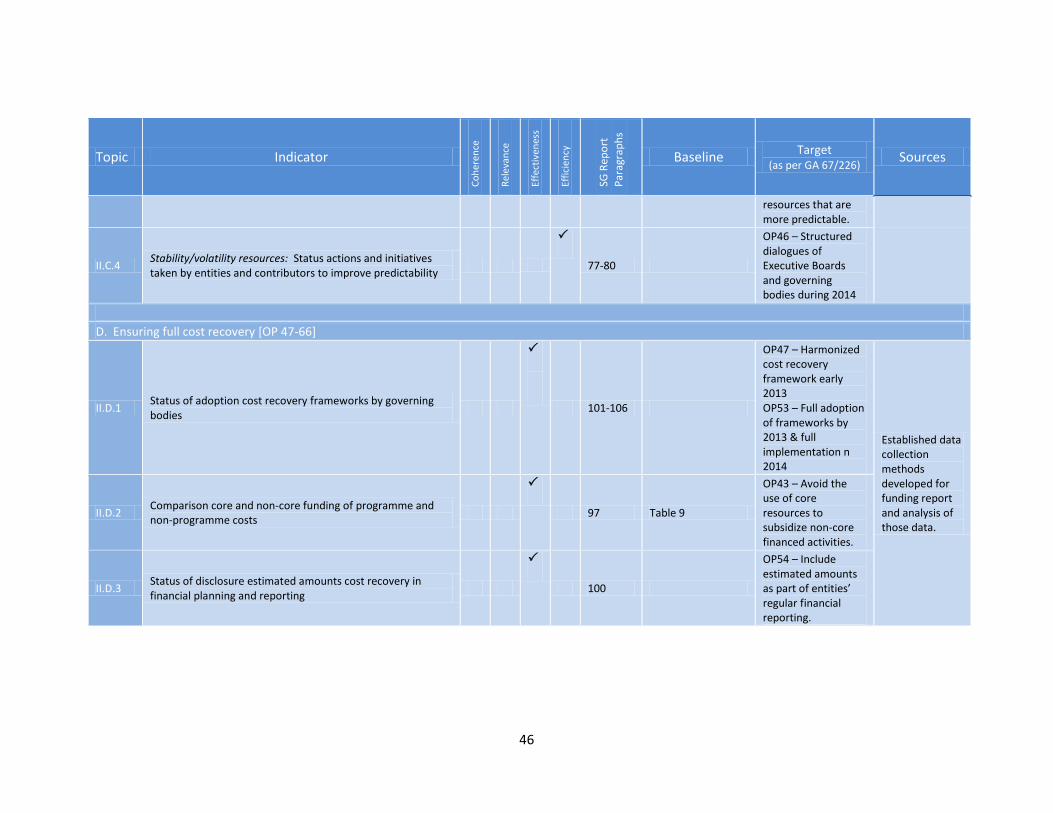
46
Topic Indicator
Co
her
ence
Rel
evan
ce
Effe
ctiv
enes
s
Effi
cien
cy
SG R
epo
rt
Par
agra
ph
s
Baseline Target
(as per GA 67/226) Sources
resources that are more predictable.
II.C.4 Stability/volatility resources: Status actions and initiatives taken by entities and contributors to improve predictability
77-80
OP46 – Structured dialogues of Executive Boards and governing bodies during 2014
D. Ensuring full cost recovery [OP 47-66]
II.D.1 Status of adoption cost recovery frameworks by governing bodies
101-106
OP47 – Harmonized cost recovery framework early 2013 OP53 – Full adoption of frameworks by 2013 & full implementation n 2014
Established data collection methods developed for funding report and analysis of those data.
II.D.2 Comparison core and non-core funding of programme and non-programme costs
97 Table 9
OP43 – Avoid the use of core resources to subsidize non-core financed activities.
II.D.3 Status of disclosure estimated amounts cost recovery in financial planning and reporting
100
OP54 – Include estimated amounts as part of entities’ regular financial reporting.
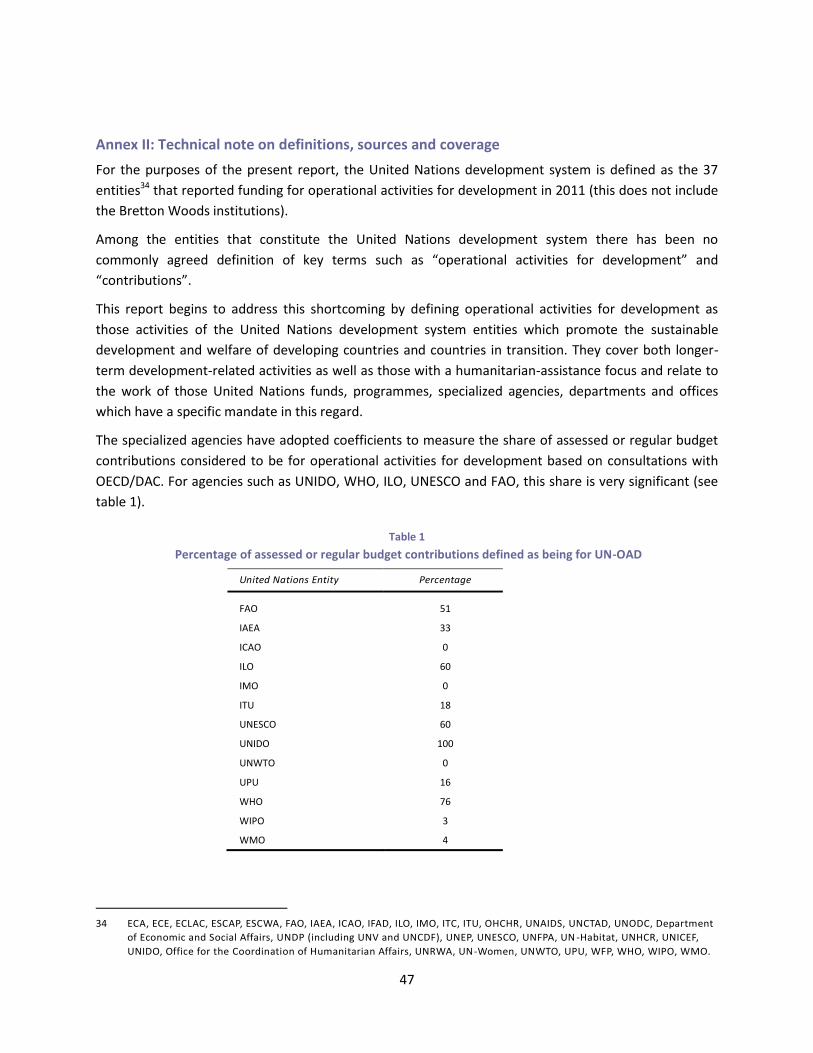
47
Annex II: Technical note on definitions, sources and coverage
For the purposes of the present report, the United Nations development system is defined as the 37
entities34 that reported funding for operational activities for development in 2011 (this does not include
the Bretton Woods institutions).
Among the entities that constitute the United Nations development system there has been no
commonly agreed definition of key terms such as “operational activities for development” and
“contributions”.
This report begins to address this shortcoming by defining operational activities for development as
those activities of the United Nations development system entities which promote the sustainable
development and welfare of developing countries and countries in transition. They cover both longer-
term development-related activities as well as those with a humanitarian-assistance focus and relate to
the work of those United Nations funds, programmes, specialized agencies, departments and offices
which have a specific mandate in this regard.
The specialized agencies have adopted coefficients to measure the share of assessed or regular budget
contributions considered to be for operational activities for development based on consultations with
OECD/DAC. For agencies such as UNIDO, WHO, ILO, UNESCO and FAO, this share is very significant (see
table 1).
Table 1
Percentage of assessed or regular budget contributions defined as being for UN-OAD
United Nations Entity Percentage
FAO 51
IAEA 33
ICAO 0
ILO 60
IMO 0
ITU 18
UNESCO 60
UNIDO 100
UNWTO 0
UPU 16
WHO 76
WIPO 3
WMO 4
34 ECA, ECE, ECLAC, ESCAP, ESCWA, FAO, IAEA, ICAO, IFAD, ILO, IMO, ITC, ITU, OHCHR, UNAIDS, UNCTAD, UNODC, Department
of Economic and Social Affairs, UNDP (including UNV and UNCDF), UNEP, UNESCO, UNFPA, UN -Habitat, UNHCR, UNICEF,
UNIDO, Office for the Coordination of Humanitarian Affairs, UNRWA, UN-Women, UNWTO, UPU, WFP, WHO, WIPO, WMO.
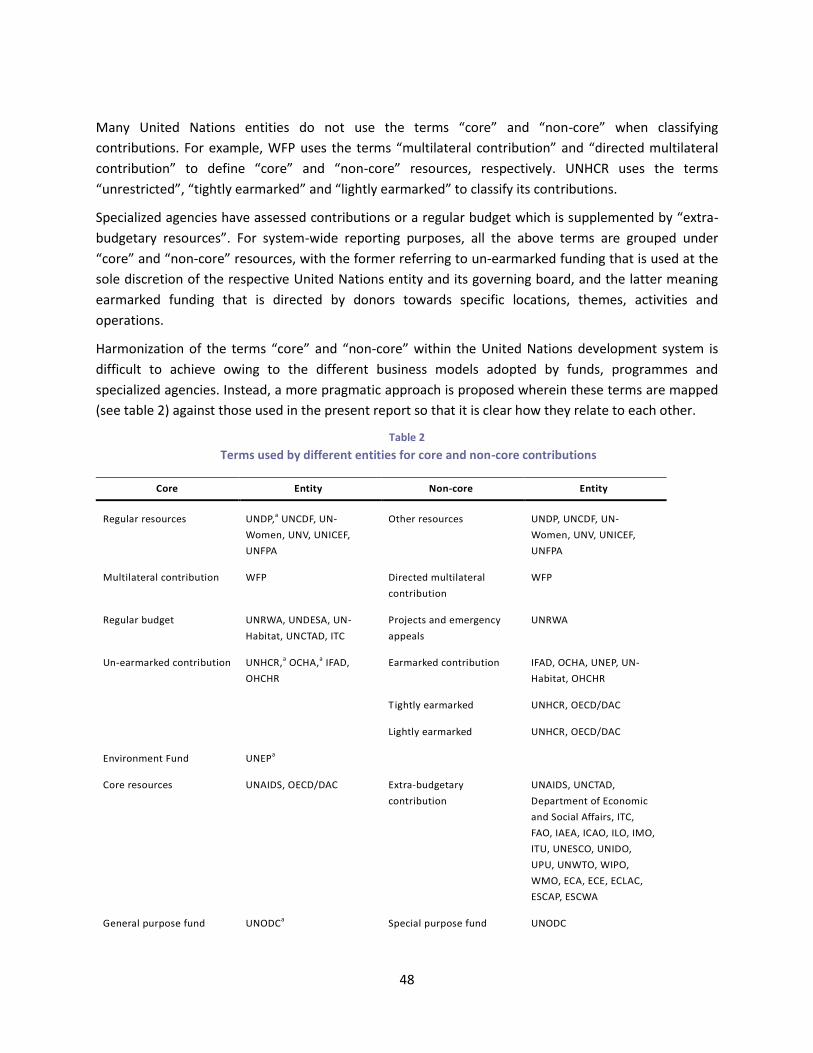
48
Many United Nations entities do not use the terms “core” and “non-core” when classifying
contributions. For example, WFP uses the terms “multilateral contribution” and “directed multilateral
contribution” to define “core” and “non-core” resources, respectively. UNHCR uses the terms
“unrestricted”, “tightly earmarked” and “lightly earmarked” to classify its contributions.
Specialized agencies have assessed contributions or a regular budget which is supplemented by “extra-
budgetary resources”. For system-wide reporting purposes, all the above terms are grouped under
“core” and “non-core” resources, with the former referring to un-earmarked funding that is used at the
sole discretion of the respective United Nations entity and its governing board, and the latter meaning
earmarked funding that is directed by donors towards specific locations, themes, activities and
operations.
Harmonization of the terms “core” and “non-core” within the United Nations development system is
difficult to achieve owing to the different business models adopted by funds, programmes and
specialized agencies. Instead, a more pragmatic approach is proposed wherein these terms are mapped
(see table 2) against those used in the present report so that it is clear how they relate to each other.
Table 2
Terms used by different entities for core and non-core contributions
Core Entity Non-core Entity
Regular resources UNDP,a UNCDF, UN-
Women, UNV, UNICEF,
UNFPA
Other resources UNDP, UNCDF, UN-
Women, UNV, UNICEF,
UNFPA
Multilateral contribution WFP Directed multilateral
contribution
WFP
Regular budget UNRWA, UNDESA, UN-
Habitat, UNCTAD, ITC
Projects and emergency
appeals
UNRWA
Un-earmarked contribution UNHCR,a OCHA,a IFAD,
OHCHR
Earmarked contribution IFAD, OCHA, UNEP, UN-
Habitat, OHCHR
T ightly earmarked UNHCR, OECD/DAC
Lightly earmarked UNHCR, OECD/DAC
Environment Fund UNEPa
Core resources UNAIDS, OECD/DAC Extra-budgetary
contribution
UNAIDS, UNCTAD,
Department of Economic
and Social Affairs, ITC,
FAO, IAEA, ICAO, ILO, IMO,
ITU, UNESCO, UNIDO,
UPU, UNWTO, WIPO,
WMO, ECA, ECE, ECLAC,
ESCAP, ESCWA
General purpose fund UNODCa Special purpose fund UNODC
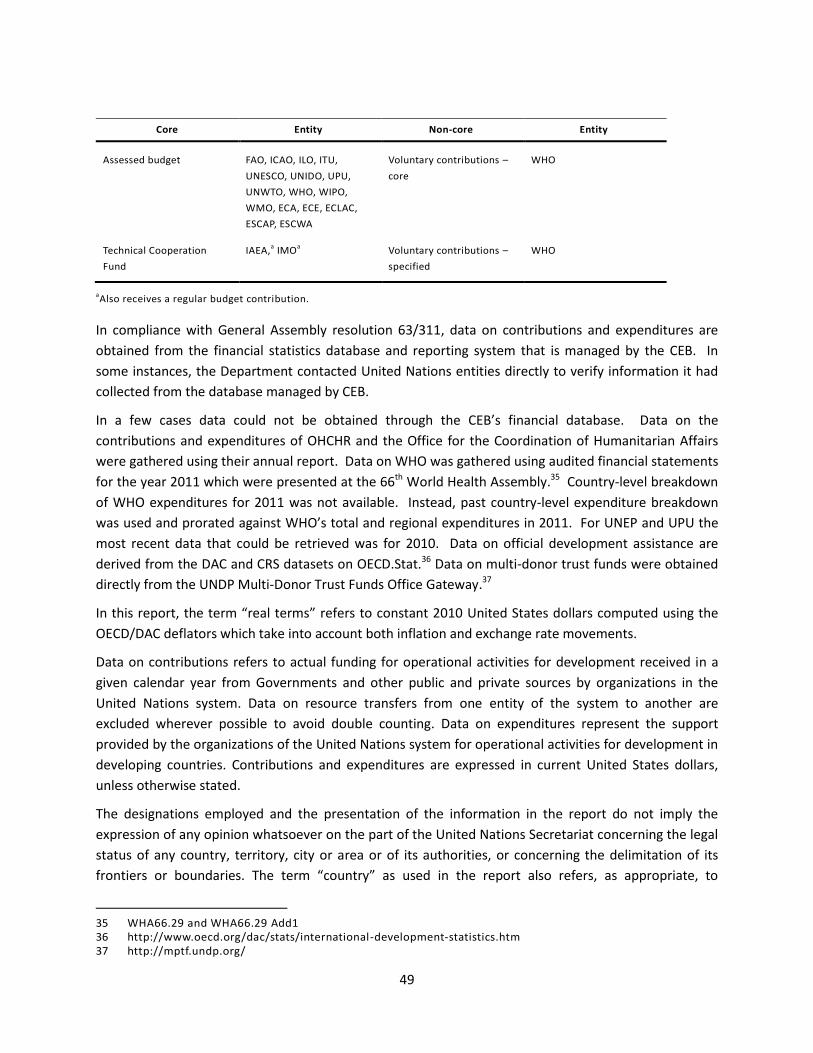
49
Core Entity Non-core Entity
Assessed budget FAO, ICAO, ILO, ITU,
UNESCO, UNIDO, UPU,
UNWTO, WHO, WIPO,
WMO, ECA, ECE, ECLAC,
ESCAP, ESCWA
Voluntary contributions –
core
WHO
Technical Cooperation
Fund
IAEA,a IMOa Voluntary contributions –
specified
WHO
aAlso receives a regular budget contribution.
In compliance with General Assembly resolution 63/311, data on contributions and expenditures are
obtained from the financial statistics database and reporting system that is managed by the CEB. In
some instances, the Department contacted United Nations entities directly to verify information it had
collected from the database managed by CEB.
In a few cases data could not be obtained through the CEB’s financial database. Data on the
contributions and expenditures of OHCHR and the Office for the Coordination of Humanitarian Affairs
were gathered using their annual report. Data on WHO was gathered using audited financial statements
for the year 2011 which were presented at the 66th World Health Assembly.35 Country-level breakdown
of WHO expenditures for 2011 was not available. Instead, past country-level expenditure breakdown
was used and prorated against WHO’s total and regional expenditures in 2011. For UNEP and UPU the
most recent data that could be retrieved was for 2010. Data on official development assistance are
derived from the DAC and CRS datasets on OECD.Stat.36 Data on multi-donor trust funds were obtained
directly from the UNDP Multi-Donor Trust Funds Office Gateway.37
In this report, the term “real terms” refers to constant 2010 United States dollars computed using the
OECD/DAC deflators which take into account both inflation and exchange rate movements.
Data on contributions refers to actual funding for operational activities for development received in a
given calendar year from Governments and other public and private sources by organizations in the
United Nations system. Data on resource transfers from one entity of the system to another are
excluded wherever possible to avoid double counting. Data on expenditures represent the support
provided by the organizations of the United Nations system for operational activities for development in
developing countries. Contributions and expenditures are expressed in current United States dollars,
unless otherwise stated.
The designations employed and the presentation of the information in the report do not imply the
expression of any opinion whatsoever on the part of the United Nations Secretariat concerning the legal
status of any country, territory, city or area or of its authorities, or concerning the delimitation of its
frontiers or boundaries. The term “country” as used in the report also refers, as appropriate, to
35 WHA66.29 and WHA66.29 Add1 36 http://www.oecd.org/dac/stats/international-development-statistics.htm 37 http://mptf.undp.org/
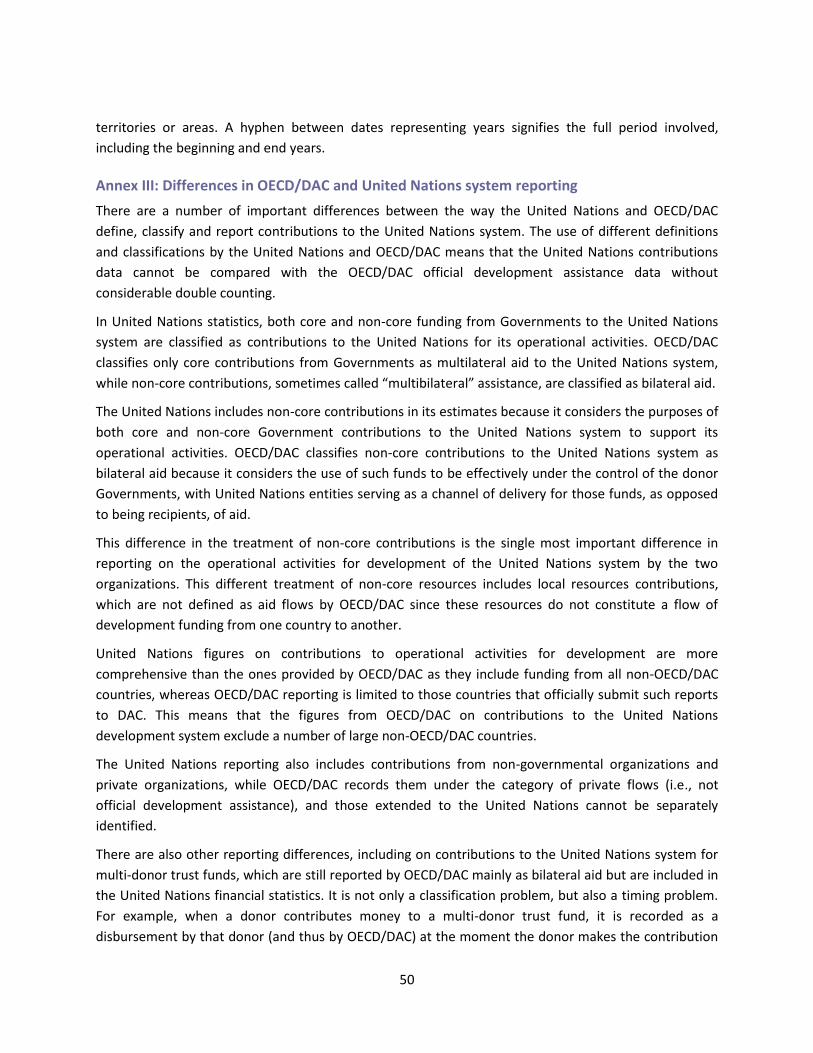
50
territories or areas. A hyphen between dates representing years signifies the full period involved,
including the beginning and end years.
Annex III: Differences in OECD/DAC and United Nations system reporting
There are a number of important differences between the way the United Nations and OECD/DAC
define, classify and report contributions to the United Nations system. The use of different definitions
and classifications by the United Nations and OECD/DAC means that the United Nations contributions
data cannot be compared with the OECD/DAC official development assistance data without
considerable double counting.
In United Nations statistics, both core and non-core funding from Governments to the United Nations
system are classified as contributions to the United Nations for its operational activities. OECD/DAC
classifies only core contributions from Governments as multilateral aid to the United Nations system,
while non-core contributions, sometimes called “multibilateral” assistance, are classified as bilateral aid.
The United Nations includes non-core contributions in its estimates because it considers the purposes of
both core and non-core Government contributions to the United Nations system to support its
operational activities. OECD/DAC classifies non-core contributions to the United Nations system as
bilateral aid because it considers the use of such funds to be effectively under the control of the donor
Governments, with United Nations entities serving as a channel of delivery for those funds, as opposed
to being recipients, of aid.
This difference in the treatment of non-core contributions is the single most important difference in
reporting on the operational activities for development of the United Nations system by the two
organizations. This different treatment of non-core resources includes local resources contributions,
which are not defined as aid flows by OECD/DAC since these resources do not constitute a flow of
development funding from one country to another.
United Nations figures on contributions to operational activities for development are more
comprehensive than the ones provided by OECD/DAC as they include funding from all non-OECD/DAC
countries, whereas OECD/DAC reporting is limited to those countries that officially submit such reports
to DAC. This means that the figures from OECD/DAC on contributions to the United Nations
development system exclude a number of large non-OECD/DAC countries.
The United Nations reporting also includes contributions from non-governmental organizations and
private organizations, while OECD/DAC records them under the category of private flows (i.e., not
official development assistance), and those extended to the United Nations cannot be separately
identified.
There are also other reporting differences, including on contributions to the United Nations system for
multi-donor trust funds, which are still reported by OECD/DAC mainly as bilateral aid but are included in
the United Nations financial statistics. It is not only a classification problem, but also a timing problem.
For example, when a donor contributes money to a multi-donor trust fund, it is recorded as a
disbursement by that donor (and thus by OECD/DAC) at the moment the donor makes the contribution
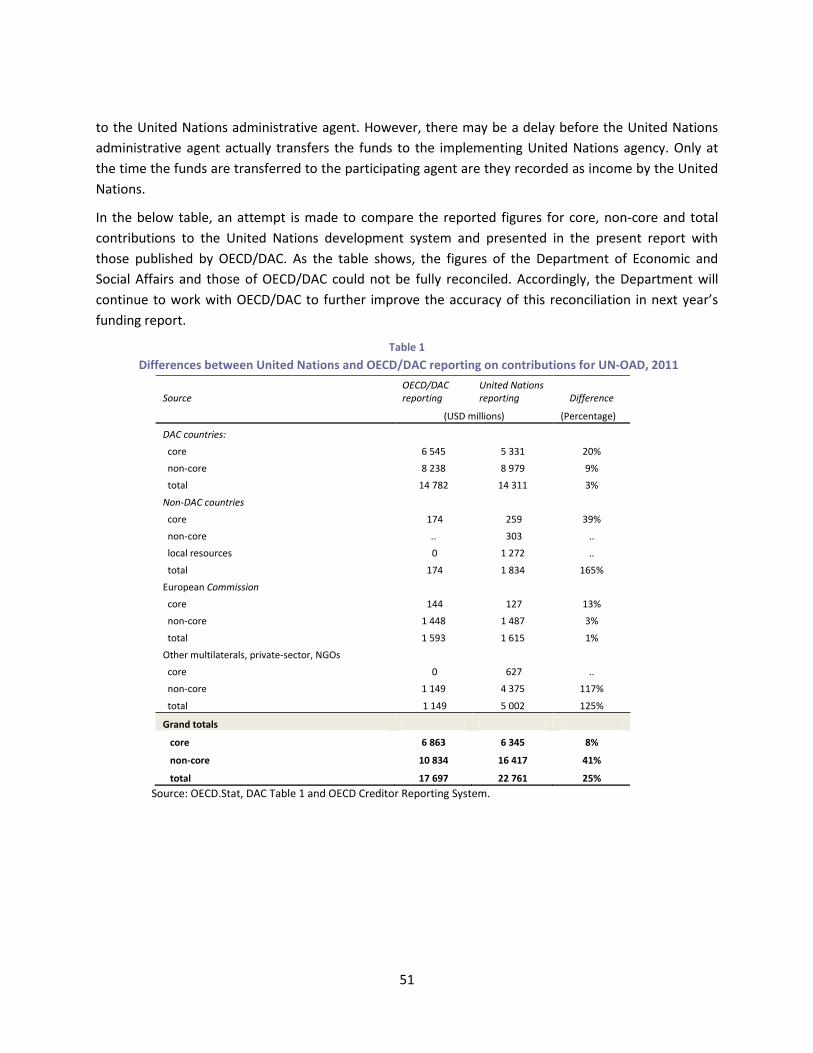
51
to the United Nations administrative agent. However, there may be a delay before the United Nations
administrative agent actually transfers the funds to the implementing United Nations agency. Only at
the time the funds are transferred to the participating agent are they recorded as income by the United
Nations.
In the below table, an attempt is made to compare the reported figures for core, non-core and total
contributions to the United Nations development system and presented in the present report with
those published by OECD/DAC. As the table shows, the figures of the Department of Economic and
Social Affairs and those of OECD/DAC could not be fully reconciled. Accordingly, the Department will
continue to work with OECD/DAC to further improve the accuracy of this reconciliation in next year’s
funding report.
Table 1
Differences between United Nations and OECD/DAC reporting on contributions for UN-OAD, 2011
Source
OECD/DAC reporting
United Nations reporting Difference
(USD millions) (Percentage)
DAC countries:
core 6 545 5 331 20%
non-core 8 238 8 979 9%
total 14 782 14 311 3%
Non-DAC countries
core 174 259 39%
non-core .. 303 ..
local resources 0 1 272 ..
total 174 1 834 165%
European Commission
core 144 127 13%
non-core 1 448 1 487 3%
total 1 593 1 615 1%
Other multilaterals, private-sector, NGOs
core 0 627 ..
non-core 1 149 4 375 117%
total 1 149 5 002 125%
Grand totals
core 6 863 6 345 8%
non-core 10 834 16 417 41%
total 17 697 22 761 25% Source: OECD.Stat, DAC Table 1 and OECD Creditor Reporting System.
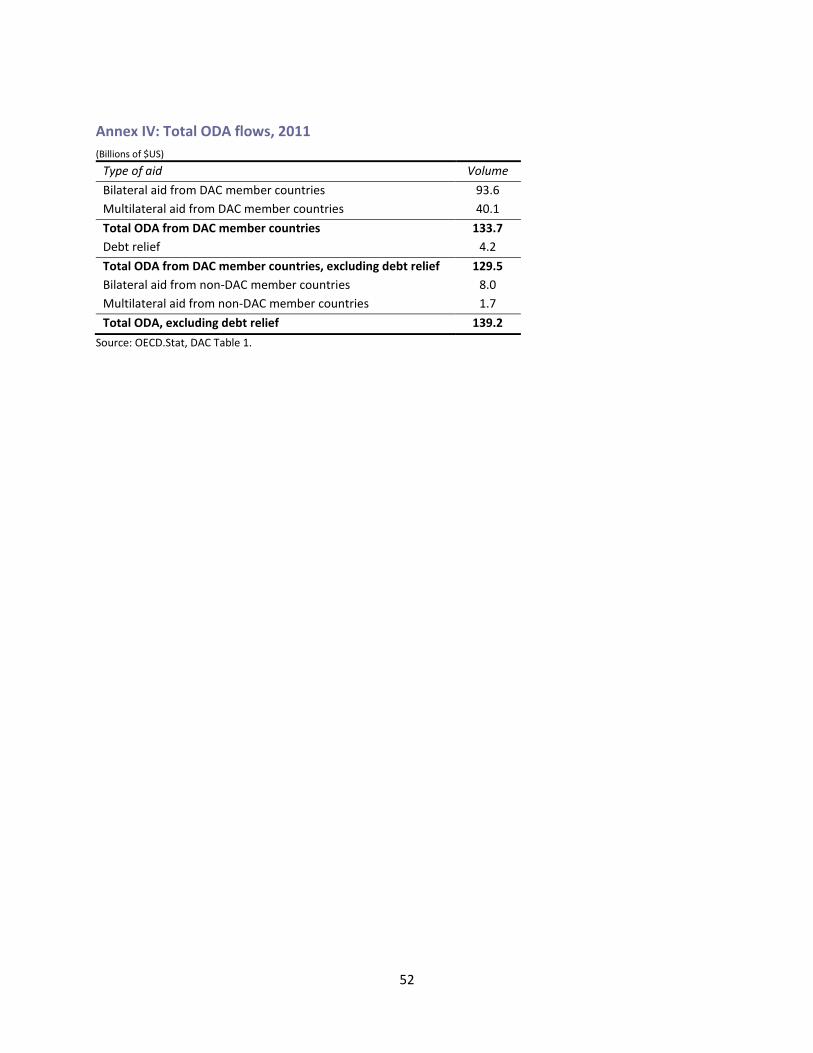
52
Annex IV: Total ODA flows, 2011
(Billions of $US)
Type of aid Volume
Bilateral aid from DAC member countries 93.6
Multilateral aid from DAC member countries 40.1
Total ODA from DAC member countries 133.7
Debt relief 4.2
Total ODA from DAC member countries, excluding debt relief 129.5
Bilateral aid from non-DAC member countries 8.0
Multilateral aid from non-DAC member countries 1.7
Total ODA, excluding debt relief 139.2
Source: OECD.Stat, DAC Table 1.
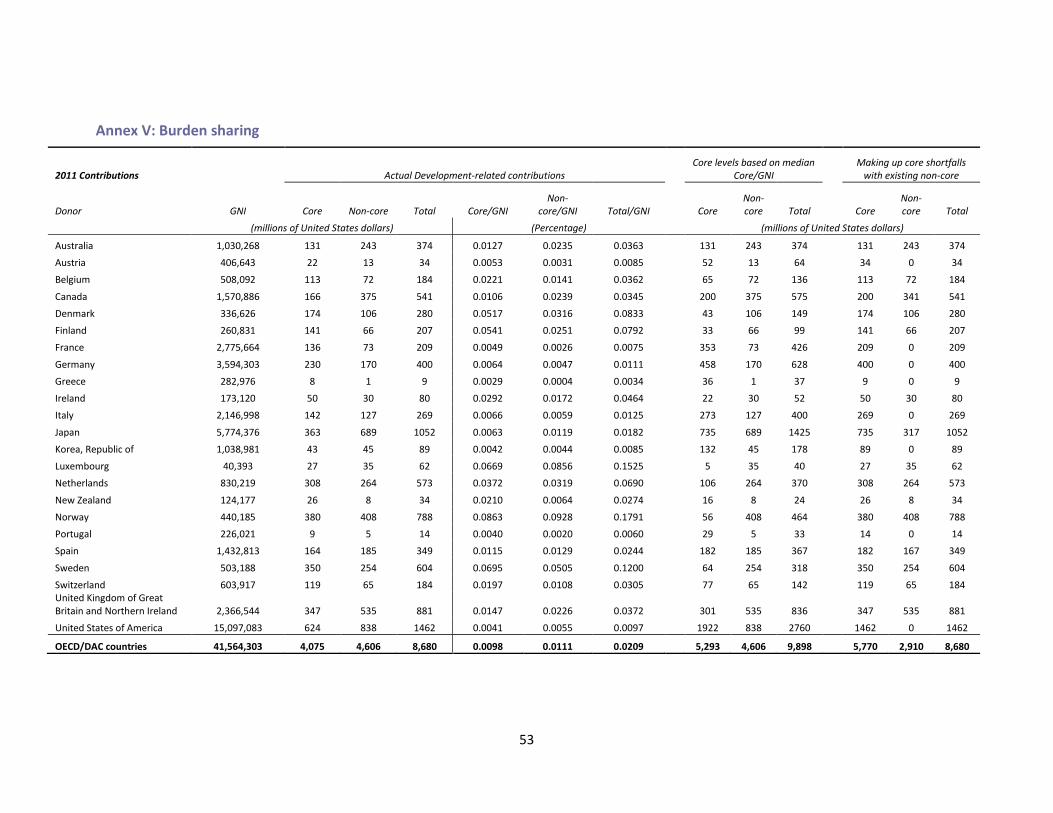
53
Annex V: Burden sharing
2011 Contributions Actual Development-related contributions Core levels based on median
Core/GNI
Making up core shortfalls with existing non-core
Donor GNI Core Non-core Total Core/GNI Non-
core/GNI Total/GNI Core Non-core Total Core
Non-core Total
(millions of United States dollars) (Percentage) (millions of United States dollars)
Australia 1,030,268 131 243 374 0.0127 0.0235 0.0363 131 243 374 131 243 374
Austria 406,643 22 13 34 0.0053 0.0031 0.0085 52 13 64 34 0 34
Belgium 508,092 113 72 184 0.0221 0.0141 0.0362 65 72 136 113 72 184
Canada 1,570,886 166 375 541 0.0106 0.0239 0.0345 200 375 575 200 341 541
Denmark 336,626 174 106 280 0.0517 0.0316 0.0833 43 106 149 174 106 280
Finland 260,831 141 66 207 0.0541 0.0251 0.0792 33 66 99 141 66 207
France 2,775,664 136 73 209 0.0049 0.0026 0.0075 353 73 426 209 0 209
Germany 3,594,303 230 170 400 0.0064 0.0047 0.0111 458 170 628 400 0 400
Greece 282,976 8 1 9 0.0029 0.0004 0.0034 36 1 37 9 0 9
Ireland 173,120 50 30 80 0.0292 0.0172 0.0464 22 30 52 50 30 80
Italy 2,146,998 142 127 269 0.0066 0.0059 0.0125 273 127 400 269 0 269
Japan 5,774,376 363 689 1052 0.0063 0.0119 0.0182 735 689 1425 735 317 1052
Korea, Republic of 1,038,981 43 45 89 0.0042 0.0044 0.0085 132 45 178 89 0 89
Luxembourg 40,393 27 35 62 0.0669 0.0856 0.1525 5 35 40 27 35 62
Netherlands 830,219 308 264 573 0.0372 0.0319 0.0690 106 264 370 308 264 573
New Zealand 124,177 26 8 34 0.0210 0.0064 0.0274 16 8 24 26 8 34
Norway 440,185 380 408 788 0.0863 0.0928 0.1791 56 408 464 380 408 788
Portugal 226,021 9 5 14 0.0040 0.0020 0.0060 29 5 33 14 0 14
Spain 1,432,813 164 185 349 0.0115 0.0129 0.0244 182 185 367 182 167 349
Sweden 503,188 350 254 604 0.0695 0.0505 0.1200 64 254 318 350 254 604
Switzerland 603,917 119 65 184 0.0197 0.0108 0.0305 77 65 142 119 65 184 United Kingdom of Great Britain and Northern Ireland 2,366,544 347 535 881 0.0147 0.0226 0.0372 301 535 836 347 535 881
United States of America 15,097,083 624 838 1462 0.0041 0.0055 0.0097 1922 838 2760 1462 0 1462
OECD/DAC countries 41,564,303 4,075 4,606 8,680 0.0098 0.0111 0.0209 5,293 4,606 9,898 5,770 2,910 8,680
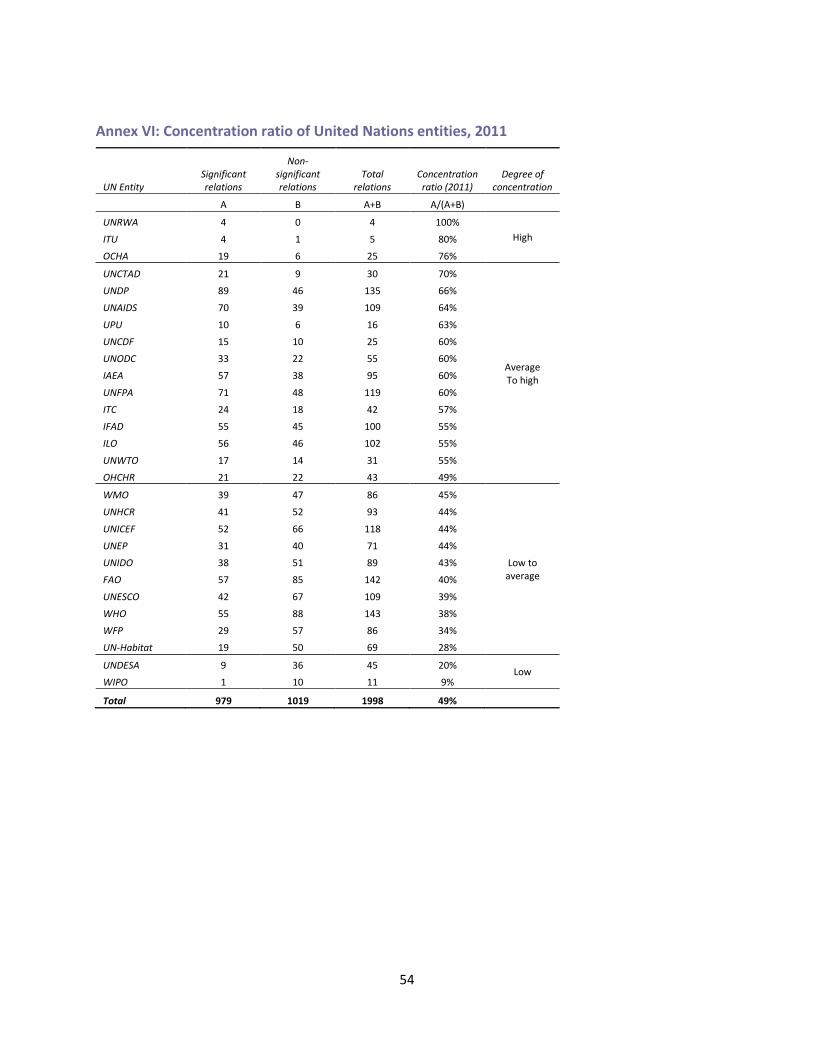
54
Annex VI: Concentration ratio of United Nations entities, 2011
UN Entity Significant relations
Non-significant relations
Total relations
Concentration ratio (2011)
Degree of concentration
A B A+B A/(A+B)
UNRWA 4 0 4 100%
High ITU 4 1 5 80%
OCHA 19 6 25 76%
UNCTAD 21 9 30 70%
Average To high
UNDP 89 46 135 66%
UNAIDS 70 39 109 64%
UPU 10 6 16 63%
UNCDF 15 10 25 60%
UNODC 33 22 55 60%
IAEA 57 38 95 60%
UNFPA 71 48 119 60%
ITC 24 18 42 57%
IFAD 55 45 100 55%
ILO 56 46 102 55%
UNWTO 17 14 31 55%
OHCHR 21 22 43 49%
WMO 39 47 86 45%
Low to average
UNHCR 41 52 93 44%
UNICEF 52 66 118 44%
UNEP 31 40 71 44%
UNIDO 38 51 89 43%
FAO 57 85 142 40%
UNESCO 42 67 109 39%
WHO 55 88 143 38%
WFP 29 57 86 34%
UN-Habitat 19 50 69 28%
UNDESA 9 36 45 20% Low
WIPO 1 10 11 9%
Total 979 1019 1998 49%
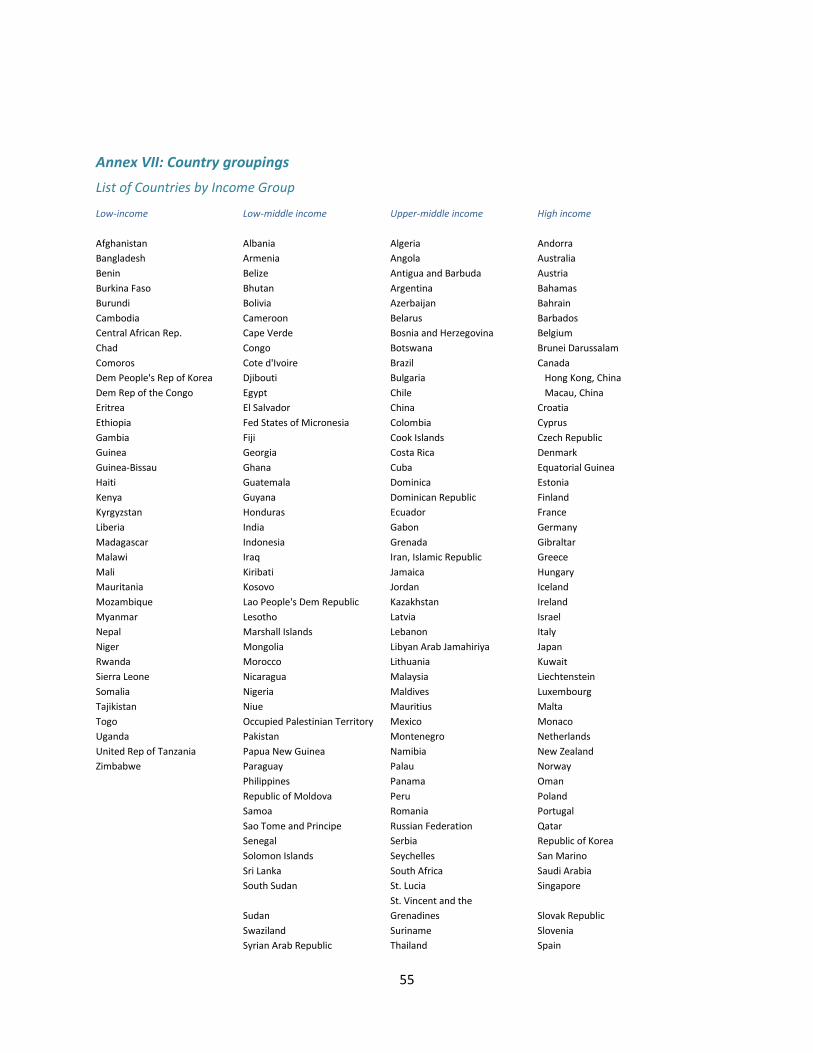
55
Annex VII: Country groupings
List of Countries by Income Group
Low-income Low-middle income Upper-middle income High income
Afghanistan Albania Algeria Andorra
Bangladesh Armenia Angola Australia
Benin Belize Antigua and Barbuda Austria
Burkina Faso Bhutan Argentina Bahamas
Burundi Bolivia Azerbaijan Bahrain
Cambodia Cameroon Belarus Barbados
Central African Rep. Cape Verde Bosnia and Herzegovina Belgium
Chad Congo Botswana Brunei Darussalam
Comoros Cote d'Ivoire Brazil Canada
Dem People's Rep of Korea Djibouti Bulgaria Hong Kong, China
Dem Rep of the Congo Egypt Chile Macau, China
Eritrea El Salvador China Croatia
Ethiopia Fed States of Micronesia Colombia Cyprus
Gambia Fiji Cook Islands Czech Republic
Guinea Georgia Costa Rica Denmark
Guinea-Bissau Ghana Cuba Equatorial Guinea
Haiti Guatemala Dominica Estonia
Kenya Guyana Dominican Republic Finland
Kyrgyzstan Honduras Ecuador France
Liberia India Gabon Germany
Madagascar Indonesia Grenada Gibraltar
Malawi Iraq Iran, Islamic Republic Greece
Mali Kiribati Jamaica Hungary
Mauritania Kosovo Jordan Iceland
Mozambique Lao People's Dem Republic Kazakhstan Ireland
Myanmar Lesotho Latvia Israel
Nepal Marshall Islands Lebanon Italy
Niger Mongolia Libyan Arab Jamahiriya Japan
Rwanda Morocco Lithuania Kuwait
Sierra Leone Nicaragua Malaysia Liechtenstein
Somalia Nigeria Maldives Luxembourg
Tajikistan Niue Mauritius Malta
Togo Occupied Palestinian Territory Mexico Monaco
Uganda Pakistan Montenegro Netherlands
United Rep of Tanzania Papua New Guinea Namibia New Zealand
Zimbabwe Paraguay Palau Norway
Philippines Panama Oman
Republic of Moldova Peru Poland
Samoa Romania Portugal
Sao Tome and Principe Russian Federation Qatar
Senegal Serbia Republic of Korea
Solomon Islands Seychelles San Marino
Sri Lanka South Africa Saudi Arabia
South Sudan St. Lucia Singapore
Sudan
St. Vincent and the
Grenadines Slovak Republic
Swaziland Suriname Slovenia
Syrian Arab Republic Thailand Spain
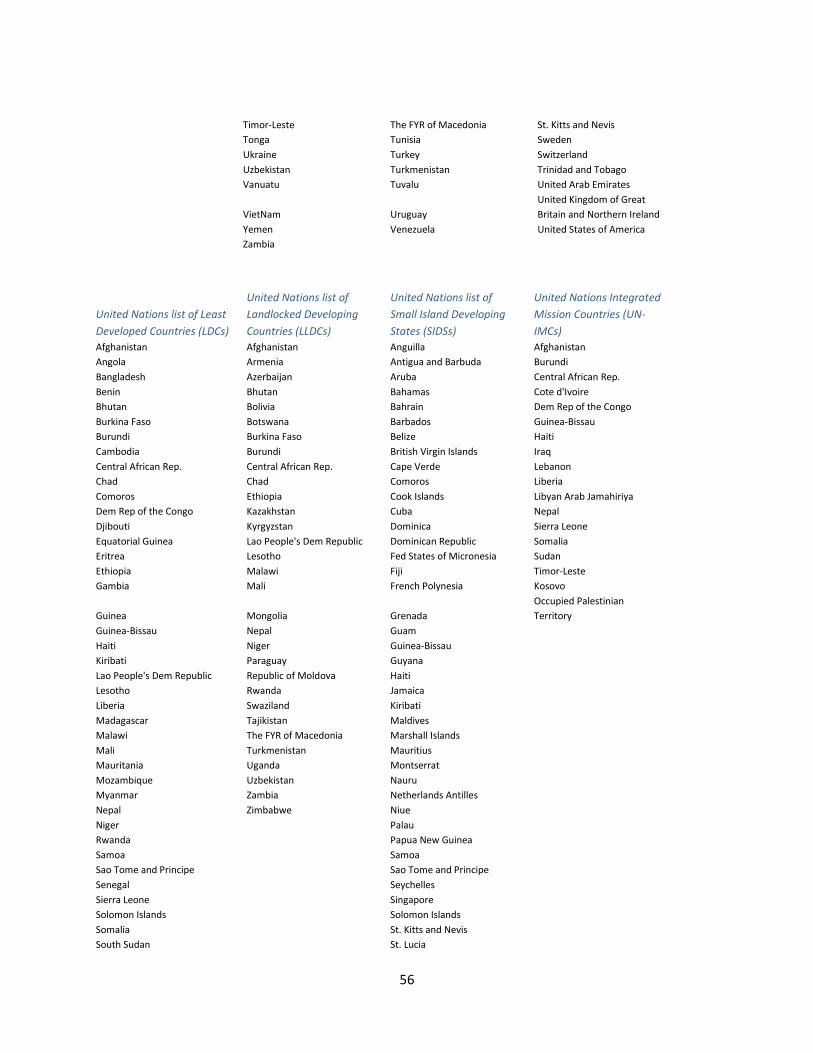
56
Timor-Leste The FYR of Macedonia St. Kitts and Nevis
Tonga Tunisia Sweden
Ukraine Turkey Switzerland
Uzbekistan Turkmenistan Trinidad and Tobago
Vanuatu Tuvalu United Arab Emirates
VietNam Uruguay
United Kingdom of Great
Britain and Northern Ireland
Yemen Venezuela United States of America
Zambia
United Nations list of Least
Developed Countries (LDCs)
United Nations list of
Landlocked Developing
Countries (LLDCs)
United Nations list of
Small Island Developing
States (SIDSs)
United Nations Integrated
Mission Countries (UN-
IMCs)
Afghanistan Afghanistan Anguilla Afghanistan
Angola Armenia Antigua and Barbuda Burundi
Bangladesh Azerbaijan Aruba Central African Rep.
Benin Bhutan Bahamas Cote d'Ivoire
Bhutan Bolivia Bahrain Dem Rep of the Congo
Burkina Faso Botswana Barbados Guinea-Bissau
Burundi Burkina Faso Belize Haiti
Cambodia Burundi British Virgin Islands Iraq
Central African Rep. Central African Rep. Cape Verde Lebanon
Chad Chad Comoros Liberia
Comoros Ethiopia Cook Islands Libyan Arab Jamahiriya
Dem Rep of the Congo Kazakhstan Cuba Nepal
Djibouti Kyrgyzstan Dominica Sierra Leone
Equatorial Guinea Lao People's Dem Republic Dominican Republic Somalia
Eritrea Lesotho Fed States of Micronesia Sudan
Ethiopia Malawi Fiji Timor-Leste
Gambia Mali French Polynesia Kosovo
Guinea Mongolia Grenada
Occupied Palestinian
Territory
Guinea-Bissau Nepal Guam
Haiti Niger Guinea-Bissau
Kiribati Paraguay Guyana
Lao People's Dem Republic Republic of Moldova Haiti
Lesotho Rwanda Jamaica
Liberia Swaziland Kiribati
Madagascar Tajikistan Maldives
Malawi The FYR of Macedonia Marshall Islands
Mali Turkmenistan Mauritius
Mauritania Uganda Montserrat
Mozambique Uzbekistan Nauru
Myanmar Zambia Netherlands Antilles
Nepal Zimbabwe Niue
Niger Palau
Rwanda Papua New Guinea
Samoa Samoa
Sao Tome and Principe Sao Tome and Principe
Senegal Seychelles
Sierra Leone Singapore
Solomon Islands Solomon Islands
Somalia St. Kitts and Nevis
South Sudan St. Lucia
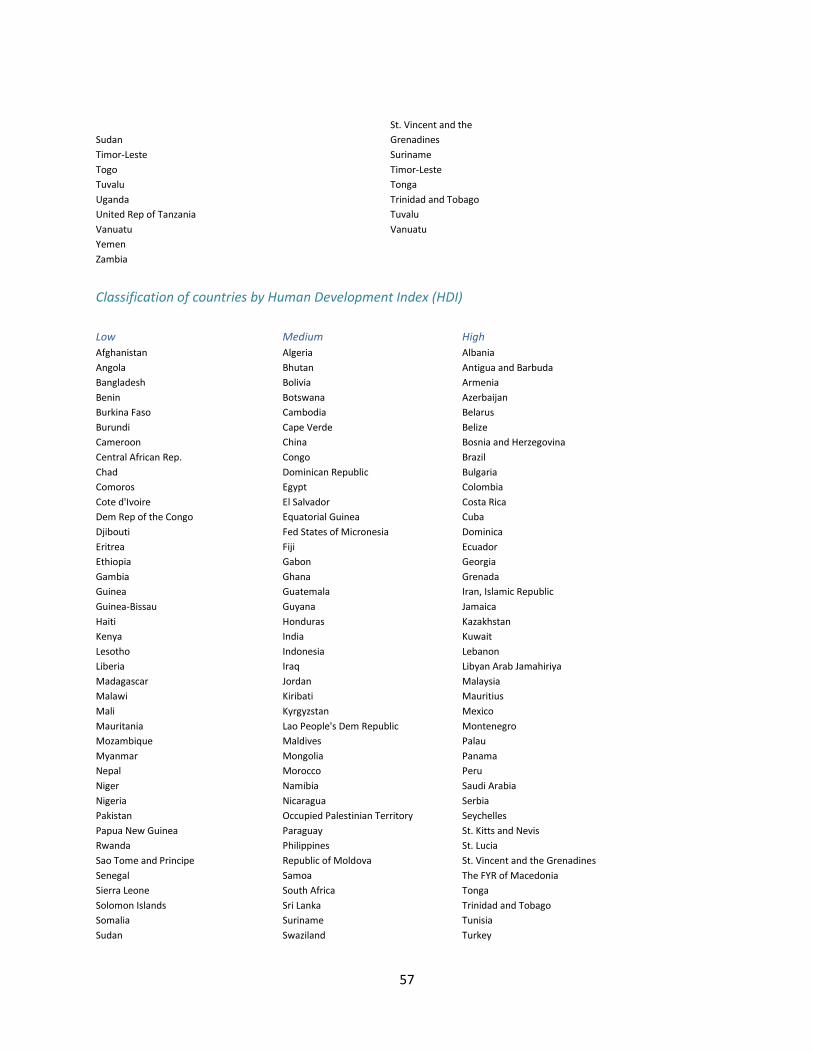
57
Sudan
St. Vincent and the
Grenadines
Timor-Leste Suriname
Togo Timor-Leste
Tuvalu Tonga
Uganda Trinidad and Tobago
United Rep of Tanzania Tuvalu
Vanuatu Vanuatu
Yemen
Zambia
Classification of countries by Human Development Index (HDI)
Low Medium High
Afghanistan Algeria Albania
Angola Bhutan Antigua and Barbuda
Bangladesh Bolivia Armenia
Benin Botswana Azerbaijan
Burkina Faso Cambodia Belarus
Burundi Cape Verde Belize
Cameroon China Bosnia and Herzegovina
Central African Rep. Congo Brazil
Chad Dominican Republic Bulgaria
Comoros Egypt Colombia
Cote d'Ivoire El Salvador Costa Rica
Dem Rep of the Congo Equatorial Guinea Cuba
Djibouti Fed States of Micronesia Dominica
Eritrea Fiji Ecuador
Ethiopia Gabon Georgia
Gambia Ghana Grenada
Guinea Guatemala Iran, Islamic Republic
Guinea-Bissau Guyana Jamaica
Haiti Honduras Kazakhstan
Kenya India Kuwait
Lesotho Indonesia Lebanon
Liberia Iraq Libyan Arab Jamahiriya
Madagascar Jordan Malaysia
Malawi Kiribati Mauritius
Mali Kyrgyzstan Mexico
Mauritania Lao People's Dem Republic Montenegro
Mozambique Maldives Palau
Myanmar Mongolia Panama
Nepal Morocco Peru
Niger Namibia Saudi Arabia
Nigeria Nicaragua Serbia
Pakistan Occupied Palestinian Territory Seychelles
Papua New Guinea Paraguay St. Kitts and Nevis
Rwanda Philippines St. Lucia
Sao Tome and Principe Republic of Moldova St. Vincent and the Grenadines
Senegal Samoa The FYR of Macedonia
Sierra Leone South Africa Tonga
Solomon Islands Sri Lanka Trinidad and Tobago
Somalia Suriname Tunisia
Sudan Swaziland Turkey
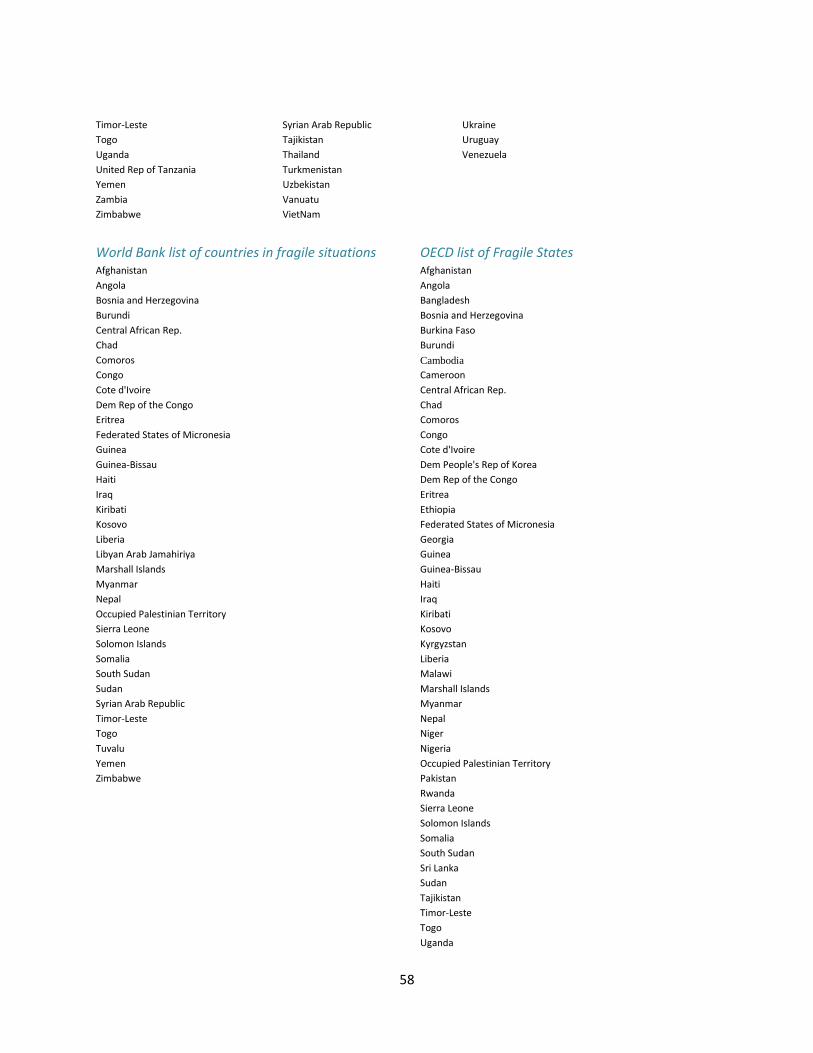
58
Timor-Leste Syrian Arab Republic Ukraine
Togo Tajikistan Uruguay
Uganda Thailand Venezuela
United Rep of Tanzania Turkmenistan
Yemen Uzbekistan
Zambia Vanuatu
Zimbabwe VietNam
World Bank list of countries in fragile situations OECD list of Fragile States Afghanistan Afghanistan
Angola Angola
Bosnia and Herzegovina Bangladesh
Burundi Bosnia and Herzegovina
Central African Rep. Burkina Faso
Chad Burundi
Comoros Cambodia
Congo Cameroon
Cote d'Ivoire Central African Rep.
Dem Rep of the Congo Chad
Eritrea Comoros
Federated States of Micronesia Congo
Guinea Cote d'Ivoire
Guinea-Bissau Dem People's Rep of Korea
Haiti Dem Rep of the Congo
Iraq Eritrea
Kiribati Ethiopia
Kosovo Federated States of Micronesia
Liberia Georgia
Libyan Arab Jamahiriya Guinea
Marshall Islands Guinea-Bissau
Myanmar Haiti
Nepal Iraq
Occupied Palestinian Territory Kiribati
Sierra Leone Kosovo
Solomon Islands Kyrgyzstan
Somalia Liberia
South Sudan Malawi
Sudan Marshall Islands
Syrian Arab Republic Myanmar
Timor-Leste Nepal
Togo Niger
Tuvalu Nigeria
Yemen Occupied Palestinian Territory
Zimbabwe Pakistan
Rwanda
Sierra Leone
Solomon Islands
Somalia
South Sudan
Sri Lanka
Sudan
Tajikistan
Timor-Leste
Togo
Uganda

59
Yemen
Zimbabwe
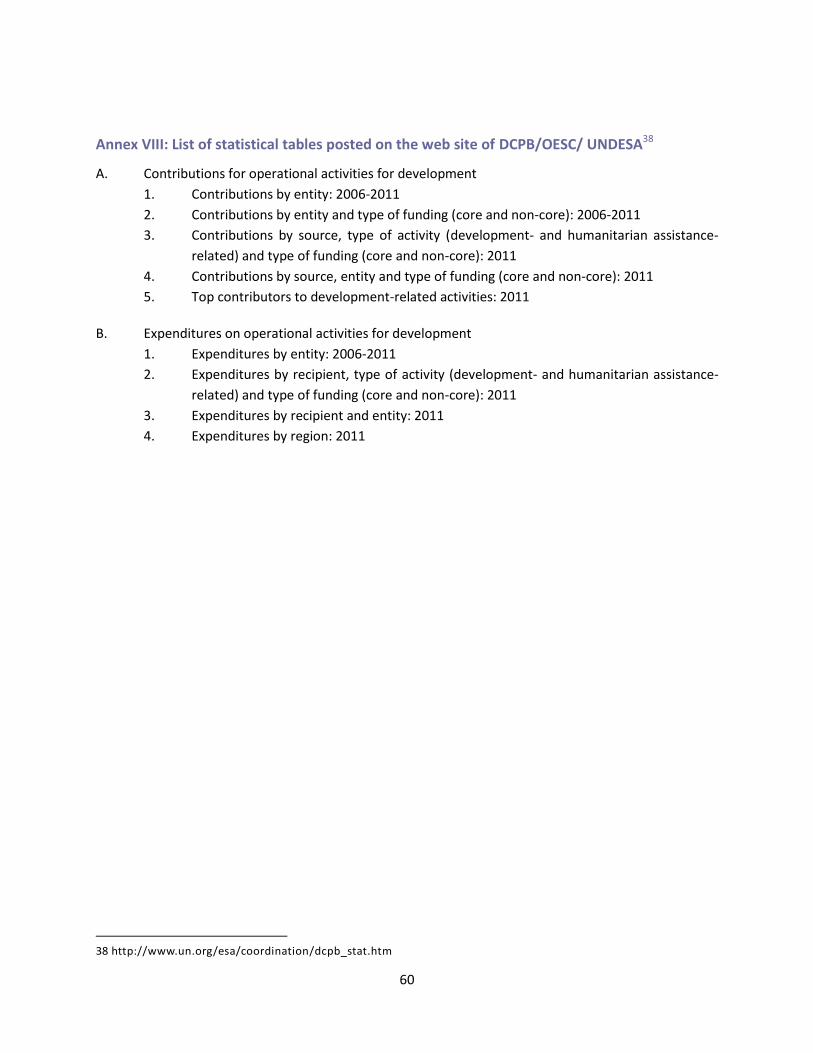
60
Annex VIII: List of statistical tables posted on the web site of DCPB/OESC/ UNDESA38
A. Contributions for operational activities for development
1. Contributions by entity: 2006-2011
2. Contributions by entity and type of funding (core and non-core): 2006-2011
3. Contributions by source, type of activity (development- and humanitarian assistance-
related) and type of funding (core and non-core): 2011
4. Contributions by source, entity and type of funding (core and non-core): 2011
5. Top contributors to development-related activities: 2011
B. Expenditures on operational activities for development
1. Expenditures by entity: 2006-2011
2. Expenditures by recipient, type of activity (development- and humanitarian assistance-
related) and type of funding (core and non-core): 2011
3. Expenditures by recipient and entity: 2011
4. Expenditures by region: 2011
38 http://www.un.org/esa/coordination/dcpb_stat.htm