Embed Size (px)
Citation preview

Analysis of gene copy number changes in tumor phylogenetics
Jijun Tang
Tuesday 4th April, 2017
Tuesday 4th April, 2017Jijun Tang (CSE) University of South Carolina 1/ 40
Overview
1 BackgroundFluorescence in Situ Hybridization(FISH) Rectilinear Minimum Spanning Tree(RMST) FISHtree(An earlier method)
2 An iterative approach for phylogenetic analysis of tumor progression using FISH copy number(iFISHtree)
Methods and experimental design Results
3 Maximum parsimony analysis of gene copy number data(mpFISHtree) Methods and experimental designResults
4 Large scale change(WGD)considered
Tuesday 4th April, 2017Jijun Tang (CSE) University of South Carolina 2/ 40

Background
Tuesday 4th April, 2017Jijun Tang (CSE) University of South Carolina 3/ 40
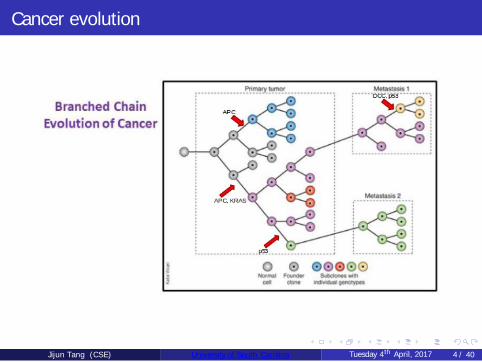
Cancer evolution
Tuesday 4th April, 2017Jijun Tang (CSE) University of South Carolina 4/ 40
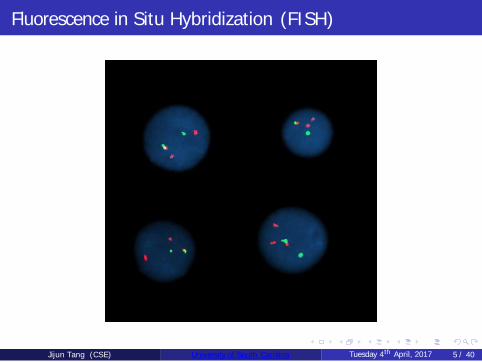
Fluorescence in Situ Hybridization (FISH)
Tuesday 4th April, 2017Jijun Tang (CSE) University of South Carolina 5/ 40
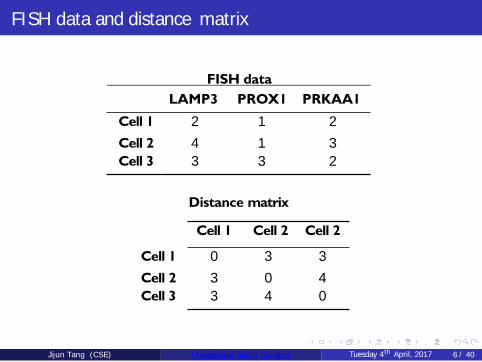
FISH data and distance matrix
FISH dataLAMP3 PROX1 PRKAA1
Cell 1 2 1 2Cell 2 4 1 3Cell 3 3 3 2
Distance matrix
Cell 1 Cell 2 Cell 2
Cell 1 0 3 3Cell 2 3 0 4Cell 3 3 4 0
Tuesday 4th April, 2017Jijun Tang (CSE) University of South Carolina 6/ 40
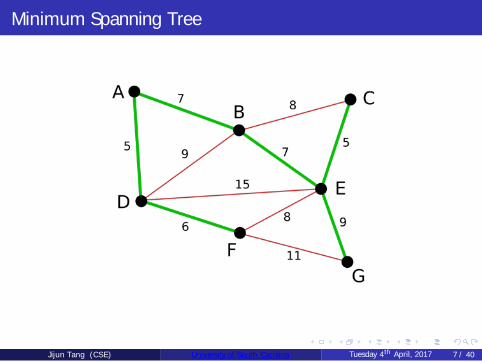
Minimum Spanning Tree
Tuesday 4th April, 2017Jijun Tang (CSE) University of South Carolina 7/ 40
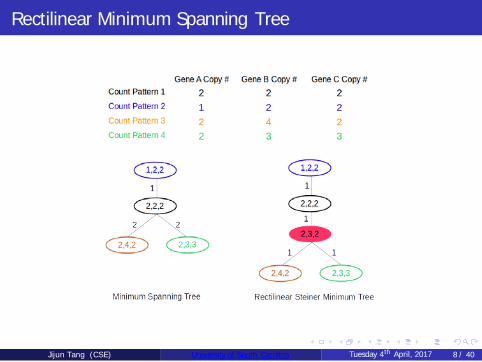
Rectilinear Minimum Spanning Tree
Tuesday 4th April, 2017Jijun Tang (CSE) University of South Carolina 8/ 40
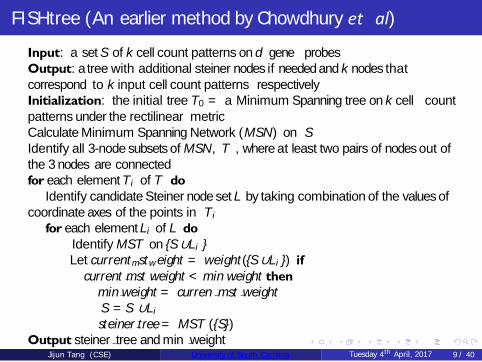
FISHtree (An earlier method by Chowdhury et al)Input: a set S of k cell count patterns on d gene probesOutput: a tree with additional steiner nodes if needed and k nodes that correspond to k input cell count patterns respectivelyInitialization: the initial tree T0 = a Minimum Spanning tree on k cell countpatterns under the rectilinear metricCalculate Minimum Spanning Network (MSN) on SIdentify all 3-node subsets of MSN , T , where at least two pairs of nodes out of the 3 nodes are connectedfor each element T i of T do
Identify candidate Steiner node set L by taking combination of the values of coordinate axes of the points in T i
for each element Li of L doIdentify MST on {S ∪Li }Let currentmstw eight = weight({S ∪Li }) if
current mst weight < min weight then min weight = curren mst weightS = S ∪Listeiner tree = MST ({S})
Output steiner tree and min weightTuesday 4th April, 2017Jijun Tang (CSE) University of South Carolina 9/ 40
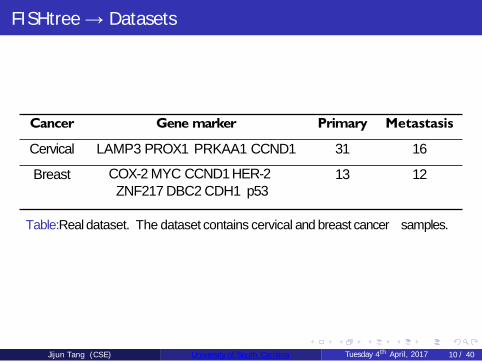
FISHtree → Datasets
Cancer Gene marker Primary Metastasis
Cervical LAMP3 PROX1 PRKAA1 CCND1 31 16
Breast COX-2 MYC CCND1 HER-2 ZNF217 DBC2 CDH1 p53
13 12
Table:Real dataset. The dataset contains cervical and breast cancer samples.
Tuesday 4th April, 2017Jijun Tang (CSE) University of South Carolina 10 / 40
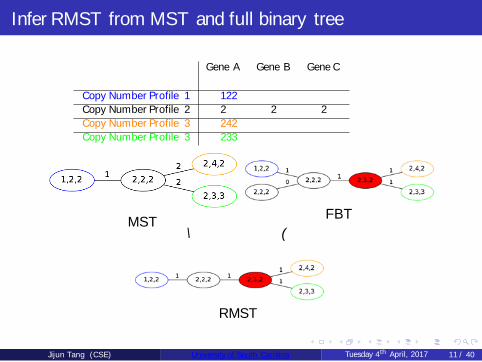
Infer RMST from MST and full binary tree
Gene A Gene B Gene C
Copy Number Profile 1 122Copy Number Profile 2 2 2 2Copy Number Profile 3 242Copy Number Profile 3 233
MST FBT\ (
RMST
Tuesday 4th April, 2017Jijun Tang (CSE) University of South Carolina 11/ 40

An iterative approach for phylogenetic analysis of cancer FISH data(iFISHtree)
Tuesday 4th April, 2017Jijun Tang (CSE) University of South Carolina 12/ 40
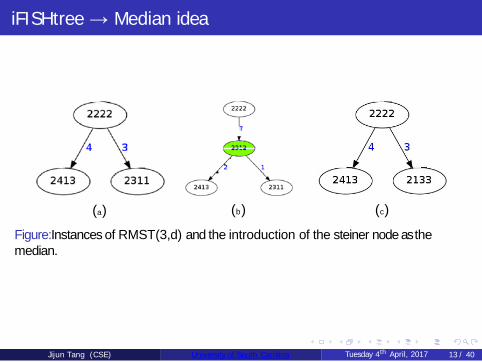
iFISHtree → Median idea
(a) (b) (c)
Figure:Instances of RMST(3,d) and the introduction of the steiner node as the median.
Tuesday 4th April, 2017Jijun Tang (CSE) University of South Carolina 13/ 40
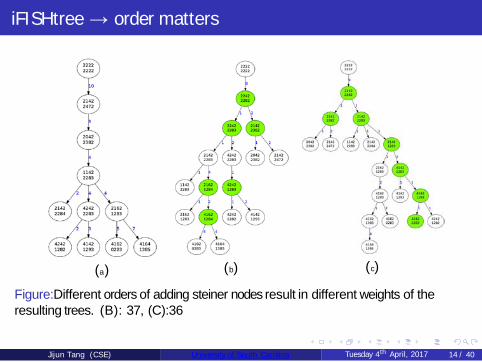
iFISHtree → order matters
(a) (b) (c)
Figure:Different orders of adding steiner nodes result in different weights of the resulting trees. (B): 37, (C):36
Tuesday 4th April, 2017Jijun Tang (CSE) University of South Carolina 14/ 40
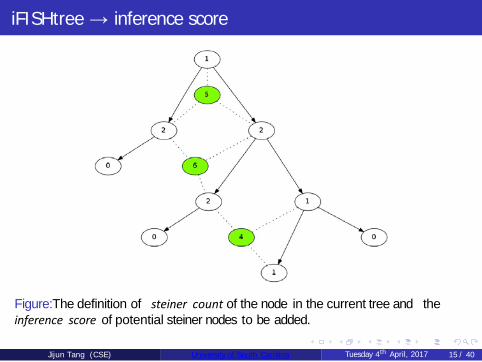
iFISHtree → inference score
Figure:The definition of steiner count of the node in the current tree and theinference score of potential steiner nodes to be added.
Tuesday 4th April, 2017Jijun Tang (CSE) University of South Carolina 15/ 40
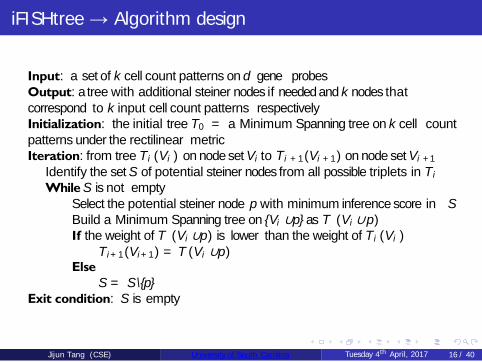
iFISHtree → Algorithm design
Input: a set of k cell count patterns on d gene probesOutput: a tree with additional steiner nodes if needed and k nodes that correspond to k input cell count patterns respectivelyInitialization: the initial tree T0 = a Minimum Spanning tree on k cell countpatterns under the rectilinear metricIteration: from tree T i (V i ) on node set V i to T i +1(Vi +1) on node set V i +1
Identify the set S of potential steiner nodes from all possible triplets in T i While S is not empty
Select the potential steiner node p with minimum inference score in SBuild a Minimum Spanning tree on {Vi ∪p} as T (V i ∪p)If the weight of T (V i ∪p) is lower than the weight of T i (V i )
T i+1(Vi+1) = T (V i ∪p)Else
S = S \{p}Exit condition: S is empty
Tuesday 4th April, 2017Jijun Tang (CSE) University of South Carolina 16/ 40
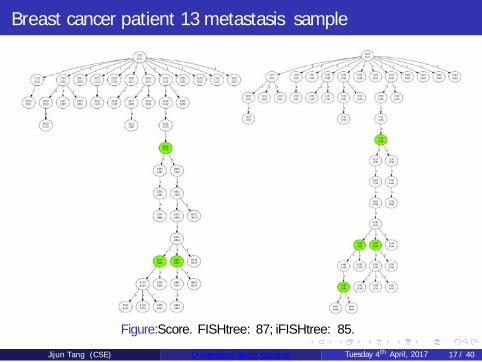
Breast cancer patient 13 metastasis sample
Figure:Score. FISHtree: 87; iFISHtree: 85.
Tuesday 4th April, 2017Jijun Tang (CSE) University of South Carolina 17/ 40
Breast cancer result
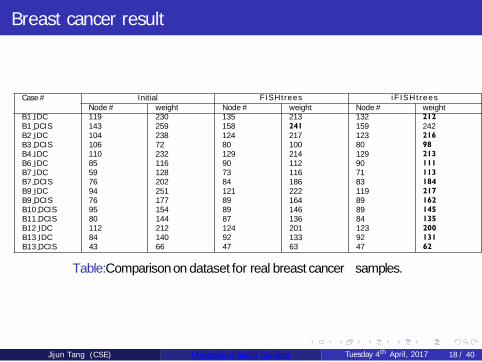
Case# Initial FISHtrees iF ISHt reesNode# weight Node# weight Node# weight
B1 IDC 119 230 135 213 132 212B1 DCIS 143 259 158 241 159 242B2 IDC 104 238 124 217 123 216B3 DCIS 106 72 80 100 80 98B4 IDC 110 232 129 214 129 213B6 IDC 85 116 90 112 90 111B7 IDC 59 128 73 116 71 113B7 DCIS 76 202 84 186 83 184B9 IDC 94 251 121 222 119 217B9 DCIS 76 177 89 164 89 162B10DCIS 95 154 89 146 89 145B11DCIS 80 144 87 136 84 135B12 IDC 112 212 124 201 123 200B13 IDC 84 140 92 133 92 131B13DCIS 43 66 47 63 47 62
Table:Comparison on dataset for real breast cancer samples.
Tuesday 4th April, 2017Jijun Tang (CSE) University of South Carolina 18/ 40
Cervical cancer result
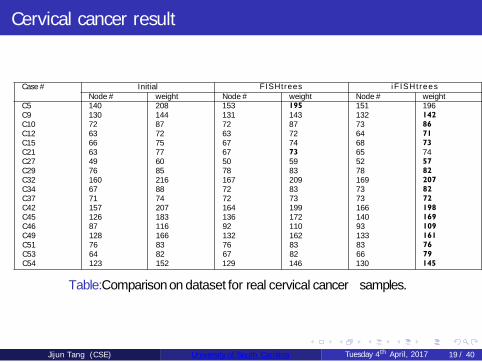
Case# Initial FISHtrees iF ISHt reesNode# weight Node# weight Node# weight
C5 140 208 153 195 151 196C9 130 144 131 143 132 142C10 72 87 72 87 73 86C12 63 72 63 72 64 71C15 66 75 67 74 68 73C21 63 77 67 73 65 74C27 49 60 50 59 52 57C29 76 85 78 83 78 82C32 160 216 167 209 169 207C34 67 88 72 83 73 82C37 71 74 72 73 73 72C42 157 207 164 199 166 198C45 126 183 136 172 140 169C46 87 116 92 110 93 109C49 128 166 132 162 133 161C51 76 83 76 83 83 76C53 64 82 67 82 66 79C54 123 152 129 146 130 145
Table:Comparison on dataset for real cervical cancer samples.
Tuesday 4th April, 2017Jijun Tang (CSE) University of South Carolina 19/ 40
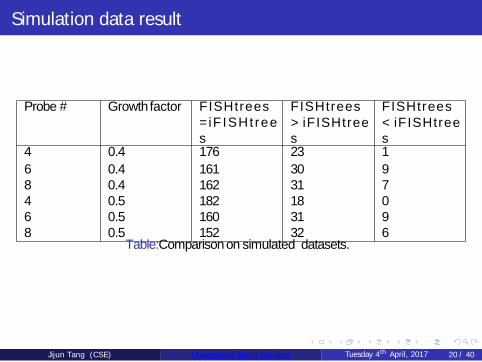
Simulation data result
Probe # Growth factor FISHtrees=iF ISHt rees
FISHtrees> iFISHtrees
FISHtrees< iFISHtrees
4 0.4 176 23 16 0.4 161 30 98 0.4 162 31 74 0.5 182 18 06 0.5 160 31 98 0.5 152 32 6
Table:Comparison on simulated datasets.
Tuesday 4th April, 2017Jijun Tang (CSE) University of South Carolina 20 / 40
Conclusion
RMST was shown to be a good model for phylogenetic analysis by using FISH cell count pattern data, but it need efficient heuristics because it is a NP-hardproblem.We presented our heuristic method iFISHtree to approximate the RMST based on medium idea.Our experiments on simulation and real datasets demonstrate the superiority of our algorithm over previous method.Our method runs at similar and relatively faster speed than earlier method and is supposed to be better with increasing number of gene markers.
Tuesday 4th April, 2017Jijun Tang (CSE) University of South Carolina 21/ 40
Maximum parsimony analysis of gene copy number data
Tuesday 4th April, 2017Jijun Tang (CSE) University of South Carolina 22/ 40
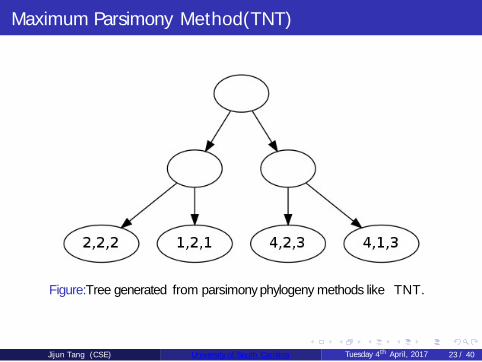
Maximum Parsimony Method(TNT)
Figure:Tree generated from parsimony phylogeny methods like TNT.
Tuesday 4th April, 2017Jijun Tang (CSE) University of South Carolina 23/ 40
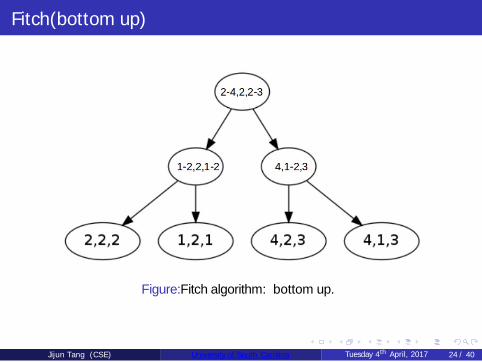
Fitch(bottom up)
Figure:Fitch algorithm: bottom up.
Tuesday 4th April, 2017Jijun Tang (CSE) University of South Carolina 24/ 40
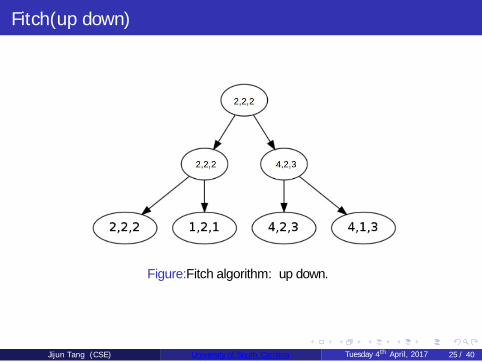
Fitch(up down)
Figure:Fitch algorithm: up down.
Tuesday 4th April, 2017Jijun Tang (CSE) University of South Carolina 25/ 40
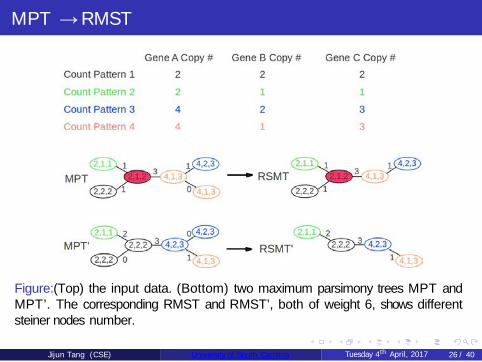
MPT → RMST
Figure:(Top) the input data. (Bottom) two maximum parsimony trees MPT andMPT’. The corresponding RMST and RMST’, both of weight 6, shows differentsteiner nodes number.
Tuesday 4th April, 2017Jijun Tang (CSE) University of South Carolina 26/ 40
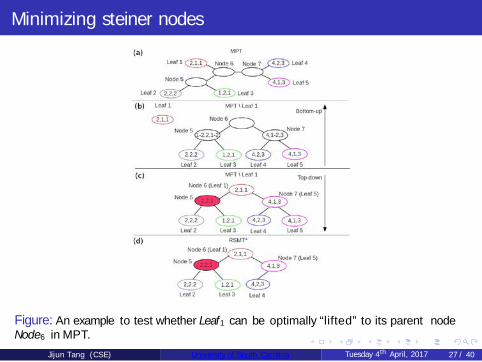
Minimizing steiner nodes
Figure: An example to test whether Leaf1 can be optimally “lifted” to its parent nodeNode6 in MPT.
Tuesday 4th April, 2017Jijun Tang (CSE) University of South Carolina 27/ 40
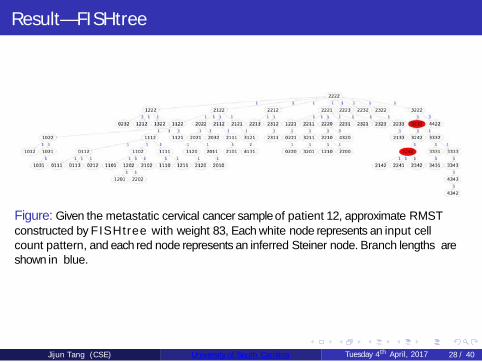
Result—FISHtree
Figure: Given the metastatic cervical cancer sample of patient 12, approximate RMST constructed by FISHtree with weight 83, Each white node represents an input cell count pattern, and each red node represents an inferred Steiner node. Branch lengths are shown in blue.
Tuesday 4th April, 2017Jijun Tang (CSE) University of South Carolina 28/ 40
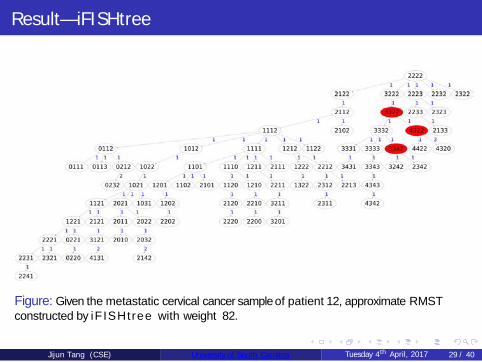
Result—iFISHtree
Figure: Given the metastatic cervical cancer sample of patient 12, approximate RMST constructed by iFISHtree with weight 82.
Tuesday 4th April, 2017Jijun Tang (CSE) University of South Carolina 29/ 40
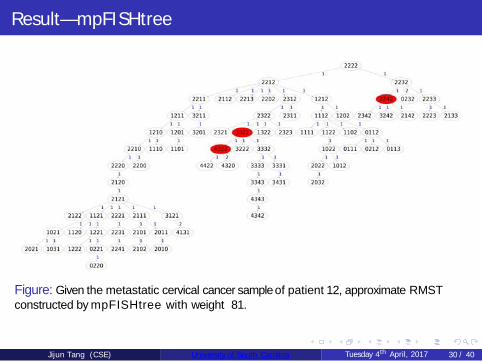
Result—mpFISHtree
Figure: Given the metastatic cervical cancer sample of patient 12, approximate RMST constructed by mpFISHtree with weight 81.
Tuesday 4th April, 2017Jijun Tang (CSE) University of South Carolina 30 / 40
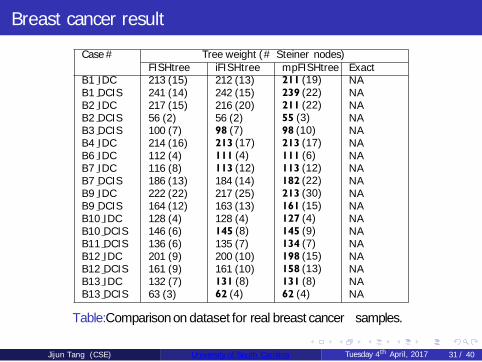
Breast cancer resultCase# Tree weight (# Steiner nodes)
FISHtree iFISHtree mpFISHtree ExactB1 IDC 213 (15) 212 (13) 211 (19) NAB1 DCIS 241 (14) 242 (15) 239 (22) NAB2 IDC 217 (15) 216 (20) 211 (22) NAB2 DCIS 56(2) 56(2) 55 (3) NAB3 DCIS 100(7) 98 (7) 98 (10) NAB4 IDC 214 (16) 213 (17) 213 (17) NAB6 IDC 112(4) 111 (4) 111 (6) NAB7 IDC 116(8) 113 (12) 113 (12) NAB7 DCIS 186 (13) 184 (14) 182 (22) NAB9 IDC 222 (22) 217 (25) 213 (30) NAB9 DCIS 164 (12) 163 (13) 161 (15) NAB10 IDC 128(4) 128(4) 127 (4) NAB10 DCIS 146(6) 145 (8) 145 (9) NAB11 DCIS 136(6) 135(7) 134 (7) NAB12 IDC 201(9) 200 (10) 198 (15) NAB12 DCIS 161(9) 161 (10) 158 (13) NAB13 IDC 132(7) 131 (8) 131 (8) NAB13 DCIS 63(3) 62 (4) 62 (4) NA
Table:Comparison on dataset for real breast cancer samples.
Tuesday 4th April, 2017Jijun Tang (CSE) University of South Carolina 31/ 40
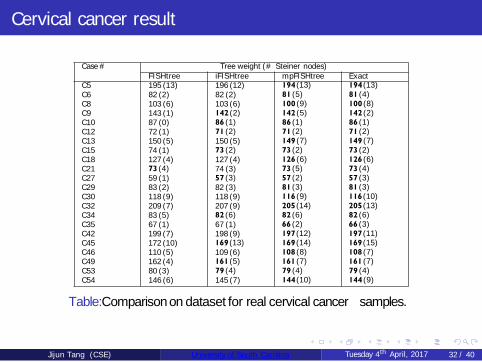
Cervical cancer result
Case# Tree weight (# Steiner nodes)FISHtree iFISHtree mpFISHtree Exact
C5 195(13) 196(12) 194(13) 194(13)C6 82(2) 82(2) 81 (5) 81 (4)C8 103(6) 103(6) 100(9) 100(8)C9 143(1) 142(2) 142(5) 142(2)C10 87(0) 86 (1) 86 (1) 86 (1)C12 72(1) 71 (2) 71 (2) 71 (2)C13 150(5) 150(5) 149(7) 149(7)C15 74(1) 73 (2) 73 (2) 73 (2)C18 127(4) 127(4) 126(6) 126(6)C21 73 (4) 74(3) 73 (5) 73 (4)C27 59(1) 57 (3) 57 (2) 57 (3)C29 83(2) 82(3) 81 (3) 81 (3)C30 118(9) 118(9) 116(9) 116(10)C32 209(7) 207(9) 205(14) 205(13)C34 83(5) 82 (6) 82 (6) 82 (6)C35 67(1) 67(1) 66 (2) 66 (3)C42 199(7) 198(9) 197(12) 197(11)C45 172(10) 169(13) 169(14) 169(15)C46 110(5) 109(6) 108(8) 108(7)C49 162(4) 161(5) 161(7) 161(7)C53 80(3) 79 (4) 79 (4) 79 (4)C54 146(6) 145(7) 144(10) 144(9)
Table:Comparison on dataset for real cervical cancer samples.
Tuesday 4th April, 2017Jijun Tang (CSE) University of South Carolina 32/ 40
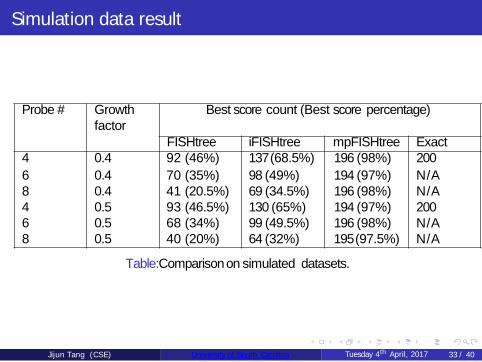
Simulation data result
Probe # Growthfactor
Best score count (Best score percentage)
FISHtree iFISHtree mpFISHtree Exact4 0.4 92 (46%) 137(68.5%) 196 (98%) 2006 0.4 70 (35%) 98 (49%) 194 (97%) N/A8 0.4 41 (20.5%) 69 (34.5%) 196 (98%) N/A4 0.5 93 (46.5%) 130 (65%) 194 (97%) 2006 0.5 68 (34%) 99 (49.5%) 196 (98%) N/A8 0.5 40 (20%) 64 (32%) 195(97.5%) N/A
Table:Comparison on simulated datasets.
Tuesday 4th April, 2017Jijun Tang (CSE) University of South Carolina 33/ 40

Large scale change(WGD)
WGD exists in 37% of cancer.Considering large scale change can greatly extend the use of our method.Chowdhury et al have some work in considering large scale gene change.Find the minimum steiner tree considering large scale change is called Duplication Steiner Minimum Tree (DSMT).
Tuesday 4th April, 2017Jijun Tang (CSE) University of South Carolina 34/ 40
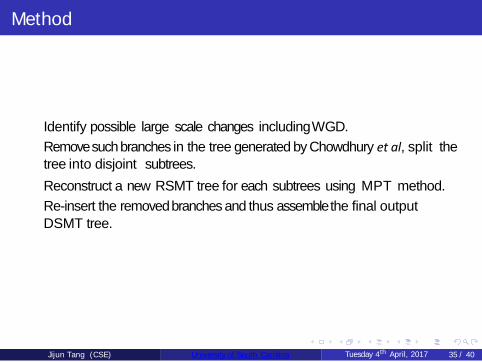
Method
Identify possible large scale changes includingWGD.Remove such branches in the tree generated by Chowdhury et al, split the tree into disjoint subtrees.Reconstruct a new RSMT tree for each subtrees using MPT method.Re-insert the removed branches and thus assemble the final output DSMT tree.
Tuesday 4th April, 2017Jijun Tang (CSE) University of South Carolina 35/ 40
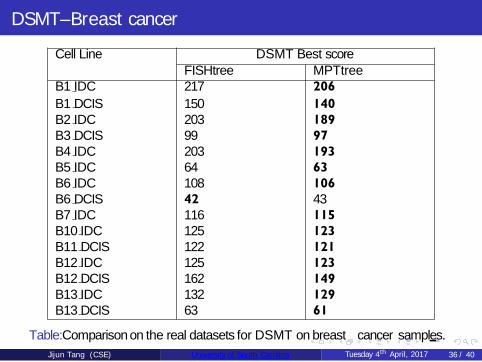
DSMT–Breast cancerCell Line DSMT Best score
FISHtree MPTtreeB1 IDC 217 206B1 DCIS 150 140B2 IDC 203 189B3 DCIS 99 97B4 IDC 203 193B5 IDC 64 63B6 IDC 108 106B6 DCIS 42 43B7 IDC 116 115B10 IDC 125 123B11 DCIS 122 121B12 IDC 125 123B12 DCIS 162 149B13 IDC 132 129B13 DCIS 63 61
Table:Comparison on the real datasets for DSMT on breast cancer samples.Tuesday 4th April, 2017Jijun Tang (CSE) University of South Carolina 36/ 40
DSMT–Cervical cancer
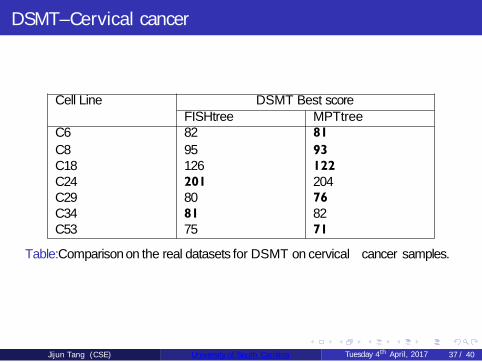
Cell Line DSMT Best scoreFISHtree MPTtree
C6 82 81C8 95 93C18 126 122C24 201 204C29 80 76C34 81 82C53 75 71
Table:Comparison on the real datasets for DSMT on cervical cancer samples.
Tuesday 4th April, 2017Jijun Tang (CSE) University of South Carolina 37/ 40
DSMT–Simulation data
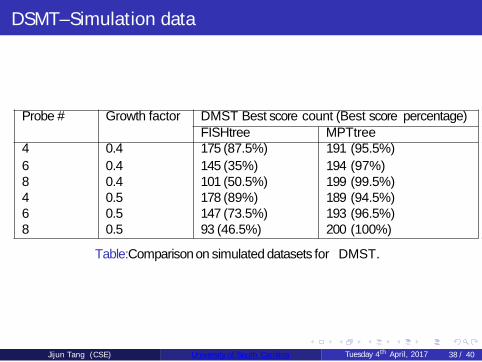
Probe # Growth factor DMST Best score count (Best score percentage)FISHtree MPTtree
4 0.4 175 (87.5%) 191 (95.5%)6 0.4 145 (35%) 194 (97%)8 0.4 101 (50.5%) 199 (99.5%)4 0.5 178 (89%) 189 (94.5%)6 0.5 147 (73.5%) 193 (96.5%)8 0.5 93 (46.5%) 200 (100%)
Table:Comparison on simulated datasets for DMST.
Tuesday 4th April, 2017Jijun Tang (CSE) University of South Carolina 38/ 40
Conclusion
We presented our heuristic method MPFISHtree to approximate the RMST based on Maximum Parsimony phylogeny reconstruction (TNT).We extend our MPFISHtree to consider large genome change including WGD as DMST.Our experiments on simulation and real datasets demonstrate the superiority of our algorithms over previous methods.Our method tried to produce the solution with the minimum number of steiner nodes.Our method can be extended to apply on other data type such as copy number variation(CNV) data.
Tuesday 4th April, 2017Jijun Tang (CSE) University of South Carolina 39/ 40

The End
Tuesday 4th April, 2017Jijun Tang (CSE) University of South Carolina 40 / 40