Embed Size (px)
Citation preview
African Journal of Biotechnology Vol. 10(70), pp. 15697-15709, 9 November, 2011 Available online at http://www.academicjournals.org/AJB DOI: 10.5897/AJB11.885 ISSN 1684–5315 ©2011 Academic Journals
Full Length Research Paper
Analysis of genetic diversity among cultivated enset (Ensete ventricosum) populations from Essera and Kefficho, southwestern part of Ethiopia using inter
simple sequence repeats (ISSRs) marker
Dagmawit Chombe Tobiaw1* and Endashaw Bekele2
1Natural Science College, Jimma University, Jimma, Ethiopia.
2Science Faculty, Addis Ababa University, Addis Ababa, Ethiopia.
Accepted 13 July, 2011
This study was conducted with the objective to investigate the genetic variation among populations of cultivated enset (Enset ventricosum). Leaf samples for 71 enset plants were collected from two areas of southwestern (SW) Ethiopia (Kefficho and Essera). Inter simple sequence repeats (ISSRs) as a molecular marker was used to assess genetic diversity both within and between populations using two ISSR primers (834 and 826). A total of 26 clear and reproducible bands were amplified from the two primers. Both the unweighted pair group method with arithmetic averages (UPGMA) and neighbor joining trees were constructed for each individual and population using Jaccard’s similarity coefficient. The trees indicated two separate clusters which are based on the origin of populations and few mixing of samples between regions was observed. The principal coordinated (PCO) analysis also recovered the UPGMA and neighbor joining trees groups. All parameters indicated that the clones of enset from Kefficho are more diverse than clones from Essera. Moreover, partitioning of Shannon’s diversity index showed that the majority of the variations were observed within populations than between the two populations. In conclusion all the diversity parameters confirm the existence of high genetic diversity within the study populations. Moreover, it also indicates that ISSR markers can be successfully applied for the assessment of genetic diversity of this species. Key words: Ensete ventricosum, Essera, Ethiopia, genetic diversity, inter simple sequence repeats, Kefficho.
INTRODUCTION Enset [Ensete ventricosum (Welw)]. Chessman, is a perennial herbaceous, monocarpic and monocoty-ledonous crop in the family Musaceae (Birmeta et al., 2004). Enset is related to and has physical resemblance with the banana plant and as a result it is sometimes known as a false banana. However, enset belongs to the family Musaceae, and the genus Ensete. Banana is in the same family as enset, but in the genus Musa (Lye and Edwards, 1997). Although enset produces banana-like *Corresponding author. E-mail: [email protected]. Tel: +251911745351. Fax: +251471120704.
fruits; these fruits are not the edible part. The under-ground corm and the aerial pseudostem made up of overlapping leaf sheaths are edible after some processes. Starchy food is produced by pulverizing the corm or scraping the pseudostem, followed by a short fermentation period. Unlike banana, enset is monocarpic and fruits only once in its life cycle (Shank, 1994).
The fruits contain several seeds which are hard and about 1 to 2 cm long. Sprouting occurs only when the main shoot with the meristem is artificially decapitated at the junction between the pseudostem and corm at soil surface, while in banana sprouting occurs spontaneously (Brandt et al., 1997). Enset is a diploid plant with the haploid chromosome number n = 9, whereas Musa
15698 Afr. J. Biotechnol. species, including edible banana, have different ploidy levels and chromosome numbers (diploid, triploid or tetraploid), with n = 7, n = 9, n = 10, and n = 11 (Birmeta et al., 2004).
Enset is the main crop of a sustainable indigenous African system that ensures food security in a country that is food deficient (Brandt et al., 1997). Enset culture system is one of the four major agricultural systems in Ethiopia feeding about 13 million people, more than 20% of the population residing in the southern Ethiopian highlands (Addis, 2005). Enset represents about 65% of the total crop production in the southern region of Ethiopia. Productivity is very high compared to other crops but varies depending on edaphic factors, altitude, cultural practices and varietal differences (Birmeta et al., 2004).
Enset is not affected by excess rain or drought, as it been witnessed during the great famine of 1888 to 1892. Besides, the stability of the Southwest Ethiopian highlands owes much to the enset culture. Therefore, Brandt et al. (1997), rightly called enset the tree against hunger, while Emperor Menelik's appreciation of the plant says it was appropriately called worqe, literally meaning "my own gold" (Pankhurst, 1985).
Enset is used as a staple and co-staple food for millions of Ethiopians. Products from enset are used in different forms in traditional medicine. A starch for textile, adhesive and paper industries is being produced (Diro and Staden, 2005).
However, due to unsatisfactory research attention given to enset crop, its production system is still tradit-ional and tiresome. Different management practices starting from propagation to harvesting and processing demand high labor (Bobosha, 2003).
Furthermore, cultivation of enset is constrained by various diseases such as enset wilt, caused by Xanthomonas campestris pv. musacearum, and by insect pests and abiotic factors. Enset germplasm is currently maintained in a field gene bank but is at risk of diseases, pests and adverse environmental conditions (Diro and Staden, 2005).
Ensete ventricosum was previously cultivated only in the south and southwestern parts of Ethiopia, but the recurrent droughts have led to the expansion of enset cultivation to other parts of the country (Brandt et al., 1997).
A wide adaptation within the species to altitude, soil and climate has allowed widespread cultivation in western Bale, southwestern Oromia, including south and east Shewa, Jima, Illubabor and Welega (Shank, 1994).
Human beings, in their struggle for survival, have selected and domesticated crops to fulfill their immediate needs. Nowadays, many people have become aware of the importance of preserving genetic diversity for the survival and continuation of any form of life that exists on earth (Birmeta et al., 2004). Most of the genetic diversity of enset is traditionally maintained in situ by farmers.
Unfortunately, many valuable clones have been lost due to various human and environmental factors (Gebremariam, 1996; Negash et al., 2002), which may have reduced the total available genetic diversity of the crop. Lack of knowledge about the genetic diversity of this crop species complicates the conservation, improve-ment, and utilization of enset by farmers, conserva-tionists, and breeders (Negash et al., 2002).
As noted in Negash et al. (2002), a more extensive investigation including divergent production areas not yet covered would extend the current overview of enset genetic diversity in Ethiopia and allows its effective conservation.
Several modern molecular techniques are now being applied together with morphological studies to investigate genetic diversity and relatedness in crops (Birmeta et al., 2004). Although assessment of morphological variation present in enset is feasible, its use is rather limited due to the small number of phenotypic markers and the fact that they are influenced by environmental conditions (Negash et al., 2002).
Therefore, in this study, ISSR marker was used to characterize germplasm diversity in cultivated enset as a complementary approach. MATERIALS AND METHODS
Study area
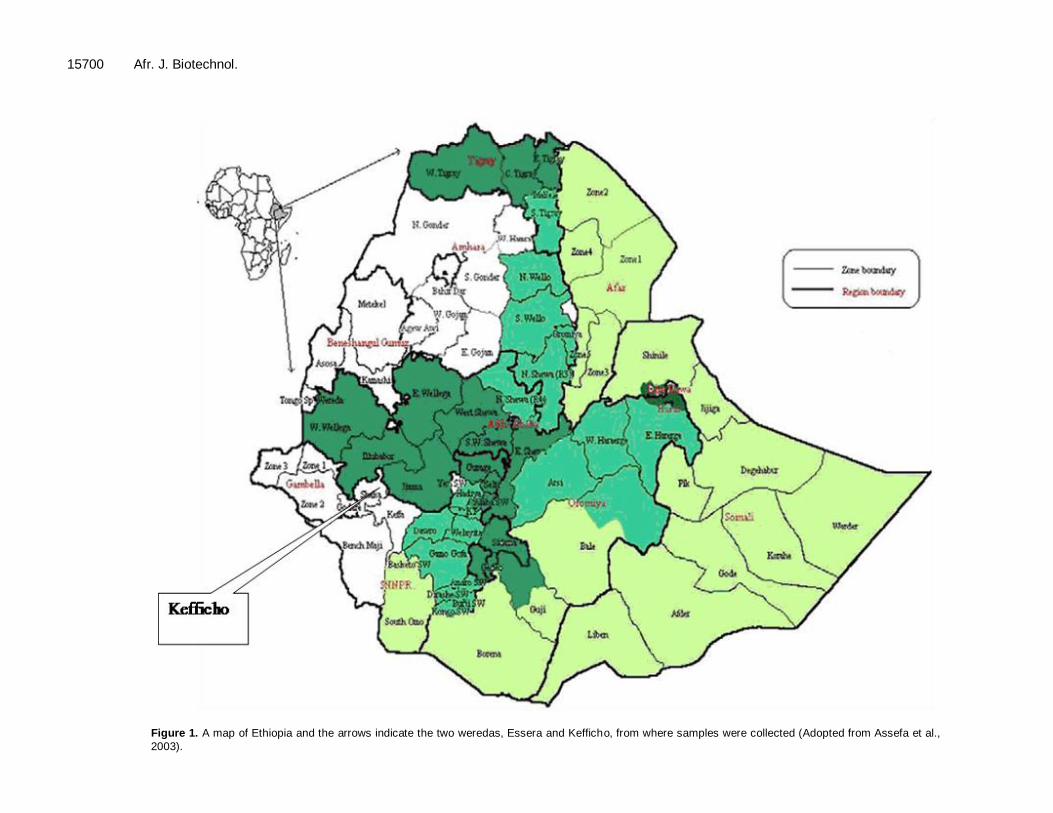
The study area chosen were Kefficho and Essera. Both Kefficho and Essera are found in the southern nations, nationalities and peoples region (SNNPR). Essera is one of the three weredas found in Dawro zone and shares boundaries with Wolaita and Kambata in the east, Kafa in the west, Gamo and Gofa to the south, and Jimma
to the northwest. The collection site is shown in Table 1. Kefficho Shekicho is bordered on the south by Debub Omo, on
the southwest by Bench Maji, on the west and north by the Oromia Region, and on the east by Semien Omo (Figure 1). The people in these two selected areas live in villages which are organized around homesteads surrounded by dense plantations of enset (E. ventricosum). Hence the study site is suitable to accomplish the objective of the study.
Plant material and sampling technique
A total leaf sample of 71 enset clonal varieties representing two cultivated enset population, 49 samples from Essera and 22 from Kefficho, all with different name, were collected based on farmers definition of clonal cultivars, that is farmers identification for enset based on the value they have obtained from different enset clones.
Leave samples were stored in a zip locked plastic bag containing silica gel to be dried and preserved until extraction of genomic DNA. DNA extraction
The dried leaf samples were grinded with pestle and mortar. Total genomic DNA was isolated from about 0.2 g of each pulverized leaf
sample using modified CTAB extraction technique (Borsch et al., 2003).
Tobiaw and Bekele 15699
Table 1. Collection site, their kilometer from a reference town and number of individuals collected from each site.
Population Collection site Number of individual Remark
Essera Essera area 49 About 160 km from Wolaita Sodo to SW
Kefficho Kefficho area 22 About 300 km from Wolaita Sodo to the West
Primer selection and ISSR-PCR amplification
A total of six ISSR primers listed in Table 2 were used for the initial testing of variability and reproducibility test. Four individual samples were selected from each population to screen the primers with 1:5
dilutions. Each primer was tested for reproducibility and poly-morphism and finally two primers were selected based on their high discriminatory potential, extended and clear banding pattern and reproducible as compared to other selected primers for the analysis.
The polymerase chain reaction was conducted in Biometera 2000 T3 thermo cycler. PCR amplification was carried out in a 25 µl reaction mixture containing 1 µl template DNA, 13.2 µl H2O, 5.6 µl dNTP (1.25 mm), 2.6 µl Tag buffer (10 × Thermopol reaction buffer), 2.0 µl MgCl2, 0.4 µl primer (20 pmol/ml) and 0.2 µl Tag
polymerase (5 U/µl ). The amplification program was 4 min preheating and initial denaturation at 94°C, then 39 and 15 s at 94°C, 1 min primer annealing at 45°C/48°C based on the primers used, and 1.30 min extension at 72°C. The final extension for 7 min at 72°C followed. The PCR reactions were also stored at 4°C until loading on gel for electrophoresis.
Agarose gel electrophoresis
An agarose gel (1.67% agarose with 100ml 1XTBE) was prepared and 8 µl amplification product of each sample with 2 µl loading dye was mixed and loaded on the gel. DNA ladder of 100 bp was also loaded together with the other samples and used to estimate molecular weight. The electrophoresis was done for 2 h at a constant voltage of 100 v. To allow visualization of bands, agarose gel was stained with ethidium bromide. This was done by mixing
450 ml distilled water with 50 µl of 10 mg/ml ethidium bromide in an automatic staining apparatus and then the gel was put in the solution for 30 min, and staining followed by distaining in 450 ml distilled water for another 30 min. Finally, gel picture was taken and visualized under UV light, photographed with digital camera mounted on BioDoc analyzer and connected to PC with Biometra software, and saved for later data scoring.
Data scoring and analysis
Since ISSRs are dominant markers, only the presence or absence of an allele can be determined. Each ISSR band was considered as an independent character or locus, and polymorphic bands were scored visually as either absent (“0”) or present (“1”) or missing data (“?”) for each of the 71 genotypes.
Different software‟s were employed to calculate standard indices of genetic diversity to identify the amount of genetic variation in
each enset population. These are listed as follow:
1. POPGENE version 1.32 software (Yeh et al., 1997) was used to assess the genetic variation among and within enset population and compute summary statistics like: allele frequency, gene diversity, genetic distance and F-statistics. The Shannon-diversity index scores were calculated for each sample as:
S
i
ii ppD1
2 )(log
Where, D = the Shannon diversity index; S = the number of alleles
in the sample; ip = the relative abundance of the i
th allele in the
sample. 2. Areliquin version 3.01 (Excoffier, 2001) was used to calculate
analysis of molecular variance (AMOVA) to estimate population differentiation directly from molecular data and test hypotheses about such differentiation. 3. NTSYS_pc version 2.02 (Rohlf, 2000) and Free Tree 0.9.1.50 (Pavlicek et al., 1999) software‟s were used to calculate Jaccard‟s coefficient of similarity which is calculated with the formula:
a Sij = a + b + c
Where, „a‟ is the total number of bands shared between individuals I and j, „b‟ is the total number of bands present in individual I but not in individual j and „c‟ is the total number of bands present in individual j but not in individual i.
4. From the similarity matrix, a sequential, agglomerative, hierarchical, and nested (SAHN) cluster analysis was performed using (UPGMA) algorithm computed using NTSYS-pc version 2.02 (Rohlf, 1997). A dendrogram was generated using NTSYS-pc version 2.02 (Rohlf, 1997) to show the genetic relationships and distances of each accession. 5. The neighbor joining (NJ) method (Saitou and Nei, 1987) was used to compare individual genotypes and evaluate patterns of genotype clustering using Free Tree 0.9.1.50 software (Pavlicek et
al., 1999). The major difference between the two algorithms is that UPGMA assumes equal rates of evolution (molecular clock assumption) along all branches, whereas neighbor joining assume variations in the rate of change (Studier and Keppler, 1988; Nei and Kumar, 2000). 6. To further examine the patterns of variation among individual samples, PCO analysis was performed based on Jaccard‟s coefficient (Jaccard, 1908). The calculation of Jaccard‟s coefficient was made with PAST software version 1.18 (Hammer et al., 2001). The three axes were later used to plot with STATISTICA version 6.0 software (Hammer et al., 2001; statistica soft, Inc. 2001).Principal-coordinate analysis was used to obtain a graphic representation showing the relationship of the 71 genotypes.
RESULTS Banding pattern and ISSR primers The DNA amplification pattern using ISSR primers in this study was reproducible across gels based on the results from 71 DNA samples. Out of the six primers tested initially, four of them gave relatively clear banding pattern and two primers were selected. ISSR analysis using two primers produced a total of 26 scorable bands; 12 polymorphic bands generated by primer 834 and 14
15700 Afr. J. Biotechnol.
Figure 1. A map of Ethiopia and the arrows indicate the two weredas, Essera and Kefficho, from where samples were collected (Adopted from Assefa et al.,
2003).
Tobiaw and Bekele 15701
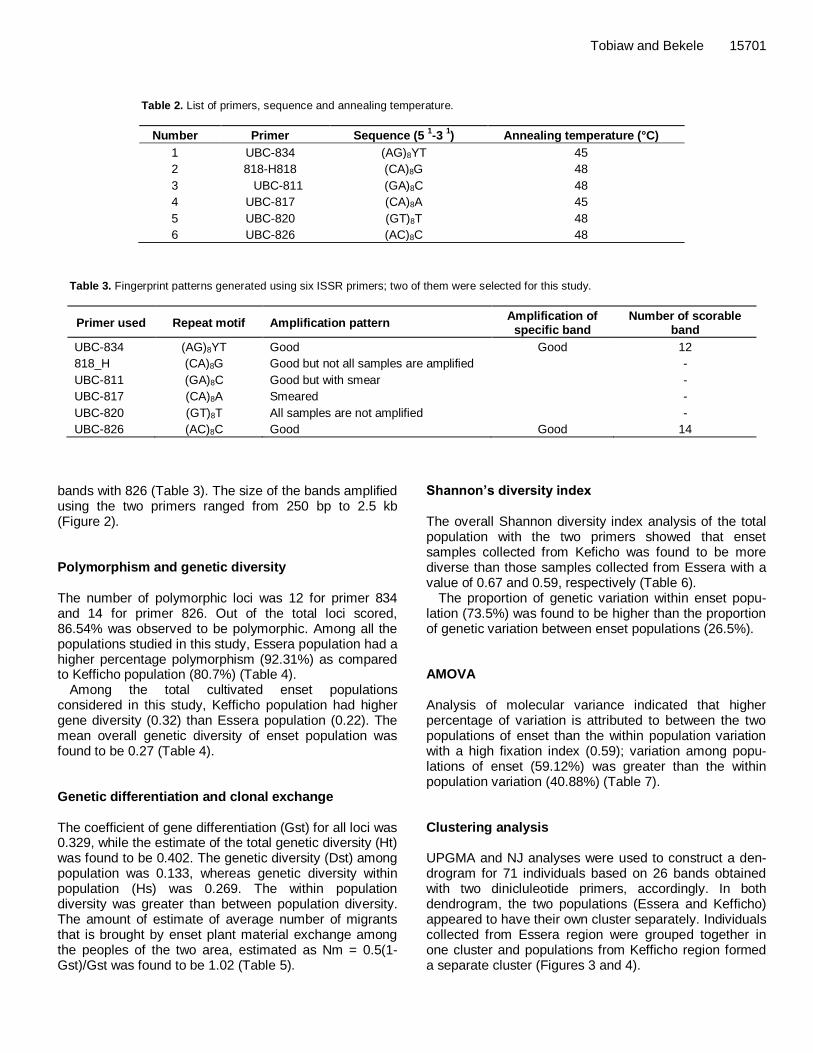
Table 2. List of primers, sequence and annealing temperature.
Number Primer Sequence (5 1-3
1) Annealing temperature (°C)
1 UBC-834 (AG)8YT 45
2 818-H818 (CA)8G 48
3 UBC-811 (GA)8C 48
4 UBC-817 (CA)8A 45
5 UBC-820 (GT)8T 48
6 UBC-826 (AC)8C 48
Table 3. Fingerprint patterns generated using six ISSR primers; two of them were selected for this study.
Primer used Repeat motif Amplification pattern Amplification of
specific band Number of scorable
band
UBC-834 (AG)8YT Good Good 12
818_H (CA)8G Good but not all samples are amplified -
UBC-811 (GA)8C Good but with smear -
UBC-817 (CA)8A Smeared -
UBC-820 (GT)8T All samples are not amplified -
UBC-826 (AC)8C Good Good 14
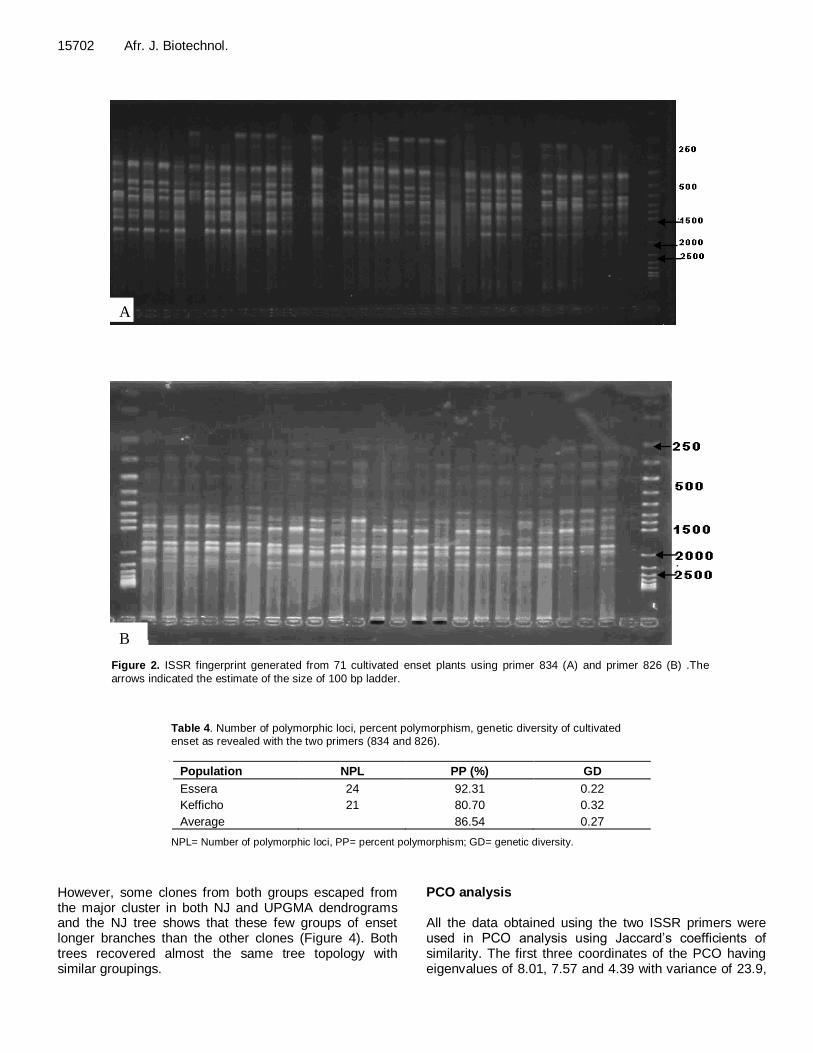
bands with 826 (Table 3). The size of the bands amplified using the two primers ranged from 250 bp to 2.5 kb (Figure 2). Polymorphism and genetic diversity The number of polymorphic loci was 12 for primer 834 and 14 for primer 826. Out of the total loci scored, 86.54% was observed to be polymorphic. Among all the populations studied in this study, Essera population had a higher percentage polymorphism (92.31%) as compared to Kefficho population (80.7%) (Table 4).
Among the total cultivated enset populations considered in this study, Kefficho population had higher gene diversity (0.32) than Essera population (0.22). The mean overall genetic diversity of enset population was found to be 0.27 (Table 4). Genetic differentiation and clonal exchange The coefficient of gene differentiation (Gst) for all loci was 0.329, while the estimate of the total genetic diversity (Ht) was found to be 0.402. The genetic diversity (Dst) among population was 0.133, whereas genetic diversity within population (Hs) was 0.269. The within population diversity was greater than between population diversity. The amount of estimate of average number of migrants that is brought by enset plant material exchange among the peoples of the two area, estimated as Nm = 0.5(1- Gst)/Gst was found to be 1.02 (Table 5).
Shannon’s diversity index The overall Shannon diversity index analysis of the total population with the two primers showed that enset samples collected from Keficho was found to be more diverse than those samples collected from Essera with a value of 0.67 and 0.59, respectively (Table 6).
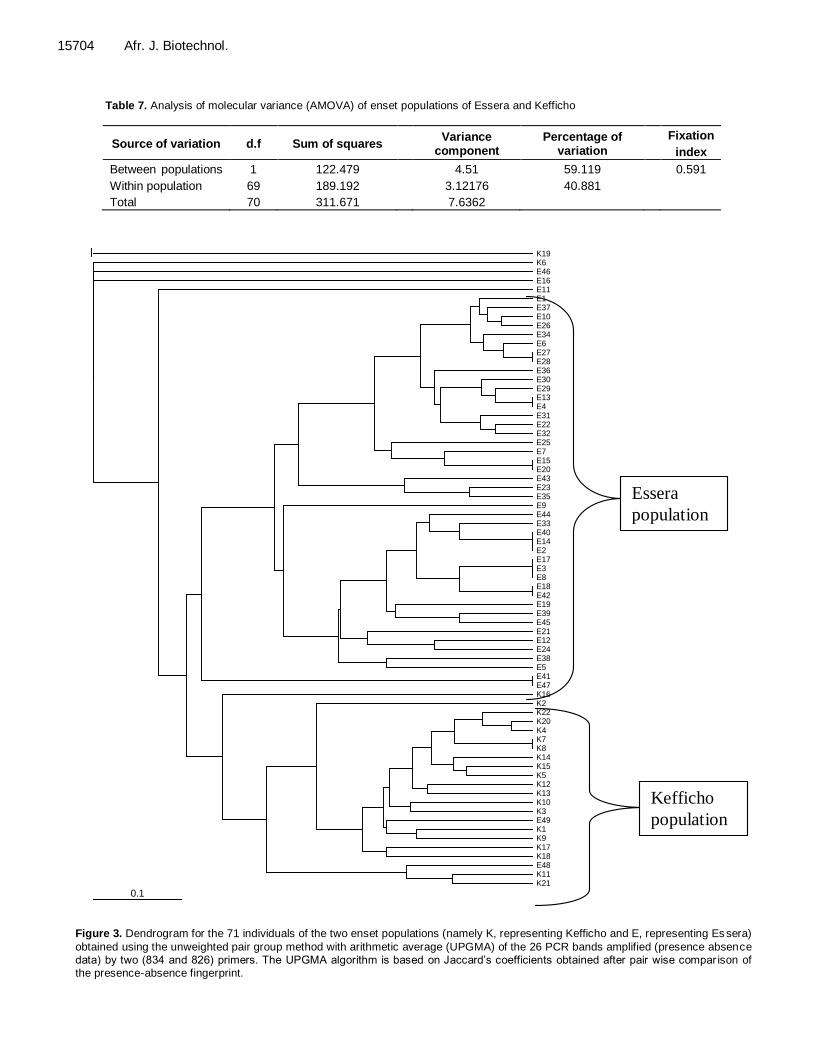
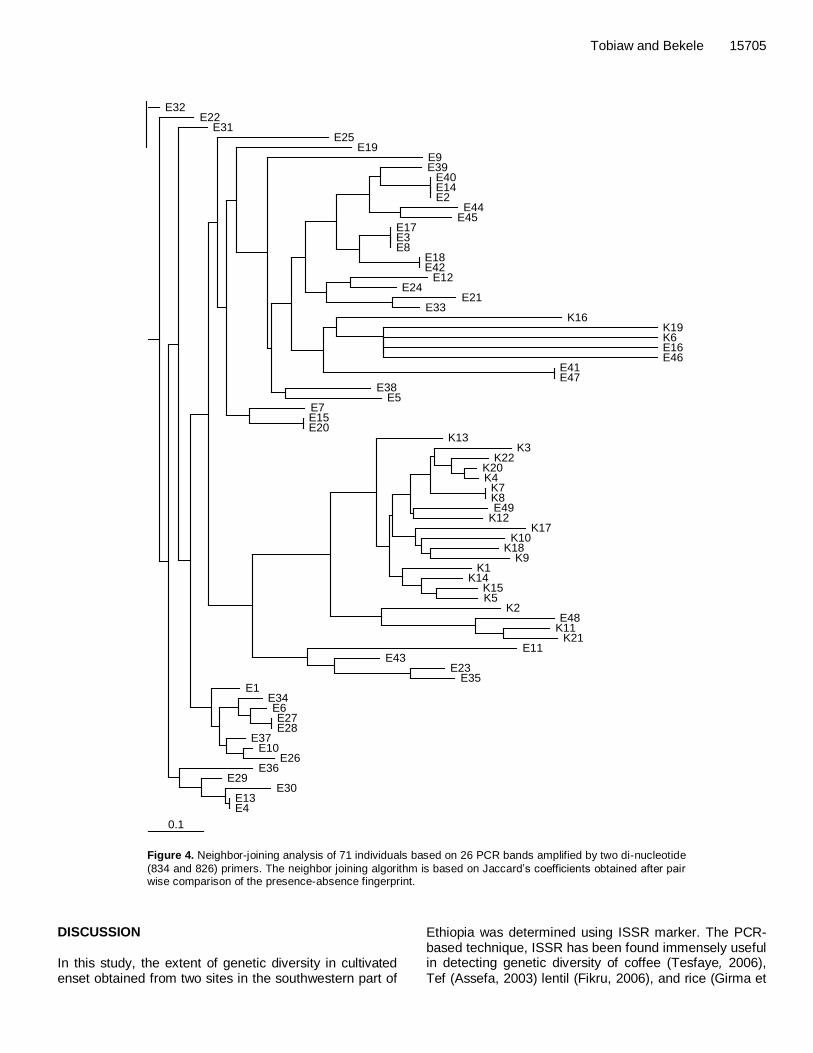
The proportion of genetic variation within enset popu-lation (73.5%) was found to be higher than the proportion of genetic variation between enset populations (26.5%). AMOVA Analysis of molecular variance indicated that higher percentage of variation is attributed to between the two populations of enset than the within population variation with a high fixation index (0.59); variation among popu-lations of enset (59.12%) was greater than the within population variation (40.88%) (Table 7). Clustering analysis UPGMA and NJ analyses were used to construct a den-drogram for 71 individuals based on 26 bands obtained with two dinicluleotide primers, accordingly. In both dendrogram, the two populations (Essera and Kefficho) appeared to have their own cluster separately. Individuals collected from Essera region were grouped together in one cluster and populations from Kefficho region formed a separate cluster (Figures 3 and 4).
15702 Afr. J. Biotechnol.
A
B Figure 2. ISSR fingerprint generated from 71 cultivated enset plants using primer 834 (A) and primer 826 (B) .The
arrows indicated the estimate of the size of 100 bp ladder.
Table 4. Number of polymorphic loci, percent polymorphism, genetic diversity of cultivated enset as revealed with the two primers (834 and 826).
Population NPL PP (%) GD
Essera 24 92.31 0.22
Kefficho 21 80.70 0.32
Average 86.54 0.27
NPL= Number of polymorphic loci, PP= percent polymorphism; GD= genetic diversity.
However, some clones from both groups escaped from the major cluster in both NJ and UPGMA dendrograms and the NJ tree shows that these few groups of enset longer branches than the other clones (Figure 4). Both trees recovered almost the same tree topology with similar groupings.
PCO analysis All the data obtained using the two ISSR primers were used in PCO analysis using Jaccard‟s coefficients of similarity. The first three coordinates of the PCO having eigenvalues of 8.01, 7.57 and 4.39 with variance of 23.9,
Tobiaw and Bekele 15703
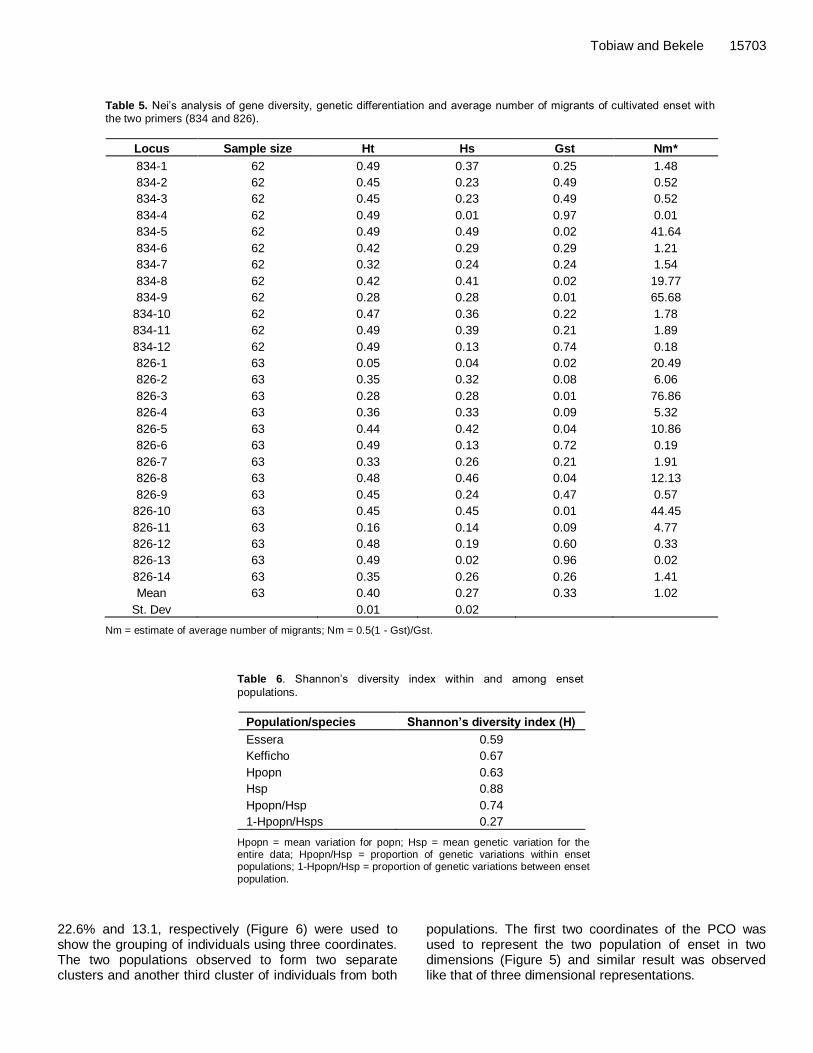
Table 5. Nei‟s analysis of gene diversity, genetic differentiation and average number of migrants of cultivated enset with the two primers (834 and 826).
Locus Sample size Ht Hs Gst Nm*
834-1 62 0.49 0.37 0.25 1.48
834-2 62 0.45 0.23 0.49 0.52
834-3 62 0.45 0.23 0.49 0.52
834-4 62 0.49 0.01 0.97 0.01
834-5 62 0.49 0.49 0.02 41.64
834-6 62 0.42 0.29 0.29 1.21
834-7 62 0.32 0.24 0.24 1.54
834-8 62 0.42 0.41 0.02 19.77
834-9 62 0.28 0.28 0.01 65.68
834-10 62 0.47 0.36 0.22 1.78
834-11 62 0.49 0.39 0.21 1.89
834-12 62 0.49 0.13 0.74 0.18
826-1 63 0.05 0.04 0.02 20.49
826-2 63 0.35 0.32 0.08 6.06
826-3 63 0.28 0.28 0.01 76.86
826-4 63 0.36 0.33 0.09 5.32
826-5 63 0.44 0.42 0.04 10.86
826-6 63 0.49 0.13 0.72 0.19
826-7 63 0.33 0.26 0.21 1.91
826-8 63 0.48 0.46 0.04 12.13
826-9 63 0.45 0.24 0.47 0.57
826-10 63 0.45 0.45 0.01 44.45
826-11 63 0.16 0.14 0.09 4.77
826-12 63 0.48 0.19 0.60 0.33
826-13 63 0.49 0.02 0.96 0.02
826-14 63 0.35 0.26 0.26 1.41
Mean 63 0.40 0.27 0.33 1.02
St. Dev 0.01 0.02
Nm = estimate of average number of migrants; Nm = 0.5(1 - Gst)/Gst.
Table 6. Shannon‟s diversity index within and among enset
populations.
Population/species Shannon’s diversity index (H)
Essera 0.59
Kefficho 0.67
Hpopn 0.63
Hsp 0.88
Hpopn/Hsp 0.74
1-Hpopn/Hsps 0.27
Hpopn = mean variation for popn; Hsp = mean genetic variation for the entire data; Hpopn/Hsp = proportion of genetic variations within enset populations; 1-Hpopn/Hsp = proportion of genetic variations between enset
population.
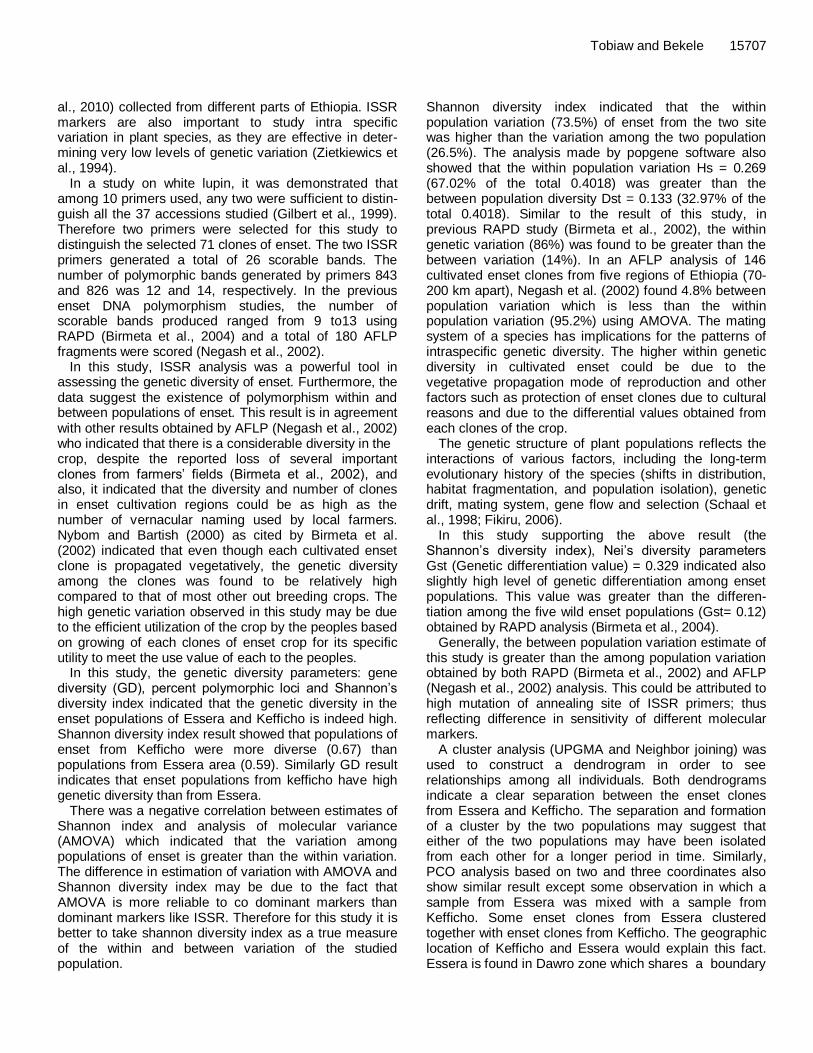
22.6% and 13.1, respectively (Figure 6) were used to show the grouping of individuals using three coordinates. The two populations observed to form two separate clusters and another third cluster of individuals from both
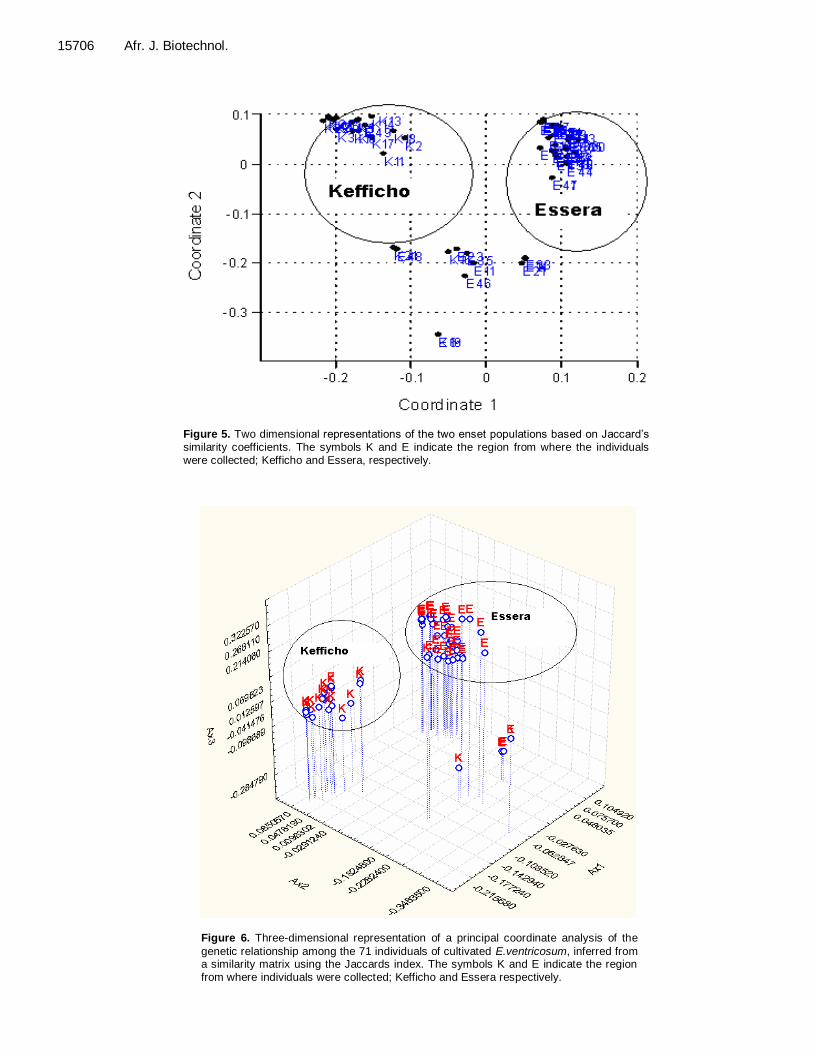
populations. The first two coordinates of the PCO was used to represent the two population of enset in two dimensions (Figure 5) and similar result was observed like that of three dimensional representations.
15704 Afr. J. Biotechnol.
Table 7. Analysis of molecular variance (AMOVA) of enset populations of Essera and Kefficho
Source of variation d.f Sum of squares
Variance component
Percentage of variation
Fixation
index
Between populations 1 122.479 4.51 59.119 0.591
Within population 69 189.192 3.12176 40.881
Total 70 311.671 7.6362
0.1
K19K6E46E16E11E1E37E10E26E34E6E27E28E36E30E29E13E4E31E22E32E25E7E15E20E43E23E35E9E44E33E40E14E2E17E3E8E18E42E19E39E45E21E12E24E38E5E41E47K16K2K22K20K4K7K8K14K15K5K12K13K10K3E49K1K9K17K18E48K11K21
Essera
population
Kefficho
population
Figure 3. Dendrogram for the 71 individuals of the two enset populations (namely K, representing Kefficho and E, representing Es sera)
obtained using the unweighted pair group method with arithmetic average (UPGMA) of the 26 PCR bands amplified (presence absence data) by two (834 and 826) primers. The UPGMA algorithm is based on Jaccard‟s coefficients obtained after pair wise compar ison of the presence-absence fingerprint.
Tobiaw and Bekele 15705
0.1
E32E22
E31E25
E19E9E39
E40E14E2
E44E45
E17E3E8
E18E42
E12E24
E21E33
K16K19K6E16E46
E41E47
E38E5
E7E15E20
K13K3
K22K20K4
K7K8E49
K12K17
K10K18
K9K1
K14K15K5
K2E48
K11K21
E11E43
E23E35
E1E34E6E27E28
E37E10
E26E36
E29E30
E13E4
Figure 4. Neighbor-joining analysis of 71 individuals based on 26 PCR bands amplified by two di-nucleotide
(834 and 826) primers. The neighbor joining algorithm is based on Jaccard‟s coefficients obtained after pair wise comparison of the presence-absence fingerprint.
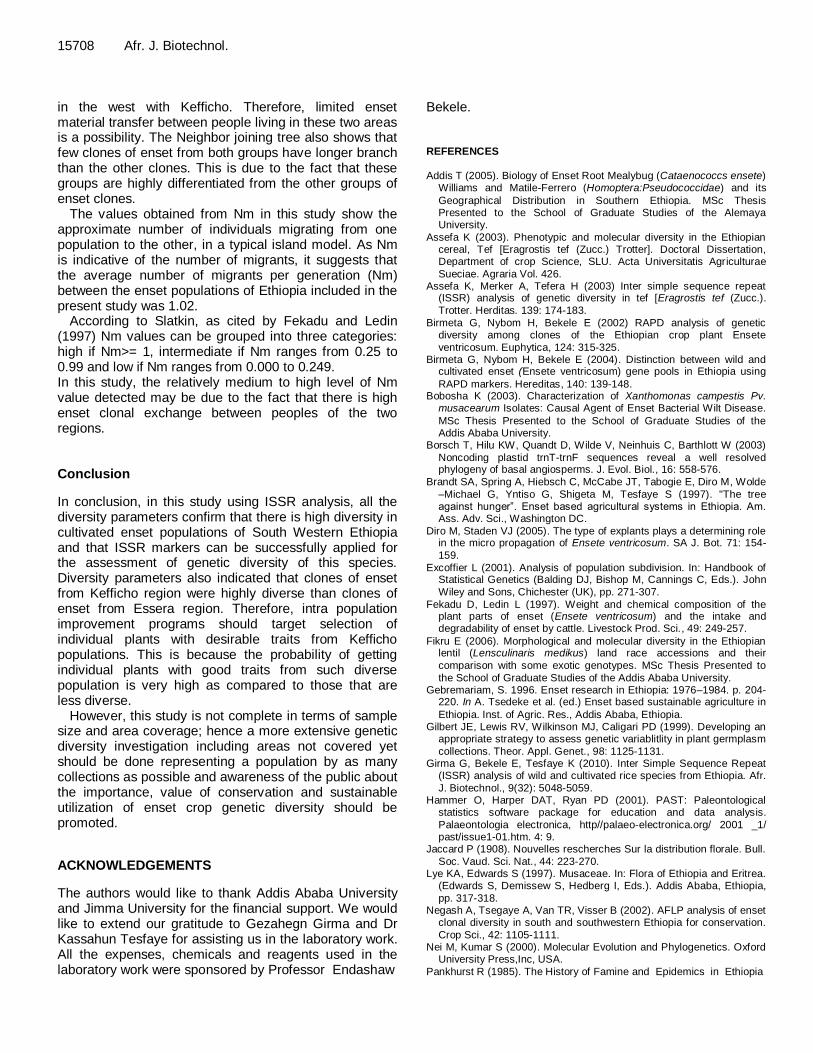
DISCUSSION In this study, the extent of genetic diversity in cultivated enset obtained from two sites in the southwestern part of
Ethiopia was determined using ISSR marker. The PCR-based technique, ISSR has been found immensely useful in detecting genetic diversity of coffee (Tesfaye, 2006), Tef (Assefa, 2003) lentil (Fikru, 2006), and rice (Girma et
Essera
15706 Afr. J. Biotechnol.
Figure 5. Two dimensional representations of the two enset populations based on Jaccard‟s similarity coefficients. The symbols K and E indicate the region from where the individuals were collected; Kefficho and Essera, respectively.
Figure 6. Three-dimensional representation of a principal coordinate analysis of the
genetic relationship among the 71 individuals of cultivated E.ventricosum, inferred from a similarity matrix using the Jaccards index. The symbols K and E indicate the region from where individuals were collected; Kefficho and Essera respectively.
al., 2010) collected from different parts of Ethiopia. ISSR markers are also important to study intra specific variation in plant species, as they are effective in deter-mining very low levels of genetic variation (Zietkiewics et al., 1994).
In a study on white lupin, it was demonstrated that among 10 primers used, any two were sufficient to distin-guish all the 37 accessions studied (Gilbert et al., 1999). Therefore two primers were selected for this study to distinguish the selected 71 clones of enset. The two ISSR primers generated a total of 26 scorable bands. The number of polymorphic bands generated by primers 843 and 826 was 12 and 14, respectively. In the previous enset DNA polymorphism studies, the number of scorable bands produced ranged from 9 to13 using RAPD (Birmeta et al., 2004) and a total of 180 AFLP fragments were scored (Negash et al., 2002).
In this study, ISSR analysis was a powerful tool in assessing the genetic diversity of enset. Furthermore, the data suggest the existence of polymorphism within and between populations of enset. This result is in agreement with other results obtained by AFLP (Negash et al., 2002) who indicated that there is a considerable diversity in the crop, despite the reported loss of several important clones from farmers‟ fields (Birmeta et al., 2002), and also, it indicated that the diversity and number of clones in enset cultivation regions could be as high as the number of vernacular naming used by local farmers. Nybom and Bartish (2000) as cited by Birmeta et al. (2002) indicated that even though each cultivated enset clone is propagated vegetatively, the genetic diversity among the clones was found to be relatively high compared to that of most other out breeding crops. The high genetic variation observed in this study may be due to the efficient utilization of the crop by the peoples based on growing of each clones of enset crop for its specific utility to meet the use value of each to the peoples.
In this study, the genetic diversity parameters: gene diversity (GD), percent polymorphic loci and Shannon‟s diversity index indicated that the genetic diversity in the enset populations of Essera and Kefficho is indeed high. Shannon diversity index result showed that populations of enset from Kefficho were more diverse (0.67) than populations from Essera area (0.59). Similarly GD result indicates that enset populations from kefficho have high genetic diversity than from Essera.
There was a negative correlation between estimates of Shannon index and analysis of molecular variance (AMOVA) which indicated that the variation among populations of enset is greater than the within variation. The difference in estimation of variation with AMOVA and Shannon diversity index may be due to the fact that AMOVA is more reliable to co dominant markers than dominant markers like ISSR. Therefore for this study it is better to take shannon diversity index as a true measure of the within and between variation of the studied population.
Tobiaw and Bekele 15707 Shannon diversity index indicated that the within population variation (73.5%) of enset from the two site was higher than the variation among the two population (26.5%). The analysis made by popgene software also showed that the within population variation Hs = 0.269 (67.02% of the total 0.4018) was greater than the between population diversity Dst = 0.133 (32.97% of the total 0.4018). Similar to the result of this study, in previous RAPD study (Birmeta et al., 2002), the within genetic variation (86%) was found to be greater than the between variation (14%). In an AFLP analysis of 146 cultivated enset clones from five regions of Ethiopia (70-200 km apart), Negash et al. (2002) found 4.8% between population variation which is less than the within population variation (95.2%) using AMOVA. The mating system of a species has implications for the patterns of intraspecific genetic diversity. The higher within genetic diversity in cultivated enset could be due to the vegetative propagation mode of reproduction and other factors such as protection of enset clones due to cultural reasons and due to the differential values obtained from each clones of the crop.
The genetic structure of plant populations reflects the interactions of various factors, including the long-term evolutionary history of the species (shifts in distribution, habitat fragmentation, and population isolation), genetic drift, mating system, gene flow and selection (Schaal et al., 1998; Fikiru, 2006).
In this study supporting the above result (the Shannon‟s diversity index), Nei‟s diversity parameters Gst (Genetic differentiation value) = 0.329 indicated also slightly high level of genetic differentiation among enset populations. This value was greater than the differen-tiation among the five wild enset populations (Gst= 0.12) obtained by RAPD analysis (Birmeta et al., 2004).
Generally, the between population variation estimate of this study is greater than the among population variation obtained by both RAPD (Birmeta et al., 2002) and AFLP (Negash et al., 2002) analysis. This could be attributed to high mutation of annealing site of ISSR primers; thus reflecting difference in sensitivity of different molecular markers.
A cluster analysis (UPGMA and Neighbor joining) was used to construct a dendrogram in order to see relationships among all individuals. Both dendrograms indicate a clear separation between the enset clones from Essera and Kefficho. The separation and formation of a cluster by the two populations may suggest that either of the two populations may have been isolated from each other for a longer period in time. Similarly, PCO analysis based on two and three coordinates also show similar result except some observation in which a sample from Essera was mixed with a sample from Kefficho. Some enset clones from Essera clustered together with enset clones from Kefficho. The geographic location of Kefficho and Essera would explain this fact. Essera is found in Dawro zone which shares a boundary
15708 Afr. J. Biotechnol. in the west with Kefficho. Therefore, limited enset material transfer between people living in these two areas is a possibility. The Neighbor joining tree also shows that few clones of enset from both groups have longer branch than the other clones. This is due to the fact that these groups are highly differentiated from the other groups of enset clones.
The values obtained from Nm in this study show the approximate number of individuals migrating from one population to the other, in a typical island model. As Nm is indicative of the number of migrants, it suggests that the average number of migrants per generation (Nm) between the enset populations of Ethiopia included in the present study was 1.02.
According to Slatkin, as cited by Fekadu and Ledin (1997) Nm values can be grouped into three categories: high if Nm>= 1, intermediate if Nm ranges from 0.25 to 0.99 and low if Nm ranges from 0.000 to 0.249. In this study, the relatively medium to high level of Nm value detected may be due to the fact that there is high enset clonal exchange between peoples of the two regions. Conclusion
In conclusion, in this study using ISSR analysis, all the diversity parameters confirm that there is high diversity in cultivated enset populations of South Western Ethiopia and that ISSR markers can be successfully applied for the assessment of genetic diversity of this species. Diversity parameters also indicated that clones of enset from Kefficho region were highly diverse than clones of enset from Essera region. Therefore, intra population improvement programs should target selection of individual plants with desirable traits from Kefficho populations. This is because the probability of getting individual plants with good traits from such diverse population is very high as compared to those that are less diverse.
However, this study is not complete in terms of sample size and area coverage; hence a more extensive genetic diversity investigation including areas not covered yet should be done representing a population by as many collections as possible and awareness of the public about the importance, value of conservation and sustainable utilization of enset crop genetic diversity should be promoted.
ACKNOWLEDGEMENTS
The authors would like to thank Addis Ababa University and Jimma University for the financial support. We would like to extend our gratitude to Gezahegn Girma and Dr Kassahun Tesfaye for assisting us in the laboratory work. All the expenses, chemicals and reagents used in the laboratory work were sponsored by Professor Endashaw
Bekele. REFERENCES
Addis T (2005). Biology of Enset Root Mealybug (Cataenococcs ensete)
Williams and Matile-Ferrero (Homoptera:Pseudococcidae) and its
Geographical Distribution in Southern Ethiopia. MSc Thesis Presented to the School of Graduate Studies of the Alemaya University.
Assefa K (2003). Phenotypic and molecular diversity in the Ethiopian cereal, Tef [Eragrostis tef (Zucc.) Trotter]. Doctoral Dissertation, Department of crop Science, SLU. Acta Universitatis Agriculturae
Sueciae. Agraria Vol. 426. Assefa K, Merker A, Tefera H (2003) Inter simple sequence repeat
(ISSR) analysis of genetic diversity in tef [Eragrostis tef (Zucc.).
Trotter. Herditas. 139: 174-183.
Birmeta G, Nybom H, Bekele E (2002) RAPD analysis of genetic diversity among clones of the Ethiopian crop plant Ensete
ventricosum. Euphytica, 124: 315-325. Birmeta G, Nybom H, Bekele E (2004). Distinction between wild and
cultivated enset (Ensete ventricosum) gene pools in Ethiopia using
RAPD markers. Hereditas, 140: 139-148. Bobosha K (2003). Characterization of Xanthomonas campestis Pv.
musacearum Isolates: Causal Agent of Enset Bacterial Wilt Disease.
MSc Thesis Presented to the School of Graduate Studies of the Addis Ababa University.
Borsch T, Hilu KW, Quandt D, Wilde V, Neinhuis C, Barthlott W (2003)
Noncoding plastid trnT-trnF sequences reveal a well resolved phylogeny of basal angiosperms. J. Evol. Biol., 16: 558-576.
Brandt SA, Spring A, Hiebsch C, McCabe JT, Tabogie E, Diro M, Wolde
–Michael G, Yntiso G, Shigeta M, Tesfaye S (1997). "The tree against hunger”. Enset based agricultural systems in Ethiopia. Am. Ass. Adv. Sci., Washington DC.
Diro M, Staden VJ (2005). The type of explants plays a determining role in the micro propagation of Ensete ventricosum. SA J. Bot. 71: 154-
159.
Excoffier L (2001). Analysis of population subdivision. In: Handbook of Statistical Genetics (Balding DJ, Bishop M, Cannings C, Eds.). John
Wiley and Sons, Chichester (UK), pp. 271-307.
Fekadu D, Ledin L (1997). Weight and chemical composition of the plant parts of enset (Ensete ventricosum) and the intake and degradability of enset by cattle. Livestock Prod. Sci., 49: 249-257.
Fikru E (2006). Morphological and molecular diversity in the Ethiopian lentil (Lensculinaris medikus) land race accessions and their
comparison with some exotic genotypes. MSc Thesis Presented to
the School of Graduate Studies of the Addis Ababa University. Gebremariam, S. 1996. Enset research in Ethiopia: 1976–1984. p. 204-
220. In A. Tsedeke et al. (ed.) Enset based sustainable agriculture in
Ethiopia. Inst. of Agric. Res., Addis Ababa, Ethiopia. Gilbert JE, Lewis RV, Wilkinson MJ, Caligari PD (1999). Developing an
appropriate strategy to assess genetic variablitlity in plant germplasm
collections. Theor. Appl. Genet., 98: 1125-1131. Girma G, Bekele E, Tesfaye K (2010). Inter Simple Sequence Repeat
(ISSR) analysis of wild and cultivated rice species from Ethiopia. Afr.
J. Biotechnol., 9(32): 5048-5059. Hammer O, Harper DAT, Ryan PD (2001). PAST: Paleontological
statistics software package for education and data analysis.
Palaeontologia electronica, http//palaeo-electronica.org/ 2001 _1/ past/issue1-01.htm. 4: 9.
Jaccard P (1908). Nouvelles rescherches Sur la distribution florale. Bull.
Soc. Vaud. Sci. Nat., 44: 223-270. Lye KA, Edwards S (1997). Musaceae. In: Flora of Ethiopia and Eritrea.
(Edwards S, Demissew S, Hedberg I, Eds.). Addis Ababa, Ethiopia,
pp. 317-318. Negash A, Tsegaye A, Van TR, Visser B (2002). AFLP analysis of enset
clonal diversity in south and southwestern Ethiopia for conservation.
Crop Sci., 42: 1105-1111. Nei M, Kumar S (2000). Molecular Evolution and Phylogenetics. Oxford
University Press,Inc, USA.
Pankhurst R (1985). The History of Famine and Epidemics in Ethiopia
Prior to the Twentieth Century. Relief and Rehabilitation Commission, Addis Ababa, Ethiopia.
Pavlicek A, Hrda S, Flegr J (1999). Free tree free ware program for
construction of phylogenetic trees on the basis of distance data and bootstrap/Jack Knife analysis of the tree robustness. Application in the RAPD analysis of genus Frenkelia. Folia Biologiica, 45: 97-99.
Rohlf FJ (1997). NTSYS-pc. Numerical taxonomy and multivariate analysis system. v. 2.02. Exeter Software, Setauket, NY.
Rohlf FJ (2000). NTSYS-pc. Numerical taxonomy and multivariate
analysis system, version 2.02. Exeter software. New York. Saitou N, Nei M (1987). The neighbor joining method: a new method for
reconstructing phylogenetic trees. Mol. Biol. Evol. 4: 406-425.
Shank R (1994). The Enset Culture, Technical Report on Enset or the False Banana. United Nations-Emergencies Unit for Ethiopia.
Studier JA, Keppler KJ (1988) A note on the neighbor joining algorithm
of Saitou and Nei. Mol. Biol. Evol. 5: 729-731.
Tobiaw and Bekele 15709 Tesfaye K (2006). Genetic diversity of wild Cofea arabica populations in
Ethiopia as a contribution to conservation and use planning. Ecology and Development series. Doctoral Thesis. University of Bonn,
Germany, No. 44. Yeh FC, Yang RC, Boyle T (1999). Population genetic analysis of
codominant markers and qualitative traits. Belgian J. Bot., 129: p.
157. Zietkiewicz E, Rafalski A, Labuda D (1994) Genomic fingerprinting by
simple sequence repeat anchored polymerase chain reaction
amplification. Genomics, 20: 176-183.