Embed Size (px)
Citation preview

ANALYSIS OF GENETIC MARKERS ASSOCIATED
WITH KIDNEY TRANSPLANTATION OUTCOME
This thesis is submitted to the Sindh Institute of Medical
Sciences for the degree of Doctor of Philosophy
By
Ali Raza
Centre of Human Genetics and Molecular Medicine,
Sindh Institute of Medical Sciences (SIMS), Sindh Institute of Urology and Transplantation (SIUT),
Karachi, Pakistan.
2015

viii
Summary:
Allograft rejection remains a major hurdle in successful transplantation
despite improved immunosuppressive drugs and clinical care. The molecular
changes in the renal allograft that lead to graft rejection need to be
investigated. In the present work, polymorphisms in chemokine receptors and
urinary chemokine levels were investigated for association with rejection. This
study includes; (a) gene polymorphisms of chemokine receptors of CCR2 and
CCR5 (CCR2V64I and CCR5-59029G>A and CCR5Δ32), (b) urinary levels
of interferon induced protein-10 (IP-10), (c) urinary levels of monokine
induced by interferon-gamma (MIG) and (d) urinary levels of monocyte
chemotactic protein-1 (MCP-1). This is the first study on chemokine receptor
polymorphisms and the urinary chemokine levels (IP-10, MIG and MCP-1) in
cohorts of Pakistani renal transplant patients. The project was approved by the
Institutional Ethical Review Committee and informed consent was taken from
all the participants.
Briefly, the gene polymorphisms CCR2V64I, CCR5-59029G>A and
CCR5Δ32 were investigated in 606 renal transplant patients and their donors
by amplified fragments length polymorphisms (RFLP). The results showed
that the G/G genotype of CCR2V64I was associated with a high frequency of
allograft rejection (P=0.009). The Kaplan-Meier curve also indicated a
significant reduction in the overall time to rejection-free allograft survival for
patients with the G/G genotype of CCR2V64I as compared to the A/A or G/A
genotype (59.2±1.4 vs. 68±2.6 weeks, P=0.008) showing that individuals with
the A allele, either in the homozygous or heterozygous state, have a greater
chance to accept the graft.

ix
Human IP-10 is classified as the CXC chemokine sub-family. A total
of 206 urine samples of (a) rejection (n=96), (b) non-rejection (n=22) and (c)
controls (n=88) were quantified for IP-10 by enzyme-linked immunosorbent
assay (ELISA) for association with rejection. The results showed statistically
significant differences in the urinary IP-10 levels between the rejection vs.
non-rejection groups (P=0.004). The Receiver operating characteristic curve
(ROC) of IP-10 showed area under the curve (AUC) of 0.70±0.06 with 72%
sensitivity and 64% specificity, at a cut-off value of 27pg/ml.
Human MIG also belongs to the CXC chemokine sub-family. A total
of 266 urine samples from (a) rejection (n=108), (b) non-rejection (n=70), (c)
stable grafts (n=42) and (d) control groups (n=46) were quantified for MIG
and analyzed for association with rejection. The results indicated that although
urinary MIG levels were higher in patients with rejection the association was
not statistically significant (P>0.05). The ROC curve also showed AUC of
0.54±0.04 with low sensitivity (46%) and specificity (55%) at cut-off value of
6pg/ml.
Human MCP-1 belongs to the CC chemokine sub-family. A total of
409 urine samples of (a) rejection (n=165), (b) non-rejection (n=93), (c) stable
grafts (n=42) and (d) controls (n=109) were quantified for urinary level of
MCP-1 by ELISA. The results showed that MCP-1 levels were different
between the rejection and other groups (P<0.05). The ROC curve illustrated
the area under curve of 0.83±0.04 with a sensitivity and specificity of 84% and
74% respectively, at a cut-off value of 214pg/ml.
In conclusion, this work shows the usefulness of chemokine receptor
CCR2V64I polymorphism as a marker for the increased possibility of an

x
immune response against an allograft. Urinary levels of MCP-1, the ligand of
CCR2, and IP-10 were increased and show good correlation with rejection.
While urinary MIG did not show any association with rejection. These
findings may help in developing new therapeutic strategies in renal
transplantation based on patient genetic makeup. Additionally, non-invasive
screening tests based on urinary levels of IP-10 and MCP-1 would help in the
assessment of the immune status of the graft.

1
1. Introduction

2
1.1. Renal Diseases:
The global burden of renal diseases and urinary tract abnormalities is
approximately 8.3 x 10⁵ and 1.8 x 10⁷ per annum respectively (Dirks et al.,
2006). Renal diseases are ranked 12th among the causes of mortality in both
males and females (Dirks et al., 2006). They are characterized by reduced
glomerular filtration rate (GFR: less than 60 ml/min./1.73m2) with or without
proteinuria, abnormality in the urine sediments, abnormality in urine and
blood chemistry measurements (creatinine, urea, electrolytes, proteins etc.)
and abnormal findings in imaging and renal histology (Levey et al., 2003).
The kidneys are under constant threat by environmental factors (drugs,
toxins, microbes), genetic factors (polycystic kidneys, alports syndrome),
congenital factors (reduced number of nephrons), dietary habits (low water in-
take, high salt) and lifestyle (smoking, alcoholism) (Lei et al., 1998; Orth et
al., 1998; Iseki, 2005; Song et al., 2009). These factors may culminate in
damage to kidney structure and function.
Renal diseases are also characterized as either acute (sudden onset) or
chronic. Chronic kidney disease (CKD) is further classified into 5 stages
depending on GFR and other associated clinical features. Ultimately, these
conditions lead to a complete shutdown of renal function and are termed “end
stage renal disease” (ESRD).
1.2. Renal Transplantation:
Renal transplantation (RT) is a therapeutic option for ESRD patients,
envisioned nearly half a century ago. In its initial stages, it was considered a
risky therapy. However, the subsequent surgical and technological

3
advancements, based on increased knowledge underlying graft biology, turned
RT into a viable option. The first successful renal transplantation was
performed in Boston, USA, in 1954, when a kidney was transplanted between
identical twins (Murray et al., 2011). This opened a new era for RT in the
treatment of ESRD patients.
The success of RT has improved significantly with the identification of
immunological factors, which are major contributors in graft tolerance and
rejection. These immunological factors include human leukocyte antigens
(HLAs), ABO blood compatibility, immune cells (antigen presenting cells, T
and B cells), immune regulatory molecules (cytokines, chemokines) etc.
Additionally, discoveries of therapeutic agents/drugs against identified
immunological factors such as immunosuppressive drugs (Cyclosporine-A,
Tacrolimus, Azathioprine, Prednisolone), anti-interleukin-2 (IL-2; responsible
for activation/proliferation of T-cells and B-cells) and antithymocyte globulin
(ATG) to prevent graft rejection have revolutionized transplantation (Chinen
and Buckley, 2010). As a result of these discoveries, the patient survival rate
has increased by 90% and graft-survival by 80% (Clayton et al., 2010).
Long-term renal allograft-survival with preserved renal function is the
ultimate goal of transplantation. The main hurdles that impede long-term
graft-survival include genetic differences between the donor and recipient and
factors other than donor-recipient mismatch (drug toxicity, malignancies,
infections etc).
Genetic mismatches between donors and recipients particularly at
immune regulatory genes such as human leukocyte antigens (HLA-I and –II
loci) are key immune factors in graft rejection. The genetic differences

4
between donor and recipient may be the result of polymorphisms, mutations or
epigenetic variation that lead to activation of the immune system.
Furthermore, genetic variations in the immunosuppressive drug-metabolizing
genes of the recipient produce different pharmacological responses. Hence,
genetic variations at both immune regulatory genes and drug metabolizing
genes, significantly contribute in immune regulation.
Factors such as drug toxicity, infections (BKV, CMV), recurrence of
primary renal disease [(focal segmental glomerulosclerosis
(FSGS), immunoglobulin-A (IgA) nephropathy; membrano-proliferative
glomerulonephritis (MPGN) type-I and -II etc.)], and post-transplant
malignancies, all affect renal dysfunction and activate immune response. Thus,
these factors have a major role in transplant outcome (rejection/graft loss).
Renal transplant patients need continuous monitoring of their graft
function as it is at risk of numerous adverse conditions associated with
immunological and non-immunological factors. Life-long monitoring of graft
functioning is necessary for successful transplantation. However, the initial
post–transplant duration (3 months) is the most important phase in transplant
outcome (Magee and Pascual, 2004). During this phase, the risk of rejection,
drug toxicity, infections and surgical complications is quite high. Therefore,
optimum immunosuppressive drug levels are essential to suppress the immune
system against the allograft while preventing infections and drug toxicity.
Currently, graft function is monitored by biochemical tests (creatinine,
urea, protein), imaging techniques and histopathological features associated
with the clinical presentation. However, any deranged levels of creatinine,
urea and/or presence of urinary protein (albumin) are considered as indicators

5
(markers) of renal allograft dysfunction, especially creatinine. Creatinine is a
good renal-function marker but it has the disadvantage of being a late indicator
of renal injury, as allograft injury/damage may already have been initiated.
Another method for assessment of graft dysfunction is graft biopsy, a gold
standard technique. It is performed to determine the causes of unexplained
renal allograft dysfunction. The current therapeutic strategies depend on the
results of renal graft pathology. However, graft biopsy is an invasive
technique that restricts its usage in graft assessment.
To monitor the renal allograft functioning and immune status, there is a
need of marker(s) for an early and accurate diagnosis of rejection using non-
invasive methods. Currently urine and blood samples are being investigated
for the identification of markers for rejection and tolerance (Kurian et al.,
2009; Alachkar, 2012).
Advanced molecular technology (microarray) has identified various
markers for different histopathological conditions such as acute cellular
rejection, interstitial fibrosis and tubular atrophy and tolerance. It has also
helped in the identification of genes involved in complement the system and
fibrosis; cell signaling, stress and up-regulation of the immune system
(Famulski et al., 2006; Scherer et al., 2009; Nakorchevsky et al., 2010). The
strategies of integrating histopathological findings with molecular data (omics;
genomic/epigenomics, transcriptomics, proteomics and metabolomics) have
improved prediction of rejection outcome (Reeve et al., 2009; Sis et al., 2010;
de Freitas et al., 2012). In addition, new quantitative methods based on
microarray for assessment of rejection in renal transplantation have also
showed significant correlation (Mueller et al., 2007; Halloran et al., 2010).

6
Despite these advancements, findings are still inconclusive about the
immunological quiescence that may support transplantation tolerance or
rejection. The prediction of long-term outcomes in RT is hindered as no robust
marker(s) is/are available to diagnose or predict rejection and to monitor the
inflammatory status of recipients against transplanted organ (Naesens and
Sarwal, 2010). The search for immunological and non-immunological players,
their genes and functional polymorphisms that result in variations in protein
expressions and regulation of molecular pathways are currently being
investigated to be used as rejection markers as well as for therapeutic
purposes.
The future perspect for RT is to provide better health with optimum
graft survival. The goals of personalized medicine in RT include the longevity
of the graft with minimal to no requirement of immunosuppressive drugs and
the detection of early graft injury using noninvasive methods so as to render
the invasive techniques such as renal biopsies obsolete. Thus, the
identification of non-invasive biomarker(s), their role in prognosis of graft
functioning and graft outcome is a major research area in the molecular
biology of kidney transplantation.
1.3. Chemokines and Chemokines Receptors:
In RT, chemokines and chemokine receptors play a central role in host
immune regulation against the allograft. Chemokines activate pro-
inflammatory cells and facilitate cell migration as well as differentiation and
activation of cytotoxic cells particularly in renal injury and rejection
mechanism. An increased level of chemokines at an early phase of

7
injury/rejection and their quantification by using non-invasive sampling (blood
and urine) makes them ideal candidates to be used as biomarker for graft
function as well as monitoring immune response. Currently, chemokines and
chemokine receptors are being investigated as potential diagnostic, prognostic
and therapeutic markers in renal disease and RT (Krensky and Clayberger,
2011; Sayyed et al., 2011; Urushihara et al., 2011).
The human chemokine family consists of 50 chemoattractant cytokines
and at least 18 chemokine receptors. Chemokines are small signaling protein
molecules (60-100 amino acids) having molecular weights of 7-12 kilodalton
(kDa). These chemotactic proteins are produced constitutively in the non-
inflammatory state or may be induced in response to inflammatory signals.
The main functions of chemokines are to maintain tissue homeostasis, cellular
circulation and regulate immune system. They exert their biological activity
by interacting with specific chemokine receptors; G-protein coupled receptors
(GPCRs) on immune cells (Vassilatis et al., 2003).
The human genome project has identified, two major chemokine gene
clusters on chromosomal regions 4q13 and 17q12. Similarly, chemokine
receptor genes have also been identified as clusters on chromosome 3.
1.3.1. Chemokines Structure:
All chemokines are structurally similar. This structural homology is
mainly due to similar amino acid sequence among the chemokine families.
The chemokine structure consists of an amino terminus, 3 beta-pleated sheets
(β1-3), mucin stalk and an α-helix carboxyl terminus (Figure 1.1).
Chemokines possess 2 main regions essential for proper structural folding,

8
interaction and activation of receptors. These include (a) a loop with the
peptide back bone stretching between 2 and 3 cysteine residues (b) amino
terminus (Baggiolini, 1998).
The structural conformation of chemokines is dependent on disulfide
bonds connecting conserved cysteine amino acids. These disulfide bonds are
formed between the first and third and the second and fourth conserved
cysteine residues. Chemokines are classified into four sub-families based on
the presence of these conserved cysteine amino acids at the amino terminal of
the primary protein structure. These chemokine families are named as CC,
CXC, CX3C and XC (Figure 1.2).
The CC chemokine family contains two conserved cysteine amino
acids adjacent to each other. However, CXC and CX3C chemokines family
contains a single and three amino acids respectively between two cysteine
amino acids. The XC chemokine contains a single cysteine amino acid at the
amino terminal.
1.3.2. Chemokines Function:
Functionally, chemokines are classified as homeostatic and
inflammatory. Homeostatic chemokines are involved in tissue homeostasis
and cellular recirculation under non-inflammatory conditions. So far, they are
limited in number. Most of the chemokines identified are inflammatory and
participate in immune regulation. Interestingly, the biological activity of both
types of chemokines is regulated by specific GPCRs.

9
Figure 1.1: The genomic and structural organization of chemokine sub-
families. (Adapted from: Rollins, 1997)
Figure 1.2: Structure of chemokines sub-families: CC, CXC, CX3C and XC.
(Adapted from: Townson and Liptak, 2003).

10
The chemokine families are encoded by various chromosomal regions.
The majority of chemokine ligands (L), encoded by specific chromosomal
loci, are mentioned in Table 1.1. These chemokines ligands interact with
corresponding signaling chemokine receptors present on specific immune
cells. For example, the CCL chemokine ligands, encoded by 17q11.2 mainly
act on monocytes; CXCL chemokine ligands located on 4q12-q13 act on
neutrophils, CX3CL chemokine ligands coded by 16q13 act on monocytes
and T-cells and the CL chemokine with T-cells (Locati et al., 2005).
Table 1.1: Chemokine family, chromosomal region and the target
immune cells
Chemokine family
Chromosomal region
Targeted immune cells
CCL 17q11.2 Monocytes, Macrophages, T-cells, Basophiles
CXCL 4q12-q13 4q21.21
Neutrophils, B-cells, NK cells, T-cells
CL 1q23 T-cells, NK cells
CX3CL 16q13 Monocytes, T-cells, NK cells
1.3.3. Chemokine Receptors:
All chemokine receptors are seven transmembrane proteins, associated
with G-protein signaling molecules. They are found on many immune cells
such as leukocytes, monocytes/macrophages and T-cells. All chemokine
ligands bind specifically with GPCRs. So far, 18 chemokine receptors based

11
on G-protein dependent chemotactic activity have been identified (Zlotnik and
Yoshie, 2012).
Based on chemokine ligands’ interaction with receptors, chemokine
receptors are named as CCR, CXCR, CX3CR and XCR. The CCR (CCR1 to
10) and CXCR (CXCR1 to 6) receptor families are more frequent for CC and
CXC ligands where as a single receptor has been identified for the XCL
(XCR1) and CX3C (CX3CR1) families (Figure 1.3).
The structural conformation of chemokine receptors is very important
for their biological activity. Chemokine receptors consist of an amino terminal
domain, conserved regions/domains (aspartic acid residues; Thr-X-Pro, TXP;
Asp-Arg-Tyr, DRY) and a carboxyl terminal. The amino terminal is further
categorized as Glutamic acid-Leucine-Arginine (ELR) positive domain. These
chemokine receptors’ domains are essential for specific binding with
chemokine ligands (Figure 1.4).
A single chemokine can bind with multiple chemokine receptors
(Nomiyama et al., 2011). Similarly, chemokine receptors also bind with
multiple chemokine ligands to regulate specific immune cells (Figure 1.3). For
example, CCL chemokine attracts monocytes via CCR1, CCR2 and CCR5;
CXCL chemokine attracts neutrophils via CXCR1 and CXCR2, and CXCL9
and CXCL10 attract T-cells and NK cells by CXCR3. This redundancy
provides the molecular basis for a robust system which achieves the desired
outcome with alternative pathways (Mantovani et al., 1999).This explains why
immune cells express specific receptors on their surface, for example
neutrophils possess CXCR receptors and T-cells express both CXCR and CCR
to regulate their biological activity.

12
Figure 1.3: Chemokines family ligands and chemokine receptors (Rostène et
al., 2007).
Figure 1.4: Chemokine ligand and chemokine receptors interaction with
a) ELR positive and b) ELR negative domains (Mantovani et al., 2006).

13
Chemokine expression is regulated at the transcriptional and
translational levels (Schlöndorff et al., 1997). Similarly, the expression of
chemokine receptors is also regulated at the transcriptional and translational
levels. The expression of chemokine receptors on immune cells correlates with
the response to chemokines. For example; the expression level of chemokine
receptors CCR1 and CCR2 in circulating T-cells is regulated by IL-2
cytokines. IL-2 strongly up-regulates the expression of CCR1 and CCR2 on T-
cells and subsequently triggers recruitment into sites of immune and
inflammation reactions (Loetscher et al., 1996). This expression regulation
provides a control mechanism for the migration of leukocytes and other
immune cells.
Chemokine ligand-receptor interaction triggers activation signals
which cause dissociation of G-protein from receptor and activates a cascade of
signaling events in the cytoplasm of the cells. These signals ultimately result
in physiological processes such as migration, trafficking, differentiation and
degranulation of the cells.
1.3.4. Chemokines and Chemokine Receptors in Immuno-inflammatory
Mechanism during Renal Injury:
Inflammatory cells play a crucial role in renal injury as well as
allograft rejection. Renal injury could be the result of ischemia, toxins,
immunological factors and surgical procedures. These renal injuries generate
pro-inflammatory and inflammatory signals through chemokines, cytokines,
growth factors etc. from renal cells (epithelial cells, endothelial cells,

14
mesangial cells, interstitial cells) to attract neutrophils, monocytes, NK cells
and T-cells to the site of kidney injury.
Renal injury affects renal function significantly. The severity of renal
injury also correlates with renal functioning. During injury, the expression
levels of chemokines and corresponding receptors, and the number of
infiltrating immune cells are increased which also correlate with renal injury
(Girlanda et al., 2008).
Chemokines contribute in three major aspects of graft biology a)
leukocytes recruitment in ischemia – reperfusion injury (IRI), b) mediation of
host response to infections and c) control of inflammatory components of
acute or chronic rejection (Gerard and Rollins 2001; Hu and Knechtle, 2006).
Chemokines, with their receptors, play a major role in leukocyte migration
into the renal allograft; facilitate migration of dendritic cells and T-cells
between lymph nodes and transplanted organ.
The interaction of chemokines and chemokine receptors ultimately
result either in resolution or progression of renal injury (Anders et al., 2003).
Rapid down-modulation of chemokines signals supports resolution of acute
inflammation. However, repeated episodes of renal injury result in continuous
chemokine secretion and leukocyte influx into the glomeruli or interstitial
spaces. These infiltrating leukocytes further contribute to injury by releasing
inflammatory and profibrotic factors. These signals significantly contribute to
renal rejection and graft dysfunction.

15
1.3.5. Chemokines and Chemokine Receptors in Immuno-inflammatory
Mechanism during Renal Allograft Rejection:
Renal graft rejection is a highly complex immunological process that
results from the interaction between the graft and the host immune response.
This immunological response is suppressed by immunosuppressive drugs.
However, drug over-dosing (drug toxicity) is one of the main causes of renal
injury. Additionally, drug over-dosing suppresses the immune system which
may also increase the chance of renal infection (pyelonephritis). This may
further exacerbate renal injury and could activate the immune system involve
in the rejection mechanism. Rejection is characterized as a major
immunological cause of renal injury which leads to fibrosis or graft rejection.
Initially, surgical procedures of graft implantation cause trauma and
ischemic-reperfusion related injuries result in the production of pro-
inflammatory cytokines and chemokines and activation of vascular
endothelium. The pro-inflammatory stimuli by cytokines (Interferon gamma,
INF-γ and Tumor necrosis factor, TNF) rapidly induce other cytokines and
chemokines (CCL2/MCP-1, CXCL8/IL-8, CXCL10/interferon gamma
inducible protein, IP-10) within a few hours of renal injury and
CCL5/RANTES after 12-48 hours (Segerer et al., 2000; Song et al., 2000;
Fang et al., 2012). Additionally, growth factors, immune complexes and
complement activation factors also induce chemokine production. The pro-
inflammatory signals also activate vascular endothelium and tubular
epithelium of the renal allograft (Thorburn et al., 2009). The activation
includes up-regulation of HLA, co-stimulating molecules and adhesion
molecules, and the release of inflammatory chemokines (CXC and CC

16
chemokines). During inflammation, the expression of chemokines (CCL2,
CXCL1, CXCL2) on epithelium and corresponding chemokine receptors
(CXCR and CXCR2) on monocytes and leukocytes are up-regulated and direct
immune cells to the inflamed renal site (Nguan and Du, 2009). This initial
innate immune response to renal injury subsides with the healing mechanism
in HLA-matched graft. However, in the HLA-mismatched graft, early non-
specific ischemic-reperfusion injury is reported to be an immunological cause
of graft rejection (Pascual et al., 2002).
HLA-mismatch between donor and recipient activates the adaptive
immune response against allograft. The adaptive immunity involves
infiltration of specific alloreactive T-cells, dendritic cells, NK cells and
macrophages. These immune cells are regulated by chemokine receptors
(CCR5, CXCR3) and ligands (CXCL9, CXCL10) to the inflamed site of
allograft (Mantovani et al., 2004). The infiltration of activated lymphocytes
causes significant renal injury/damage and stimulates fibroblast proliferation
and matrix synthesis. Histopathological findings such as presence of
leukocytes in the intrestitium and tubulitis are the hallmark of rejection
(Racusen et al., 1999). The occurrence of repeated episodes of rejection is
associated with loss of renal function and scarring, which ultimately results in
graft-loss.
Chemokines and chemokine receptors are crucial in the immuno-
regulatory response against the allograft. The expression of number of
chemokines and chemokine receptors have showed increased expression in
rejection (Inston and Cockwell, 2002; Panzer et al., 2004; Segerer et al., 2005;
Hoffmann et al., 2010; Krensky and Clayberger, 2011; Saxena et al., 2012).

17
Interestingly, the levels of chemokines in blood and urine correlate with
histopathological findings at times of rejection. This indicates the role of
chemokines in modulating the rejection mechanism particularly during early
phase of rejection against the graft. Therefore, these chemokine factors could
be good early indicators for graft rejection.
1.3.6. Urinary Chemokines and Transplant Outcome
Chemokine receptors and their ligands are important mediators of
allograft injury. As the expression of chemokine receptors is up-regulated
during allograft injury, the measurement of their corresponding ligands could
be a potential tool for the surveillance of the graft damage. Using a non-
invasive sample (urine) for the quantification of chemokines would be ideal
for surveillance of immune response against allograft (Roedder et al., 2011;
Pereira et al., 2012). Several studies have been carried out to measure human
chemokines in the urine of kidney transplant patients for various pathological
conditions. These studies have showed an increased level of certain
chemokines (CXCL9, CXCL10, CXCL11) in patients with acute and chronic
rejection and infection compared to stable grafts and healthy individuals (Hu
et al., 2004; Schaub et al., 2009; Jackson et al., 2011; Ho et al., 2013).
Identification of acute rejection, chronic rejection and stable graft
functioning are important in renal transplantation. Increased urinary
chemokine levels have shown association with rejection. They also have a
good prediction power for rejection episodes much earlier than serum
creatinine (Kanmaz et al., 2004; Hauser et al., 2005). Therefore the response
of patients to anti-rejection therapy could be monitored by down regulation of

18
chemokine levels (Sun et al., 2003). As chemokines and chemokine receptors
participate in pathological changes at particular points of renal injury, the
quantification of urinary chemokines serve as biomarkers needed for early
non-invasive diagnosis of rejection. This could also detect significant
subclinical, acute to chronic rejection and graft loss.
1.3.7. The Functional Polymorphisms in Chemokines and Chemokine
Receptors:
Genetic factors are well-known to play a key role in transplantation
including the genetic makeup of the recipients as well as genetic differences
between donors and recipients in immunoregulatory genes. These genetic
factors regulate innate and adaptive immunity. Genetic variations such as
single nucleotide polymorphisms (SNPs) can increase or decrease the
transcriptional activity of a gene as well as functional changes in a protein and
contribute to an individual’s immune response against an allograft. Several
SNPs in the genes of chemokine ligands and chemokine receptors which have
shown association with renal diseases and transplant outcome have been
identified (Simeoni et al., 2005; Ma Angeles et al., 2012).
Studies based on renal allograft biopsies with various histopathological
conditions such as acute cellular and chronic rejection have shown high
expression levels of chemokine receptors (CXCR3 and CCR5) and
corresponding ligands (CXCL9, CXCL10, CXCL11, CCL5) (Segerer et al.,
2000; Nelson et al., 2001; Akalin et al., 2001; Sarwal et al., 2003; Flechner et
al., 2004). This intra-graft expression showed the role of
chemokine/chemokine ligand pathways in the recruitment of effector cells to

19
allograft (Obara et al., 2005; Wang et al., 2008; Bedognetti, 2011). The
CXCR3/CXCR3 ligand and CCR5/CCR5 ligand pathways are main
components of immunological constant of rejection (ICR). The various
expression levels during rejection episode could be influenced by
polymorphisms in the receptors of CCR2 and CCR5.
Various chemokine polymorphisms in CCR and CXCR have been
reported (Geraghty et al., 2002). However, certain polymorphisms increase the
expression levels of chemokine receptors on immune cells, and subsequently
participate in renal allograft dysfunction, repeated rejection and graft loss
(Abdi et al., 2002; Hancock, 2002; Kruger et al., 2002; Yigit et al., 2007; Cha
et al., 2009; Gorgi et al., 2011). While the chemokine polymorphism,
CCR5Δ32 of CCR5, reduces the risk of rejection in kidney allograft
(Fischereder et al., 2001). Some studies have shown a lack of association of
these polymorphisms with graft outcome (Brabcova et al., 2007; Azmandian
et al., 2012).
Genetic difference between donors and recipients in chemokines and
their chemokine receptors is another important factor in mediating response
against renal allograft. Multiple studies have reported the role of the donor’s
genetic makeup, particularly chemokine polymorphisms in the allograft
rejection (Hoffmann et al., 2004; Cha et al., 2009; Kang et al., 2008).
The functional polymorphisms in chemokine receptors (CCR5 and
CCR2) may help in predicting the host immune response against renal
allograft. Additionally, therapeutic strategies could be designed by identifying
the high risk renal transplant patients to minimize the incidence of rejection
episodes and prolong graft survival.

20
1.4. Current Study:
The current study investigates the role of genetic variations
(polymorphisms; SNPs) in chemokine receptors. Chemokine receptors 2 and
5 were genotyped for CCR2V64I, CCR59029G>A and CCR5Δ32 (chapter 3)
and determined their association with renal transplant outcome. Additionally,
urinary chemokine levels of human interferon gamma inducible protein-10
(IP-10/CXCL-10; chapter 4); human monokine induced by interferon-gamma
(MIG/CXCL9; chapter 5) and human monocyte chemotactic protein-1 (MCP-
1/CCL2; chapter 6) were also quantified at different histopathologically
confirmed events. The measured urinary chemokine levels were used for
association studies with rejection, non-rejection and stable graft.
1.4.1. Chemokine Receptor Gene Polymorphisms (CCR2V64I, CCR5-
59029G>A and CCR5Δ32):
Chemokine receptor-2 (CCR2) and -5 (CCR5) are GPCRs. They are
encoded by two genes located in a cluster of chemokine receptor genes on
p21.3-p24 region of chromosome 3 (Liu et al. 1996; Samson et al., 1996 a and
b). The CCR2 and CCR5 genes comprise of 3 and 4 exons respectively,
spanning approximately 6-7 kb of genomic sequence (Mummidi et al. 1997;
Wong et al., 1997). The CCR2 gene encodes a receptor for monocytes
chemoattractant protein-1(MCP-1) where as CCR5 gene encodes a receptor
for regulated on activation normal T-cell expressed and secreted protein
(RANTES) and macrophage inflammatory protein-1 (MIP-1α and -β) ( Charo
et al., 1994). Both CCR receptors are expressed on the surface of T-cells, B-
cells, monocytes/macrophages, basophils and NK cells.
21
Genetic variations such as SNPs and mutations in the coding region of
CCR2 and CCR5 chemokine receptors influence their expression and function.
These genetic variations have been implicated in kidney transplantation
rejection. The V64I polymorphism of CCR2, CCR5-59029G>A
polymorphism and CCR5 32 bp deletion (CCR5Δ32) have been widely
studied due to their association with kidney allograft rejection.
Smith et al. (1997) identified the V64I polymorphism in the first
transmembrane region of CCR2. The V64I polymorphism of CCR2 is due to a
single nucleotide change (G to A) at codon position of 64 that results in amino
acid change from valine to isoleuicine. This polymorphism has been shown to
be correlated with the reduction of CCR2 function in the anti-allograft
immune response and to be involved in the down modulation of CCR5
expression which is important in the graft rejection (Segerer et al., 2001;
Nakayama et al., 2004). Various renal transplant studies have shown the
association of CCR2V64I polymorphism with either allograft rejection or
stable allograft function (Prasad et al., 2007; Omrani et al., 2008; Gorgi et al.,
2011).
The CCR5-59029G>A is a polymorphism of CCR5 in the promoter
region that increases its expression level and subsequently its activity by
attracting monocytes and T-cells. Another mutation in the CCR5 gene is a 32
bp deletion (CCR5Δ32) that results in a frame shift and premature termination
of translation of the transcript (Samson et al., 1996 c). These genetic
variations in CCR5 have been associated with repeated rejection episodes,
graft rejection as well as graft survival (Fischereder et al., 2001; Prasad et al.,
2007; Omrani et al., 2008; Gorgi et al., 2011).

22
This study evaluates the association of CCR2V64I, CCR5-59029G>A
and CCR5Δ32 genetic variations with renal allograft rejection and survival in
our study groups. The premise of the study is that these chemokine receptor
polymorphisms help in identifying transplant patients at high risk for allograft
rejection and minimize the rejection incidences. Therapeutic strategies based
on chemokine biology may result in long-term allograft survival.
1.4.2. Urinary Interferon-Gamma Induced Protein-10 and its Association
with Renal Allograft Rejection:
Interferon-gamma inducible protein-10 (IP-10 or CXCL10) belongs to
CXC chemokine sub-group of chemokines super family. It has chemotactic
properties for T helper cells (Th1), NK cells, DC cells and macrophages
(Loetscher et al., 1996; Bonecchi et al., 1998; Romagnani et al., 2001). IP-10
is secreted by several immune cells (leukocytes, neutrophils) and non-immune
cells (epithelial cells, endothelial cells) and its biological activity is manifested
by binding to CXCR3 receptors. The CXCR3 receptors and IP-10 have a
central role in the immune response against transplanted organs (Panzer et al.,
2004; Romagnani and Crescioli, 2012).
IP-10 is named as it was identified as an early response gene induced
on treatment with interferon in many cells. The IP-10 gene is located on
chromosome 4q21.1 and consists of four (4) exons. The molecular size of IP-
10 protein is 10 kDa and it is composed of 98 amino acids.
IP-10 and its corresponding chemokine receptor (CXCR3) have a
central role in immune response against various transplant organs (renal, heart,
lung). IP-10 derived either from donor or recipient, is also associated with
rejection. As IP-10 has shown potent chemoattractant property for T cells,
23
donor derived IP-10 chemokine participate in initiating early rejection process
(Hancock et al., 2001). An increased IP-10 level along with other co-
stimulating cytokines also promotes survival and expansion of certain T-cell
subtypes and triggers apoptosis (Sidahmed et al., 2012). Therefore, it
contributes to rejection and early graft loss.
Multiple studies have shown increased expression of IP-10 in graft,
blood (pre-transplant and post-transplant) and significant association with
acute rejection, chronic allograft nephropathy and graft loss (Rotondi et al.,
2004; Tatapudi et al., 2004; Lazzeri et al., 2005; Matl et al., 2010; Lo et al.,
2011; Mao et al., 2011). It has been shown that IP-10 chemokine in urine
identifies early renal allograft inflammation and renal injury with better
sensitivity and predictability than serum IP-10 (Jackson et al., 2011).
Interestingly, it also indicates the response of patients to anti-rejection therapy
by down regulating the IP-10 levels (Matz et al., 2006; Mao et al., 2011).
Stability and reproducibility of IP-10 levels in non-invasive samples (urine
and blood) make it an ideal marker for transplantation studies.
1.4.3. Urinary Monokine Induced by Interferon-Gamma and its
Association with Renal Allograft Rejection:
The monokine induced by interferon-gamma (MIG or CXCL9) is a
major chemoattractant for T-lymphocytes. It is induced in response to INF-γ
by various cells such as monocytes/macrophages, neutrophils, endothelial
cells, epithelial cells, and also by liver and kidney. It has a role in many
diseases such as autoimmune diseases, renal diseases and allograft rejection
(Koga et al., 1999; Romagnani et al., 1999; Auerbach et al., 2009; Asaoka et
al., 2012).

24
The MIG gene is located on chromosome 4 at q12-21 (Lee and Farber,
1996; O'Donovan et al., 1999). The functional protein is composed of 103
amino acids and belongs to CXC chemokine sub-family. Its activity is
regulated by CXCR3-GPCRs on Th1 cells. Thus, it is regulated predominantly
by Th1 immune response. Interaction of MIG with CXCR3 causes
inflammatory cells infiltration that leads to renal disease and acute renal
allograft rejection (Lazzeri et al., 2002).
Various studies have shown that MIG levels are associated with renal
rejection and also identify subjects with high risk of rejection (Koga et al.,
1999; Rotondi et al., 2010; Jackson et al., 2011; De Muro et al., 2013). High
urinary levels of MIG and its association with rejection make it a potential
non-invasive biomarker for graft monitoring (Schaub et al., 2009). Multiple
studies have showed the diagnostic power of urinary MIG for rejection is
better than serum creatinine. Additionally, it could also reflect the immune
response to anti-rejection therapy (Hu et al., 2004; Hauser et al., 2005). On the
other hand, therapeutic approaches that neutralize MIG during early post
transplant periods have showed significant results in preventing chronic graft
vasculopathy and graft fibrosis (Miura et al., 2003).
1.4.4. Urinary MCP-1 and its Association with Renal Allograft Rejection:
Human monocyte chemotactic protein-1 (MCP-1/CCL2) is a
chemotactic ligand, and belongs to the CCL chemokine family. It is produced
in response to inflammatory mediators such as TNF and INF-γ (Rollins,
1997). MCP-1 is a major chemoattractant and activator of monocytes and
other immune cells (NK cells and T-cells) and contributes to inflammation and
recruitment of immune cells to the inflamed or injured site (Ajuebor et al.,
25
1998; Robertson et al., 2000). Various studies have shown the involvement of
MCP-1 in renal injury, wound healing and renal transplantation (Rovin et al.,
1996; Low et al., 2001; Rice et al., 2002; Eardley et al., 2006; Dantas et al.,
2007; Wu et al., 2010).
The MCP-1 ligand is protein in nature and its gene is located at q11.2
on chromosome 17. The MCP-1 is composed of 76 amino acids having
molecular size of 13kDa (Van Coillie et al., 1999). The MCP-1 ligand is
specific for the GPCR, CCR2. The ligand mediates its activity by interacting
with CCR2 of monocytes, NK cells and T-cells. Additionally, it also regulates
the expression levels of CCR2 on immune cells (Cho et al., 2007).
As MCP-1 is an early chemoattractant released after ischemia
reperfusion renal injury and initial allograft rejection, it contributes
significantly to immune regulation against renal transplantation. Various renal
transplant studies have shown MCP-1 association with transplant outcome
such as up-regulation of MCP-1 ligands and corresponding receptors (CCR2),
gene polymorphisms in MCP-1 gene, and also urinary levels of MCP-1
(Grandaliano et al., 1997; Kruger et al., 2002; Rüster et al., 2004; Lacha et al.,
2005; Dubiński et al., 2008; Kang et al., 2008).
The quantification of urinary MCP-1 levels of renal transplant patients
during rejection is a non-invasive immune monitoring approach. Multiple
studies have shown that urinary MCP-1 levels are associated with graft
dysfunction (Prodjosudjadi et al., 1996; Grandaliano et al., 1997; Sun et al.,
2003; Ho et al., 2010; Ho et al., 2012). Detection of urinary MCP-1 may
provide early and non-invasive diagnostic and prognostic approach for graft
dysfunction.

26
1.5. References: Abdi R, Tran TB, Sahagun-Ruiz A, Murphy PM, Brenner BM, Milford EL, McDermott DH. (2002). Chemokine receptor polymorphism and risk of acute rejection in human renal transplantation. J Am Soc Nephrol. 13(3):754-8.
Ajuebor MN, Flower RJ, Hannon R, Christie M, Bowers K, Verity A, Perretti M. (1998). Endogenous monocyte chemoattractant protein-1 recruits monocytes in the zymosan peritonitis model. J Leukoc Biol. 63(1):108-116.
Akalin E, Hendrix RC, Polavarapu RG, Pearson TC, Neylan JF, Larsen CP, Lakkis FG. (2001). Gene expression analysis in human renal allograft biopsy samples using high-density oligoarray technology. Transplantation. 72(5):948-953.
Alachkar N. (2012). Serum and urinary biomarkers in acute kidney transplant rejection. Nephrol Ther. 8(1):13-9.
Anders HJ, Vielhauer V, Schlöndorff D. (2003). Chemokines and chemokine receptors are involved in the resolution or progression of renal disease. Kidney Int. 63(2):401-415. Asaoka T, Marubashi S, Kobayashi S, Hama N, Eguchi H, Takeda Y, Tanemura M,Wada H, Takemasa I, Takahashi H, Ruiz P, Doki Y, Mori M, Nagano H. (2012). Intragraft transcriptome level of CXCL9 as biomarker of acute cellular rejection after liver transplantation. J Surg Res. 178(2):1003-1014. Auerbach MB, Shimoda N, Amano H, Rosenblum JM, Kish DD, Farber JM, Fairchild RL. (2009). Monokine induced by interferon-gamma (MIG/CXCL9) is derived from both donor and recipient sources during rejection of class II major Histocompatibility complex disparate skin allografts. Am J Pathol. 174(6):2172-81.
Azmandian J, Mandegary A, Saber A, Torshabi M, Etminan A, Ebadzadeh MR, Fazeli F, Soleymani S, Taghipour A, Karimi MA. (2012). Chemokine receptor 2-V64I and chemokine receptor 5-Delta32 polymorphisms and clinical risk factors of delayed graft function and acute rejection in kidney transplantation. Iran J Kidney Dis. 6(1):56-62.
Baggiolini M. (1998). Chemokines and leukocyte traffic. Nature. 392(6676):565-568. Bedognetti D. (2011). Signature Associated with Acute Rejection: Allograft Rejection. In: Immunologic Signatures of Rejection. Eds. Marincola, FM. and Wang, E. Springer, New York, USA. 305-345.
Bonecchi R, Bianchi G, Bordignon PP, D'Ambrosio D, Lang R, Borsatti A, Sozzani S, Allavena P, Gray PA, Mantovani A, Sinigaglia F. (1998). Differential expression of chemokine receptors and chemotactic

27
responsiveness of type 1 T helper cells (Th1s) and Th2s. J Exp Med. 187(1): 129-34
Brabcova I, Petrasek J, Hribova P, Hyklova K, Bartosova K, Lacha J, Viklický O. (2007). Genetic variability of major inflammatory mediators has no impact on the outcome of kidney transplantation. Transplantation. 84(8):1037-44.
Cha RH, Yang SH, Kim HS, Kim SM, Park MH, Ha J, Kim YS. (2009). Genetic interactions between the donor and the recipient for susceptibility to acute rejection in kidney transplantation: polymorphisms of CCR5. Nephrol. Dial. Transplant. 24(9): 2919-2925.
Charo IF, Myers SJ, Herman A, Franci C, Connolly AJ, Coughlin, SR. (1994). Molecular cloning and functional expression of two monocyte chemoattractant protein 1 receptors reveals alternative splicing of the carboxyl-terminal tails. Proc. Nat. Acad. Sci. 91(7):2752-2756. Chinen J and Buckley RH. (2010). Transplantation immunology: solid organ and bone marrow. J Allergy Clin Immunol. 125(2 Suppl 2):S324-35.
Cho ML, Yoon BY, Ju JH, Jung YO, Jhun JY, Park MK, Park SH, Cho CS, Kim HY. (2007). Expression of CCR2A, an isoform of MCP-1 receptor, is increased by MCP-1, CD40 ligand and TGF-beta in fibroblast like synoviocytes of patients with RA. Exp Mol Med. 39(4):499-507.
Clayton P, Excell L, Campbell S, McDonald S, Chadban S. (2010) Transplantation. In: ANZDATA Registry 2010 report. Chap.8. Available at: http://www.anzdata.org.au/anzdata/AnzdataReport/33rdReport/Ch08.pdf. Accessed November 29, 2011. Dantas M, Romão EA, Costa RS, dos Reis MA, Vieira Neto OM, Ribeiro RA, Ravinal RC, Rodrigues Júnior AL, Coimbra TM. (2007). Urinary excretion of monocyte chemoattractant protein-1: a biomarker of active tubulointerstitial damage in patients with glomerulopathies. Kidney Blood Press Res. 30(5):306-313. De Freitas DG, Sellarés J, Mengel M, Chang J, Hidalgo LG, Famulski KS, Sis B, Einecke G, Halloran PF. (2012). The nature of biopsies with "borderline rejection" and prospects for eliminating this category. Am J Transplant. 12(1):191-201. De Muro P, Faedda R, Masala A, Lepedda AJ, Zinellu E, Ciccarese M, Cossu M, Pala PG, Satta RP, Formato M. (2013). Kidney post-transplant monitoring of urinary glycosaminoglycans/proteoglycans and monokine induced by IFN-γ (MIG). Clin Exp Med. 13(1):59-65. Dirks J, Remuzzi G, Horton S, Schieppati A and Rizvi S AH. (2006). Chapter 36: Diseases of the Kidney and the Urinary System. In: Disease Control Priorities in Developing Countries, 2nd Edition. Eds. Dean T.

28
Jamison, Joel G. Breman,, Anthony R. Measham, George Alleyne, Mariam Claeson, David B. Evans, Prabhat Jha, Anne Mills, Philip Musgrove . Oxford University Press, Great Britain. 695-706.
Dubiński B, Boratyńska M, Kopeć W, Szyber P, Patrzałek D, Klinger M. (2008). Activated cells in urine and monocyte chemotactic peptide-1 (MCP-1)--sensitive rejection markers in renal graft recipients. Transpl Immunol. 18(3):203-207.
Eardley KS, Zehnder D, Quinkler M, Lepenies J, Bates RL, Savage CO, Howie AJ, Adu D, Cockwell P. (2006). The relationship between albuminuria, MCP-1/CCL2, and interstitial macrophages in chronic kidney disease. Kidney Int. 69(7):1189-97. Famulski KS, Einecke G, Reeve J, Ramassar V, Allanach K, Mueller T, Hidalgo LG, Zhu LF, Halloran PF. (2006). Changes in the transcriptome in allograft rejection: IFN-gamma-induced transcripts in mouse kidney allografts. Am J Transplant. 6(6):1342-1354.
Fang YS, Zhu LM, Sun ZG, Yu LZ, Xu H. (2012). Tumor necrosis factor-α pathway plays a critical role in regulating interferon-γ induced protein-10 production in initial allogeneic human monocyte-endothelial cell interactions. Transplant Proc. 44(4):993-5..
Fischereder M, Luckow B, Hocher B, Wüthrich RP, Rothenpieler U, Schneeberger H, Panzer U, Stahl RA, Hauser IA, Budde K, Neumayer H, Krämer BK, Land W, Schlöndorff D. (2001). CC chemokine receptor 5 and renal transplant survival. Lancet. 357(9270): 1758-1761. Flechner SM, Kurian SM, Head SR, Sharp SM, Whisenant TC, Zhang J, Chismar JD, Horvath S, Mondala T, Gilmartin T, Cook DJ, Kay SA, Walker JR, Salomon DR. (2004). Kidney transplant rejection and tissue injury by gene profiling of biopsies and peripheral blood lymphocytes. Am J Transplant. 4(9):1475-89.
Geraghty DE, Daza R, Williams LM, Vu Q, Ishitani A. (2002). Genetics of the immune response: identifying immune variation within the MHC and throughout the genome. Immunol Rev. 190:69-85.
Gerard C, Rollins BJ. (2001). Chemokines and disease. Nat Immunol. 2(2):108-15. Girlanda R, Kleiner DE, Duan Z, Ford EA, Wright EC, Mannon RB, Kirk AD. (2008). Monocyte infiltration and kidney allograft dysfunction during acute rejection. Am J Transplant. 8(3):600-607. Gorgi Y, Sfar I, Jendoubi-Ayed S, Makhlouf M, Rhomdhane TB, Bardi R, Aouadi H, Abdallah TB, Abderrahim E, Ayed K. (2011). Allograft renal rejection and chemokine polymorphism. Saudi J Kidney Dis Transpl. 22(1):18-23.

29
Grandaliano G, Gesualdo L, Ranieri E, Monno R, Stallone G, Schena FP. (1997). Monocyte chemotactic peptide-1 expression and monocyte infiltration in acute renaltransplant rejection. Transplantation. 63(3):414-420.
Halloran PF, de Freitas DG, Einecke G, Famulski KS, Hidalgo LG, Mengel M, Reeve J, Sellares J, Sis B. (2010). The molecular phenotype of kidney transplants. Am. J. Transplant. 10(10):2215-22.
Hancock WW, Gao W, Csizmadia V, Faia KL, Shemmeri N, Luster AD. (2001). Donor-derived IP-10 initiates development of acute allograft rejection. J Exp Med. 193(8):975-80.
Hancock WW. (2002). Chemokines and transplant immunology. J. Am. Soc. Nephrol. 13(3): 82-824. Hauser IA, Spiegler S, Kiss E, Gauer S, Sichler O, Scheuermann EH, Ackermann H, Pfeilschifter JM, Geiger H, Gröne HJ, Radeke HH. (2005). Prediction of acute renal allograft rejection by urinary monokine induced by IFN-gamma (MIG). J Am Soc Nephrol. 16(6):1849-58.
Ho J, Rush DN, Gibson IW, Karpinski M, Storsley L, Bestland J, Stefura W, HayGlass KT, Nickerson PW. (2010). Early urinary CCL2 is associated with the laterdevelopment of interstitial fibrosis and tubular atrophy in renal allografts. Transplantation. 90(4):394-400.
Ho J, Wiebe C, Rush DN, Rigatto C, Storsley L, Karpinski M, Gao A, Gibson IW, Nickerson PW. (2013). Increased urinary CCL2: Cr ratio at 6 months is associated with late renal allograft loss. Transplantation. 95(4):595-602.
Hoffmann S, Park J, Jacobson LM, Muehrer RJ, Lorentzen D, Kleiner D, Becker YT, Hullett DA, Mannon R, Kirk AD, Becker BN. (2004). Donor genomics influence graftevents: the effect of donor polymorphisms on acute rejection and chronic allograft nephropathy. Kidney Int. 66(4):1686-1693.
Hoffmann U, Bergler T, Segerer S, Rümmele P, Krüger B, Banas MC, Reinhold S,Banas B, Krämer BK. (2010). Impact of chemokine receptor CX3CR1 in human renal allograft rejection. Transpl Immunol. 23(4):204-208. Hu H, Aizenstein BD, Puchalski A, Burmania JA, Hamawy MM, Knechtle SJ. (2004). Elevation of CXCR3-binding chemokines in urine indicates acute renal-allograft dysfunction. Am J Transplant. 4(3):432-437. Hu H, Knetchle SJ. (2006). Elevation of multiple cytokine/chemokines in urine of human renal transplantation with acute and chronic injuries: potential usage for diagnosis and monitoring. Trans Rev. 20(4):165-171. Inston NG and Cockwell P. (2002). The evolving role of chemokines and their receptors in acute allograft rejection. Nephrol Dial Transplant. 17(8):1374-9.
30
Iseki K. (2005). Factors influencing the development of end-stage renal disease. Clin Exp Nephrol. 9(1):5-14. Jackson JA, Kim EJ, Begley B, Cheeseman J, Harden T, Perez SD, Thomas S, Warshaw B, Kirk AD. (2011). Urinary chemokines CXCL9 and CXCL10 are noninvasive markers of renal allograft rejection and BK viral infection. Am J Transplant. 11(10):2228-2234.
Kang SW, Park SJ, Kim YW, Kim YH, Sohn HS, Yoon YC, Joo H, Jeong KH, Lee SH, Lee TW, Ihm CG. (2008). Association of MCP-1 and CCR2 polymorphisms with the risk of late acute rejection after renal transplantation in Korean patients. Int J mmunogenet. 35(1):25-31.
Kanmaz T, Feng P, Torrealba J, Kwun J, Fechner JH, Schultz JM, Dong Y, Kim HT, Dar W, Hamawy MM, Knechtle SJ, Hu H. (2004). Surveillance of acute rejection in baboon renal transplantation by elevation of interferon-gamma inducible protein-10 and monokine induced by interferon-gamma in urine. Transplantation. 78(7):1002-1007. Koga S, Auerbach MB, Engeman TM, Novick AC, Toma H, Fairchild RL. (1999). T cell infiltration into class II MHC-disparate allografts and acute rejection is dependent on the IFN-gamma-induced chemokine Mig. J Immunol. 163(9):4878-85. Krensky AM and Clayberger C. (2011). Chemokines and cytotoxic effector molecules in rejection. In: Immunologic Signatures of Rejection. Eds. Marincola, FM. and Wang, E. Springer, New York, USA: 77-92. Kruger B, Schröppel B, Ashkan R, Marder B, Zülke C, Murphy B, Krämer BK, Fischereder M. (2002). A monocyte chemoattractant protein-1 (MCP-1) polymorphism and outcome after renal transplantation. J. Am. Soc. Nephrol. 13(10): 2585-2589. Kurian SM, Heilman R, Mondala TS, Nakorchevsky A, Hewel JA, Campbell D, Robison EH, Wang L, Lin W, Gaber L, Solez K, Shidban H, Mendez R, Schaffer RL,Fisher JS, Flechner SM, Head SR, Horvath S, Yates JR, Marsh CL, Salomon DR. (2009). Biomarkers for early and late stage chronic allograft nephropathy by proteogenomic profiling of peripheral blood. PLoS One. 10;4(7):e6212.
Lacha J, Hribova P, Kotsch K, Brabcova I, Bartosova K, Volk HD, Vitko S. (2005). Effect of cytokines and chemokines (TGF-beta, TNF-alpha, IL-6, IL-10, MCP-1, RANTES) gene polymorphisms in kidney recipients on post-transplantation outcome: influence of donor-recipient match. Transplant Proc. 37(2):764-766.
Lazzeri E, Lasagni L, Serio M, Romagnani S, Romagnani P. (2002). Cytokines and chemokines in nephropathies and renal transplant. G Ital Nefrol. 19(6):641-9.

31
Lazzeri E, Rotondi M, Mazzinghi B, Lasagni L, Buonamano A, Rosati A, Pradella F, Fossombroni V, La Villa G, Gacci M, Bertoni E, Serio M, Salvadori M, Romagnani P. (2005). High CXCL10 expression in rejected kidneys and predictive role of pretransplant serum CXCL10 for acute rejection and chronic allograft nephropathy. Transplantation. 79(9): 1215-1220 Lee HH and Farber JM. (1996). Localization of the gene for the human MIG cytokine on chromosome 4q21 adjacent to INP10 reveals a chemokine 'mini-cluster. Cytogenet. Cell Genet. 74(4): 255-258.
Lei HH, Perneger TV, Klag MJ, Whelton PK, Coresh J. (1998). Familial aggregation of renal disease in a population-based case-control study. J. Am. Soc. Nephrol. 9:1270-1276
Lee JH, Kim HN, Kim KO, Jin WJ, Lee S, Kim HH, Ha H, Lee ZH. (2012). CXCL10 promotes osteolytic bone metastasis by enhancing cancer outgrowth and osteoclastogenesis. Cancer Res. 72(13):3175-3186.
Levey AS, Coresh J, Balk E, Kausz AT, Levin A, Steffes MW, Hogg RJ, Perrone RD, Lau J, Eknoyan G. (2003); National Kidney Foundation. National Kidney Foundation practice guidelines for chronic kidney disease: evaluation, classification, and stratification. Ann Intern Med. 139(2):137-147.
Liu R, Paxton, WA, Choe S, Ceradini D, Martin SR, Horuk R, MacDonald ME, Stuhlmann H, Koup RA, Landau NR. (1996). Homozygous defect in HIV-1 coreceptor accounts for resistance of some multiply-exposed individuals to HIV-1 infection. Cell. 86(3): 367-377. Lo DJ, Weaver TA, Kleiner DE, Mannon RB, Jacobson LM, Becker BN, Swanson SJ, Hale DA, Kirk AD. (2011). Chemokines and their receptors in human renal allotransplantation. Transplantation. 91(1): 70-77. Locati M, Bonecchi R, Corsi MM. (2005). Chemokines and their receptors: roles in specific clinical conditions and measurement in the clinical laboratory. Am J Clin Pathol. 123 Suppl: S82-95. Loetscher P, Seitz M, Baggiolini M, Moser B. (1996). Interleukin-2 regulates CC chemokine receptor expression and chemotactic responsiveness in T lymphocytes. J Exp Med. 184(2):569. Low QE, Drugea IA, Duffner LA, Quinn DG, Cook DN, Rollins BJ, Kovacs EJ, DiPietro LA. (2001). Wound healing in MIP-1 alpha (-/-) and MCP-1(-/-) mice. Am J Pathol. 159(2): 457-463.
Ma Angeles Jimenez-Sousa, Elisabeth López, Amanda Fernandez-Rodríguez, Eduardo Tamayo, Pablo Fernández-Navarro, Laura Segura-Roda, María Heredia, José I Gómez-Herreras, Jesús Bustamante, Juan Miguel García-Gómez, Jesús F Bermejo-Martin, Salvador Resino Jimenez-Sousa MA, López E, Fernandez-Rodríguez A, Tamayo E, Fernández-Navarro P, Segura-Roda L, Heredia M, Gómez-Herreras JI,

32
Bustamante J, García-Gómez JM,Bermejo-Martin JF, Resino S. (2012). Genetic polymorphisms located in genes related to immune and inflammatory processes are associated with end-stage renal disease: a preliminary study. BMC Med Genet. 13:58.
Magee CC and Pascual M. (2004). Update in renal transplantation. Arch Intern Med.12; 164(13):1373-88. Mantovani A. (1999). The chemokine system: redundancy for robust outputs. Immunol Today. 20(6):254-257. Mantovani A, Sica A, Sozzani S, Allavena P, Vecchi A, Locati M. (2004). The chemokine system in diverse forms of macrophage activation and polarization. Trends Immunol. 25(12):677-686. Mantovani A, Bonecchi R, Locati M. (2006). Tuning inflammation and immunity by chemokine sequestration: decoys and more. Nat Rev Immunol. 6(12):907-18. Mao Y, Wang M, Zhou Q, Jin J, Wang Y, Peng W, Wu J, Shou Z, Chen J. (2011). CXCL10 and CXCL13 Expression were highly up-regulated in peripheral blood mononuclear cells in acute rejection and poor response to anti-rejection therapy. J. Clin. Immunol. 31(3):414-8. Matl I, Hribova P, Honsova E, Brabcova I, Viklicky O. (2010). Potential predictive markers in protocol biopsies for premature renal graft loss. Kidney Blood Press Res. 33(1):7-14. Matz M, Beyer J, Wunsch D, Mashreghi MF, Seiler M, Pratschke J, Babel N, Volk HD, Reinke P, Kotsch K. (2006). Early post-transplant urinary IP-10 expression after kidney transplantation is predictive of short- and long-term graft function. Kidney Int. 69(9):1683-90. Mengel M, Reeve J, Bunnag S, Einecke G, Jhangri GS, Sis B, Famulski K, Guembes-Hidalgo L, Halloran PF. (2009). Scoring total inflammation is superior to the current Banff inflammation score in predicting outcome and the degree of molecular disturbance in renal allografts. Am J Transplant. 9(8):1859-67. Miura M, Morita K, Koyanagi T, Fairchild RL. (2003). Neutralization of monokine induced by interferon-gamma during the early post transplantation period prevents development of chronic allograft vasculopathy and graft fibrosis. Transplant Proc. 35(2):875-7. Mueller TF, Einecke G, Reeve J, Sis B, Mengel M, Jhangri GS, Bunnag S, Cruz J, Wishart D, Meng C, Broderick G, Kaplan B, Halloran PF. (2007). Microarray analysis of rejection in human kidney transplants using pathogenesis-based transcript sets. Am J Transplant. 7(12):2712-22.

33
Mummidi S, Ahuja SS, McDaniel BL, Ahuja SK. (1997). The human CC chemokine receptor 5 (CCR5) gene: multiple transcripts with 5-prime-end heterogeneity, dual promoter usage, and evidence for polymorphisms within the regulatory regions and noncoding exons. J. Biol. Chem. 272(49): 30662-30671. Murray JE. (2011). Ronald Lee Herrick memorial: June 15, 1931-December 27, 2010. Am J Transplant. 11(7):419. Naesens M, Sarwal MM. (2010). Molecular diagnostics in transplantation. Nat Rev. Nephrol. 6(10):614-628. Nakayama EE, Tanaka Y, Nagai Y, Iwamoto A, Shioda T. (2004). A CCR2-V64I polymorphism affects stability of CCR2A isoform. AIDS. 18(5): 729-738. Nakorchevsky A, Hewel JA, Kurian SM, Mondala TS, Campbell D, Head SR, Marsh CL, Yates JR 3rd, Salomon DR. (2010). Molecular mechanisms of chronic kidney transplant rejection via large-scale proteogenomic analysis of tissue biopsies. J Am Soc Nephrol. 21(2):362-373. Nelson PJ and Krensky AM. (2001). Chemokines and allograft rejection: narrowing the list of suspects. Transplantation. 72(7):1195-1197. Nguan CY and, Du C. (2009). Renal tubular epithelial cells as immunoregulatory cells in renal allograft rejection. Transplant Rev (Orlando). 23(3):129-38. Nomiyama H, Osada N, Yoshie O. (2011). A family tree of vertebrate chemokine receptors for a unified nomenclature. Dev Comp Immunol. 35(7):705-15.
Obara H, Nagasaki K, Hsieh CL, Ogura Y, Esquivel CO, Martinez OM, Krams SM. (2005). IFN-gamma, produced by NK cells that infiltrate liver allografts early after transplantation, links the innate and adaptive immune responses. Am J Transplant. 5(9):2094-2103.
O'Donovan N, Galvin M., Morgan JG. (1999). Physical mapping of the CXC chemokine locus on human chromosome 4. Cytogenet. Cell Genet. 84(1-2): 39-42. Ohta M, Kitadai Y, Tanaka S, Yoshihara M, Yasui W, Mukaida N, Haruma K, Chayama K. (2002). Monocyte chemoattractant protein-1 expression correlates with macrophage infiltration and tumor vascularity in human esophageal squamous cell carcinomas. Int J Cancer. 102(3):220-224. Omrani MD, Mokhtari MR, Tagizadae A, Bagheri M, Ahmad-Poor P. (2008). Association of CCR5-59029 A/G and CCR2-V64I variants with renal allograft survival. Iran J Immunol. 5(4):201-206.

34
Orth SR, Stöckmann A, Conradt C, Ritz E, Ferro M, Kreusser W, Piccoli G, Rambausek M, Roccatello D, Schäfer K, Sieberth HG, Wanner C, Watschinger B, Zucchelli P. (1998). Smoking as a risk factor for end-stage renal failure in men with primary renal disease. Kidney Int. 54(3):926-31. Panzer U, Reinking RR, Steinmetz OM, Zahner G, Sudbeck U, Fehr S, Pfalzer B, Schneider A, Thaiss F, Mack M, Conrad S, Huland H, Helmchen U, Stahl RA (2004). CXCR3 and CCR5 positive T-cell recruitment in acute human renal allograft rejection. Transplantation. 78(9):1341-50. Pascual M, Theruvath T, Kawai T, Tolkoff-Rubin N, Cosimi AB. (2002). Strategies to improve long-term outcomes after renal transplantation. N Engl J Med. 346(8):580-90. Pereira AB, Teixeira AL, Rezende NA, Pereira RM, Miranda DM, Oliveira EA, Teixeira MM, Simões E Silva AC. (2012). Urinary chemokines and anti-inflammatory molecules in renal transplanted patients as potential biomarkers of graft function: a prospective study. Int Urol Nephrol. 44(5):1539-1548. Prasad P, Tiwari AK, Kumar KM P, Ammini AC, Gupta A, Gupta R, and Thelma BK. (2007). Association of TGFβ1, TNFα, CCR2 and CCR5 gene polymorphisms in type-2 diabetes and renal insufficiency among Asian Indians. BMC Med Genet. 8: 20.
Prodjosudjadi W, Daha MR, Gerritsma JS, Florijn KW, Barendregt JN, Bruijn JA, van der Woude FJ, van Es LA. (1996). Increased urinary excretion of monocyte chemoattractant protein-1 during acute renal allograft rejection. Nephrol DialTransplant. 11(6):1096-103.
Racusen LC, Solez K, Colvin RB, Bonsib SM, Castro MC, Cavallo T, Croker BP, Demetris AJ, Drachenberg CB, Fogo AB, Furness P, Gaber LW, Gibson IW, Glotz D,Goldberg JC, Grande J, Halloran PF, Hansen HE, Hartley B, Hayry PJ, Hill CM,Hoffman EO, Hunsicker LG, Lindblad AS, Yamaguchi Y, et al. ( 1999). The Banff 97 working classification of renal allograft pathology. Kidney Int. 55(2):713-23
Reeve J, Einecke G, Mengel M, Sis B, Kayser N, Kaplan B, Halloran PF. (2009). Diagnosing rejection in renal transplants: a comparison of molecular- and histopathology-based approaches. Am J Transplant. 9(8):1802-1810. Rice JC, Spence JS, Yetman DL, Safirstein RL. (2002). Monocyte chemoattractant protein-1 expression correlates with monocyte infiltration in the post-ischemic kidney. Ren Fail. 24(6):703-23.
Robertson H, Morley AR, Talbot D, Callanan K, Kirby JA. (2000). Renal allograft rejection: beta-chemokine involvement in the development of tubulitis. Transplantation. 69(4):684-687.

35
Roedder S, Vitalone M, Khatri P, Sarwal MM. (2011). Biomarkers in solid organ transplantation: establishing personalized transplantation medicine. Genome Med. 3(6):37.
Rollins BJ (1997). Chemokines. Blood. 90(3): 909-928. Romagnani P, Beltrame C, Annunziato F, Lasagni L, Luconi M, Galli G, Cosmi L, Maggi E, Salvadori M, Pupilli C, Serio M. (1999). Role for interactions between IP-10/Mig and CXCR3 in proliferative glomerulonephritis. J Am Soc Nephrol. 10(12):2518-26. Romagnani P, Annunziato F, Lazzeri E, Cosmi L, Beltrame C, Lasagni L, Galli G, Francalanci M, Manetti R, Marra F, Vanini V, Maggi E, Romagnani S. (2001). Interferon-inducible protein 10, monokine induced by interferon gamma, and interferon-inducible T-cell alpha chemoattractant are produced by thymic epithelial cells and attract T-cell receptor (TCR) alphabeta+ CD8+ single-positive T cells, TCRgammadelta+ T cells, and natural killer-type cells in human thymus. Blood. 97(3):601-607. Romagnani P, Crescioli C. (2012). CXCL10: A candidate biomarker in transplantation. Clin Chim Acta. 413(17-18):1364-1373. Rostène W, Kitabgi P, Parsadaniantz SM. (2007). Chemokines: a new class of neuromodulator? Nat Rev Neurosci. 8(11):895-903. Rotondi M, Rosati A, Buonamano A, Lasagni L, Lazzeri E, Pradella F, Fossombroni V, Cirami C, Liotta F, La Villa G, Serio M, Bertoni E, Salvadori M, Romagnani P. (2004). High pretransplant serum levels of CXCL10/IP-10 are related to increased risk of renal allograft failure. Am. J. Transplant. 4(9):1466-74. Rotondi M, Netti GS, Lazzeri E, Stallone G, Bertoni E, Chiovato L, Grandaliano G, Gesualdo L, Salvadori M, Schena FP, Romagnani P, Serio M. (2010). High pretransplant serum levels of CXCL9 are associated with increased risk of acute rejection and graft failure in kidney graft recipients. Transpl Int. 23(5):465-75. Rovin BH, Doe N, Tan LC. (1996). Monocyte chemoattractant protein-1 levels in patientswith glomerular disease. Am J Kidney Dis. 27(5):640-6.
Rüster M, Sperschneider H, Fünfstück R, Stein G, Gröne HJ. (2004). Differential expression of beta-chemokines MCP-1 and RANTES and their receptors CCR1, CCR2, CCR5 in acute rejection and chronic allograft nephropathy of human renal allografts. Clin Nephrol. 61(1):30-39.
Samson M, Soularue P, Vassart G, Parmentier M. (1996a). The genes encoding the human CC-chemokine receptors CC-CKR1 to CC-CKR5 (CMKBR1-CMKBR5) are clustered in the p21.3-p24 region of chromosome 3. Genomics. 36(3):522-526.

36
Samson M, Labbe O, Mollereau C, Vassart G, Parmentier M. (1996b). Molecular cloning and functional expression of a new human CC-chemokine receptor gene. Biochemistry. 35(11): 3362-3367. Samson M, Libert F, Doranz BJ, Rucker J, Liesnard C, Farber CM, Saragosti S, Lapoumeroulie C, Cogniaux J, Forceille C, Muyldermans G, Verhofstede C, Burtonboy G, Georges M, Imai T, Rana S, Yi Y, Smyth RJ, Collman RG, Doms RW, Vassart G, Parmentier M. (1996c). Resistance to HIV-1 infection in Caucasian individuals bearing mutant alleles of the CCR-5 chemokine receptor gene. Nature. 382(6593): 722-725. Sarwal M, Chua MS, Kambham N, Hsieh SC, Satterwhite T, Masek M, Salvatierra O Jr. (2003). Molecular heterogeneity in acute renal allograft rejection identified by DNA microarray profiling. N Engl J Med. 349(2):125-38. Saxena A, Panigrahi A, Gupta S, Dinda AK, Guleria S, Thakur B, Mitra DK. (2012). Frequency of T cell expressing Th1 and Th2 associated chemokine receptor in patients with renal allograft dysfunction. Transplant Proc. 44(1):290-5. Sayyed SG, Ryu M, Kulkarni OP, Schmid H, Lichtnekert J, Grüner S, Green L, Mattei P, Hartmann G, Anders HJ. (2011). An orally active chemokine receptor CCR2 antagonist prevents glomerulosclerosis and renal failure in type 2 diabetes. Kidney Int. 80(1):68-78. Schaub S, Nickerson P, Rush D, Mayr M, Hess C, Golian M, Stefura W, Hayglass K. (2009). Urinary CXCL9 and CXCL10 levels correlate with the extent of subclinical tubulitis. Am J Transplant. 9(6):1347-53. Scherer A, Gwinner W, Mengel M, Kirsch T, Raulf F, Szustakowski JD, Hartmann N, Staedtler F, Engel G, Klupp J, Korn A, Kehren J, Haller H. (2009). Transcriptome changes in renal allograft protocol biopsies at 3 months precede the onset of interstitial fibrosis/tubular atrophy (IF/TA) at 6 months. Nephrol Dial Transplant. 24(8):2567-75. Schlöndorff D, Nelson PJ, Luckow B, Banas B. (1997). Chemokines and renal disease. Kidney Int. 51(3):610-21. Segerer S, Nelson PJ, Schlöndorff D. (2000). Chemokines, chemokine receptors, and renal disease: from basic science to pathophysiologic and therapeutic studies. J Am Soc Nephrol. 11(1):152-76.
Segerer S, Cui Y, Eitner F, Goodpaster T, Hudkins KL, Mack M, Cartron JP, Colin Y, Schlondorff D, Alpers CE. (2001). Expression of chemokines and chemokine receptors during human renal transplant rejection. Am J Kidney Dis. 37(3):518-31.

37
Segerer S, Böhmig GA, Exner M, Kerjaschki D, Regele H, Schlöndorff D (2005). Role of CXCR3 in cellular but not humoral renal allograft rejection. Transpl Int. 18(6):676-80
Sidahmed AM, León AJ, Bosinger SE, Banner D, Danesh A, Cameron MJ, Kelvin DJ. (2012).CXCL10 contributes to p38-mediated apoptosis in primary T lymphocytes in vitro. Cytokine. 59(2):433-41.
Simeoni E, Vassalli G, Seydoux C, Ramsay D, Noll G, von Segesser LK, Fleury S. (2005). CCR5, RANTES and CX3CR1 polymorphisms: possible genetic links with acute heart rejection. Transplantation. 80(9):1309-1315.
Sis B, Mengel M, Haas M, Colvin RB, Halloran PF, et al.,(2010). Banff '09 meeting report: antibody mediated graft deterioration and implementation of Banff working groups. Am J Transplant. 10(3):464-71
Smith MW, Dean M, Carrington M, Winkler C, Huttley GA., Lomb DA, Goedert JJ, O'Brien TR, Jacobson LP, Kaslow R, Buchbinder S, Vittinghoff E, Vlahov D, Hoots K, Hilgartner MW, Hemophilia Growth and Development Study (HGDS), Multicenter AIDS Cohort Study (MACS), Multicenter Hemophilia Cohort Study (MHCS), San Francisco City Cohort (SFCC), ALIVE Study, O'Brien, SJ. (1997). Contrasting genetic influence of CCR2 and CCR5 variants on HIV-1 infection and disease progression. Science 277(5328): 959-965. Song A, Nikolcheva T, Krensky AM. (2000). Transcriptional regulation of RANTES expression in T lymphocytes. Immunol Rev.177:236-45. Song EY, McClellan WM, McClellan A, Gadi R, Hadley AC, Krisher J, Clay M, Freedman BI. (2009). Effect of community characteristics on familial clustering of end-stage renal disease. Am. J. Nephrol. 30(6):499-504.
Sun XH, Tan JM, Wu WZ, Lin WH, Li QS, Fang YH. (2003). [Significance of detecting urinary monocyte chemotactic peptide-1 in renal transplant recipient]. Xi Bao Yu Fen Zi Mian Yi Xue Za Zhi. 19(6):563-564.
Tatapudi RR, Muthukumar T, Dadhania D, Ding R, Li B, Sharma VK, Lozada-Pastorio E, Seetharamu N, Hartono C, Serur D, Seshan SV, Kapur S, Hancock WW, Suthanthiran M. (2004). Non-invasive detection of renal allograft inflammation by measurements of mRNA for IP-10 and CXCR3 in urine. Kidney Int. 65(6):2390-2397.
Thorburn E, Kolesar L, Brabcova E, Petrickova K, Petricek M, Jaresova M, Slavcev A, Striz I. (2009). CXC and CC chemokines induced in human renal epithelial cells by inflammatory cytokines. APMIS. 117(7):477-87.
Townson and Liptak. (2003). Chemokines in the corpus luteum: implications of leukocyte chemotaxis. Reprod Biol Endocrinol.1: 94.

38
Urushihara M, Ohashi N, Miyata K, Satou R, Acres OW, Kobori H. (2011). Addition of angiotensin II type 1 receptor blocker to CCR2 antagonist markedly attenuates crescentic glomerulonephritis. Hypertension. 57(3): 586-593. Van Coillie E, Van Damme J, Opdenakker G. (1999). The MCP/eotaxin subfamily of CC chemokines. Cytokine Growth Factor Rev. 10(1):61-86. Vassilatis DK, Hohmann JG, Zeng H, Li F, Ranchalis JE, Mortrud MT, Brown A, Rodriguez SS, Weller JR, Wright AC, et al. (2003). The G protein-coupled receptor repertoires of human and mouse. Proc Natl Acad Sci U S A. 100(8):4903–4908.
Wang E, Worschech A, Marincola FM. (2008). The immunologic constant of rejection.Trends Immunol. 29(6): 256-262.
Warshaw B, Kirk AD. (2011). Urinary chemokines CXCL9 and CXCL10 are noninvasive markers of renal allograft rejection and BK viral infection. Am J Transplant. 11(10): 2228-2234. Wong LM, Myers, SJ, Tsou CL, Gosling J, Arai H, Charo IF (1997). Organization and differential expression of the human monocyte chemoattractant protein 1 receptor gene: evidence for the role of the carboxyl-terminal tail in receptor trafficking. J. Biol. Chem. 272(2): 1038-1045. Wu Y, Yang L, Su T, Wang C, Liu G, Li XM. (2010). Pathological significance of a panel of urinary biomarkers in patients with drug-induced tubulointerstitial nephritis. Clin J Am Soc Nephrol. 5(11):1954-9. Yigit B, Bozkurt N, Berber I, Titiz I, Isbir T. (2007). Analysis of CC chemokine receptor 5 and 2 polymorphisms and renal transplant survival. Cell Biochem Funct. 25(4):423-6.
Yoshida T, Kato K, Fujimaki T, Yokoi K, Oguri M, Watanabe S, Metoki N, Yoshida H, Satoh K, Aoyagi Y, Nishigaki Y, Tanaka M, Nozawa Y, Kimura G, Yamada Y. (2009). Association of genetic variants with chronic kidney disease in Japanese individuals. Clin J Am Soc Nephrol. 4(5):883-90.
Yoshida S, Arakawa F, Higuchi F, Ishibashi Y, Goto M, Sugita Y, Nomura Y, Niino D, Shimizu K, Aoki R, Hashikawa K, Kimura Y, Yasuda K, Tashiro K, Kuhara S, Nagata K, Ohshima K. (2012). Gene expression analysis of rheumatoid arthritis synovial lining regions by cDNA microarray combined with laser microdissection: up-regulation of inflammation-associated STAT1, IRF1, CXCL9, CXCL10, and CCL5. Scand J Rheumatol. 41(3):170-9.
Zlotnik A, Yoshie O. (2000). Chemokines: a new classification system and their role in immunity. Immunity. 12(2):121-127.

39
Zlotnik A, Yoshie O. (2012). The chemokine superfamily revisited. Immunity. 25;36(5):705-16.

40
Material and Methods

41
2.1. Subjects:
The project was approved by the Ethical Review Committee (E.R.C),
SIUT. The project was in accordance of Helsinki declaration as well as
institutional guidelines. Renal patients transplanted during June 2009 to
January 2013 were included in this study. Informed consent was taken from all
the participating kidney donors and recipients.
2. 2. Methods:
2.2.1. Specimens: Blood and urine samples were collected at (a) operation
time (b) just before graft biopsy and (c) 1-10, 14, 20 and 60 day post-
transplant. Blood samples (4 ml) were collected in EDTA containing
vacutainers (Becton Dickinson®, Franklin Lakes, NJ, USA) and stored at 4°C
until DNA extraction. Urine samples (100 ml) were collected in sterile
containers and centrifuged in 50 ml falcon tubes at 3200 rpm for 20 minutes at
4°C. The urine supernatant was aliquoted in two separate (2 ml)
microcentrifuge tubes and a 50 ml sterile container. The samples were stored
at -80°C and used for quantification of chemokines by immunoassay.
The methods used in this thesis such as DNA isolation and
purification, polymerase chain reaction (PCR), restriction fragment length
polymorphism (RFLP) and enzyme-linked immunosorbent assay (ELISA) are
described in standard laboratory manuals (Sambrook and Russell, 2001).
2.2.2. DNA Isolation:
Genomic DNA was purified from whole blood by the standard phenol-
chloroform-isoamyl alcohol method. Whole blood (4 ml) was transferred to

42
falcon tube and 12 ml of red blood cell lysis buffer (RCLB; 0.15M ammonium
chloride, 10mM potassium bicarbonate, 0.5M EDTA, pH 7.4) was added for
red blood cell lysis. The samples were placed on ice for 30 minutes. The blood
samples were centrifuged at 1200 rpm for 10 minutes at 4°C. The supernatant
was discarded and pellet was resuspended in 10 ml RCLB. The centrifugation
step was repeated and supernatant was again discarded.
Lymphocytes obtained centrifugation, were resuspended in 4.5 ml of
Saline-Tris-EDTA buffer (STE buffer; 3M NaCl, 1M Tris pH 8.0 and 0.5M
EDTA pH 8.0). 250 ul of 10% sodium dodecyl sulphate (SDS) was added
drop-wise with gentle vortexing, followed by 5 µl of 20 mg/ml Proteinase-K.
The samples were incubated overnight for Proteinase-K digestion in a shaking
water bath at 55oC.
The following day, first extraction was performed with equal volumes
of Tris-equilibrated phenol (pH 8.0), mixed gently for 10 minutes and kept on
ice for 10 minutes. The samples were centrifuged at 3200 rpm for 30 minutes
at 4oC. The aqueous layer was carefully removed with the help of cut-off
micropipette tips (to avoid shearing of DNA) to a sterile 15 ml falcon tube.
The second extraction was performed with an equal volume of chloroform-
isoamyl alcohol (24:1 v/v). The sample was mixed gently for 10 minutes,
placed on ice for 10 minutes and then centrifuged at 3200 rpm for 30 minutes
at 4oC. The aqueous layer was collected in another 15 ml falcon tube.
The nucleic acid (DNA) was precipitated by adding 10M ammonium
acetate (one tenth the volume of aqueous layer) and an equal volume of
isopropanol. It was mixed gently to precipitate DNA and stored at -20oC
overnight.

43
The next day, DNA was pelleted by centrifugation at 3200 rpm for 60
minutes at 4oC. The DNA pellet was washed with 70% ethanol and
centrifuged at 3200 rpm for 40 minutes. The DNA pellet was air dried and
resuspended in 500 ul of Tris-EDTA buffer (TE: 10mM Tris, 1mM EDTA, pH
8.0).
2.2.3. Quantification of DNA Samples:
The optical density (O.D) of DNA samples was measured at 260nm
and 280nm using a spectrophotometer (Lambda EZ-201, Perkin Elmer®, USA)
and DNA concentration was calculated by the following formula:
Absorbance at 260nm x dilution factor x 50 = DNA concentration (µg/ml)
Where, 50 = Correction factor for double stranded DNA.
The DNA absorbance ratio (OD260/OD280) of 1.7-2.0 was used for
chemokine receptor gene polymorphisms (CCR2V64I, CCR5-59029G>A and
CCR5Δ32).
2.2.4. Polymerase Chain Reaction:
The polymerase chain reaction was performed with GoTaq®, flexi
DNA polymerase kit (Promega®, Medison, WI, USA). The reaction
(Master Mix) for PCR was prepared, containing 1X PCR buffer, 1.5mM
MgCl2, 0.1mM dNTPs, 0.9U Taq Polymerase, 0.3µM of each Primers
(forward and reverse) and 50-75ng of genomic DNA in a total volume of 15µl.

44
The polymerase chain reaction was used to amplify polymorphic
region of a) CCR2V64I b) CCR5-59029G>A and c) CCR5Δ32 under specific
PCR conditions. The detailed methodology for genotyping of each gene is
provided in the following section.
2.2.4.1. Genotyping of CCR2V64I:
The CCR2V64I polymorphic region was amplified under specific PCR
conditions by using sequence specific primers (SSPs) described by Abdi et al.,
2002. The preparation of PCR master reaction mix were used are described in
Table 2.1.
Table 2.1: Polymerase chain reaction condition for genotyping of
CCR2V64I
PCR Reaction Mix Working Concentration
Required vol. per reaction
PCR Buffer II (10X ) 1X 1.50ul
MgCl2 (25mM) 1.5mM 0.90ul
dNTPs (2.5mM) 100uM 0.75ul
Taq Polymerase (2U/ul) 0.9U 0.45ul
Primers (forward; 10uM) 0.3uM 0.45ul
Primers (reverse;10uM) 0.3uM 0.45ul
Deionized water 9.2ul
DNA sample (50ng/ul) 65ng 1.3ul
Total volume 15.00ul

45
The PCR was performed using a thermal cycler (Gene Amp® PCR
System 9700, Applied Biosystems, USA). The thermal cycling conditions for
CCR2V64I are given below
Thermal Cycler Conditions:
1 cycle of 95C for 4 minutes (DNA denaturation step)
35 cycles of 94C for 30 seconds (DNA denaturation step)
65C for 45 seconds (Primer annealing step)
72C for 1 minute (Extension step)
1 cycle of 72C for 7 minutes (Final extension)
Hold 4ºC
The amplified PCR product size of CCR2V64I was 173 bp; and correct
fragment size was ascertained on agarose gel electrophoresis using 100 bp
DNA ladder (Promega®, Medison, WI, USA).
2.2.4.2. Genotyping of CCR5-59029G>A:
The PCR was used to amplify CCR5-59029G>A promoter region
under specific PCR conditions by using SSPs described by Abdi et al., 2002.
The master reaction mix for CCR5-59029G>A is described in Table 2.2.
Thermal cycler conditions were same as given above for CCR2V64I.
The PCR amplified product size of CCR5-59029G>A was 268 bp. Agarose
gel electrophoresis with a 100 bp ladder was performed to visualize the PCR
product of the CCR5 gene.

46
Table 2.2: Polymerase chain reaction condition for the genotyping of
CCR5-59029G>A
PCR Master Reaction Mix
Working
Concentration
Required vol. per
reaction
PCR Buffer (II) 10X 1X 1.50ul
MgCl2 (25mM) 1.5mM 0.90ul
dNTPs (2.5mM) 100uM 0.75ul
Taq Polymerase (2U/ul) 0.9U 0.45ul
Primers (forward;10uM) 0.3uM 0.45ul
Primers (reverse;10uM) 0.3uM 0.45ul
Deionized water 9.0ul
DNA sample (50ng/ul) 75ng 1.5ul
Total volume 15.00ul
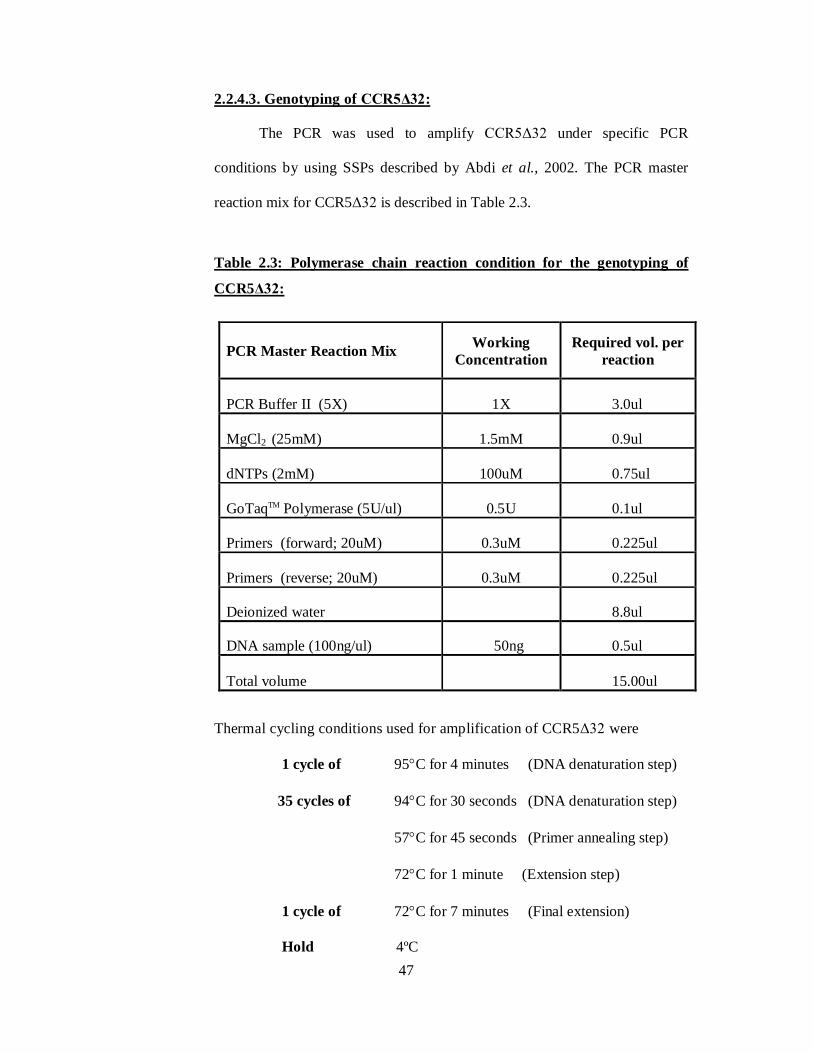
47
2.2.4.3. Genotyping of CCR5Δ32:
The PCR was used to amplify CCR5Δ32 under specific PCR
conditions by using SSPs described by Abdi et al., 2002. The PCR master
reaction mix for CCR5Δ32 is described in Table 2.3.
Table 2.3: Polymerase chain reaction condition for the genotyping of
CCR5Δ32:
Thermal cycling conditions used for amplification of CCR5Δ32 were
1 cycle of 95C for 4 minutes (DNA denaturation step)
35 cycles of 94C for 30 seconds (DNA denaturation step)
57C for 45 seconds (Primer annealing step)
72C for 1 minute (Extension step)
1 cycle of 72C for 7 minutes (Final extension)
Hold 4ºC
PCR Master Reaction Mix Working Concentration
Required vol. per reaction
PCR Buffer II (5X) 1X 3.0ul
MgCl2 (25mM) 1.5mM 0.9ul
dNTPs (2mM) 100uM 0.75ul
GoTaqTM Polymerase (5U/ul) 0.5U 0.1ul
Primers (forward; 20uM) 0.3uM 0.225ul
Primers (reverse; 20uM) 0.3uM 0.225ul
Deionized water 8.8ul
DNA sample (100ng/ul) 50ng 0.5ul
Total volume 15.00ul

48
The PCR amplified products were analyzed on a 3% agarose gel
electrophoresis to identify CCR5Δ32.
The CCR5Δ32 polymorphism was scored on the presence or absence
of the 32 base pair fragment. The amplicon size of a 233 bp showed wild type
while a 201 bp indicated a 32 bp deletion fragment of CCR5. (Fig 2.1)
2.3. Agarose Gel Electrophoresis:
Agarose gel electrophoresis was used to ascertain amplification of
CCR2V64I, CCR5-59029G>A and CCR5Δ32. 3% agarose gel (Promega®,
Madison, WI, USA) was prepared by adding 9g of agarose to 300 ml with 1X
TBE buffer [(10X TBE: Tris base (0.6M), Boric acid (0.9M), disodium EDTA
(25mM) pH 8.0)]. The agarose suspension was heated in a loosely capped
bottle till completely dissolved. 5µl of Ethidium bromide (10mg/ml) was
added, mixed and then placed in a water shaking bath at 55ºC for 10 min. The
gel was poured into the casting tray of a horizontal gel electrophoresis (Sigma
Chemical Co. ST. Louis, USA.) having 3mm comb. The comb was withdrawn
from solidified gel and the gel was placed in a buffer tank containing
sufficient 1X TBE buffer to cover it.
The PCR product (5ul) was mixed with 5ul of Orange G loading dye
[6X Orange G loading dye containing 0.125% Orange-G, 20% Ficoll and
0.5M EDTA, pH 8.0) and loaded into the wells with the help of micro-
pipettor. 5ul of DNA molecular weight marker (100bp DNA ladder;
Promega®, Madison, WI, USA) having band size ranging from 100-1500bp
was loaded in each gel.

49
Gel electrophoresis was carried out at a constant 200 volts for 30
minutes. The gel bands were examined under ultraviolet light (UV). The gels
were annotated and recorded using a gel documentation system (Gel Doc
System®, Bio- Rad, Milan, Italy).
After getting the specific PCR product of CCR2V64I and CCR5-
59029G>A on gel electrophoresis, the PCR product was used for restriction
fragment polymorphisms analysis.
2.4. Restriction Fragments Length Polymorphisms (RFLP):
Restriction Fragment length polymorphisms is a method to detect
difference in homologous DNA sequence. This technique is based on a
nucleotide base change that results in the creation or abolition of restriction
site. This region is amplified by designing primers for a flanking region of
restriction site. The amplified products are subsequently digested with
appropriate restriction enzyme under appropriate conditions. The banding
patterns are analyzed using 3% agarose gel.
The functional polymorphisms of CCR2V64I and CCR5-59029G>A
were investigated by RFLPs method, using restriction enzymes. The detailed
condition for RFLPs for CCR2 and CCR5 are given below.
2.4.1. Restriction Fragments Length Polymorphisms of CCR2V64I:
The reaction mix and condition for the RFLPs assay of CCR2V64I are
described in Table 2.4.

50
Table 2.4: Reaction mix for restriction fragment polymorphism
CCR2V64I:
Reagents Volume / Reaction
CCR2V64I amplified product (173 bp)
Water
10X buffer O
BsaBI enzyme (10u/µl)
10.0µl
9.4µl
1.0µl
0.2µl
10µl of the PCR products were digested with 2U BseJI (BsaBI:
Fermentas®, Life Sciences) for CCR2V64I with 10X buffer O at 65ºC
overnight in water bath. The DNA banding pattern of CCR2V64I was
recorded using gel documentation system and results were used for statistical
Figure 2.2 analysis.
2.4.2. Restriction fragment length polymorphism of CCR5-59029G>A:
The PCR product (268bp) of CCR5-59029G>A was digested with
Bsp12861 (Fermentas®, Life Sciences) for overnight at 37°C to find out the
presence of polymorphism (G or A) at 59029 (Table 2.5).
10µl of the PCR products were digested with 2U of Bsp12861 for
CCR5-59029G>A with Buffer 10X (Bsp12861 at 37ºC overnight in water
bath. The digested products were run on 3% agarose gel at a constant 200
volts for 30 minutes. DNA banding pattern was recorded using gel
documentation system and data were analyzed for statistical analysis

51
Table 2.5: Reaction mix for restriction fragment length polymorphism of
CCR5-59029G>A
Reagents Volume / Reaction
PCR Product (268bp)
Water
Buffer 10X (Bsp12861)
Bsp12861 Enzyme (10u/µl)
10.0µl
18.8µl
2.0µl
0.2µl
.

52
Figure 2.1: Genotyping of CCR5Δ32. It shows heterozygous at CCR5Δ32
(double bands) and wild type (no CCR5Δ32 region; a single band)

53
Figure 2.2: Genotyping of CCR2V64I. The BsaBI restriction enzyme
digested the PCR product (173 bp) of CCR2V64I yielded two fragments of
149 bp and 24 bp due to the presence of homozygous AA genotype; whereas
the 173 bp amplicon of CCR2 remained uncut, indicate the presence of
homozygous GG genotype. Further, two bands of 173 bp and 149 bp were
observed in heterozygous GA genotype on 3% agarose gel.
Heterozygous GA Homozygous GG Homozygous AA

54
Figure 2.3: Genotyping of CCR5-59029G>A. The Bsp12861 result a single
fragment of (130 bp) for homozygous genotype (GG), two fragments of 130
bp and 258 bp for the heterozygous (GA) genotype and un-cut fragments for
homozygous (AA).

55
2.5. Quantification of Urinary Chemokines using Enzyme-Linked
Immunosorbent Assay (ELISA):
An enzyme-linked immunosorbent assay (ELISA) was used to measure
the urinary levels of a) human interferon induced protein-10 (CXCL10/IP-10)
b) human monokine induced by interferon-gamma (CXCL9/MIG) and c)
human CCL2/MCP-1 using R&D Systems ELISA kits (R&D Systems;
Minneapolis, MN, USA). The detailed methodology for each chemokine
analysis is described in the section below.
2.5.1. Human Interferon-Gamma Inducible Protein-10:
Urinary Human IP-10 concentration was measured in urine samples of
transplant patients using the Human urinary IP-10/CXCL10 ELISA kit
(Quantikine®, R&D Systems; Minneapolis, MN, USA). The IP-10 stock
standard, working standard dilutions and samples were prepared and assayed
as described in the kit manual.
Initially, the IP-10 stock standard of 5000pg/ml was prepared by
reconstituting 5ng of standard with 1ml of deionized water. This IP-10 stock
standard was used for making serial dilution of standards (STD) of various
concentrations such as 500pg/ml (STD-1), 250pg/ml (STD-2), 125pg/ml
(STD-3), 62.5pg/ml (STD-4), 31.2pg/ml (STD-5), 15.6pg/ml (STD-6) and
7.8pg/ml (STD-7).
The STD-1 (500pg/ml) was prepared by pipetting 100ul of IP-10 stock
standard (5000pg/ml) and mixed with 900ul RD5K calibrator diluents in a
1.5ml microcentrifuge tube. For Serial dilution of standards (STD-2 – STD-7)
500ul of calibrator diluent was pipetted into 6 separate 1.5ml microcentrifuge
56
tubes. The STD-2 was prepared by pipetting 500ul of STD-1 and mixed with
500ul of calibrator diluent in 1.5ml tube. Similarly, other working standards
(STD-3 – STD-7) were prepared.
The plate lay-out was prepared in such a way that first standard (high
concentration to the lowest concentration standards), then blanks (H1and H2)
and at last, urine samples (A3–H12) were assigned wells. All working
standards, blanks and samples were assayed in duplicate. Initially, 150uL of
Assay diluent RD1-56 (RD1-56: buffered protein base with preservative) was
added to each plate well. As per plate lay-out, 100ul of each STD (500pg/ml,
250pg/ml, 125pg/ml, 62.5pg/ml, 31.2pg/ml, 15.6pg/ml and 7.8pg/ml), 100ul
of assay diluent as a blank and 100ul of urine sample was added to the
respective wells. The plate was covered by an adhesive strip and incubated for
2 hours at room temperature.
After incubation period, each well was aspirated and washed 4 times
with wash buffer (wash buffer was prepared by taking 20ml of wash buffer
and q.s. to 500ml with deionized water). Finally, the plate was inverted and
blotted on tissue paper to soak any remaining buffer.
Anti-human IP-10 conjugate (200ul) was added into each well. The
plate was covered by an adhesive strip and incubated for 2 hours at room
temperature. After incubation, each well was aspirated and washed 4 times
with wash buffer and blotted as before. Freshly prepared Substrate solution
(200ul) was added to each well and incubated for 30 minutes at room
temperature in darkness. 50ul of stop solution was added to each well which
resulted in a change of colour from blue to yellow.

57
The optical density of each sample was determined using a microplate
reader (Synergy 2, BioTek® Instrument, Inc., USA). The plate was read at
450nm with the wavelength correction was set at 540nm. A standard curve
was generated using standards (STD-1 to STD-7) and concentration in urine
samples was calculated using Gen5 (version 1.08) data collection and analysis
software.
The measured urinary level of IP-10 was used for association with
renal outcome using statistical software.
2.5.2. Human Monokine Induced by Interferon-Gamma:
Human MIG concentration in urine samples was another chemokine
used to investigate for rejection and non-rejection, stable graft and controls
using Human CXCL9/MIG ELISA kit (Quantikine®, R&D Systems;
Minneapolis, MN, USA).
First the MIG stock standard and working standards were prepared.
MIG stock of 20,000pg/ml was prepared by reconstituting 20ng of standard
with 1ml of deionized water. The MIG stock standard was used for making
serial dilution of standards (STD) such as 2000pg/ml, 1000pg/ml, 500pg/ml,
250pg/ml, 125pg/ml, 62.5pg/ml, 31.2pg/ml and 15.6pg/ml.
The STD-1 (2000pg/ml) was prepared by adding 100ul of MIG stock
standard (20,000pg/ml) and mixed with 900ul RD5P (2.5X) calibrator diluent
[RD5P (2.5X); 10ml of RD5P q.s. to 20ml with deionized water)] in a 1.5ml
microcentrifuge tube. Serial dilutions of other working standards (STD-2 to
STD-8) was prepared by pipetting 500ul of calibrator diluent into 7 separate
microcentrifuge tubes of 1.5ml for each standard. The STD-2 was prepared by

58
pipetting 500ul of STD-1 and mixed with 500ul of calibrator diluents of STD-
2 tube. Similarly, other working standards from STD-3 to STD-8 were
prepared.
Initially, 100uL of assay diluent RD1W (RD1W: buffered protein base
with preservatives) were added to each plate well. 100ul of each standard
(2000pg/ml, 1000pg/ml, 500pg/ml, 250pg/ml, 125pg/ml, 62.5pg/ml,
31.2pg/ml and 15.5pg/ml) were pipetted from high concentration standard to
lowest concentration standard. For a blank, 100ul of assay diluent RD1W was
added to wells (H1 and H2). 100ul of urine sample was added to respective
wells. The plate was covered by adhesive strip and incubated for 2 hours at
room temperature.
After incubation, each well was aspirated and washed four times with
wash buffer (wash buffer; 20ml of wash buffer q.s. to 500ml with deionized
water). Finally, the plate was inverted and blotted against tissue paper to soak
any remaining buffer.
Anti-human MIG conjugate (200ul) was added into each well. The
plate was covered by adhesive strip and incubated for further 2 hours at room
temperature. After incubation, each well was aspirated completely and washed
four times with wash buffer. Substrate solution (200ul) was added to each
well and incubated for 30 minutes at room temperature in darkness. 50ul of
Stop solution was added to each well which resulted in a change of color from
blue to yellow.
The optical density of each sample was determined using the
microplate reader (Synergy 2, BioTek® Instrument, Inc., USA). The plate was
read at 450nm with the wavelength correction was set at 540nm. The standard

59
curve was generated based on standards (STD-1 to STD-8) and concentration
of samples was calculated using microplate data collection and analysis
software, Gen5 version 1.08.
The measured concentration of urinary level of MIG was used for
association with renal outcome using statistical software.
2.5.3. Human Monocyte Chemotactic Protein-1:
The quantitative determination of Human MCP-1/CCL2 concentration
was investigated in urine samples of transplant patients (stable graft, rejection
and control). Human urinary MCP-1/CCL2 was quantified by ELISA
(Quantikine®, R&D Systems; Minneapolis, MN, USA).
The MCP-1 stock standard (2000pg/ml) was prepared by
reconstituting 10ng of standard with 5ml of RD5L (1X) calibrator diluent
[RD5L (1X); 10ml of RD5L and 40ml of deionized water)]. This MCP-1 stock
standard was used for making serial dilution of various working standards
(STD) such as 1000pg/ml (STD-1), 500pg/ml (STD-2), 250pg/ml (STD-3),
125pg/ml (STD-4), 62.5pg/ml (STD-5) and 31.2pg/ml (STD-6).
The plate lay-out was prepared by assigning wells for MCP-1
standards (A1-G2), blanks (H1 and H2) and urine samples (A3-H12) and all
samples (standards, blanks and urine samples) were assayed in duplicate. As
per lay-out, 200ul of each working standards were pipetted from high
concentration standard (STD-1; 1000pg/ml, in A1 and A2 wells) to lowest
concentration standard (STD-6; 31.2pg/ml, in G1 and G2 wells). The 200ul of
calibrator diluent was added to each well (H1 and H2), as a blank. As 2-fold
dilution of urine samples was recommended, 100ul of calibrator diluent was

60
added followed by adding 100ul of urine sample to each well. The plate was
covered by adhesive strip and incubated for 2 hours at room temperature.
After the incubation period, fluid from each well was aspirated
completely, followed by washing steps. In the washing procedure, each well
was filled with 400ul of wash buffer (wash buffer was prepared by taking;
20ml of wash buffer and q.s. to 500ml with deionized water). The wash buffer
was aspirated completely from each well. This washing procedure was
repeated 3 times and, at last, the plate was inverted and blotted against tissue
paper to soak any remaining buffer.
Anti-human MCP-1 conjugate (200ul) was added to each well and
the plate was covered with adhesive strip and incubated for 1 hour at room
temperature. After incubation, fluid from each well was aspirated and washed
3 times as performed previously.
Freshly prepared 200ul of Substrate solution [(substrate solution;
12.5ml of stabilized hydrogen peroxide (solution A) was mixed with 12.5 ml
of stabilized chromogen, (tetramethylbenzidine; solution B)] were added in
each well and incubated for 20 minutes at room temperature in darkness. The
blue colour of various intensities was observed in working standards and
samples. 50ul of Stop solution (2N sulphuric acid) was added to each well
which resulted in change of blue colour to yellow colour. Finally, the plate
was read for the quantification of urinary MCP-1.
The optical density of samples was read using the microplate reader
(Synergy 2, BioTek® Instrument, Inc., USA). The plate was read at 450nm
with the wavelength correction set at 540nm. The standard curve was
generated based on standards and concentration of samples was calculated by

61
the microplate data collection and analysis software, Gen5 version 1.08.
The measured concentration of MCP-1 was multiplied by 2 (dilution
factor), as samples were diluted. The concentration of MCP-1 was used for
association with renal outcome using statistical software.
2.6. Histopathological Classifications:
Renal allograft biopsy is a standard gold method to evaluate
undetermined cause of renal dysfunctional or recurrent glomerular disease. It
is an invasive procedure which is performed on the renal graft by indication of
delayed graft functioning, increase in serum creatinine levels (acute or
chronic) by at least 20% of the baseline levels, proteinuria >1g (Racusen et
al., 1999; Serón et al., 2008; Kazi and Mubarak, 2012). In this thesis, all the
renal allograft biopsies were indicated (i.e. unknown cause of increased serum
creatinine levels by 20%).
Renal graft tissues were microscopically examined for pathological
features by pathologists, at the Department of Pathology, SIUT. The
pathological conditions were categorized according to Banff 97 classification
and its updates (Racusen et al., 1999). The major histopathological findings
include rejection (cellular or vascular rejection), drug toxicity, pyelonephritis,
interstitial fibrosis and tubular atrophy etc. These histopathological events
occurred as a single event or a combination of events.
62
2.7. Statistical Analysis:
The data were analyzed using Statistical Package for Social Sciences
for Windows® (SPSS® version 17; SPSS Inc., Chicago, IL, USA) and
MedCalc® statistical software (version 12.7.5) for Windows®
(http://www.medcalc.org/). The specific tests were applied to analyze data and
explained in detail in their respective chapters.

63
2.8. References:
Abdi R, Tran TB, Sahagun-Ruiz A, Murphy PM, Brenner BM, Milford EL, McDermott DH. (2002). Chemokine receptor polymorphism and risk of acute rejection in human renal transplantation. J Am Soc Nephrol. 13(3):754-8.
Kazi JI and Mubarak M (2012). Chapter 10: Pathology of Renal Transplantation. In: Topics in Renal Biopsy and Pathology. Eds. Dr. Muhammed Mubarak; 159 – 180.
Racusen LC, Solez K, Colvin RB, Bonsib SM, Castro MC, Cavallo T, Croker BP, Demetris AJ, Drachenberg CB, Fogo AB, Furness P, Gaber LW, Gibson IW, Glotz D,Goldberg JC, Grande J, Halloran PF, Hansen HE, Hartley B, Hayry PJ, Hill CM,Hoffman EO, Hunsicker LG, Lindblad AS, Yamaguchi Y, et al.( 1999). The Banff 97 working classification of renal allograft pathology. Kidney Int. 55(2):713-23
Sambrook J and Russell DW. (2001). Preparation and analysis of eukaryotic genomic DNA. In: “Molecular Cloning – A laboratory Manual.” 3rd edition. Eds. Sambrook J., Russell DW. Cold Spring Harbor Press, New York pp 6.1-6.62. Serón D, Anaya F, Marcén R, del Moral RG, Martul EV, Alarcón A, Andrés A, Burgos D, Capdevila L, Molina MG, Jiménez C, Morales JM, Oppenheimer F, Pallardó L, Fructuoso AS. (2008). Guidelines for indicating, obtaining, processing and evaluating kidney biopsies. Nefrologia.28:385-96.

64
3. The effect of chemokine receptors genes polymorphisms
(CCR2V64I, CCR5-59029G>A and CCR5Δ32) on renal
allograft survival in Pakistani transplant patients.

65
3.1. Introduction:
Recent advances in understanding the role of the immune system in
kidney allograft tolerance has markedly improved the short-term graft survival
rate (<15% acute rejection/year; Nankivell and Alexander, 2010). However,
long-term graft survival is still a major problem. Events that may influence the
short and long-term graft survival include acute rejection, chronic rejection,
interstitial fibrosis and tubular atrophy (IFTA) and delayed graft function.
Several immune-regulatory molecules have been implicated in allograft
rejection. Variations in the genes that encode these molecules have been
shown to influence their expression and function. Chemokines and their
receptors are implicated in kidney transplant rejection (Fischereder and
Schroppel, 2009; Goldfarb-Rumyantzev et al., 2010; Bedognetti, 2011).
Chemokine receptor 2 (CCR2) is specific for the monocyte
chemotactic protein-1 (MCP-1). It is expressed on the surface of monocytes,
activated memory T cells, B cells and basophils. It plays an important role in
attracting the monocytes and T-cells to the site of injury. A point mutation (G
to A) in the CCR2 gene at codon position 64 leads to an amino acid change
from valine to isoleucine (V64I) in the trans-membrane region of the protein.
This polymorphism has been shown to be correlated with the reduction of
CCR2 function in the antiallograft immune response and to be involved in the
down modulation of CCR5 expression which plays an important role in graft
rejection (Segerer et al., 2001; Nakayama et al., 2004). CCR2+/64I
(heterozygous for minor allele) and CCR2-64I/64I (homozygous for minor
allele) have been found to be associated with the reduced incidence of
rejection episodes (Hancock, 2002; Yigit et al., 2007; Singh et al., 2008).

66
Contradictory results have been reported by Gorgi et al. (2011), who have
concluded that the CCR2-64I allele is involved in an increased risk of acute
rejection in Tunisian allograft recipients.
The pro-inflammatory chemokines, RANTES (regulated on activation
normal T-cell expressed and secreted protein) and MIP-1 (macrophage
inflammatory protein-1) interact specifically with the CCR5 receptor. This
receptor is expressed on activated memory T cells, natural killer cells,
immature dendritic cells and monocytes/macrophages. It is involved in the
inflammatory response, immune cell trafficking, angiogenesis and metastasis.
Polymorphisms of the CCR5 gene have been shown to be associated with
renal allograft rejection (Krensky and Clayberger, 2011). A promoter region
polymorphism (59029G>A) of CCR5 increases the expression level and
subsequently its activity by attracting monocytes or T-cells. Therefore, the
allograft recipients carrying the A/A genotype of CCR5-59029G>A
polymorphism have poor graft survival or repeated rejection episodes (Cha et
al., 2009). Conflicting results have also been reported in different populations
that show a reduction of the incidence of AR in the A/A and G/A genotypes
(Abdi et al., 2002; Yigit et al., 2007; Omrani et al., 2008). The other mutant
form of CCR5 gene is CCR5Δ32, in which the deletion of a 32 base-pair
sequence results in a nonfunctional receptor (Omrani et al., 2008).
Fischereder et al., (2001) have shown that the mutant receptor significantly
influences renal allograft survival. These observations suggest that the same
genetic variation may play different roles in different ethnic groups in the
context of allograft outcome.

67
This study was carried out to determine the role of polymorphisms of
the CCR2 and CCR5 genes in long term graft survival among kidney allograft
recipients in our population. The effects of the donor’s genotype on the
allograft outcome were also evaluated.
3.2. Material and Methods:
This study was conducted on consecutive patients that received kidney
transplants between June 2009 and February 2011 at the Sindh Institute of
Urology and Transplantation (SIUT). The research protocol was approved by
the Institutional Review Board and conformed to the Tenets of the Declaration
of Helsinki. Written informed consent was obtained from all the subjects.
Inclusion and Exclusion Criteria of Patients and Donors:
All patients undergone live-related renal transplant procedure for the
first time. Recipients received kidney from their blood/law related donors
(N=606). Donors were selected after comprehensive pre-transplant evaluation
i.e. examination for the presence of any disease, donor-recipient
immunological match, non-obese (Body Mass Index of 18-25) etc.
During post-transplantation, patients with unknown cause of renal
dysfunction underwent renal graft biopsy procedure. Based on Banff 97
classification and its updates, the cases were categorized as rejection (non-
stable group) and non-rejection (stable group) (Racusen et al., 1999).
A total of one thousand two hundred and twelve (1212) individuals
from different regions of Pakistan have been included in this study. The cohort
consists of six hundred and six (n=606) renal transplant recipients and an
equal number of relatives who were living donors.

68
Complete demographic data including age, gender and relationship of
donors with the recipients are summarized in Table 3.1. Pre-operative data and
post-operative data are provided in Table 3.2.
Table 3.1. Description of Recipients and Donors
* Consanguineous ♦ Cousins Table 3.2. Pre- and Post-operative parameters of patients.
Cold Ischemic Time (minutes) 122.11±26.18 (minutes) HLA Match(A/B/DR)
Identical match 109 (18.1%)
Non-identical match 493 (81.8%) Induction
No induction 521 (86%)
ATG 51 (8.4%)
Simulect 34 (5.6%)
Immunosuppressive drugs therapy
Cyclosporine 461(76.1%)
Tacrolimus 59 (9.7%)
Cyclosporine to tacrolimus 85 (14%)
Tacrolimus to cyclosporine 1 (0.2%)
Donors Recipients
Total Number (n) 606 606
Gender
Female 257 (42.4%) 125 (20.6%)
Male 349 (57.6%) 481 (79.4%)
Mean Age 34.89 ± 10.15 30.13 ±10.73
Relation of recipient with donor
Sibling 332 (54.8%)
Parents 156 (25.7%)
Offspring 42 (7%)
Wife/ Husband * 58 (9.6%) / 8 (1.3%)
Other blood relatives♦ 10 (1.6%)

69
3.2.1. Genotyping of CCR2V64I, CCR5-59029G>A and CCR5Δ32
Polymorphisms:
Blood samples (4 ml) of each recipient and donor were collected in
EDTA containing vacutainers before renal transplantation. DNA was purified
by the standard phenol-chloroform-isoamyl alcohol method as described
earlier.
The genotyping of CCR2V64I, CCR5-59029G>A and CCR5Δ32
polymorphisms was performed with some minor modifications using specific
primers as described by Abdi et al. (2002). The detailed methods are given
above in the materials and methods section. The primer sequences for
amplification of CCR2V64I, CCR5-59029G>A and CCR5Δ32
polymorphisms and their product sizes are listed in Table 3.3.
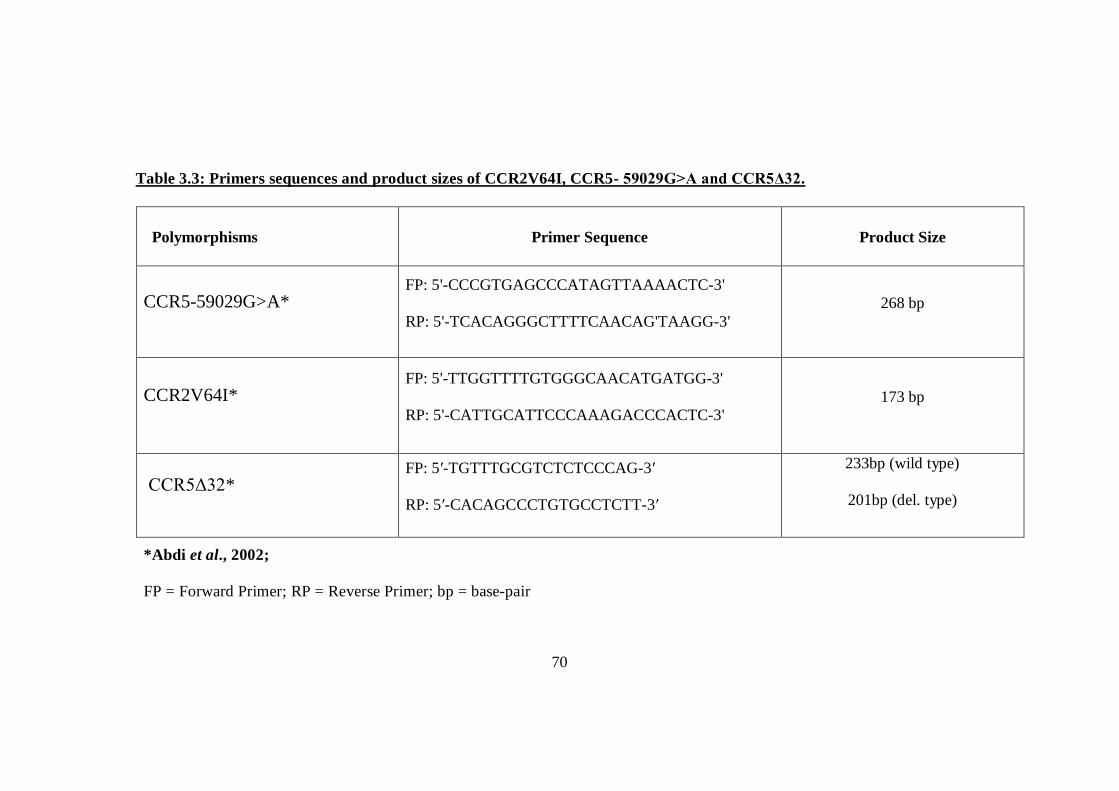
70
Table 3.3: Primers sequences and product sizes of CCR2V64I, CCR5- 59029G>A and CCR5Δ32.
*Abdi et al., 2002;
FP = Forward Primer; RP = Reverse Primer; bp = base-pair
Polymorphisms Primer Sequence Product Size
CCR5-59029G>A* FP: 5'-CCCGTGAGCCCATAGTTAAAACTC-3'
RP: 5'-TCACAGGGCTTTTCAACAG'TAAGG-3' 268 bp
CCR2V64I* FP: 5'-TTGGTTTTGTGGGCAACATGATGG-3'
RP: 5'-CATTGCATTCCCAAAGACCCACTC-3' 173 bp
CCR5Δ32* FP: 5′-TGTTTGCGTCTCTCCCAG-3′
RP: 5′-CACAGCCCTGTGCCTCTT-3′
233bp (wild type)
201bp (del. type)

71
3.2.2 Statistical Analysis:
The clinical and genotyping data for the patients and controls were
analyzed using the Statistical Package for Social Sciences software (SPSS
version 17; SPSS Inc., Chicago, IL, USA). The χ² goodness of fit test was used
to check Hardy-Weinberg Equilibrium (HWE). The association of CCR2V64I,
CCR5-59029G>A and CCR5Δ32 with clinical features was analyzed using the
chi-squared test of independence with the appropriate degree of freedom. The
strength of the association was measured by odds ratio (OR) with a 95%
confidence interval (CI). A p-value of less than 0.05 was considered to be
significant. Statistical significant factors were selected as co-variable in binary
logistic regression to model the event probability for a categorical response
variable i.e. rejection or non-rejection. The cumulative rejection-free survival
time of renal allograft was calculated by Kaplan-Meier (KM) curve and the
log-rank test was used to calculate the statistical significance for the mean
time of renal allograft rejection among the CCR2 and CCR5 polymorphism
genotypes.
3.3. Results:
A total of 1212 kidney transplant recipients and their donors were
analyzed in this study. The patients’ data are summarized in Table 3.1 and 3.2.
All the allografts were from living, genetically related donors. This study was
categorized into different parts in order to better understand the role of CCR2
and CCR5 gene polymorphisms in transplant rejection. At first, the overall
frequencies of CCR2V64I, CCR5-59029G>A and CCR5Δ32 genotypes were
analyzed between donors and recipients as shown in Table 3.4. In the second

72
step, the transplant recipients were classified into two groups on the basis of
biopsy proven graft status; stable graft function group (non-rejecters) and non-
stable graft function group (rejecters). The demographic characteristics of
patients with stable and non-stable graft are given in Table 3.5a. Both groups
were compared for the chemokine receptor gene polymorphisms. The
genotypic frequencies of both the groups are given in Table 3.5b. The effects
of donor genotypes on the outcome and survival of allograft were also
analyzed (Table 3.6). Lastly, the role of the donor’s gender on the outcome of
allograft related to chemokine receptor gene polymorphisms was evaluated
(Table 3.7).
The overall occurrence of rejection in our patient cohort was 26%
while 74% patients had stable graft function. Out of the 26% allograft
rejection patients, only 6% patients required post transplant dialysis. The
stable graft group included 353 (78.6%) males and 96 (21.4%) females while
the non-stable graft group comprised of 128 (81.5%) males and 29 (18.5%)
females. There was no difference in the mean age of the stable graft vs. the
non-stable graft groups (30±10 years). The mean time for cold ischemia
between the stable and non-stable graft groups was almost the same (122±25
and 121±28 minutes respectively).
3.3.1. Association of CCR2V64I genotypes and alleles with renal allograft
rejection:
For the analysis of CCR2V64I polymorphism, DNA from 606 renal
allograft recipients and 573 donors was screened. The overall frequency of
CCR2-64V (G) allele was 91% in the recipients and 90.9% in the donors. The

73
CCR2-64I (A) allele was present in 9% recipients and 9.1% donors. The
frequencies for the three possible genotypes i.e. GG, GA, AA were 82.2%,
16% and 1.2% in the recipients and 82.5%, 16.8% and 0.7% in the donors
respectively (Table 3.4). The donor and recipient populations were in Hardy-
Weinberg Equilibrium (HWE) with respect to the CCR2V64I genotypes
(χ²=0.88, 1 df; P>0.05 and χ²=0.13, 1 df; P>0.05 respectively).
In the non-stable graft group, the frequency of CCR2 GG genotype
was higher (90%) when compared with the stable graft group (80%). The GG
genotype is significantly associated with a high risk of graft rejection with a
P=0.009, OR=2.14 (95% CI=1.2-3.7). However, the CCR2 G/A genotype
(P=0.005, OR=0.4, 95% CI=0.2-0.7) alone and in combination with the A/A
(P=0.009, OR=0.4, 95% CI=0.2-0.8) was associated with a reduced risk of
graft rejection (Table 3.5b).
Further, the effect of the genotype of the donor on the graft outcome
was also investigated. It was observed that the frequency of CCR2 G/G
genotype was slightly higher in the donors for the non-stable graft group
(85.2%) as compared to the stable graft group (81.6%) while the frequency of
CCR2 A/A genotype was higher in the donors of the stable graft group
(17.4%) compared with the non-stable graft group (14.7%). However, the
difference was not statistically significant (Table 3.6). Table 3.7 shows the
correlation between the CCR2V64I genotypes, the sex of the donor and the
incidence of graft non-stability. A higher risk of acute rejection was evident
when the donors were females with the CCR2 G/G genotype (P=0.02, OR 2.6,
95% CI=1.1-6.3). No significant association was found with any CCR2
genotype in the case of male donors. Moreover, both the G and A alleles of

74
CCR2 did not show any significant association with other risk factors such as,
the recipient’s age, the donor’s age, ethnic background and cold ischemia time
etc. for allograft failure.
3.3.2. Association of CCR5-59029G>A genotypes and alleles with
rejection:
A total of 605 recipients and 599 donors were analyzed for the CCR5-
59029 G>A polymorphism. The overall frequency of CCR5-59029G>A (G)
allele was 54.5% in the recipients and 52% in the donors while the A allele
was present in 45.5% in the recipients and 48% in the donors (Table 3.4).
When genotypic frequencies were compared among donors and recipients, it
was observed that the frequency of the GG genotype was slightly higher in the
recipients than the donors (33.8% vs. 30.7% respectively). However, there
was no difference in the frequencies between donors and recipients with the
AA and GA genotypes (Table 3.4).
No significant difference was observed between the recipients of stable
and non-stable graft groups with all the three genotypes (Table 3.5b).
Similarly no statistically significant difference was observed when the effect
of donor genotypes was analyzed on allograft outcome (Table 3.6). When the
G>A polymorphism was investigated in relation to the donor’s sex, it was
observed that the kidney from male donors with homozygous G allele had a
greater chance of graft rejection (P=0.04, OR=1.7, 95% CI=1.03-3.01; Table
3.7). Additionally, other risk factors for allograft failure such as, recipient’s
age, donor’s age, recipient’s sex, ethnic background, cold ischemic time etc.
were also checked for association with the CCR5 polymorphism. Results

75
showed no significant association between the CCR5 polymorphism and the
risk factors for graft failure.
3.3.3. Association of CCR5Δ32 genotypes and alleles with renal rejection:
For the analysis of CCR5Δ32 polymorphism, 593 recipient and 601
donor DNA samples were analyzed. The overall frequencies of the CCR5Δ32
wild type (+/+) allele and Δ32/Δ32 allele were similar in the recipients and
donors (98% for the +/+ allele and 2% for the Δ32/Δ32 allele respectively).
The frequencies for all three possible genotypes i.e. +/+, +/Δ32 and Δ32/Δ32
were 96.1%, 3.7% and 0.2% in the recipients and 96%, 4% and 0% in the
donors respectively (Table 3.4). The CCR5Δ32 genotypes of donors and
recipients were in HWE (χ²=2.46, 1 df; P>0.05 and χ²=0.23, 1 df; P>0.05
respectively).
No statistically significant association was observed between the
CCR5Δ32 allele frequencies and allograft outcome (Tables 3.5b and 3.6).
Similarly, no significant effect of CCR5Δ32 genotypes was observed with
respect to the donor’s sex on allograft outcome (Table 3.7).

76
Table 3.4: Genotypic and allelic frequencies of CCR2V64I, CCR5-59029G>A and
CCR5Δ32 in the allograft recipients and their donors.
Chemokine Receptors Recipient frequency (%) Donor frequency (%)
CCR2 V64I (n=606) (n=573)
G/G 502(82.2%) 473(82.5%) G/A 97 (16%) 96(16.8%) A/A 7 (1.2%) 4(0.7%) G allele 91% 90.9% A allele 9% 9.1%
CCR5- 59029G>A Recipients (n=605) Donors (n=599)
G/G 206 (33.8%) 186 (30.7%) G/A 247 (40.8%) 257 (41.8%) A/A 152 (25.1) 163 (26.5%) G allele 54.5% 52% A allele 45.5% 48%
CCR5 Δ32 Recipients (n=593) Donors (n=601)
+/+ 570 (96.1%) 578 (96%) +/Δ32 22 (3.7%) 23 (4%) Δ32/Δ32 01(0.2) 0(0) + allele 98% 98% Δ32 allele 2% 2%

77
Table-3.5a: Clinical characteristics of renal transplant patients and rejection group Non-Rejection
(n=449) Rejection (n=157) P-value OR (95% Cl)
Recipient age in years (mean ±SD) 30.5±10.6 29.4±10.7 0.286 --
Age Range ( min-max) (8-58) (8-60)
Recipient gender (M/F) 348(78.2%)/97(21.8%) 126(81%)/30(19%) 0.569 1.17 (0.741-1.85)
BMI 20.4±3.3 20.8±3.5 0.317 --
Range ( min-max) (11-38) (13-31)
Donor age in year (mean ± SD) 34.1±10.2 36.4±9.6 0.016* --
Age range (18-65) (15-58)
Donor gender (M/F) 273(61.3%)/172(38.7%) 78(50%)/78(50%) 0.014* 0.630(0.436-0.910) ESRD Unknown disease Stone disease Glomerular diseases
274(72.3%) 56(15.5%) 32(12.2%)
102(77%) 16(12%) 15(11%)
0.394 --
HLA Match at A/B/DR 1 H – 3 Ags 1 H – 4 Ags 1 H – 5 Ags
43(44.8%) 29(30.2%) 10(10.4%)
6(27.3%) 8(36.4%) 4(18.2%)
0.000*
Immunosuppressive drugs CsA, Aza, Pred CsA, MMF, Pred Tac, MMF, Pred
378(85%) 23(5.2%) 43(9.6%)
134(85.4%) 6(3.82%) 17(10.8%)
0.728
SD= Standard deviation; H= Haplotype; Ags= Antigens; CsA= Cyclosporin A; MMF=Mycophenolate;Aza = Azathioprine, Pred= Prednisolone; ESRD = End-stage renal disease; BMI= Body Mass Index
* indicates significant value

78
Table 3.5b: Genotypic frequencies in the groups of patients with and without rejection history
Genotype Stable graft Non-Stable graft P-value Odds Ratio 95%CI
CCR2V64I
GG 361 (80%) 141 (90%) 0.009 2.14 1.2-3.7
A/A 5(1.11%) 2(1.2%) 1 1.1 0.2-5.9
G/A 83 (18.5%) 14 (8.9%) 0.005 0.4 0.2-0.7
G/A+A/A 88(15.3%) 16(2.8%) 0.009 0.4 0.2-0.8
CCR5-59029G>A
GG 153 (34.1%) 53 (33.7%) 1 0.9 0.6-1.4
A/A 177 (39.5%) 34 (21.6) 0.28 0.7 0.5-1.1
G/A 118 (26.3%) 70 (44.5%) 0.29 1.2 0.8-1.7
CCR5 Δ32
+/+ 419(96%) 151(96.8%) 0.6 1.2 0.4-3.5
+/Δ32 17(3.9%) 5 (3.2%) 0.8 0.8 0.2-2.2
Δ32/Δ32 1 (0.2%) 0 (0%) - - -

79
Table 3.6: Genotypic frequencies in the groups of donors with and without rejection history
Genotype Stable graft Non-Stable graft P-value
CCR2V64I
Donors = 573
G/G 346 (81.6%) 127 (85.2%) 0.358
A/A 74(17.4%) 22(14.7%)
G/A 4(0.94%) 0
CCR5-59029G>A
Donors = 599
G/G 131 (29.5%) 55(35.5%)
0.381 A/A 193(43.5%) 61 (39.3%)
G/A 120(27%) 39 (25.2%)
CCR5Δ32
Donor = 601
+/+ 426 (96.2%) 152 (96.2%) 1
+/Δ32 17(3.8%) 6 (3.8%)
Δ32/Δ32 0 0

80
Table 3.7: Association of donor’s sex with CCR2V64I, CCR5-59029G>A and
CCR5Δ32 polymorphism
Stable graft Non-stable graft P value OR 95% CI
CCR2V64I
Male G/G 217(82.8%) 54(78.2%) 0.4 0.7 0.3-1.4 G/A 43(16.4) 15(21.7%) 0.3 1.4 0.7-2.7 A/A 2(0.76%) 0 - - -
Female
G/G 129(79.6%) 73(91.5%) 0.02 2.6 1.1-6.3 G/A 31(19.13%) 7(8.75%) 0.03 0.4 0.17-0.9 A/A 2(1.2%) 0 - - - CCR5-59029G>A Male G/G 77(28.3%) 30(41%) 0.04 1.7 1.03-3.01 G/A 119(43.7%) 20(27.3%) 0.015 0.4 0.2-0.8 A/A 76(28%) 23(31.5%) 0.5 1.1 0.6-2
Female
G/G 54(31.3%) 25(30.4%) 1 0.9 0.5-1.6 G/A 74(43%) 41(50%) 0.3 0.7 0.3-1.34 A/A 44(25.5%) 16(19.5%) 0.3 1.3 0.7-2.2 CCR5Δ32 Male +/+ 260(95.6%) 75(96%) 1 1.1 0.3-4.1 +/Δ32 12(4.4%) 3(4%) 1 0.8 0.2-3 Δ32/Δ32 0(0%) 0(0%) - - -
Female
+/+ 166(97%) 77(96.2%) 0 0.7 0.1-3 +/Δ32 5(3%) 3(3.8%) 0.9 1.2 0.3-5 Δ32/Δ32 0(0%) 0(0%) - - -
O.R = Odd Ratio
81
3.3.4 Demographic characteristics of stable graft and Non-stable graft:
The demographic characteristics of patients with stable and non-stable
graft were compared by univariate analysis. Results showed (i) donor’s age (p =
0.016) (ii) donor’s gender (p = 0.014) and (iii) HLA match (p = 0.000) were
significant between the two groups (Table 3.5a).
Binary Logistic Regression:
Variables found to be statistical significant were selected as co-variable in
binary logistic regression (LR). LR was applied to model the event probability for a
categorical response variable with two outcomes (dependable variable; rejection or
non-rejection).
The logistic regression showed that donor’s CCR5-59029 AA genotype,
recipient’s CCR2 V64I AA, HLA match at 1 Haplotype 5 Antigens (1H-5 Ags) and
identical match effect the likelihood that recipients have graft dysfunction. The
model explained 29% (Nagelkerke R2 variation in the dependent variable) variance in
renal rejection and correctly classified 76.3% of cases. Donor’s CCR5-59029 AA
genotype was 2.53 times more likely to exhibit renal rejection compared to CCR5-
59029 GG genotype. However, recipient’s CCR2 V64I AA (0.385 times), and HLA
match (1H-5 Ags match, 0.277 times and identical match 0.012 times) were
associated with a reduction in the likelihood of exhibiting renal rejection (Table 3.8).

82
Table-3.8: Binary Logistic Regression
B S.E. Wald df Sig. Exp(B) 95% C.I. for EXP(B) Lower Upper
Recipient age -.014 .012 1.368 1 .242 .986 .963 1.010 Donor age .011 .011 .923 1 .337 1.011 .989 1.034 Recipient gender .361 .279 1.674 1 .196 1.435 .830 2.479 Donor gender -.203 .237 .738 1 .390 .816 .513 1.298 Recipient CCR5-59029 1.696 2 .428
CCR5-59029(GG) .109 .322 .114 1 .736 1.115 .593 2.094 CCR5-59029 (AA) .337 .267 1.590 1 .207 1.401 .830 2.365 Donor CCR5-59029 11.157 2 .004
CCR5-59029 (GG) .399 .324 1.517 1 .218 1.490 .790 2.812 CCR5-59029 (AA) .930 .288 10.428 1 .001 2.534 1.441 4.455 Recipient CCR2 V64I 6.582 2 .037
CCR2V64I (GG) -.065 .963 .005 1 .946 .937 .142 6.185 CCR2V64I (AA) -.954 .372 6.570 1 .010 .385 .186 .799 Donor CCR2 V64I .363 2 .834
CCR2 V64I (GG) .510 1.522 .112 1 .738 1.665 .084 32.889 CCR2 V64I (AA) .157 .299 .277 1 .599 1.170 .652 2.102

83
B S.E. Wald df Sig. Exp(B)
95% C.I. for EXP(B)
Lower Upper
BMI 2.578 2 .276
BMI (26-50) -.606 .377 2.576 1 .109 .546 .261 1.143 BMI (18-25) -.574 .491 1.366 1 .242 .563 .215 1.475 HLA Match 30.547 8 .000
1H-4 Ags Match -.550 .283 3.767 1 .052 .577 .331 1.005 1H-5 Ags Match -1.283 .360 12.733 1 .000 .277 .137 .561 1H-6 Ags Match -1.602 .813 3.880 1 .049 .201 .041 .992 Zero Match -.873 .764 1.306 1 .253 .418 .094 1.866 BHD-1 Ag Match -.522 .463 1.270 1 .260 .594 .240 1.470 BHD-2 Ags Match -.834 .515 2.623 1 .105 .434 .158 1.191 BHD-3 Ags Match -21.313 19248.583 .000 1 .999 .000 .000 . Identical Match -4.423 1.032 18.379 1 .000 .012 .002 .091 Constant -.303 .802 .143 1 .705 .738
1H-4 Ags = 1 Haplotype 4 Antigens; 1H-5 Ags = 1 Haplotype 5 Antigens; 1H-6 Ags = 1 Haplotype 6 Antigens; BHD-1 Ag Match; both haplotypes are different 1antigen match; BHD-2 Ags Match; both haplotypes are different 2 antigens match; BHD-3 Ags Match; Both haplotypes are different 3antigens match; BMI= Body Mass Index

84
3.3.5. Effect of chemokine receptor gene polymorphism on graft survival:
Figure 3.1 shows the overall rejection-free graft survival in the patients
with respect to CCR2V64I polymorphism. As described previously by Singh
et al., (2008), the CCR2 GG genotype was compared with the GA and AA
(GG vs. GA + AA) genotypes. A significant reduction in the mean time of
rejection-free graft survival was observed in the CCR2 GG genotype (59±1.4
vs. 68±2.6 weeks; log-rank P=0.008).
CCR5-59029G>A and CCR5Δ32 genotypes had no effect on the mean
time of kidney rejection-free graft survival. The overall mean times of
rejection-free graft survival were 60±1.3 weeks (log-rank P=0.46) and 60±1.3
weeks (log-rank P=0.55) respectively.
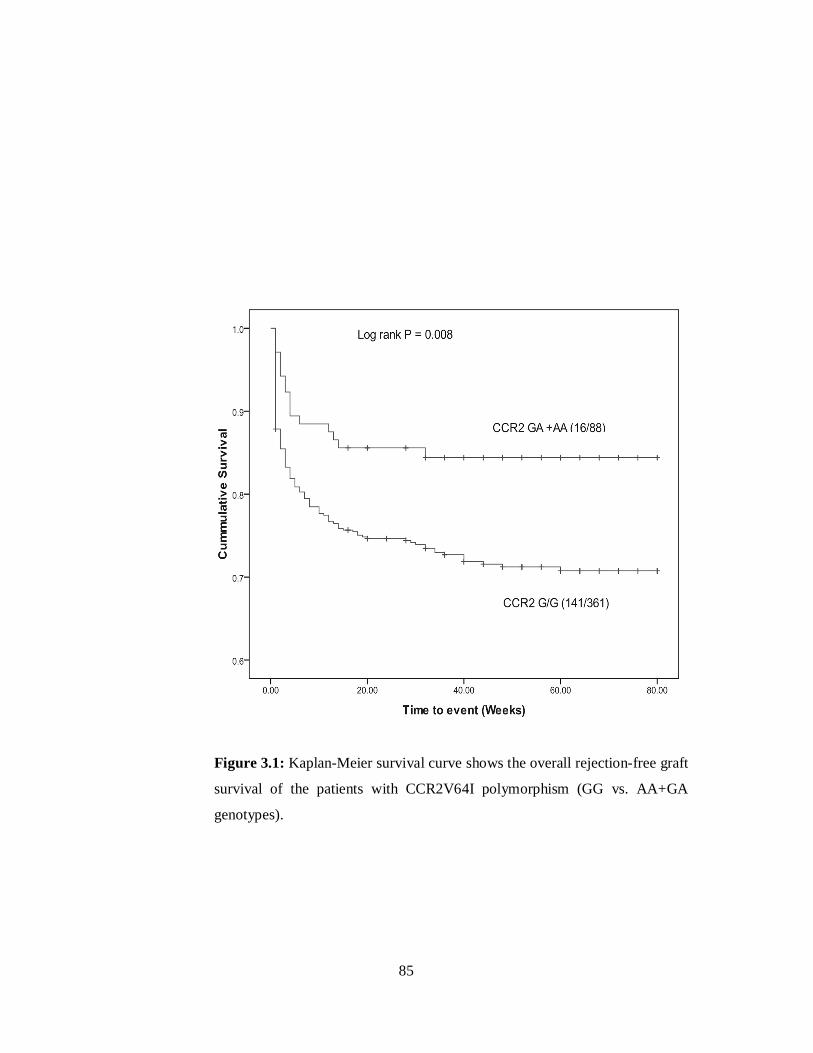
85
Figure 3.1: Kaplan-Meier survival curve shows the overall rejection-free graft
survival of the patients with CCR2V64I polymorphism (GG vs. AA+GA
genotypes).

86
3.4. Discussion:
End stage renal disease (ESRD) is a major health concern in the world
(Schena, 2000). The estimated prevalence of ESRD in Pakistan is about 100
per million (Rizvi et al., 2002). The major causes of ESRD in the adult
population are renal stone, diabetes mellitus, hypertension and genetic factors.
Congenital urological anomalies, glomerulopathies and genetic factors are
common in children (Rizvi et al., 2002; Delucchi et al., 2006; Chacko et al.,
2007; USRDS, 2008).
The ultimate choice for the treatment of ESRD is renal transplantation.
Despite the progress in understanding rejection mechanisms and designing
targeted drugs, the success rate of long-term graft (5 years) survival varies
from 44% to 84% and patient survival varies from 74% to 100% globally. In
Pakistan, the graft survival rate is 65% and patient survival rate in 5 years is
75% (Rizvi et al., 2009). Allograft rejection mediated by the immune cells (T-
cells, B-cells), repeated infection episodes, interstitial fibrosis and tubular
atrophy (IFTA) are major causes of early graft loss (Otukesh et al., 2006;
Rizvi et al., 2009; Süsal et al., 2009).
Chemokines that are released after renal injury are considered to be
involved in the initiation of the immune response. These chemokines direct,
recruit and regulate the immunological processes that lead to the perseverance
or progression of renal disease (Anders et al., 2003). Certain chemokines and
their receptors have been found to have high expression levels during the
course of rejection (Bedognetti, 2011). It has been reported that CCR2 and
CCR5 are among those chemokines whose ligand and receptor expression

87
increases during rejection (Morgun et al., 2006; Reeve et al., 2009; Saint-
Mezard et al., 2009; Krensky and Clayberger, 2011).
This study reveals the effect of CCR2V64I polymorphism on renal
graft outcome. Patients carrying the CCR2 GG genotype have statistically
lower graft rejection time as compared to those that have other genotypes (GA
and AA). The genotypic frequencies of CCR2 G/A (heterozygous) alone and
in combination with CCR2 AA (homozygous mutant) were relatively higher in
stable allografts. The KM curve also showed a significant reduction in the
mean time of rejection-free graft survival in the GG genotype of CCR2
compared to the AA+GA genotypes (59±1.4 vs. 68±2.6 weeks, respectively).
These findings are in accordance to previous studies where it was shown that
individuals with the A allele, either in the homozygous or heterozygous state,
have a greater chance to accept the graft (Abdi et al., 2002; Hancock, 2002;
Yigit et al., 2007; Singh et al., 2008). In contrast, Krüger et al., (2002) and
Brabcova et al., (2007) have demonstrated that the CCR2V64I genotype does
not affect either graft rejection or acceptance.
Due to the low frequency of CCR5Δ32 homozygotes in the recipients
and absence in the donors, it was not possible to assess any association with
the increased or reduced risk of renal graft loss. The findings of this work
support the results of Abdi et al., (2002) and Singh et al., (2009) that
CCR5Δ32 had no effect on acute rejection. In contrast, a positive role of
homozygous CCR5Δ32 allele and long-term allograft survival were reported
by Fischereder et al., (2001).
Single nucleotide polymorphism of CCR5 in the promoter region
-59029G>A is another variant of interest in renal rejection/tolerance studies.

88
In vitro studies have shown that the CCR5-59029 A mutant type expressess
high levels of CCR5 receptors on CD4+ T-cells (Mcdermott et al., 1998;
Shieh et al., 2000). Recently, Gorgi et al., (2011) have reported an increased
risk of rejection with the -59029 A allele in combination with the CCR2V64I
A allele in the HLA matched recipients. In contrast to the above reports, the
increased expression of CCR5 receptors have been suggested to be associated
with a reduced rejection risk (Abdi et al., 2002; Yigit et al., 2007; Omrani et
al., 2008). Hoffmann et al., (2004) reported that donors with the A allele of
CCR5 experienced more episodes of allograft rejection (P=0.029) and also
increased chances to develop IFTA (P=0.04). In the present study, the
frequency of G and A alleles of CCR5 polymorphism were 54.5% and 45.5%
respectively and neither of the alleles was significantly associated with
allograft rejection or tolerance.
The results of this study revealed that the presence of the GG genotype
of CCR2V64I polymorphism in allograft recipients is associated with a
significantly higher number of rejection episodes. Donor’s gender may also
affect the allograft outcome. In our study, the CCR2V64I GG genotype of
female donors and CCR5-59029G>A GG genotype of male donors are found
to be associated with the rejection episodes. The association of polymorphisms
within these genes with the rejection episodes could be used for the early
detection of possible graft rejection episodes.
Further studies of immune-related genes (chemokines CXCL10, CCL2
cytokines TNF, IL-10 etc), polymorphisms and their expression (at mRNA or
protein) levels in our renal cohort patients would expand our knowledge
regarding our population genetics related to transplantation.

89
3.5. References: Abdi R, Tran TB, Sahagun-Ruiz A, Murphy PM, Brenner BM, Milford EL, McDermott DH. (2002). Chemokine receptor polymorphism and risk of acute rejection in human renal transplantation. J Am Soc Nephrol. 13(3):754-8.
Anders HJ, Vielhauer V, Schlöndorff D. (2003). Chemokines and chemokine receptors are involved in the resolution or progression of renal disease. Kidney Int. 63(2): 401-415.
Bedognetti D. (2011). Signature Associated with Acute Rejection: Allograft Rejection, In: Marincola, FM. and Wang, E. (Eds.), Immunologic Signatures of Rejection. Springer, New York, USA. 305-345.
Brabcova I, Petrasek J, Hribova P, Hyklova K, Bartosova K, Lacha J, Viklický O. (2007). Genetic variability of major inflammatory mediators has no impact on the outcome of kidney transplantation. Transplantation. 84(8): 1037-1044.
Chacko B, Rajamanickam T, Neelakantan N, Tamilarasi V, John GT. (2007). Pediatric renal transplantation: a single center experience of 15 yr from India. Pediatr. Transplant. 11(8): 844-849.
Cha RH, Yang SH, Kim HS, Kim SM, Park MH, Ha J, Kim YS. (2009). Genetic interactions between the donor and the recipient for susceptibility to acute rejection in kidney transplantation: polymorphisms of CCR5. Nephrol. Dial. Transplant. 24(9): 2919-2925.
Delucchi A, Ferrario M, Varela M, Cano F, Rodriguez E, Guerrero JL, Lillo AM, Wolff E, Godoy J, Buckel E, Gonzalez G, Rodriguez J, Cavada G. (2006). Pediatric renal transplantation: a single center experience over 14 years. Pediatr. Transplant. 10(2): 193-197.
Fischereder M, Luckow B, Hocher B, Wüthrich RP, Rothenpieler U, Schneeberger H, Panzer U, Stahl RA, Hauser IA, Budde K, Neumayer H, Krämer BK, Land W, Schlöndorff D. (2001). CC chemokine receptor 5 and renal transplant survival. Lancet. 357(9270): 1758-1761.
Fischereder M, Schroppel B. (2009). The role of chemokines in acute renal allograft rejection and chronic allograft injury. Front. Biosci. 14: 1807-1814. Goldfarb-Rumyantzev AS, Naiman N. (2010). Genetic predictors of acute renal transplant rejection. Nephrol. Dial. Transplant. 25(4):1039-47.
Gorgi Y, Sfar I, Jendoubi-Ayed S, Makhlouf M, Rhomdhane TB, Bardi R, Aouadi H, Abdallah TB, Abderrahim E, Ayed K. (2011). Allograft renal rejection and chemokine polymorphism. Saudi J. Kidney Dis. Transpl. 22(1): 18-23.

90
Hancock WW (2002). Chemokines and transplant immunology. J. Am. Soc. Nephrol. 13(3): 821-824.
Hoffmann S, Park J, Jacobson LM, Muehrer RJ, Lorentzen D, Kleiner D, Becker YT, Hullett DA, Mannon R, Kirk AD, Becker BN. (2004). Donor genomics influence graft events: the effect of donor polymorphisms on acute rejection and chronic allograft nephropathy. Kidney Int. 66(4): 1686-1693.
Krensky AM, Clayberger C. (2011). Chemokines and cytotoxic effector molecules in rejection, In: Marincola, F.M. and Wang, E. (Eds.), Immunologic Signatures of Rejection. Springer, New York, USA, 77-92.
Krüger B, Schröppel B, Ashkan R, Marder B, Zülke C, Murphy B, Krämer BK, Fischereder M. (2002). A monocyte chemoattractant protein-1 (MCP-1) polymorphism and outcome after renal transplantation. J. Am. Soc. Nephrol. 13(10): 2585-2589.
McDermott DH, Zimmerman PA, Guignard F, Kleeberger CA, Leitman SF, Murphy PM. (1998). CCR5 promoter polymorphism and HIV-1 disease progression. Multicenter AIDS cohort study (MACS). Lancet. 352(9131): 866-870.
Morgun A, Shulzhenko N, Perez-Diez A, Diniz RV, Sanson GF, Almeida DR, Matzinger P, Gerbase-DeLima M. (2006). Molecular profiling improves diagnoses of rejection and infection in transplanted organs. Circ. Res. 98(12): E74-83.
Nakayama EE, Tanaka Y, Nagai Y, Iwamoto A, Shioda T. (2004). A CCR2-V64I polymorphism affects stability of CCR2A isoform. AIDS. 18(5): 729-738.
Nankivell BJ, Alexander SI. (2010). Rejection of the kidney allograft. N. Engl. J. Med. 363(15): 1451-1462.
Omrani MD, Mokhtari MR, Tagizadae A, Bagheri M, Ahmad-Poor P. (2008). Association of CCR5-59029 A/G and CCR2-V64I variants with renal allograft survival. Iran J. Immunol. 5(4): 201-206.
Otukesh H, Basiri A, Simfrosh N, Hoseini R, Sharifian M, Sadigh N, Golnari P, Rezai M, Fereshtenejad M. (2006). Outcome of pediatric renal transplantation in Labfi Nejad Hospital, Tehran, Iran. Pediatr. Nephrol. 21(10): 1459-1463.
Reeve J, Einecke G, Mengel M, Sis B, Kayser N, Kaplan B, Halloran PF. (2009). Diagnosing rejection in renal transplants: a comparison of molecular- and histopathology-based approaches. Am. J. Transplant. 9(8): 1802-1810.
Rizvi SA, Naqvi SA, Hussain Z, Hashmi A, Akhtar F, Zafar MN, Hussain M, Ahmed E, Kazi JI, Hasan AS, Khalid R, Aziz S, Sultan S. (2002).

91
Living-related pediatric renal transplants: a single-center experience from a developing country. Pediatr. Transplant. 6(2): 101-110.
Rizvi SA, Zafar MN, Lanewala AA, Naqvi SA. (2009). Challenges in pediatric renal transplantation in developing countries. Curr. Opin. Organ Transplant. 14(5): 533-539.
Saint-Mezard P, Berthier CC, Zhang H, Hertig A, Kaiser S, Schumacher M, Wieczorek G, Bigaud M, Kehren J, Rondeau E, Raulf F, Marti HP. (2009). Analysis of independent microarray datasets of renal biopsies identifies a robust transcript signature of acute allograft rejection. Transpl. Int. 22(3): 293-302.
Schena FP. (2000). Epidemiology of end-stage renal disease: International comparisons of renal replacement therapy. Kidney Int. 57[Suppl], S39-S45.
Segerer S, Cui Y, Eitner F, Goodpaster T, Hudkins KL, Mack M, Cartron JP, Colin Y, Schlondorff D, Alpers CE. (2001). Expression of chemokines and chemokine receptors during human renal transplant rejection. Am. J. Kid. Dis. 37(3): 18-31.
Shieh B, Liau YE, Hsieh PS, Yan YP, Wang ST, Li C. (2000). Influence of nucleotide polymorphisms in the CCR2 gene and the CCR5 promoter on the expression of cell surface CCR5 and CXCR4. Int. Immunol. 12(9): 1311-1318.
Singh R, Kapoor R, Srivastava A, Mittal RD. (2008). Impact of chemokine receptor CCR2 and CCR5 gene polymorphism on allograft outcome in North Indian renal transplant recipients. Scand. J. Immunol. 69(1): 51-56.
Solez K, Axelsen RA, Benediktsson H, Burdick JF, Cohen AH, Colvin RB, Croker BP, Droz D, Dunnill MS, Halloran PF, et al. (1993).International standardization of criteria for the histologic diagnosis of renal allograft rejection: the Banff working classification of kidney transplant pathology. Kidney Int. 44(2): 411-422.
Süsal C, Döhler B, Sadeghi M, Ovens J, Opelz G. (2009). HLA antibodies and the occurrence of early adverse events in the modern era of transplantation. Transplantation. 87(9): 1367-1371.
USRDS Annual Data Report (2008). Incidence of reported end stage renal disease. ttp://www.usrds.org/2008/ref/A_Incidence_08.pdf.
Yigit B, Bozkurt N, Berber I, Titiz I, Isbir T. (2007). Analysis of CC chemokine receptor 5 and 2 polymorphisms and renal transplant survival. Cell. Biochem. Funct. 25(4): 423-426.

92
4. Urinary Interferon-gamma inducible protein-10 and its
association with renal allograft rejection.

93
4.1. Introduction:
Chemokines are signaling molecules that are released at the site of
renal injury during the course of kidney allograft rejection. The evaluation of
chemokine levels at the time of rejection has been reported to be a useful
indicator of rejection events (Roedder et al., 2011; Pereira et al., 2012).
Interferon-gamma inducible protein-10 (IP-10 or CXCL10) belongs to
the CXC sub-group of the chemokine super family. It has chemotactic
properties for T helper cells (Th1), natural killer cells (NK cells), dendritic
cells (DCs), γδ T cells and macrophages (Bonecchi et al., 1998; Loetscher et
al., 1998; Romagnani et al., 2001). It is secreted by several immune
(leukocytes, neutrophils) and non-immune cells (epithelial cells, endothelial
cells). It exerts its biological activity by binding to the CXCR3 receptors that
are expressed on the immune cells, particularly T-cells. Both the IP-10 and
CXCR3 receptors have a central role in the immune response against
transplanted organs as they are potent chemoattractant for T-cells that lead to
acute rejection (Panzer et al., 2004; Romagnani and Crescioli, 2012).
IP-10 is induced by interferon-gamma which indicates its early
involvement in allograft inflammation and renal injury. The finding of
increased expression levels of IP-10 in blood (pre-transplant and post-
transplant) and urine of the allograft recipients have been shown to be
associated with rejection, chronic allograft nephropathy and early graft loss
(Rotondi et al., 2004; Lazzeri et al., 2005 ; Matl et al., 2010; Lo et al., 2011;
Mao et al., 2011). Elevated urinary IP-10 levels reduce the need for
surveillance and indication biopsies by 61% and 64%, respectively (Hirt-
Minkowski et al., 2012). These findings suggest that the urinary IP-10

94
chemokine levels could provide a non-invasive and early monitoring marker
for graft function.
In the present study, urinary levels of IP-10 protein were determined in
(a) biopsy-proven allograft rejection (b) biopsy-proven non-rejection cases and
(c) in healthy controls. Further, IP-10 protein levels were also investigated for
their association with rejection.
4.2. Material and Methods:
This study was approved by the Institutional Review Board (SIUT-
ERC/A03-2009) and conformed to the tenets of the declaration of Helsinki.
Written informed consent was taken from all the participants. Based on our
inclusion and exclusion criteria, a total of 206 urine samples were included
from 206 individuals (118 transplant patients and 88 healthy donors). The
urine samples (n=206) were comprised of rejection (n=96), non-rejection
(n=22) and controls (n=88) (Figure 4.1).
4.2.1. Inclusion and Exclusion Criteria:
This study includes only live, related renal transplant patients
with biopsy-proven rejection and non-rejection events during the first post-
transplantation year. All were first transplants. The rejection cases were
classified according to Banff 97 classification and its updates (Racusen et al.,
1999), as acute T-cell mediated rejection (ACR), borderline (BLR) and acute
antibody-mediated rejection (ABMR). Cases showing intimal or transmural
arteritis were classified as acute vascular rejection (AVR: IIA, IIB or III).
Other histopathological diagnoses such as interstitial fibrosis and tubular

95
atrophy (IFTA), drug toxicity and bacterial or viral infection was excluded
from the study, as were the biopsies showing more than one pathology in
association with rejection.
Healthy individuals were included in the control group. This included
individuals selected as kidney donors with no known diagnosis of renal or
other diseases.
4.2.2. Samples Processing and IP-10 Quantification:
Early morning urine samples were collected form healthy donors as
well as patients who had undergone biopsy. Urine samples were collected
prior to performance of the biopsy procedure(s). A total of 206 samples were
collected and grouped into rejection (n=96), non-rejection (n=22) and controls
(n=88). The samples were processed and quantified for IP-10 concentration by
the enzyme-linked immunosorbent assay using human CXCL10/IP-10
Quantikine ELISA kit (R&D Systems; Minneapolis, USA), as described
earlier in methodology section.
The optical density of samples was determined at 450nm/540nm using
the microplate reader (Synergy 2, BioTek® Instrument, Inc, USA). A standard
curve was generated using the IP-10 standards and the concentration of
samples was calculated by the microplate data collection and analysis
software, Gen5® version 1.08. Each sample was assayed in duplicate for IP-10
protein levels and the average value was used for statistical analysis.

96
Figure 4.1: Schematic representation of samples for urinary IP-10 study. A total of 206 urine samples were included in this
study based on our criteria. It consists of 118 urine samples collected prior of graft biopsy procedure from renal transplant patients,
diagnosed as Rejection (n=96) and Non-Rejection (n=22). Eighty-eight samples of healthy donors as controls.

97
4.2.3. Statistical Analysis:
The statistical analyses were carried out with Statistical Package for
Social Sciences SPSS for Windows (version 17; SPSS Inc., Chicago, IL,
USA). The mean values of IP-10 concentration in the rejection, non-rejection
and control cases were determined. Additionally, the mean concentration of
IP-10 protein across different sub-classifications of rejection was also
investigated. Urinary IP-10 concentrations in rejection, non-rejection and
control cases were compared using non-parametric tests (Kruskal-Wallis,
Mann-Whitney) at significance level of p<0.05. The Receiver Operating
Characteristic (ROC) curve analysis was used to determine the concentration
of IP-10 protein for predicting rejection. The diagnostic power of IP-10 (area
under curve (AUC), sensitivity and specificity) was calculated using
MedCalc® statistical software (version 12.7.5: http://www.medcalc.org/).
Based on the urinary IP-10 protein concentrations, the renal transplant
patients with biopsies cases (n=118) were classified into 3 categories as
<100pg/ml, 100-200pg/ml and >200pg/ml. The Kaplan-Meier (KM) and log-
rank tests were applied to determine the significant differences in renal
allograft rejection-free survival time among these categories.
4.3. Results:
4.3.1. Clinical Characteristics of Study Groups:
The detailed characteristics of the renal transplant patients and controls
are provided in Table 4.1. Renal transplant patients with rejection included 78
(81%) males and 18 (19%) females, with a mean age of 27±1 years. The non-
rejection patients consisted of all males with mean age of 31±2.3 years. The
mean age of the control group mean age was 35±1 years with 42 (48%) males

98
and 46 (52%) females. The mean age of the donors in the rejection and non-
rejection groups was 37±1.1 and 29±1.6 years respectively. The serum
creatinine level was 1.9±0.1 (mg/dl) in rejection and 1.6±0.1 (mg/dl) in non-
rejection group.
Renal transplant patients were on standard triple drug
immunosuppressive regimen, consisting of calcineurin inhibitors
[Cyclosporine (CsA) or Tacrolimus (TAC)] with either Mycophenolate
mofetil (MMF) or Azathioprine (Aza) and steroids (Prednisone). Patients with
poor HLA match were given IL-2 receptor blocker (Simulect) or ATG
(Antithymocyte globulin) as induction therapy.
A total of 118 urine samples from renal transplant patients included 96
samples from rejection and 22 from non-rejection cases. The histopathological
findings of rejection were further categorized as cases of ACR IA+IB (n=63),
AVR IIA+IIB (n=9) and BLR (n=24). The biopsy-proven cases of acute T-cell
mediated rejection were treated with steroids (Methylprednisolone) and either
cyclosporine or tacrolimus. Cases showing steroid resistance and intimal
arteritis (AVR IIA or IIB) were treated with the ATG.
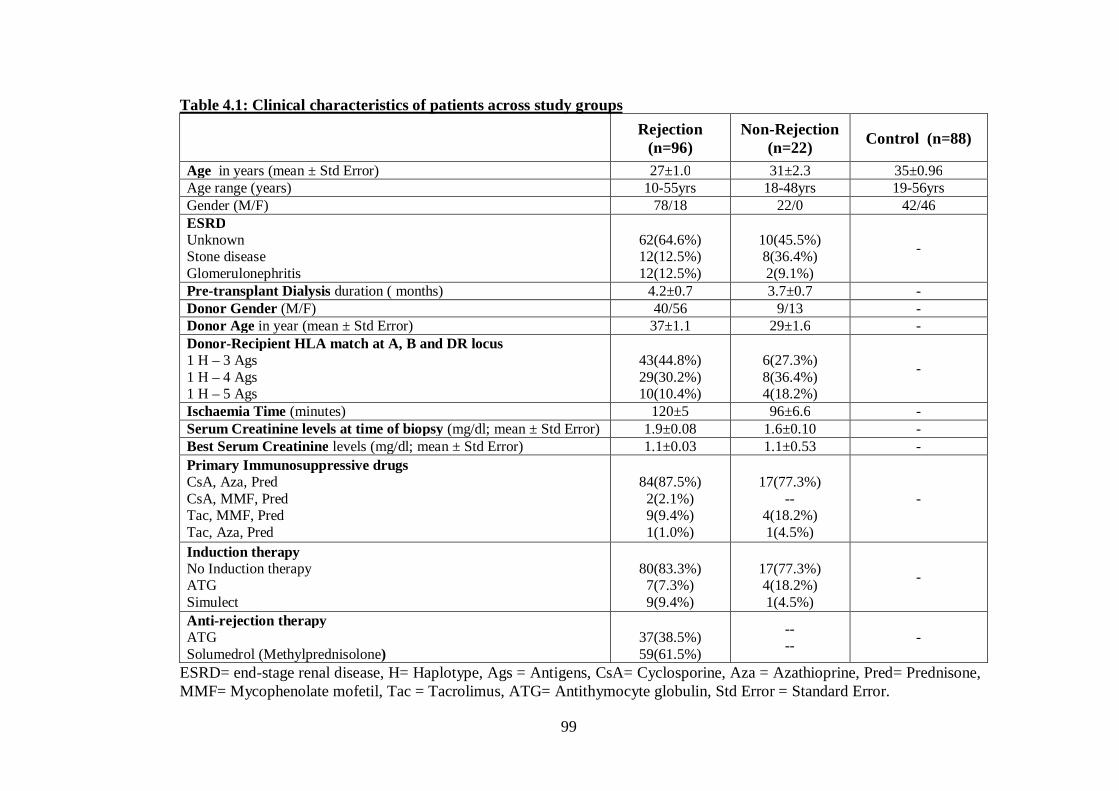
99
Table 4.1: Clinical characteristics of patients across study groups
Rejection (n=96)
Non-Rejection (n=22) Control (n=88)
Age in years (mean ± Std Error) 27±1.0 31±2.3 35±0.96 Age range (years) 10-55yrs 18-48yrs 19-56yrs Gender (M/F) 78/18 22/0 42/46 ESRD Unknown Stone disease Glomerulonephritis
62(64.6%) 12(12.5%) 12(12.5%)
10(45.5%) 8(36.4%) 2(9.1%)
-
Pre-transplant Dialysis duration ( months) 4.2±0.7 3.7±0.7 - Donor Gender (M/F) 40/56 9/13 - Donor Age in year (mean ± Std Error) 37±1.1 29±1.6 - Donor-Recipient HLA match at A, B and DR locus 1 H – 3 Ags 1 H – 4 Ags 1 H – 5 Ags
43(44.8%) 29(30.2%) 10(10.4%)
6(27.3%) 8(36.4%) 4(18.2%)
-
Ischaemia Time (minutes) 120±5 96±6.6 - Serum Creatinine levels at time of biopsy (mg/dl; mean ± Std Error) 1.9±0.08 1.6±0.10 - Best Serum Creatinine levels (mg/dl; mean ± Std Error) 1.1±0.03 1.1±0.53 - Primary Immunosuppressive drugs CsA, Aza, Pred CsA, MMF, Pred Tac, MMF, Pred Tac, Aza, Pred
84(87.5%) 2(2.1%) 9(9.4%) 1(1.0%)
17(77.3%)
-- 4(18.2%) 1(4.5%)
-
Induction therapy No Induction therapy ATG Simulect
80(83.3%) 7(7.3%) 9(9.4%)
17(77.3%) 4(18.2%) 1(4.5%)
-
Anti-rejection therapy ATG Solumedrol (Methylprednisolone)
37(38.5%) 59(61.5%)
-- -- -
ESRD= end-stage renal disease, H= Haplotype, Ags = Antigens, CsA= Cyclosporine, Aza = Azathioprine, Pred= Prednisone, MMF= Mycophenolate mofetil, Tac = Tacrolimus, ATG= Antithymocyte globulin, Std Error = Standard Error.

100
4.3.2. Urinary levels of IP-10 and their association with renal allograft
rejection:
The mean urinary IP-10 protein levels among the controls, rejection and
non-rejection cases are summarized in Table 4.2. The lowest value of IP-10 in
the controls was within a range of 0-112pg/ml. However, rejection cases
showed increased IP-10 levels with a mean concentration of 228±44pg/ml.
Among the sub-classification of rejection cases, the highest mean value of IP-
10 was detected in the acute tubulointerstitial rejection (ACR IA and IB)
(257±52pg/ml) followed by BLR (196±110pg/ml) and intimal arteritis (AVR
IIA and IIB) (113±54pg/ml). Further, the mean value of IP-10 for non-
rejection (NAD) samples was 60±25pg/ml.
Table 4.2: Urinary levels of IP-10 among different histopathological
groups and controls
Groups Mean IP-10 (pg/ml)
NAD (n=22) 60 ± 25
BLR (n=24) 196 ± 110
ACR (IA+IB) (n=63) 257 ± 52
AVR (IIA+IIB) (n=9) 113 ± 54
Control (n=88) 10.5 ± 2.5
NAD=No abnormality detected; BLR=Borderline rejection; ACR=Acute
cellular rejection; AVR=Acute vascular rejection; Mean ± Standard Error.
Statistical analysis showed significant differences in urinary IP-10 levels
between the allograft rejection and control cases (P<0.001) as well as the
rejection and non-rejection cases (P=0.004; Figure 4.2).

101
Analysis of IP-10 among different categories of graft rejection cases (i.e.
ACR [IA, IB], AVR [IIA, IIB] and BLR) with non-rejection (NAD) cases
showed significant differences between ACR (IA, IB) and NAD (P<0.001).
However, no significant differences were found in BLR vs. NAD (P=0.453)
and AVR (IIA, IIB) vs. NAD (P=0.086; Figure 4.3). Additionally, when sub-
classified rejection groups were compared, significant difference was found in
ACR (IA, IB) vs. BLR (P=0.019)while no significant difference was found in
ACR (IA, IB) vs. AVR (IIA, IIB) and AVR (IIA, IIB) vs. BLR.

102
Figure 4.2: Urinary levels of IP-10 in rejection, non-rejection and control
groups. IP-10 levels of rejection were significantly higher from non-rejection
(P=0.004) and control (P<0.001) groups.
103
Figure 4.3: Urinary IP-10 levels among histopathological and control
group. Significant difference was observed between ACR (IA+IB) vs. NAD
(P<0.001) group. No significant difference was found between BLR vs. NAD
(P=0.453), BLR vs. AVR (IIA+IIB) (P=0.392) and AVR (IIA+IIB) vs. NAD
(P=0.086).

104
4.3.3. ROC curve analysis for the different histopathological categories:
The optimum cut-off point was selected which is defined as the value at
which both the sensitivity and specificity was found to be maximum. The
Youden’s index was used for the selection of optimum cut-off point,
calculated by MedCalc software. Table 4.3 lists the area under the curve
(AUC), specificity and sensitivity among the rejection sub-types. The
optimum cut-off point of IP-10 was found at 27 pg/ml with Sensitivity (72%)
and specificity (64%) and the area under the curve was 0.70±0.06 (95% CI:
0.60-0.77) (Figure 4.4). Interestingly, at the same cut-off value of IP-10
(27pg/ml), ACR (IA, IB) showed higher sensitivity (79%) with similar
specificity (64%) and the area under the curve was 0.74.
Table 4.3: ROC curve analysis for different histopathological categories
Group AUC ± S.E Cut off (pg/ml)
Sensitivity and
Specificity P-value
Rej vs. Non-Rej 0.70 ± 0.06 27 72/64 <0.001
Rej vs. Control 0.87 ± 0.03 8.5 82/78 <0.001
ACR(IA+IB) vs. NAD 0.74 ± 0.06 27 79/64 <0.001
BLR vs. NAD 0.56 ± 0.09 21 54/59 0.450
AVR(IIA+IIB) vs. NAD 0.70 ± 0.10 27 64/78 0.050
ACR(IA+IB) vs. BLR 0.66 ± 0.07 23 81/50 <0.001
ACR(IA+IB) vs. AVR (IIA+IIB) 0.60 ± 0.10 47 62/56 0.468
BLR vs. AVR(IIA+IIB) 0.60 ± 0.11 11 46/89 0.343
Rej = Rejection; AUC = Area under curve; S.E = Standard Error

105
Figure 4.4: Receiver operating characteristic (ROC) curve of urinary IP-
10. The true positive results (sensitivity) and false positivity (1-specificity) for
urinary IP-10 levels as a marker for rejection are shown. It showed an area of
0.70±0.06 (95% confidence interval: 0.60-0.77) under the curve with 72%
sensitivity and 64% specificity at a cut-off level of 27pg/ml.

106
4.3.4. Effect of urinary IP-10 level on rejection-free graft survival:
Rejection-free renal allograft survival time among the different
urinary levels of IP-10 (<100pg/ml, 100-200pg/ml and >200pg/ml) showed
statistically significant differences with rejection episodes (P<0.001; Figure
4.5). For rejection, the highest mean time of rejection-free graft survival was
observed with <100pg/ml IP-10 levels (9.26±1.1 weeks), which is followed by
3.3±0.8 weeks and 3.7±1.0 weeks for 100-200pg/ml and >200pg/ml
respectively. A significant difference was found in the mean-time of rejection-
free graft survival between <100pg/ml and >200pg/ml IP-10 levels (9.26±1.1
vs. 3.7±1.1 weeks; log-rank P<0.001) and <100pg/ml and 100-200pg/ml
(9.26±1.1 vs. 3.3±0.7 weeks; log-rank P=0.017). However, no significant
difference was found in the mean-time of rejection-free graft survival between
100-200pg/ml and >200pg/ml IP-10 levels (3.3±0.7 vs. 3.7±1.1 weeks; log-
rank P=0.968).

107
Figure 4.5: Kaplan-Meier survival was constructed using urinary IP-10
levels (<100pg/ml, 100-200pg/ml and >200pg/ml). Number of events
(rejection episodes) /total cases (96/118) was 58/77, 10/12 and 28/29 in
<100pg/ml, 100-200pg/ml and >200pg/ml respectively. Recipients with IP-10
levels less than 100pg/ml showed significantly higher rejection-free graft
survival compared with patients having >200pg/ml (9.26±1.1 vs. 3.7±1.1
weeks; log-rank P<0.001) and 100-200pg/ml (9.26±1.1 vs. 3.3±0.7 weeks;
log-rank P=0.017) in 1 year of post-transplant duration.

108
4.4. Discussion:
Although improved immunosuppressive drugs and advanced clinical
care have helped to reduce the acute rejection rate, it remains a major
challenge in transplantation. It has been shown that the early post-
transplantation period is the most critical for rejection (Varma et al., 2007). In
our previous study, the incidence of renal allograft rejection was 26% during
the first year post-transplantation (Firasat et al. 2012). In the present study, it
was observed that 83% of the allograft rejection episodes occurred within 3
months post-transplantation. Interestingly, the majority (66.7%) of the
rejection cases occurred within the first month post-transplantation. Although
early rejection episodes, predicted by urinary markers, may be prevented with
therapeutic interventions, it remains a major risk factor for subsequent graft
dysfunction/loss.
In the present study, IP-10 concentration in urine of renal transplant
patients at times of allograft dysfunction and biopsy findings of rejection and
non-rejection was quantified during the first year post-transplantation. Urinary
IP-10 levels were also determined in a healthy control group at the same time.
The highest mean IP-10 concentration was found in rejection cases
(228±44pg/ml) followed by non-rejection (60±25pg/ml) and controls
(10.5±2.5pg/ml). A similar pattern of IP-10 levels has also been reported in
other studies for rejection and non-rejection cases. These studies showed high
IP-l0 levels (309±506pg/ml; >100pg/ml) in rejection episodes and low levels
in chronic, stable and control cases (Hu et al., 2004; Khan, 2012).
Previous studies have reported a correlation of increased urinary IP-10
concentration with histopathological findings of rejection (Schaub et al., 2009;

109
Ho et al., 2011). In our study, increased level was also detected in the rejection
group (P=0.004). However, when sub-classes of rejection groups i.e. ACR
(IA, IB), AVR ( IIA, IIB) and BLR were compared with the non-rejection
(NAD) group, only ACR (IA, IB) vs. NAD showed statistically significant
differences (P<0.001). No significant differences were observed in the AVR
(IIA, IIB) vs. NAD and BLR vs. NAD groups. Our study is in agreement with
Hirt-Minkowski et al (2012), even though the number of AVR cases (IIA, IIB)
is low [N=9 (7.6%)], urinary IP-10 is not a good indicator of acute vascular
rejection. This indicates that urinary IP-10 concentration does not reflect
inflammation of the renal vascular compartment. This could be restricted
inflammation of the vascular region without a spill over into the urine. This
results in low levels of IP-10 in urine
Various studies have shown the association of urinary IP-10 levels with
graft rejection and suggested it to be a clinically useful marker (Matz et al.,
2006). To delineate the clinical relevance of the test, ROC analysis in our
study showed sensitivity and specificity of 72% and 64% respectively at
27pg/ml. Similarly, Jackson et al. (2011) showed 80% sensitivity and 76%
specificity at 28pg/ml. Hu et al. (2004) also reported greater sensitivity
(86.4%) and specificity (91.3%) with rejection at >100pg/ml. Further studies
to evaluate the threshold levels at times of rejection would be helpful for
determining the optimal cutoff value for the biomarker.
Clinical and sub-clinical rejection can be predicted by IP-10-guided
biopsies which would help in reducing the necessity of graft biopsies by 64%
(Hirt-Minkowski et al., 2012). Suthanthiran et al. (2013) used a three-gene
signature study that showed that elevated levels of IP-10 mRNA, 18S rRNA

110
and CD3ε mRNA could predict rejection with a sensitivity of 79% and
specificity of 78%. They further showed that urinary IP-10 is associated with
rejection.
Rotondi et al. (2004) have shown that high IP-10 level in serum lowers
graft survival. The increased concentration of urinary IP-10 has also been
shown to decrease graft survival. Our results show that cases with high IP-10
levels (>100pg/ml) have significantly lower rejection-free graft survival rates
as compared to the cases with low levels (<100pg/ml).
There are some limitations in this study. It includes (1) only IP-10 in
urine was determined as it provides non-invasive and convenient sample
collecting approach and may better reflect any renal injury, as urine is in direct
contact with transplanted renal organ. Measuring IP-10 in blood is also a less
invasive method and has been reported to be associated with rejection.
However, there are some draw backs with blood compared to urine, as the
concentration of molecular marker are diluted in blood and are also mixed
with other metabolites, proteins and peptides, that make it complicated to
identify the location of injury (Christians et al., 2011). Determination of
chemokines in urine as well as in blood at biopsy-proven rejection time and
their association with renal allograft outcome may reflect the better choice of
sample source.
This was our initial study for the identification of urinary biomarkers.
Number of non-rejection (n = 22) and also sub-types of rejection, AVR (n = 9)
cases were also limited. Study other immune regulatory molecules such as
Interferon-gamma, with increased sample size, would help to better

111
understand interferon-gamma-induced chemokines and their involvement in
rejection.
The present study is the first from Pakistan that shows elevated
expression of IP-10 protein at the time of renal allograft rejection. In addition
to other indicators like serum creatinine levels, it will be helpful as a routine
non-invasive marker to predict the necessity of renal graft biopsy.
112
4.5. References:
Bonecchi R, Bianchi G, Bordignon PP, D'Ambrosio D, Lang R, Borsatti A, Sozzani S, Allavena P, Gray PA, Mantovani A, Sinigaglia F. (1998). Differential expression of chemokine receptors and chemotactic responsiveness of type 1 T helper cells (Th1s) and Th2s. J Exp Med. 187(1): 129-34. Christians U, Klawitter J, Klawitter J, Brunner N, Schmitz V. (2011). Biomarkers of immunosuppressant organ toxicity after transplantation: status, concepts and misconceptions. Expert Opin Drug Metab Toxicol. 7(2):175-200 Firasat S, Raza A, Abid A, Aziz T, Mubarak M, Naqvi SA, Rizvi SA, Mehdi SQ, Khaliq S. (2012). The effect of chemokine receptor gene polymorphisms (CCR2V64I, CCR5-59029G>A and CCR5Δ32 on renal allograft survival in Pakistani transplant patients. Gene. 511(2): 314-319. Hirt-Minkowski P, Amico P, Ho J, Gao A, Bestland J, Hopfer H, Steiger J, Dickenmann M, Burkhalter F, Rush D, Nickerson P, Schaub S. (2012). Detection of clinical and subclinical tubulo-interstitial inflammation by the urinary CXCL10 chemokine in a real-life setting. Am J Transplant. 12(7): 1811-23. Ho J, Rush DN, Karpinski M, Storsley L, Gibson IW, Bestland J, Gao A, Stefura W, HayGlass KT, Nickerson PW. (2011). Validation of urinary CXCL10 as a marker of borderline, subclinical, and clinical tubulitis. Transplantation. 92(8): 878-882. Hu H, Aizenstein BD, Puchalski A, Burmania JA, Hamawy MM, Knechtle SJ. (2004). Elevation of CXCR3-binding chemokines in urine indicates acute renal-allograft dysfunction. Am J Transplant. 4(3): 432-437. Jackson JA, Kim EJ, Begley B, Cheeseman J, Harden T, Perez SD, Thomas S, Warshaw B, Kirk AD. (2011). Urinary chemokines CXCL9 and CXCL10 are noninvasive markers of renal allograft rejection and BK viral infection. Am J Transplant. 11(10): 2228-2234.
Khan A. (2012). Detection and quantitation of forty eight cytokines, chemokines, growth factors and nine acute phase proteins in healthy human plasma, saliva and urine. Proteomics. 75(15): 4802-4819.
Lazzeri E, Rotondi M, Mazzinghi B, Lasagni L, Buonamano A, Rosati A, Pradella F, Fossombroni V, La Villa G, Gacci M, Bertoni E, Serio M, Salvadori M, Romagnani P. (2005). High CXCL10 expression in rejected kidneys and predictive role of pretransplant serum CXCL10 for acute rejection and chronic allograft nephropathy. Transplantation. 79(9): 1215-1220. Lo DJ, Weaver TA, Kleiner DE, Mannon RB, Jacobson LM, Becker BN, Swanson SJ, Hale DA, Kirk AD. (2011).Chemokines and their receptors in human renal allotransplantation. Transplantation. 91(1): 70-77.

113
Loetscher M, Gerber B, Loetscher P, Jones SA, Piali L, Clark-Lewis I, Baggiolini M, Moser B. (1996). Chemokine receptor specific for IP10 and mig: structure, function, and expression in activated T-lymphocytes. J Exp Med. 184(3): 963-969. Mao Y, Wang M, Zhou Q, Jin J, Wang Y, Peng W, Wu J, Shou Z, Chen J. (2011). CXCL10 and CXCL13 Expression were highly up-regulated in peripheral blood mononuclear cells in acute rejection and poor response to anti-rejection therapy. J Clin Immunol. 31(3): 414-418. Matl I, Hribova P, Honsova E, Brabcova I, Viklicky O. (2010). Potential predictive markers in protocol biopsies for premature renal graft loss. Kidney Blood Press Res. 33(1): 7-14. Matz M, Beyer J, Wunsch D, Mashreghi MF, Seiler M, Pratschke J, Babel N, Volk HD, Reinke P, Kotsch K. (2006). Early post-transplant urinary IP-10 expression after kidney transplantation is predictive of short- and long-term graft function. Kidney Int. 69(9): 1683-1690. Panzer U, Reinking RR, Steinmetz OM, Zahner G, Sudbeck U, Fehr S, Pfalzer B, Schneider A, Thaiss F, Mack M, Conrad S, Huland H, Helmchen U, Stahl RA. (2004). CXCR3 and CCR5 positive T-cell recruitment in acute human renal allograft rejection. Transplantation. 78(9): 1341-1350. Pereira AB, Teixeira AL, Rezende NA, Pereira RM, Miranda DM, Oliveira EA, Teixeira MM, Simões E Silva AC. (2012). Urinary chemokines and anti-inflammatory molecules in renal transplanted patients as potential biomarkers of graft function: a prospective study. Int Urol Nephrol. 44(5): 1539-1548.
Pereira AB, Teixeira AL, Rezende NA, Pereira RM, Miranda DM, Oliveira EA, Teixeira MM, Simões E Silva AC. (1999). The Banff 97 working classification of renal allograft pathology. Kidney Int. 55(2): 713-723.
Roedder S, Vitalone M, Khatri P, Sarwal MM. (2011). Biomarkers in solid organ transplantation: establishing personalized transplantation medicine. Genome Med. 3(6): 37. Romagnani P, Annunziato F, Lazzeri E, Cosmi L, Beltrame C, Lasagni L, Galli G, Francalanci M, Manetti R, Marra F, Vanini V, Maggi E, Romagnani S. (2001). Interferon-inducible protein 10, monokine induced by interferon gamma, and interferon-inducible T-cell alpha chemoattractant are produced by thymic epithelial cells and attract T-cell receptor (TCR) alphabeta+ CD8+ single-positive T cells, TCRgammadelta+ T cells, and natural killer-type cells in human thymus. Blood. 97(3): 601-607. Romagnani P, Crescioli C. (2012). CXCL10: A candidate biomarker in transplantation. Clin Chim Acta. 413(17-18): 1364-1373.

114
Rotondi M, Rosati A, Buonamano A, Lasagni L, Lazzeri E, Pradella F, Fossombroni V, Cirami C, Liotta F, La Villa G, Serio M, Bertoni E, Salvadori M, Romagnani P. (2004). High pretransplant serum levels of CXCL10/IP-10 are related to increased risk of renal allograft failure. Am J Transplant. 4(9): 1466-1474.
Schaub S, Nickerson P, Rush D, Mayr M, Hess C, Golian M, Stefura W, Hayglass K. (2009). Urinary CXCL9 and CXCL10 levels correlate with the extent of subclinical tubulitis. Am J Transplant; 9(6): 1347-1353.
Suthanthiran M, Schwartz JE, Ding R, Abecassis M, Dadhania D, Samstein B, Knechtle SJ, Friedewald J, Becker YT, Sharma VK, Williams NM, Chang CS, Hoang C, Muthukumar T, August P, Keslar KS, Fairchild RL, Hricik DE, Heeger PS, Han L, Liu J, Riggs M, Ikle DN, Bridges ND, Shaked A; Clinical Trials in Organ Transplantation 04 (CTOT-04) Study Investigators. (2013). Urinary-cell mRNA profile and acute cellular rejection in kidney allografts. N Engl J Med. 369(1): 20-31.
Varma PP, Hooda AK, T Sinha, GS Chopra, SC Karan, GS Sethi, Badwal S, Kotwal A. (2007). Renal Transplantation - An Experience of 500 Patients. MJAFI. 63: 107-111.

115
5. Urinary Monokine Induced by Interferon-Gamma and its
Association with Renal Allograft Rejection

116
5.1. Introduction:
Chemokines are major immunological players in the regulation of
immune response. These signaling molecules are released at the site of injury
that subsequently trigger immune activation. In transplantation, the activation
of host immune system is a major threat to allograft rejection/graft
dysfunction. The quantification of chemokines may be a useful indicator of
host immune response against allograft. Recent investigations have showed
that chemokines are good marker for graft functioning (Roedder et al., 2011;
Pereira et al., 2012; Suthanthiran et al., 2013).
Human Monokine induced by Interferon-Gamma (MIG or CXCL9) is
a 103 amino acid protein that is classified as a CXC chemokine sub-family
member (Farber, 1993). It is a chemoattractant for immune cells particularly
for T-lymphocytes that are induced in response to interferon–gamma (INF-γ)
(Whiting et al., 2004). MIG exerts its biological activity on T helper cells
(Th1) via CXCR3 receptors (G-protein coupled receptors). Infiltration and
accumulation of T-cells in/to transplant organ is the major phenomenon that
leads to allograft rejection (Koga et al., 1999; Romagnani et al., 1999; Lazzeri
et al., 2002; Auerbach et al., 2009; Asaoka et al., 2012).
Human MIG chemokine could be an ideal biomarker for graft
monitoring using non-invasive approach as it is involved in the early response
of immune system (Hauser et al., 2005). The quantification of MIG in urine in
rejection, non-rejection, stable graft and control groups could provide a
correlation of this marker with the immune status of transplant patients.
Additionally, urinary MIG level may help in identifying subject(s) with high
risk for rejection and also guide the clinicians about the graft immune status.

117
This study was carried out to determine the urinary levels of MIG in
rejection, non-rejection, stable grafts and control groups in order to investigate
its utility as a marker for the identification of graft rejection.
5.2. Material and Methods:
This study was approved by Institutional Review Board and conformed
to the tenets of the declaration of Helsinki. Informed consent was taken from
renal transplant patients as well as healthy renal donors. All patients were
transplanted at Sindh Institute of Urology and Transplantation, (SIUT). A total
of 266 urine samples from 266 participants were included based on inclusion
and exclusion criteria.
5.2.1. Inclusion and exclusion criteria:
This study includes (a) male or female of any age (b) first time renal
transplant with no other organ(s) transplanted previously and (c) only live and
blood related renal donors. Subjects were classified as (i) Rejection group,
cases with biopsy-proven rejection and subsequently treated with anti-
rejection therapy (ii) Non-Rejection group, cases with biopsy proven non-
rejection (iii) Stable graft group, cases that have no history of biopsy and
serum creatinine levels were maintained 0.5-1.5mg/dl during the first two
months of post-transplantation and (iv) Control group, renal donors with no
known diagnosis of renal disease and other diseases.
Cases were classified as rejection and non-rejection group based on
Banff 97 classification of renal graft biopsies (Racusen et al., 1999). Rejection
group includes acute cellular rejection (ACR), acute vascular rejection (AVR)
and borderline rejection (BLR). On the other hand, non-rejection group

118
includes no abnormality detected (NAD) and interstitial fibrosis and tubular
atrophy (IFTA).
Other histopathological diagnoses such as interstitial fibrosis and
tubular atrophy (IFTA), drug toxicity and bacterial or viral infection were
excluded from the study, as were the biopsies showing more than one
pathology in association with rejection.
5.2.2. Samples processing and MIG quantification:
Early morning urine samples were collected from healthy donors,
stable grafts and patients undergoing graft biopsy procedure(s). The samples
were processed as described earlier and stored at -80°C quantification of MIG.
A total of 266 urine samples were included based on inclusion and exclusion
criteria. Of these samples, 178 samples were classified histopathologically as
rejection (n=108) and non-rejection (n=70). A total of forty-two (n=42)
samples of stable graft patients and forty-six (n=46) samples of healthy renal
donors were also included (Figure 5.1). Rejection group was comprised of
ACR (n=71), AVR (n=10) and BLR (n=27) and non-rejection group included
NAD (n=37) and IFTA (n=33).
These samples were quantified for MIG levels by enzyme-linked
immunoassay using human MIG Quantikine® ELISA kits (R&D Systems;
Minneapolis, USA). The detailed method is described above in the
methodology section. The optical density of samples was measured at
450nm/540nm using the microplate reader (Synergy 2, BioTek® Instrument,
Inc, USA). A standard curve was generated using MIG standards and
subsequently the concentration of samples was calculated by the microplate
data collection and analysis software Gen5® version 1.08. As each sample was

119
assayed in duplicate for MIG levels, therefore the mean concentration was
used for statistical analyses.
5.2.4. Statistical Analysis:
The statistical analyses were carried out with Statistical Package for
Social Sciences software (SPSS version 17; SPSS Inc., Chicago, IL, USA).
The mean concentration of MIG was calculated for rejection, non-rejection,
stable graft and control groups. Non-parametric tests (Kruskal-Wallis and
Mann-Whitney) were applied to identify significant difference of MIG levels
across the groups. A p-value of less than 0.05 was considered to be significant.
Additionally, difference of MIG concentration across sub-classified rejection
groups (ACR, AVR and BLR) was also investigated.
The receiver operating characteristic (ROC) curve was constructed to
determine the area under the curve (AUC), the highest sensitivity and
specificity of MIG at certain threshold level using MedCalc® statistical
software (version 12.7.5) (http://www.medcalc.org/).
5.3. Results:
The clinical characteristics of patients among various groups and
healthy donors are listed in Table 5.1. Renal transplant patients in rejection
group included 91 (84%) males and 17 (16%) females, with a mean age of
25±10 years. On the other hand, non-rejection group contained 59 (84%)
males and 11 (16%) females, with a mean age of 29±11 years. Stable graft
group contained 29 (69%) males and 13(31%) females, with 30±11 years of

120
mean age. In control group, the mean age was 31±8 years with equal numbers
of both genders i.e. 23 (50%).
Renal transplant patients were on standard triple drug
immunosuppressive regimen, consisting of calcineurin inhibitors
[Cyclosporine (CsA) or Tacrolimus (TAC)] with either Mycophenolate
mofetil (MMF) or Azathioprine (Aza) and steroids (Prednisone). Patients with
poor HLA match were given IL-2 receptor blocker (Simulect) or ATG
(Antithymocyte globulin) as induction therapy.
The biopsy-proven cases of acute T-cell mediated rejection (108) were
treated with steroids (Methylprednisolone) and either cyclosporine or
tacrolimus. Cases showing steroid resistance and intimal arteritis (AVR) were
treated with the ATG.

121
Figure 5.1: Schematic representation of samples for urinary MIG study. A total of 266 urine samples were included based
on our study criteria. It consists of biopsy-proven 178 urine samples, collected from renal transplant patients prior of graft
biopsy procedure. One hundred and eight (108) samples were diagnosed as rejection and seventy samples (70) as non-rejection.
Forty-two (42) samples of stable grafts patients and 46 samples of controls (healthy renal donors) were also included.

122
5.3.1. Urinary MIG levels and association with graft rejection:
The mean concentration of MIG among groups of rejection, non-
rejection, stable grafts and healthy donors are summarized in Table 5.2. The
lowest mean value of MIG was detected in the control group (5.5±0.4pg/ml),
followed by stable grafts (8.5±3.5pg/ml) and non-rejection group
22.56±6.4pg/ml (IFTA + NAD group). However, rejection group showed
increased MIG levels with mean concentration of 73.6±25pg/ml as compared
to other study groups.
The MIG concentrations were further analyzed to investigate any
significant differences between groups (Figure 5.2; Table 5.3). Results showed
no statistically significant difference between the rejection and other groups
[Rej vs. NAD (P=0.487), Rej vs. IFTA (P=0.316), Rej vs. stable grafts
(P=0.505), Rej vs. control (P=0.542)]. However, significant difference was
found between stable grafts vs. NAD (P<0.001), stable grafts vs. IFTA
(P<0.001) and stable grafts vs. control group (P<0.001).

123
Table 5.1: Clinical characteristics of study population REJ
(n = 108) NON-REJ
(n = 70) STABLE GRAFT
(n = 42)
RENAL DONORS (n = 46)
Gender Females 17 (16%) 11 (16%) 13 (31%) 23 (50%) Males 91 (84%) 59 (84%) 29 (69%) 23 (50%) Mean age of Recipients (Range)
25.13±10 (8-55yrs)
29.35±10 (8-50yrs)
29.9±11 (7-58yrs)
-
Mean age of Donors (Range)
34.84 ± 9.8 (20-55yrs)
35.2±9.5 (18-54yrs)
31.5±8.5 (18-55yrs)
31.3±8 (18-55yrs)
Etiology of primary disease Unknown cause 71 (66.4%) 43(61%) 26 (62%) - Stone disease 12 (11.2%) 10 (14%) 5 (12%) - Glomerular disease 6 (5.6%) 3 (4%) 3 (7%) - Donor-Recipient HLA match at A, B and DR locus 1Hap 3 Ags match 36 (33%) 23 (33%) 9 (21%) - 1Hap 4 Ags match 26 (24%) 17 (24%) 9 (21%) - 1Hap 5 Ags match 12 (11%) 8 (11%) 5 (12%) - Identical match 8 (7.5%) 6 (9%) 13 (31%) - Induction No induction 76 (70%) 62 (89%) 36 (86%) - Simulect 19 (18%) 6 (9%) 5 (12%) - ATG 13 (12%) 2 (3%) 1 (2%) - Primary drugs CYA/AZA/PRED 88 (82%) 62 (89%) 39 (93%) - TAC/MMF/PRED 12 (11%) 6 (9%) 2 (5%) - Anti-rejection therapy ATG 38 (35%) - -
Solumedrol 70 (65%) - - -
REJ = Rejection, NON-REJ = Non-Rejection, Hap = Haplotypes, Ags = Antigens

124
Table 5.2: Urinary levels of MIG among different histopathological
groups and control
Groups Mean MIG ± S.E (pg/ml)
NAD (n = 37) 28.3 ± 11
IFTA (n = 33 ) 16 ± 5.4
REJ (n = 108) 73.6 ± 25
Stable graft (n = 42) 8.5 ± 3.5
Control (n = 46) 5.5 ± 0.4
NAD = No abnormality detected, IFTA = Interstitial fibrosis and tubular
atrophy, REJ = Rejection, S.E = Standard Error

125
Table 5.3: Statistical significance difference in urinary MIG levels among
study groups
Groups
P-value
REJ vs. IFTA 0.316
REJ vs. NAD 0.487
REJ vs. Control 0.542
REJ vs. Stable graft 0.505
IFTA vs. Control 0.620
IFTA vs. NAD 0.930
NAD vs. Control 0.060
IFTA vs. Stable graft <0.001
NAD vs. Stable graft <0.001
Control vs. Stable graft <0.001
P-value <0.05 is considered as significant.
Mann-Whitney U test (two independent sample tests) was applied.

126
Figure 5.2: Box-plot for urinary MIG levels among different groups.
Results showed no statistically significant difference between rejection and
other groups [Rej vs. NAD (P=0.487), Rej vs. IFTA (P=0.316), Rej vs. stable
grafts (P=0.505), Rej vs. control (P=0.542)]. However, significant difference
was found between stable grafts vs. NAD (P<0.001), stable grafts vs. IFTA
(P<0.001) and stable grafts vs. control (P<0.001).

127
Additionally, IFTA (n=33) and NAD (n=37) groups were pooled together
as non-rejection and compared with rejection group to find significant
difference in MIG levels. Results showed no statistically significant difference
in MIG levels between rejection and non-rejection group (P=0.408) (Figure
5.3; Table 5.4).
Table 5.4: Statistical significance of MIG with rejection outcome
Urinary Marker
P-value
Outcome
MIG
0.408
Non-Significant
Rejection group (n=108) = ACR, BLR and AVR
Non-rejection group (n=70) = NAD and IFTA
Mann-Whitney U test (two independent sample tests)

128
Figure 5.3: Box-plot of urinary MIG levels in rejection (n=108) and non-
rejection group (n=70). MIG levels were higher in rejection as compared to
non-rejection group. Results showed non-significant difference in MIG levels
between two groups (P=0.408).
P=0.408

129
The MIG concentration was also determined among sub-classes of
rejection (i.e. ACR, AVR and BLR). The highest mean concentration of MIG
was detected in the AVR (86.7±33pg/ml) followed by ACR (73.4±33pg/ml)
and BLR (69.4±52pg/ml). Statistical analyses showed significant difference in
MIG levels between ACR vs. AVR (P=0.018) and AVR vs. BLR (P=0.005).
However, no significance difference in MIG was observed between ACR vs.
BLR (P=0.103) (Table 5.5).
Table 5.5: Significance levels of MIG among rejection sub-classes
Sub-classes of Rejection P-value Significant level
ACR vs. AVR 0.018 Significant
ACR vs. BLR 0.103 Non-significant
AVR vs. BLR 0.005 Significant
Mann-Whitney U test (two independent sample tests) was applied

130
Figure 5.4: Box-plot of urinary MIG levels in the sub-classes of rejection.
Statistical analyses showed significant difference in MIG levels between ACR
vs. AVR (P=0.018) and AVR vs. BLR (P=0.005). However, no significance
difference in MIG was observed between ACR vs. BLR (P=0.103)
P=0.005
P=0.103
P=0.018

131
5.3.2. ROC curve analyses of MIG:
The area under the curve (AUC), sensitivity, specificity and significant
level with rejection are listed in Table 5.6.
The AUC for MIG was 0.54±0.04 (AUC±S.E; 95% CI: 0.46-0.61) and
the optimum sensitivity (46%) and specificity (55%) was observed for
rejection group at cut-off of 6pg/ml. This shows that MIG is a not a good
predictive marker for rejection (Figure 5.5).
Table 5.6: Receiver operating characteristic curve for urinary MIG levels
Marker AUC ± S.E (95% CI)
Cut off (pg/ml)
Sensitivity/ Specificity
(%) P-value
MIG
0.54±0.04 (0.46-0.61)
6
46/55 0.385
AUC = Area Under the Curve
CI = Confidence Interval
S.E = Standard Error

132
Figure 5.5: Receiver operating characteristic of urinary MIG levels. It
showed an AUC of 0.54±0.04 (95% CI: 0.46-0.61) with 46% sensitivity and
55% specificity at cut-off level of 6pg/ml.

133
5.4. Discussion:
Despite immunosuppressive drugs and advanced clinical care, graft
rejection remains the major hurdle in successful organ transplantation. The
gold standard method for confirming the diagnosis of rejection is a graft
biopsy. However, the invasive nature of this procedure is a major limitation
that restricts its usage for diagnosis and monitoring of graft dysfunction.
Therefore, markers are needed based on non-invasive methods which correlate
with graft rejection and guide clinicians about the graft status.
This study is part of our effort to investigate urinary markers
associated with renal graft monitoring particularly for the early diagnosis of
rejection. Previously, our centre has reported that half (54%) of the cases that
underwent biopsy procedure showed histopathological features of acute
rejection (24%) and IFTA (29.8%) (Kazi and Mubarak, 2012). Therefore, it
was anticipated that by identifying markers associated with these features
(rejection and IFTA) would help to identify high risk group for rejection. In
addition, it would also reduce the number of graft biopsies performed as
recently reported by Hirt-Minkowski (Hirt-Minkowski et al., 2012).
Investigating the urinary levels of MIG showed varied levels
across the groups (rejection, non-rejection, stable graft and healthy donors)
ranging from 0-2098pg/ml., Increased mean MIG level was found in the
rejection group as compared to non-rejection and other groups (stable graft
and healthy donors). However, the difference was not statistically significant
(P<0.05). Previous studies have shown significant increases in MIG levels in
rejection. These studies suggested that MIG is a good marker for rejection
with (79%-93%) sensitivity and specificity (Hu et al., 2004; Hauser et al.,

134
2005; Jackson et al., 2011; De Muro et al., 2013). However, we found low
sensitivity and specificity of this marker for rejection group.
These conflicting results could be due to sample size (low rejection
cases) and variation in the techniques as well as analysis methods. In our
study, large number of rejection cases (n=108) were included compared to Hu
et al., 2004 (n=28), Hauser et al., 2005 (n=15), Schaub et al., 2009 (n=57),
Jackson et al., 2011(n=25) and Pierina De Muro et al., 2013(n=19). MIG was
quantified by ELISA technique and analyzed without normalization with
urinary creatinine. Only two studies were found (Hauser et al., 2005 and
Pierina De Muro et al., 2013) that used the same methodology. Further studies
using more number of rejection cases and uniform methodology would better
delineate its association with graft outcome.
The therapeutic approach of neutralizing MIG during an early post
transplant period has also been suggested to prevent chronic graft
vasculopathy and graft fibrosis (Miura et al., 2003). However, Ho et al.,
(2010) reported no such association of MIG with histology (interstitial fibrosis
and tubular atrophy) and graft outcome. Similarly, we also did not find any
association of MIG with IFTA group.
This is the first study on the association of urinary MIG with renal
allograft rejection from Pakistan. This study demonstrates that monitoring of
urinary MIG concentration is not a useful indicator for graft rejection.

135
5.5. References: Asaoka T, Marubashi S, Kobayashi S, Hama N, Eguchi H, Takeda Y, Tanemura M,Wada H, Takemasa I, Takahashi H, Ruiz P, Doki Y, Mori M, Nagano H. (2012). Intragraft transcriptome level of CXCL9 as biomarker of acute cellular rejection after liver transplantation. J Surg Res. 178(2):1003-1014. Auerbach MB, Shimoda N, Amano H, Rosenblum JM, Kish DD, Farber JM, Fairchild RL. (2009). Monokine induced by interferon-gamma (MIG/CXCL9) is derived from both donor and recipient sources during rejection of class II major Histocompatibility complex disparate skin allografts. Am J Pathol. 174(6):2172-81.
De Muro P, Faedda R, Masala A, Lepedda AJ, Zinellu E, Ciccarese M, Cossu M, Pala PG, Satta RP, Formato M. (2013). Kidney post-transplant monitoring of urinary glycosaminoglycans/proteoglycans and monokine induced by IFN-γ (MIG). Clin Exp Med. 13(1):59-65.
Farber JM. (1993). HuMig: a new human member of the chemokine family of cytokines. Biochem Biophys Res Commun. 192(1):223-30.
Hauser IA, Spiegler S, Kiss E, Gauer S, Sichler O, Scheuermann EH, Ackermann H, Pfeilschifter JM, Geiger H, Gröne HJ, Radeke HH. (2005). Prediction of acute renal allograft rejection by urinary monokine induced by IFN-gamma (MIG). J Am Soc Nephrol. 16(6):1849-58.
Hirt-Minkowski P, Amico P, Ho J, Gao A, Bestland J, Hopfer H, Steiger J, Dickenmann M, Burkhalter F, Rush D, Nickerson P, Schaub S. (2012). Detection of clinical and subclinical tubulo-interstitial inflammation by the urinary CXCL10 chemokine in a real-life setting. Am J. Transplant. 12(7):1811-23.
Ho J, Rush DN, Gibson IW, Karpinski M, Storsley L, Bestland J, Stefura W, HayGlass KT, Nickerson PW. (2010). Early urinary CCL2 is associated with the laterdevelopment of interstitial fibrosis and tubular atrophy in renal allografts.Transplantation. 90(4):394-400.
Hu H, Aizenstein BD, Puchalski A, Burmania JA, Hamawy MM, Knechtle SJ. (2004). Elevation of CXCR3-binding chemokines in urine indicates acute renal-allograft dysfunction. Am J Transplant. 4(3):432-437. Jackson JA, Kim EJ, Begley B, Cheeseman J, Harden T, Perez SD, Thomas S, Warshaw B, Kirk AD. (2011). Urinary chemokines CXCL9 and CXCL10 are noninvasive markers of renal allograft rejection and BK viral infection. Am J Transplant. 11(10):2228-2234. Kazi JI, Mubarak M. (2012). Biopsy Findings in Renal Allograft Dysfunction in a Live Related Renal Transplant Program. J Transplant Technol Res 2:108.

136
Koga S, Auerbach MB, Engeman TM, Novick AC, Toma H, Fairchild RL. (1999). T cell infiltration into class II MHC-disparate allografts and acute rejection is dependent on the IFN-gamma-induced chemokine Mig. J Immunol. 163(9):4878-85. Lazzeri E, Rotondi M, Mazzinghi B, Lasagni L, Buonamano A, Rosati A, Pradella F, Fossombroni V, La Villa G, Gacci M, Bertoni E, Serio M, Salvadori M, Romagnani P. (2005). High CXCL10 expression in rejected kidneys and predictive role of pretransplant serum CXCL10 for acute rejection and chronic allograft nephropathy. Transplantation. 79(9):1215-20. Miura M, Morita K, Koyanagi T, Fairchild RL. (2003). Neutralization of monokine induced by interferon-gamma during the early post transplantation period prevents development of chronic allograft vasculopathy and graft fibrosis. Transplant Proc. 35(2):875-7. Pereira AB, Teixeira AL, Rezende NA, Pereira RM, Miranda DM, Oliveira EA, Teixeira MM, Simões E Silva AC. (2012). Urinary chemokines and anti-inflammatory molecules in renal transplanted patients as potential biomarkers of graft function: a prospective study. Int Urol Nephrol. 44(5):1539-1548.
Racusen LC, Solez K, Colvin RB, Bonsib SM, Castro MC, Cavallo T, Croker BP,Demetris AJ, Drachenberg CB, Fogo AB, Furness P, Gaber LW, Gibson IW, Glotz D,Goldberg JC, Grande J, Halloran PF, Hansen HE, Hartley B, Hayry PJ, Hill CM,Hoffman EO, Hunsicker LG, Lindblad AS, Yamaguchi Y, et al.( 1999). The Banff 97 working classification of renal allograft pathology. Kidney Int. 55(2):713-23
Roedder S, Vitalone M, Khatri P, Sarwal MM. (2011). Biomarkers in solid organ transplantation: establishing personalized transplantation medicine. Genome Med. 3(6):37.
Suthanthiran M, Schwartz JE, Ding R, Abecassis M, Dadhania D, Samstein B, Knechtle SJ, Friedewald J, Becker YT, Sharma VK, Williams NM, Chang CS, Hoang C, Muthukumar T, August P, Keslar KS, Fairchild RL, Hricik DE, Heeger PS, Han L, Liu J, Riggs M, Ikle DN, Bridges ND, Shaked A. (2013). Clinical Trials in Organ Transplantation 04 (CTOT-04) Study Investigators. Urinary-cell mRNA profile and acute cellular rejection in kidney allografts. N Engl J Med. 369(1):20-31. Whiting D, Hsieh G, Yun JJ, Banerji A, Yao W, Fishbein MC, Belperio J, Strieter RM, Bonavida B, Ardehali A. (2004). Chemokine monokine induced by IFN-gamma/CXC chemokine ligand 9 stimulates T lymphocyte proliferation and effector cytokine production. J Immunol. 172(12):7417-24.

137
6. Urinary monocyte chemotactic protein-1 levels and its
association with renal allograft rejection.
138
6.1. Introduction:
Currently, diagnosis of graft rejection is based on gold standard
technique of graft biopsy. However, invasive procedure of graft biopsy limits
its usage in transplantation. Hence, identification of rejection by marker(s)
using non-invasive samples (urine/blood) would be ideal to
prognosis/diagnosis of rejection early as well as accurately.
Human monocyte chemotactic protein-1 (MCP-1/CCL2) belongs to
chemokine C-C family (Gu et al., 1999). The gene product of MCP-1 is
composed of 76 amino acids having molecular size of 13kDa (Van Coillie et
al., 1999). This early chemokine is released in response to inflammatory
mediators (TNF and INF-γ) after surgical procedures (ischemic reperfusion)
(Rice et al., 2002). Many cell types also produce MCP-1 such as endothelial
cells, epithelial cells, fibroblasts and smooth muscle cells. As MCP-1 has high
chemoattractant potency for immune cells, it attracts/directs immune cells
(monocytes/macrophage, NK cells and T-cells) to the inflamed/injured site
(Ajuebor et al., 1998; Robertson et al., 2000).
MCP-1 is an important chemokine involved in the regulation of
allograft rejection phenomena. The intra-renal expression analysis has showed
an increased level of MCP-1 at time of injury/rejection(s) which correlates
with monocyte infiltration and renal damage (Rovin et al., 1996;
Prodjosudjadi et al., 1996; Grandaliano et al., 1997; Robertson et al., 2000;
Rüster et al., 2004). This high expression of MCP-1 ligand and its
corresponding chemokine receptors (CCR2), contribute in the graft outcome
(Segerer et al., 2001). Positive correlations have also been reported between
urinary MCP-1 levels and degree of leukocytes infiltration in the kidney

139
(Rovin et al., 1996; Wada et al., 1999; Tam et al., 2004). Similarly, increased
excretory MCP-1 level has also been reported with renal graft
rejection/dysfunction (Prodjosudjadi et al., 1996; Grandaliano et al., 1997;
Boratyńska 1998; Sun et al., 2003; Dubiński et al., 2008). Thus, urinary levels
of MCP-1 may reflect the immune status and provide a non-invasive tool for
graft monitoring.
This study was carried out to determine the urinary level of MCP-1 in
stable graft, rejection and non-rejection renal transplant patients and its utility
as a marker for the identification of graft rejection.
6.2. Material and Methods:
This study was approved by the Institutional Review Board and
conformed to the tenets of the declaration of Helsinki. Inform consent was
taken from all the participants at the Sindh Institute of Urology and
Transplantation, (S.I.U.T).
A total of 409 urine samples from 300 renal transplant patients and 109
healthy renal donors were included in this study. Among transplant patients,
258 patients underwent biopsy procedure(s) and diagnosed as rejection
(n=165) and non-rejection (n=93) based on Banff classification (Racusen et
al., 1999). However, 42 patients, categorized as stable grafts, had no history of
biopsy and serum creatinine levels were maintained at 0.5-1.5mg/dl during the
first two months of post-transplantation.
The samples were grouped as rejection (n=165), non-rejection (n=93),
stable graft (n=42) and controls (healthy donors; n=109) Figure 6.1. The non-
rejection groups were further sub-classified into IFTA (n=47) and NAD
(n=46).

140
6.2.1. Urine samples and MCP-1 quantification:
Early morning urine samples were collected from healthy donors,
stable grafts and patients who had undergone graft biopsy procedure. Urine
samples were processed and quantified for MCP-1 concentration by enzyme-
linked immunoassay using human CCL2/MCP-1 Quantikine ELISA kit (R&D
system; Minneapolis, MN, USA), as described earlier in material and method
section.
The optical density of samples was determined at 450nm with wave
length correction of 540nm using the microplate reader (Synergy 2, BioTek®
Instrument, Inc, USA). A standard curve was generated using MCP-1
standards and subsequently the concentration of samples was determined by
the microplate data collection and analysis software, Gen5® version 1.08. As
each sample was diluted and assayed in duplicate for MCP-1 levels, the
measured concentration was multiplied by 2 (dilution factor) and the average
concentration of MCP-1was used for statistical analysis.

141
Figure 6.1: Schematic representation of samples for urinary MCP-1 study. A total of 409 urine samples were included based on our
criteria. Among renal transplant patients, 258 patients underwent biopsy procedure(s) and diagnosed as rejection (n=165) and non-
rejection (n=93) based on Banff classification. Forty-two (n=42) patients of stable grafts and 109 healthy donors were also included.

142
6.2.2. Statistical Analysis:
Statistical analyses were carried out with Statistical Package for
Social Sciences software (SPSS version 17; SPSS Inc., Chicago, IL, USA).
The average concentration of MCP-1 was calculated for rejection, non-
rejection, stable grafts and control groups. Non-parametric tests (Kruskal-
Wallis and Mann-Whitney) were applied to identify significant difference of
MCP-1 levels across the groups. A p-value of less than 0.05 was considered to
be significant (P<0.05).
The receiver operating characteristic (ROC) curve was constructed to
determine the area under the curve (AUC), the optimum sensitivity and
specificity for urinary MCP-1 levels as a marker for rejection, at certain
threshold level, using MedCalc® statistical software (version 12.7.5)
(http://www.medcalc.org).
MCP-1 levels were further analyzed for their impact on rejection-free
graft survival. The cumulative survival time of renal allograft was calculated
by Kaplan-Meier (KM) curve and the log-rank test was applied to calculate the
statistical significance among the transplant patients.
6.3. Results:
6.3.1. Clinical characteristics of patients:
The clinical characteristics data of all participants such as age,
gender, relation with donor, HLA match, drug regimen, induction therapy and
anti-rejection therapy are provided in Table 6.1. Across the groups, transplant
patients include 69-87% males and 12-31% females; with a mean age range of
26-31±years. On the other hand, control group consisted of 48% male and
52% female donors with a mean age of 35 years.

143
Table 6.1: Clinical characteristics of study population
REJ (n=165)
NON-REJ
(n=93)
STABLE GRAFT (n=42)
CONTROL (n=109)
Gender Females 25(15%) 12(13%) 13(31%) 57(52%) Males 140(85%) 81(87%) 29(69%) 52(48%) Age of Recipient (Mean ± S.E) (Range)
26±0.75 (8-55yrs)
30±1.5 (8-53yrs)
29±1.68 (7-58yrs)
-
Etiology of ESRD Unknown cause 111(67%) 67(72%) 26(62%) - Stone disease 18(11%) 15(16%) 5(12%) - Glomerular disease 11(6.7%) 5(5.4%) 3(7%) - Donor-Recipient HLA match at A, B and DR locus 1Hap - 3 Ags Match 61(37%) 34(36.5%) 9(21.4%) - 1Hap - 4 Ags Match 40(24%) 22(23.6%) 9(21.4%) - 1Hap - 5Ags Match 19(11.5%) 11(12%) 5(12%) - Identical Match 9(5.5%) 7(7.5%) 13(31%) - Induction therapy No induction therapy 122(74%) 81(87%) 36(86%) - Simulect 24(14.5%) 6(6.4%) 5(12%) - ATG 19(11.5%) 6(6.4%) 1(2.4%) - Primary immunosuppressant drugs CYA/AZA/PRED 136(82.4%) 84(90%) 39(93%) - TAC/MMF/PRED 21(12.7%) 7(7.5%) 2(5%) - Anti-rejection therapy ATG 58(35%) - - - Solumedrol 107(65%) - - -
Rej = Rejection, CYA = Cyclosporine, AZA= Azathioprine, PRED = Prednisolone, Ags = Antigens, ATG = Antithymocyte globulin, S.E = Standard Error, Hap = Haplotype

144
6.3.2. Urinary levels of MCP-1 and their association with rejection:
Urinary levels of MCP-1 were determined in 409 urine samples of 353
participants of various groups (Table 6.2). The graft rejection group showed
high levels of MCP-1 concentration (953±69pg/ml) as compared to stable
grafts (254±57pg/ml), no abnormality detected (296±40pg/ml), IFTA
(228±49pg/ml) and control groups (38±13pg/ml).
Table 6.2:Urinary levels of MCP-1 among different study groups
Groups
MCP-1 pg/ml (Mean ± S.E)
NAD (n = 47) 296 ± 40
IFTA (n = 46 ) 228 ± 49
REJ (n = 165) 953 ± 69
Stable grafts (n= 42) 254 ± 57
Control (n = 109) 38 ± 13
NAD = No abnormality detected, IFTA = Interstitial fibrosis and tubular
atrophy, REJ = Rejection, S.E = Standard Error
The significant association of urinary MCP-1 levels with rejection group
was determined by comparing with non-rejection, stable grafts and control
groups using non-parametric test (Kruskal-Wallis and Mann-Whitney).
Results showed significant difference in MCP-1 levels between rejection and
non-rejection (NAD and IFTA) and other groups (control and stable grafts) i.e.
P<0.05 (Figure 6.2; Table 6.3). Significant difference in MCP-1 levels was
also observed between IFTA vs. NAD (P=0.030), IFTA vs. control (P<0.001),

145
NAD vs. control (P<0.001) and stable grafts vs. control group (P<0.001). This
indicates that MCP-1 levels varied significantly across the groups and could
differentiate between histopathological conditions such as rejection vs. non-
rejection. No significant difference was observed between NAD vs. stable
grafts (P=0.120) and IFTA vs. stable grafts (P=0.810) Figure 6.3.
Table 6.3: Association levels of urinary MCP-1 among groups.
Groups
P-value
Outcome
REJ vs. NAD <0.001 Significant
REJ vs. IFTA <0.001 Significant
REJ vs. Control <0.001 Significant
REJ vs. stable graft <0.001 Significant
IFTA vs. NAD 0.030 Significant
IFTA vs. Control <0.001 Significant
IFTA vs. stable graft 0.810 Non-Significant
NAD vs. Control <0.001 Significant
NAD vs. stable graft 0.120 Non-Significant
Control vs. stable graft <0.001 Significant
P value less than 0.05(P<0.05) = Significant
Mann-Whitney U test (two independent sample tests)

146
Figure 6.2: MCP-1 levels in rejection and non-rejection groups. MCP-1
levels were significantly higher in rejection group as compared non-
rejection (P<0.001).

147
Figure 6.3: Urinary levels of MCP-1 among various study groups.
Significant difference was found between rejection, non-rejection (NAD and
IFTA), control and stable graft i.e. P<0.05. Significant difference was also
observed between IFTA vs. NAD (P=0.030), IFTA vs. control (P<0.001),
NAD vs. control (P<0.001) and stable graft vs. control group (P<0.001). No
significant difference in MCP-1 level was observed between stable graft vs.
NAD (P=0.120) and stable graft vs. IFTA (P=0.810).

148
6.3.3. ROC Curve Analyses for MCP-1:
An area under the curve (AUC), specificity, sensitivity and the
significant level of MCP-1 are listed in Table 6.4.
The optimum sensitivity (84%) and specificity (74%) was observed
for the patients diagnosed as rejection at a cut-off 214pg/ml of MCP-1 with an
area under the curve of 0.83±0.04 (AUC±S.E) (95% CI: 0.77-0.88) when
compared with stable grafts (Figure 6.4). Similar sensitivity (87%) but low
specificity (62%) was observed when the rejection group was compared with
non-rejection group at 198pg/ml of MCP-1, with area under the curve of
0.81±0.03 (95% CI: 0.76 – 0.86). This indicates that urinary MCP-1 is a good
predictive marker for rejection episodes.
Table 6.4: Receiver operating characteristic for MCP-1
Group AUC±S.E (95% C.I)
Cut-off point (pg/ml)
Sensitivity &
Specificity (%) P-value
MCP-1 (Rej vs. Stable grafts)
0.83 ± 0.04 (0.77– 0.88)
214 84/74 <0.001
MCP-1 (Rej vs. Non-Rej)
0.81 ± 0.03 (0.76 – 0.86)
198 87/62 <0.001
AUC = Area under the curve S.E = Standard Error

149
Figure 6.4: Receiver operating characteristic curve of urinary MCP-1 levels
analyzed for patients diagnosed as rejection. It showed an area of 0.83±0.04
under the curve with sensitivity of 84% and specificity of 74% at cut-off
214pg/ml for MCP-1.

150
6.3.4. Effect of Urinary MCP-1 level on Graft Survival:
MCP-1 levels were further investigated to find out the effect on cumulative
rejection-free graft survival. Transplant patients were categorized into two
groups according to the cut-off value of 214pg/ml of MCP-1 (i.e. >214pg/ml
and <214pg/ml of MCP-1). Kaplan-Meier curve was constructed to determine
cumulative rejection-free graft survival and significant levels by log-rank test
for categorized groups (Table 6.5). It was observed that urinary MCP-1 levels
>214pg/ml had significantly lower rejection-free graft survival as compared to
patients with <214pg/ml at certain time periods such as 3 months, 6 months,
12 months and 24 months. Results indicate significant differences between
two groups at all time periods i.e. 4 vs. 9 weeks, log-rank P<0.001; 8 vs. 18
weeks, log-rank P<0.001; 10 vs. 27 weeks, log-rank P<0.001 and 27 vs. 70
weeks; log-rank P<0.001 respectively (Figure 6.5).
Table 6.5: Kaplan-Meier survival curve for transplant patients categorized into two groups based on MCP-1 levels.
MCP-1 Total N No. of
Events Censored
N Percent <214pg/ml 92 20 72 78.3% >214pg/ml 141 104 37 26.2% Overall 233 124 109 46.8%
Overall Comparisons Chi-Square d.f. Sig.
Log-rank (Mantel-Cox)
40.367
1
0.000
d.f = degree of freedom

151
Figure 6.5: Kaplan-Meier survival curve for transplant patients categorized
into <214pg/ml and >214pg/ml MCP-1 levels in 24 months (104 weeks) post-
transplantation.
152
6.4. Discussion:
Molecular changes in a graft precede any pathological changes and are
ultimately reflected by clinical symptoms. Detection of molecular
changes/patterns associated with rejection before these manifest at
histopathological or clinical levels by non-invasive marker(s), is the most
active area of current transplant research. Chemokine levels are suggested to
reflect these molecular changes as they mediate immune response against
allograft. Increased expression levels of multiple chemokines and their
cognate receptors play a significant role in allograft rejection process.
MCP-1 is one of the most powerful chemoattractant that is involved in
the pathogenesis of renal diseases/failure (Segerer et al., 2000; Viedt et al.,
2002). MCP-1 is produced by proximal tubular epithelial cells which triggers a
series of inflammatory events. It includes secretion of other chemokines and
activation of transcription factors which ultimately progress to
tubulointerstitial damage (Viedt et al., 2002).
The main finding of this study is the association of MCP-1 with the
rejection group. An increased MCP-1 level was found which differentiated
rejection group from other study groups i.e. non-rejection, stable graft and
control groups. The ROC curve analyses also illustrated that MCP-1 is a good
marker for rejection having AUC of 0.83±0.04 with sensitivity and specificity
of 84% and 74% respectively. Despite limited studies on MCP-1 in renal
transplantation, our study findings are in accordance to previous studies that
showed that MCP-1 is associated with rejection (Rüster et al., 2004; Dubinski
et al., 2008; De Serres et al., 2012).

153
Ho et al., (2010, 2012) have also showed that the MCP-1 is associated
with development of IFTA as well as graft loss. In this study, we also found an
association of MCP-1 levels with IFTA development. MCP-1 levels
significantly differentiated IFTA from other groups such as NAD, control and
rejection groups. This indicates that MCP-1 levels could reflect the changes
that lead to development of IFTA. The concentration of MCP-1 was lower in
the IFTA group as compared to the rejection group. This may be due to the
fact that its expression level is significantly lower in IFTA as compared to
rejection (Rüster et al., 2004).
There are some limitations in this study. MCP-1 was studied on
exclusive diagnosed cases of single event on graft biopsy such as rejection
(acute T-cell mediated rejection), normal histology and interstitial
fibrosis/tubular atrophy. Due to low number (1%) of antibody mediated
rejection (AMR) cases in our centre, these cases were excluded (Kazi and
Mubarak 2012). Study MCP-1 in other histopathological diagnosed cases of
drug toxicity, infections and in other rejection types (AMR and chronic
rejection would help in understanding its role in graft outcome.
It would be informative to determine MCP-1 levels
(increased/decreased) at the end of the anti-rejection therapy, with biopsy
proven rejection resolved, to reflect/monitor the patient response to therapy.
However, our institute does not have a policy to perform protocol biopsy.
Unfortunately, lack of data regarding urinary biomarkers for renal and other
transplant organs from other centres are also a major limiting factor for
validation of any biomarker for rejection.

154
This study as well as various previous studies have shown association
of urinary MCP-1 levels with graft rejection and suggest it as a clinically
useful diagnostic/prognostic marker. However, it is important to set up an
optimal threshold (cut-off) level of MCP-1 to delineate the clinical relevance
of the test. Further studies to evaluate the threshold levels at times of rejection
would be helpful for correct and early diagnosis.

155
6.5. References:
Ajuebor MN, Flower RJ, Hannon R, Christie M, Bowers K, Verity A, Perretti M. (1998). Endogenous monocyte chemoattractant protein-1 recruits monocytes in the zymosan peritonitis model. J Leukoc Biol. 63(1):108-116.
Boratyńska M. (1998).The role of monocyte chemotactic peptide (MCP-1) in chronic renal allograft rejection. Pol Arch Med Wewn. 99(4):272-80.
De Serres SA, Mfarrej BG, Grafals M, Riella LV, Magee CN, Yeung MY, Dyer C, Ahmad U, Chandraker A, Najafian N. (2012). Derivation and validation of a cytokine-based assay to screen for acute rejection in renal transplant recipients. Clin J Am Soc Nephrol. 7(6):1018-25.
Dubiński B, Boratyńska M, Kopeć W, Szyber P, Patrzałek D, Klinger M. (2008). Activated cells in urine and monocyte chemotactic peptide-1 (MCP-1)--sensitive rejection markers in renal graft recipients. Transpl Immunol. 18(3):203-7.
Grandaliano G, Gesualdo L, Ranieri E, Monno R, Stallone G, Schena FP. (1997). Monocyte chemotactic peptide-1 expression and monocyte infiltration in acute renal transplant rejection. Transplantation. 6(3):414-20.
Gu L, Tseng SC, Rollins BJ. (1999). Monocyte chemoattractant protein-1. Chem Immunol. 72:7-29.
Prodjosudjadi W, Daha MR, Gerritsma JS, Florijn KW, Barendregt JN, Bruijn JA,van der Woude FJ, van Es LA. (1996). Increased urinary excretion of monocyte chemoattractant protein-1 during acute renal allograft rejection. Nephrol DialTransplant. 11(6):1096-103.
Racusen LC, Solez K, Colvin RB, Bonsib SM, Castro MC, Cavallo T, Croker BP, Demetris AJ, Drachenberg CB, Fogo AB, Furness P, Gaber LW, Gibson IW, Glotz D,Goldberg JC, Grande J, Halloran PF, Hansen HE, Hartley B, Hayry PJ, Hill CM,Hoffman EO, Hunsicker LG, Lindblad AS, Yamaguchi Y, et al.( 1999). The Banff 97 working classification of renal allograft pathology.Kidney Int. 55(2):713-23
Rice JC, Spence JS, Yetman DL, Safirstein RL. (2002). Monocyte chemoattractant protein-1 expression correlates with monocyte infiltration in the post-ischemic kidney. Ren Fail. 24(6):703-23 Robertson H, Morley AR, Talbot D, Callanan K, Kirby JA. (2000). Renal allograft rejection: beta-chemokine involvement in the development of tubulitis. Transplantation. 69(4):684-687. Rollins BJ. (1997). Chemokines. Blood 90(3): 909-928.
Rovin BH, Doe N, Tan LC. (1996). Monocyte chemoattractant protein-1 levels in patients with glomerular disease. Am. J Kidney Dis. 27(5):640-6.

156
Rüster M, Sperschneider H, Fünfstück R, Stein G, Gröne HJ. (2004). Differential expression of beta-chemokines MCP-1 and RANTES and their receptors CCR1, CCR2, CCR5 in acute rejection and chronic allograft nephropathy of human renal allografts. Clin Nephrol. 61(1):30-9.
Segerer S, Cui Y, Hudkins KL, Goodpaster T, Eitner F, Mack M, Schlöndorff D, Alpers CE. (2000). Expression of the chemokine monocyte chemoattractant protein-1 and its receptor chemokine receptor 2 in human crescentic glomerulonephritis. J Am Soc Nephrol. 11(12):2231-42.
Segerer S, Cui Y, Eitner F, Goodpaster T, Hudkins KL, Mack M, Cartron JP, Colin Y, Schlondorff D, Alpers CE. (2001). Expression of chemokines and chemokine receptors during human renal transplant rejection. Am. J Kidney Dis. 37(3):518-31.
Sun XH, Tan JM, Wu WZ, Lin WH, Li QS, Fang YH. (2003). [Significance of detecting urinary monocyte chemotactic peptide-1 in renal transplant recipient]. Xi Bao Yu Fen Zi Mian Yi Xue Za Zhi. 19(6):563-4.
Tam FW, Sanders JS, George A, Hammad T, Miller C, Dougan T, Cook HT, Kallenberg CG, Gaskin G, Levy JB, Pusey CD. (2004). Urinary monocyte chemoattractant protein-1 (MCP-1) is a marker of active renal vasculitis. Nephrol Dial Transplant. 19(11):2761-8.
Van Coillie E, Van Damme J, Opdenakker G. (1999). The MCP/eotaxin subfamily of CC chemokines. Cytokine Growth Factor Rev. 10(1):61-86.
Viedt C, Dechend R, Fei J, Hänsch GM, Kreuzer J, Orth SR. (2002). MCP-1 induces inflammatory activation of human tubular epithelial cells:involvement of the transcription factors, nuclear factor-kappaB and activating protein-1.J Am Soc Nephrol. 13(6):1534-47.
Wada T, Furuichi K, Segawa-Takaeda C, Shimizu M, Sakai N, Takeda SI, Takasawa K, Kida H, Kobayashi KI, Mukaida N, Ohmoto Y, Matsushima K, Yokoyama H. (1999). MIP-1alpha and MCP-1 contribute to crescents and interstitial lesions in human crescentic glomerulonephritis. Kidney Int. 56(3):995-1003.
Wu Y, Yang L, Su T, Wang C, Liu G, Li XM. (2010). Pathological significance of a panel of urinary biomarkers in patients with drug-induced tubulointerstitial nephritis. Clin J Am Soc Nephrol. 5(11):1954-9. Varma PP, Hooda AK, T Sinha, GS Chopra, SC Karan, GS Sethi, Badwal S, Kotwal A. (2007). Renal Transplantation - An Experience of 500 Patients. MJAFI. 63: 107-111.

157
Chapter-7: Discussion and Future Perspective
Renal transplantation is the most effective available treatment for
ESRD world-wide. In Pakistan, only 2.3 % of ESRD patients have access to
this therapy. The graft survival and patient survival rate is 65% and 75% at 5-
years of transplantation (Rizvi et al., 2009). The biggest hurdle in successful
transplantation is allograft rejection that occurs in 26 percent of cases during
the first post-transplantation year (Firasat et al., 2012). Early diagnosis of
rejection is crucial for optimum management of graft functioning. Currently,
serum creatinine is used as a diagnostic and monitoring marker for graft
functioning and graft biopsy is the gold standard technique for confirming
diagnosis of graft dysfunction. However both these tests have limitations as
serum creatinine is a late indicator of graft dysfunction and graft biopsy is an
invasive procedure which limits its usage (Manno et al., 2004).
The main aim of the study was to identify gene polymorphisms of
immune regulatory molecules associated with graft rejection. We investigated
the association of CCR2V64I, CCR5-59029G>A and CCR5Δ32
polymorphisms in the immune regulation of renal allograft to identify patients
at high risk for rejection based on their genetic make-up. Therapeutic
strategies that target specific immunological components involved in the
facilitation/provocation of rejection mechanism may reduce the rejection risk.
Thus, identification of such prognostic marker(s) would help in proper and
effective management of transplantation.
Another aim of this study was to identify early and non-invasive
markers associated with renal allograft rejection. Chemokine are released at
early phase of graft injury and their quantification by non-invasive method in
urine samples may reflect the immunological status of the kidney graft

158
(Jackson et al., 2011). Therefore, urinary chemokine levels could be used to
predict the onset of rejection earlier than serum creatinine. Such early non-
invasive markers would assist clinicians in graft assessment and help in early
diagnosis of rejection.
This is the first study investigating the gene polymorphisms of CCR2
and CCR5 and their role in the renal transplant patients from Pakistan. The
significant finding was the association of AA genotype of CCR2 with the
rejection outcome, which follows the same trends as reported from
neighboring country (India: Singh et al., 2008). Another important finding was
the significantly elevated levels of urinary chemokines of IP-10 and MCP-1
among biopsy-proven rejection. This would help clinician(s), in association
with other existing markers, in the graft assessment and guide regarding the
need of graft biopsy.
159
7.1. References:
Firasat S, Raza A, Abid A, Aziz T, Mubarak M, Naqvi SA, Rizvi SA, Mehdi SQ, Khaliq S. (2012). The effect of chemokine receptor gene polymorphisms (CCR2V64I, CCR5-59029G>A and CCR5Δ32) on renal allograft survival in Pakistani transplant patients. Gene. 511(2):314-9.
Jackson JA, Kim EJ, Begley B, Cheeseman J, Harden T, Perez SD, Thomas S, Warshaw B, Kirk AD. (2011). Urinary chemokines CXCL9 and CXCL10 are noninvasive markers of renal allograft rejection and BK viral infection. Am J Transplant. 11(10):2228-2234
Manno C, Strippoli GF, Arnesano L, Bonifati C, Campobasso N, Gesualdo L, Schena FP. (2004) Predictors of bleeding complications in percutaneous ultrasound-guided renal biopsy. Kidney Int. 66(4):1570-7.
Rizvi SA, Zafar MN, Lanewala AA, Naqvi SA. (2009). Challenges in pediatric renal transplantation in developing countries. Curr. Opin. Organ Transplant. 14(5): 533-539.
Singh R, Kapoor R, Srivastava A, Mittal RD. (2008). Impact of chemokine receptor CCR2 and CCR5 gene polymorphism on allograft outcome in North Indian renal transplant recipients. Scand. J. Immunol. 69(1): 51-56.