Embed Size (px)
Citation preview
ANALYSIS OF GEOLOGIC MATERIALS USING RIETVELDQUANTIATIVE X-RAY DIFFRACTION
Robin M. Gonzalez, Thomas E. Edwards, Timothy D. Lorbiecke, Ryan S. Winburn, andJohn R. Webster*
Division of Science, Minot State University, 500 University Ave. W. Minot, ND 58707
ABSTRACT
Rietveld quantitative X-ray diffraction (RQXRD) was used to quantify the mineralogy of avolcanic rock (dacite). To assess the success of the RQXRD method, the bulk mineralogy of thedacite was determined through a combination of optical study of phenocrysts (plagioclase,augite, orthopyroxene, and Fe-Ti oxide) and detailed study of the groundmass using a scanningelectron microscope with an energy dispersive X-ray (SEM/EDX) analysis system. Thegroundmass consisted of distinct crystals of feldspar, pyroxene, and Fe-Ti oxide, and patches ofvery fine-grained mixtures (referred to as funkalite) of feldspar, SiO2 phase, and Fe-Ti oxide.Groundmass volume percentages were determined by point counting high magnification SEMphotomicrographs. These data were combined with phenocryst percentages and converted toweight percentages. The optical/SEM and RQXRD results compared rather well, suggestingRQXRD can provide a relatively rapid method for quantifying the mineralogy of volcanic rocks.
INTRODUCTION
The Rietveld method has been determined to provide relatively accurate results when applied tocoal combustion by-products [1,2,3]. The Rietveld method has been applied to igneous rocks [4],including volcanic rocks. Volcanic rocks in general have a porphyritic texture (having twodistinct crystal size populations) that reflects a two-stage cooling history. Slow cooling at depthresults in phenocrysts (larger crystals) and rapid cooling upon ascent and eruption results insmall crystals and/or glass that comprise the groundmass. Phenocrysts can be identified andquantified by optical microscopy, but the groundmass is too fine-grained to be studied optically.Use of a scanning electron microscope (SEM) to quantify the mineralogy, while suitable, is notfeasible for routine work because of the time involved.
Rietveld quantitative X-ray diffraction (RQXRD) is well suited for quantifying the mineralogy ofvolcanic rocks. However, evaluating the success of the Rietveld method for volcanic rocks isdifficult because the groundmass (typically the majority of the rock) is too fine-grained to studyby optical microscopy. RQXRD data have only been compared previously with normativemineralogy [4]. To obtain the "observed" bulk mineralogy needed to assess the RQXRD method,the groundmass mineralogy must be quantified and combined with phenocryst abundancesdetermined by optical microscopy. A major focus of this study was to characterize thegroundmass of a volcanic sample using a SEM with an energy dispersive X-ray (EDX) analysissystem.
This study involved testing RQXRD using a dacite sample (TL-11) from the central OregonHigh Cascades. This sample exhibited clear distinction between phenocrysts and groundmass.The phenocrysts were previously quantified using optical microscopy (point counting). Theyconsisted of plagioclase feldspar, less abundant augite, orthopyroxene, and Fe-Ti oxide, and atrace amount of olivine. Numerous phenocrysts were analyzed using an electron microprobe.
SEM/EDX METHOD
The SEM (JEOL SM-35CF) was used to obtain digital backscatter electron (BSE)photomicrographs at high magnifications (4000X). BSE images (Figure 1) are best fordistinguishing phases because intensity varies with the average atomic weight of the materials.These photomicrographs were used as a guide during EDX microanalysis. Microanalysis wascarried out in both spot mode (electron beam stationary) and in area mode (scanning at high
Copyright©JCPDS - International Centre for Diffraction Data 2003, Advances in X-ray Analysis, Volume 46. 204 ISSN 1097-0002
This document was presented at the Denver X-ray Conference (DXC) on Applications of X-ray Analysis. Sponsored by the International Centre for Diffraction Data (ICDD). This document is provided by ICDD in cooperation with the authors and presenters of the DXC for the express purpose of educating the scientific community. All copyrights for the document are retained by ICDD. Usage is restricted for the purposes of education and scientific research. DXC Website – www.dxcicdd.com
ICDD Website - www.icdd.com
ISSN 1097-0002
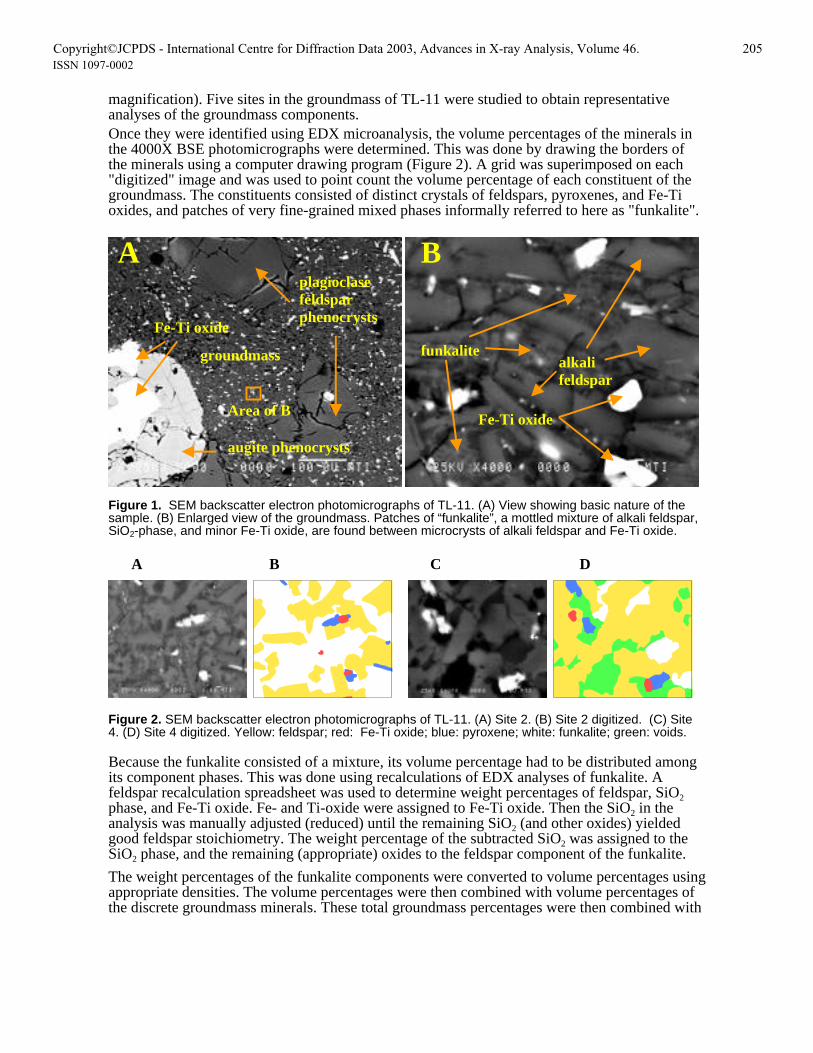
magnification). Five sites in the groundmass of TL-11 were studied to obtain representativeanalyses of the groundmass components.Once they were identified using EDX microanalysis, the volume percentages of the minerals inthe 4000X BSE photomicrographs were determined. This was done by drawing the borders ofthe minerals using a computer drawing program (Figure 2). A grid was superimposed on each"digitized" image and was used to point count the volume percentage of each constituent of thegroundmass. The constituents consisted of distinct crystals of feldspars, pyroxenes, and Fe-Tioxides, and patches of very fine-grained mixed phases informally referred to here as "funkalite".
Figure 1. SEM backscatter electron photomicrographs of TL-11. (A) View showing basic nature of thesample. (B) Enlarged view of the groundmass. Patches of “funkalite”, a mottled mixture of alkali feldspar,SiO2-phase, and minor Fe-Ti oxide, are found between microcrysts of alkali feldspar and Fe-Ti oxide.
A B C D
Figure 2. SEM backscatter electron photomicrographs of TL-11. (A) Site 2. (B) Site 2 digitized. (C) Site4. (D) Site 4 digitized. Yellow: feldspar; red: Fe-Ti oxide; blue: pyroxene; white: funkalite; green: voids.
Because the funkalite consisted of a mixture, its volume percentage had to be distributed amongits component phases. This was done using recalculations of EDX analyses of funkalite. Afeldspar recalculation spreadsheet was used to determine weight percentages of feldspar, SiO2phase, and Fe-Ti oxide. Fe- and Ti-oxide were assigned to Fe-Ti oxide. Then the SiO2 in theanalysis was manually adjusted (reduced) until the remaining SiO2 (and other oxides) yieldedgood feldspar stoichiometry. The weight percentage of the subtracted SiO2 was assigned to theSiO2 phase, and the remaining (appropriate) oxides to the feldspar component of the funkalite.
The weight percentages of the funkalite components were converted to volume percentages usingappropriate densities. The volume percentages were then combined with volume percentages ofthe discrete groundmass minerals. These total groundmass percentages were then combined with
Fe-Ti oxide
groundmass
plagioclasefeldsparphenocrysts
Area of B
augite phenocrysts
funkalitealkalifeldspar
Fe-Ti oxide
A B
Copyright©JCPDS - International Centre for Diffraction Data 2003, Advances in X-ray Analysis, Volume 46. 205 ISSN 1097-0002
the phenocryst percentages to obtain the bulk sample volume percentages. Finally, all volumepercentages were converted to weight percentages using appropriate densities.
OPTICAL AND SEM/EDX RESULTS
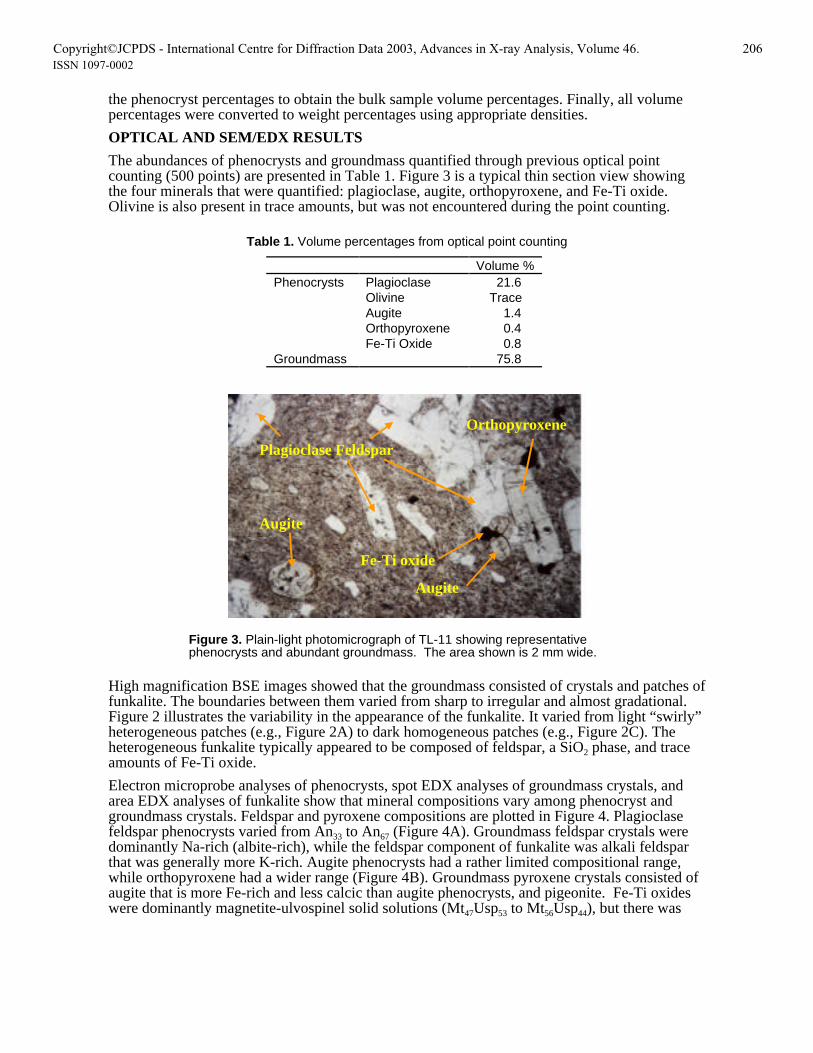
The abundances of phenocrysts and groundmass quantified through previous optical pointcounting (500 points) are presented in Table 1. Figure 3 is a typical thin section view showingthe four minerals that were quantified: plagioclase, augite, orthopyroxene, and Fe-Ti oxide.Olivine is also present in trace amounts, but was not encountered during the point counting.
Table 1. Volume percentages from optical point counting
Volume %Phenocrysts Plagioclase 21.6
Olivine TraceAugite 1.4Orthopyroxene 0.4Fe-Ti Oxide 0.8
Groundmass 75.8
Figure 3. Plain-light photomicrograph of TL-11 showing representativephenocrysts and abundant groundmass. The area shown is 2 mm wide.
High magnification BSE images showed that the groundmass consisted of crystals and patches offunkalite. The boundaries between them varied from sharp to irregular and almost gradational.Figure 2 illustrates the variability in the appearance of the funkalite. It varied from light “swirly”heterogeneous patches (e.g., Figure 2A) to dark homogeneous patches (e.g., Figure 2C). Theheterogeneous funkalite typically appeared to be composed of feldspar, a SiO2 phase, and traceamounts of Fe-Ti oxide.
Electron microprobe analyses of phenocrysts, spot EDX analyses of groundmass crystals, andarea EDX analyses of funkalite show that mineral compositions vary among phenocryst andgroundmass crystals. Feldspar and pyroxene compositions are plotted in Figure 4. Plagioclasefeldspar phenocrysts varied from An33 to An67 (Figure 4A). Groundmass feldspar crystals weredominantly Na-rich (albite-rich), while the feldspar component of funkalite was alkali feldsparthat was generally more K-rich. Augite phenocrysts had a rather limited compositional range,while orthopyroxene had a wider range (Figure 4B). Groundmass pyroxene crystals consisted ofaugite that is more Fe-rich and less calcic than augite phenocrysts, and pigeonite. Fe-Ti oxideswere dominantly magnetite-ulvospinel solid solutions (Mt47Usp53 to Mt56Usp44), but there was
Augite
Plagioclase Feldspar
Fe-Ti oxide
Orthopyroxene
Augite
Copyright©JCPDS - International Centre for Diffraction Data 2003, Advances in X-ray Analysis, Volume 46. 206 ISSN 1097-0002
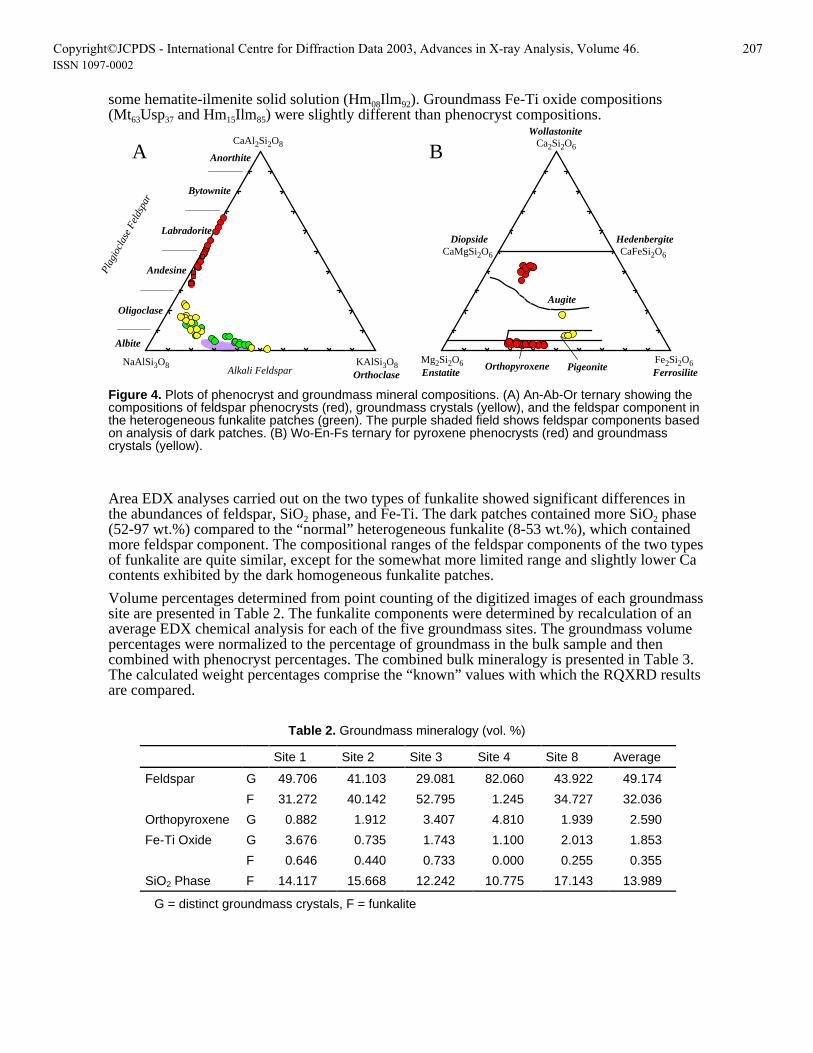
some hematite-ilmenite solid solution (Hm08Ilm92). Groundmass Fe-Ti oxide compositions(Mt63Usp37 and Hm15Ilm85) were slightly different than phenocryst compositions.
CaAl2Si2O8
NaAlSi3O8 KAlSi3O8Alkali Feldspar
Pl
agio
clas
e Fe
ldsp
ar
Anorthite
Bytownite
Labradorite
Andesine
Oligoclase
Albite
Orthoclase
Ca2Si2O6
Mg2Si2O6 Fe2Si2O6
CaFeSi2O6CaMgSi2O6
PigeoniteOrthopyroxene
Wollastonite
Diopside Hedenbergite
Enstatite Ferrosilite
Augite
A B
Figure 4. Plots of phenocryst and groundmass mineral compositions. (A) An-Ab-Or ternary showing thecompositions of feldspar phenocrysts (red), groundmass crystals (yellow), and the feldspar component inthe heterogeneous funkalite patches (green). The purple shaded field shows feldspar components basedon analysis of dark patches. (B) Wo-En-Fs ternary for pyroxene phenocrysts (red) and groundmasscrystals (yellow).
Area EDX analyses carried out on the two types of funkalite showed significant differences inthe abundances of feldspar, SiO2 phase, and Fe-Ti. The dark patches contained more SiO2 phase(52-97 wt.%) compared to the “normal” heterogeneous funkalite (8-53 wt.%), which containedmore feldspar component. The compositional ranges of the feldspar components of the two typesof funkalite are quite similar, except for the somewhat more limited range and slightly lower Cacontents exhibited by the dark homogeneous funkalite patches.
Volume percentages determined from point counting of the digitized images of each groundmasssite are presented in Table 2. The funkalite components were determined by recalculation of anaverage EDX chemical analysis for each of the five groundmass sites. The groundmass volumepercentages were normalized to the percentage of groundmass in the bulk sample and thencombined with phenocryst percentages. The combined bulk mineralogy is presented in Table 3.The calculated weight percentages comprise the “known” values with which the RQXRD resultsare compared.
Table 2. Groundmass mineralogy (vol. %)
Site 1 Site 2 Site 3 Site 4 Site 8 Average
Feldspar G 49.706 41.103 29.081 82.060 43.922 49.174
F 31.272 40.142 52.795 1.245 34.727 32.036
Orthopyroxene G 0.882 1.912 3.407 4.810 1.939 2.590
Fe-Ti Oxide G 3.676 0.735 1.743 1.100 2.013 1.853
F 0.646 0.440 0.733 0.000 0.255 0.355
SiO2 Phase F 14.117 15.668 12.242 10.775 17.143 13.989
G = distinct groundmass crystals, F = funkalite
Copyright©JCPDS - International Centre for Diffraction Data 2003, Advances in X-ray Analysis, Volume 46. 207 ISSN 1097-0002
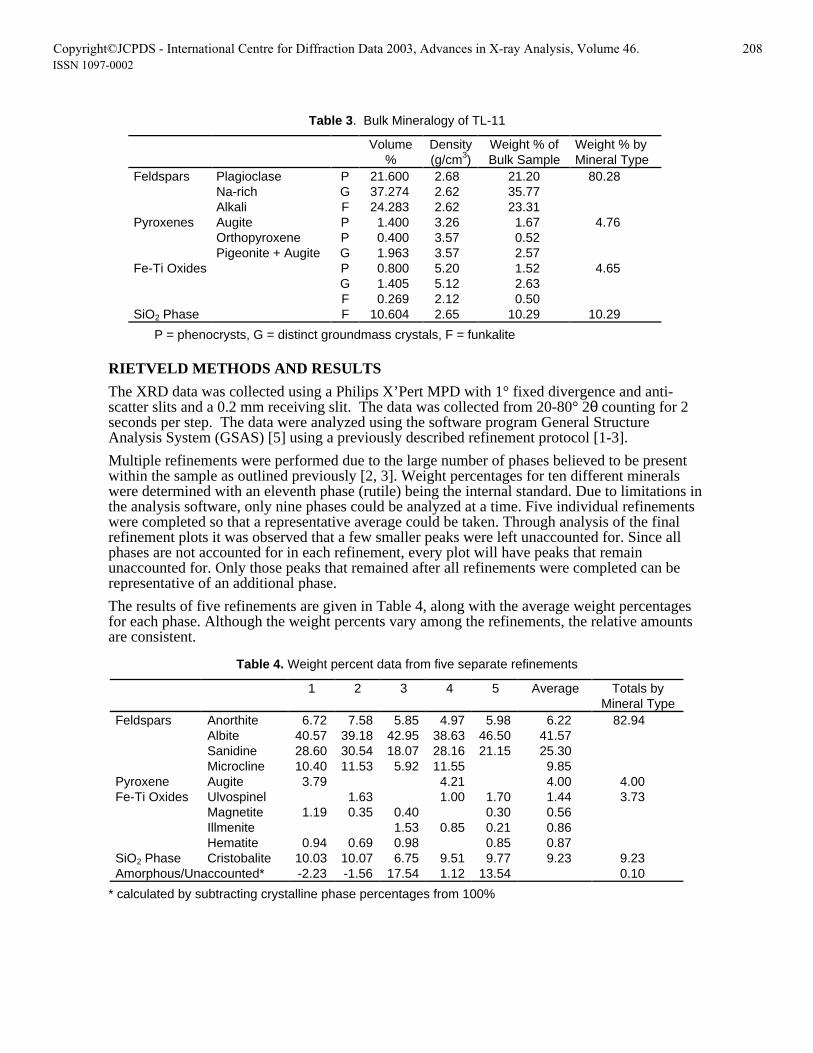
Table 3. Bulk Mineralogy of TL-11
Volume%
Density(g/cm3)
Weight % ofBulk Sample
Weight % byMineral Type
Feldspars Plagioclase P 21.600 2.68 21.20 80.28Na-rich G 37.274 2.62 35.77Alkali F 24.283 2.62 23.31
Pyroxenes Augite P 1.400 3.26 1.67 4.76Orthopyroxene P 0.400 3.57 0.52Pigeonite + Augite G 1.963 3.57 2.57
Fe-Ti Oxides P 0.800 5.20 1.52 4.65G 1.405 5.12 2.63F 0.269 2.12 0.50
SiO2 Phase F 10.604 2.65 10.29 10.29
P = phenocrysts, G = distinct groundmass crystals, F = funkalite
RIETVELD METHODS AND RESULTS
The XRD data was collected using a Philips X’Pert MPD with 1° fixed divergence and anti-scatter slits and a 0.2 mm receiving slit. The data was collected from 20-80° 2θ counting for 2seconds per step. The data were analyzed using the software program General StructureAnalysis System (GSAS) [5] using a previously described refinement protocol [1-3].
Multiple refinements were performed due to the large number of phases believed to be presentwithin the sample as outlined previously [2, 3]. Weight percentages for ten different mineralswere determined with an eleventh phase (rutile) being the internal standard. Due to limitations inthe analysis software, only nine phases could be analyzed at a time. Five individual refinementswere completed so that a representative average could be taken. Through analysis of the finalrefinement plots it was observed that a few smaller peaks were left unaccounted for. Since allphases are not accounted for in each refinement, every plot will have peaks that remainunaccounted for. Only those peaks that remained after all refinements were completed can berepresentative of an additional phase.
The results of five refinements are given in Table 4, along with the average weight percentagesfor each phase. Although the weight percents vary among the refinements, the relative amountsare consistent.
Table 4. Weight percent data from five separate refinements
1 2 3 4 5 Average Totals byMineral Type
Feldspars Anorthite 6.72 7.58 5.85 4.97 5.98 6.22 82.94Albite 40.57 39.18 42.95 38.63 46.50 41.57Sanidine 28.60 30.54 18.07 28.16 21.15 25.30Microcline 10.40 11.53 5.92 11.55 9.85
Pyroxene Augite 3.79 4.21 4.00 4.00Fe-Ti Oxides Ulvospinel 1.63 1.00 1.70 1.44 3.73
Magnetite 1.19 0.35 0.40 0.30 0.56Illmenite 1.53 0.85 0.21 0.86Hematite 0.94 0.69 0.98 0.85 0.87
SiO2 Phase Cristobalite 10.03 10.07 6.75 9.51 9.77 9.23 9.23Amorphous/Unaccounted* -2.23 -1.56 17.54 1.12 13.54 0.10
* calculated by subtracting crystalline phase percentages from 100%
Copyright©JCPDS - International Centre for Diffraction Data 2003, Advances in X-ray Analysis, Volume 46. 208 ISSN 1097-0002
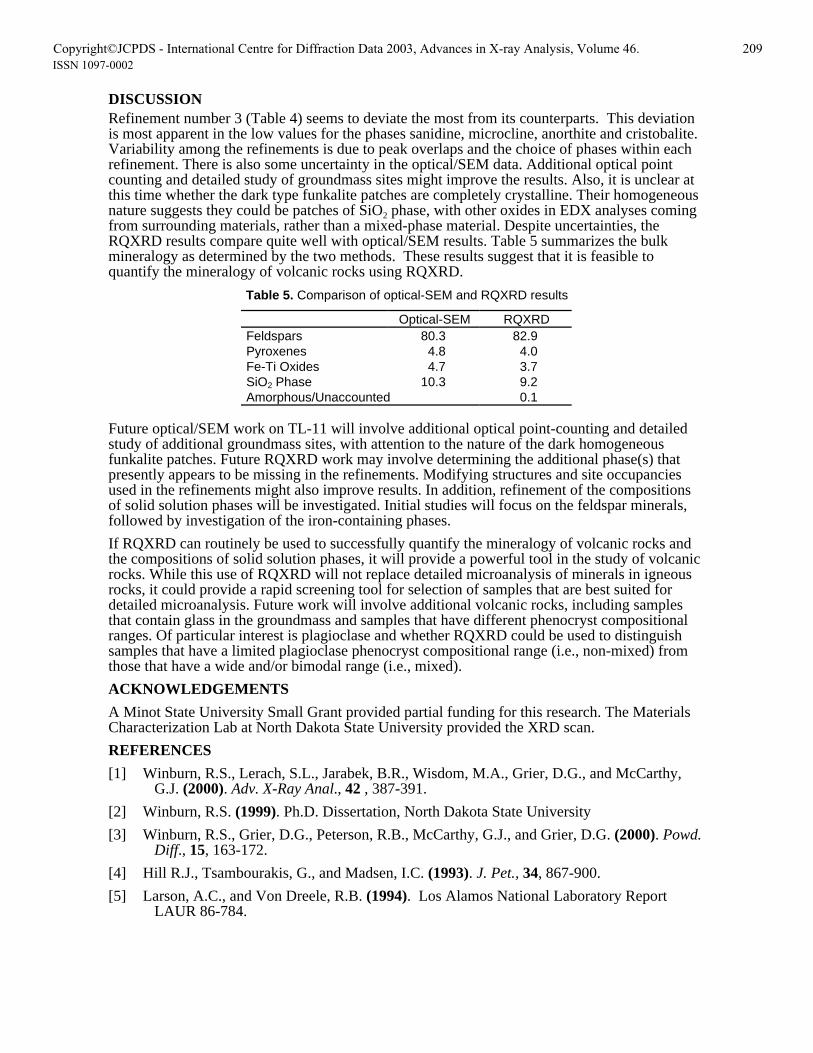
DISCUSSIONRefinement number 3 (Table 4) seems to deviate the most from its counterparts. This deviationis most apparent in the low values for the phases sanidine, microcline, anorthite and cristobalite.Variability among the refinements is due to peak overlaps and the choice of phases within eachrefinement. There is also some uncertainty in the optical/SEM data. Additional optical pointcounting and detailed study of groundmass sites might improve the results. Also, it is unclear atthis time whether the dark type funkalite patches are completely crystalline. Their homogeneousnature suggests they could be patches of SiO2 phase, with other oxides in EDX analyses comingfrom surrounding materials, rather than a mixed-phase material. Despite uncertainties, theRQXRD results compare quite well with optical/SEM results. Table 5 summarizes the bulkmineralogy as determined by the two methods. These results suggest that it is feasible toquantify the mineralogy of volcanic rocks using RQXRD.
Table 5. Comparison of optical-SEM and RQXRD results
Optical-SEM RQXRDFeldspars 80.3 82.9Pyroxenes 4.8 4.0Fe-Ti Oxides 4.7 3.7SiO2 Phase 10.3 9.2Amorphous/Unaccounted 0.1
Future optical/SEM work on TL-11 will involve additional optical point-counting and detailedstudy of additional groundmass sites, with attention to the nature of the dark homogeneousfunkalite patches. Future RQXRD work may involve determining the additional phase(s) thatpresently appears to be missing in the refinements. Modifying structures and site occupanciesused in the refinements might also improve results. In addition, refinement of the compositionsof solid solution phases will be investigated. Initial studies will focus on the feldspar minerals,followed by investigation of the iron-containing phases.
If RQXRD can routinely be used to successfully quantify the mineralogy of volcanic rocks andthe compositions of solid solution phases, it will provide a powerful tool in the study of volcanicrocks. While this use of RQXRD will not replace detailed microanalysis of minerals in igneousrocks, it could provide a rapid screening tool for selection of samples that are best suited fordetailed microanalysis. Future work will involve additional volcanic rocks, including samplesthat contain glass in the groundmass and samples that have different phenocryst compositionalranges. Of particular interest is plagioclase and whether RQXRD could be used to distinguishsamples that have a limited plagioclase phenocryst compositional range (i.e., non-mixed) fromthose that have a wide and/or bimodal range (i.e., mixed).
ACKNOWLEDGEMENTS
A Minot State University Small Grant provided partial funding for this research. The MaterialsCharacterization Lab at North Dakota State University provided the XRD scan.
REFERENCES
[1] Winburn, R.S., Lerach, S.L., Jarabek, B.R., Wisdom, M.A., Grier, D.G., and McCarthy,G.J. (2000). Adv. X-Ray Anal., 42 , 387-391.
[2] Winburn, R.S. (1999). Ph.D. Dissertation, North Dakota State University
[3] Winburn, R.S., Grier, D.G., Peterson, R.B., McCarthy, G.J., and Grier, D.G. (2000). Powd.Diff., 15, 163-172.
[4] Hill R.J., Tsambourakis, G., and Madsen, I.C. (1993). J. Pet., 34, 867-900.
[5] Larson, A.C., and Von Dreele, R.B. (1994). Los Alamos National Laboratory ReportLAUR 86-784.
Copyright©JCPDS - International Centre for Diffraction Data 2003, Advances in X-ray Analysis, Volume 46. 209 ISSN 1097-0002