Embed Size (px)
Citation preview
Analysis of grid-connection of waterwheels using photovoltaic microinverters
MARINA HELENA PIETROBELLI
Supervised by
Prof. Dr. Américo Vicente Teixeira Leite
Prof. Dr. Ednei Luiz Miotto
Bragança
2019-2020

Analysis of grid-connection of waterwheels using photovoltaic microinverters
MARINA HELENA PIETROBELLI
Thesis presented in the School of Technology and Management of the Polytechnic Institute of
Bragança to fulfill the requirements of a Master of Science Degree in Industrial Engineering
(Electrical Engineering branch), in the scope of double degree with Federal University of
Technology - Paraná.
Supervised by
Prof. Dr. Américo Vicente Teixeira Leite
Prof. Dr. Ednei Luiz Miotto
Bragança
2019-2020

Acknowledgments
I would like first to thank my parents João and Lusia, my sisters Liane and Diva, for
having supported and encouraged me throughout this trajectory and always helping me when
necessary.
To my advisers of the IPB Prof. Dr. Américo Vicente Leite and the UTFPR Prof. Dr. Ednei
Luiz Miotto, I would like to show all my gratitude for the availability and all the knowledge
transmitted. I also want to thank Prof. José Baptista and Filipe for the assistant.
I would also like to register here my special thanks to my laboratory colleagues, friends
from Brazil, and to the friends I have made during this period in Portugal. All were important,
directly or indirectly, for this thesis to be concluded.
Finally, I would like to thank the Universidade Tecnológica Federal do Paraná and the
Instituto Politécnico de Bragança for the opportunity granted and all the learning acquired
within these educational institutions.
v
Resumo
Com o intuito de reduzir os impactos sociais e ambientais gerados pela produção de
energia, a opção por fontes renováveis vem crescendo significativamente em anos recentes.
Sistemas pico-hídricos de pequena escala, além de apresentarem grande potencial e utiliza-
ção, minimizam os impactos ambientais e sociais. Esses sistemas podem ser integrados com
microrredes, sendo muito promissores por apresentarem produção durante 24 horas por dia.
No âmbito do projeto SilkHouse, foi construída uma roda d’água para a produção de energia
e injeção na microrrede elétrica, com potências da ordem de 300 W. O principal objetivo desta
tese é analisar a integração de sistemas pico-hídricos com microrredes utilizando microinver-
sores fotovoltaicos. O método utilizado permite que os geradores trabalhem com velocidade
variável. Para isso foram utilizadas duas abordagens distintas, uma delas utiliza um circuito
de proteção e um conversor CC/CC boost como interface, e a outra somente o circuito de
proteção. A validação experimental foi realizada em uma bancada de teste no laboratório
e em contexto real com a roda d’água implementada na Casa da Seda. Os dados coletados
durante os testes foram de três geradores, uma carga passiva e um microinversor. Com a
validação de ambas as abordagens o objetivo principal da tese foi alcançado. A conexão com
a rede se mostrou estável e os resultados são encorajadores para a exploração do potencial
energético dos sistemas pico-hídricos.
Palavras-chave: Energias Renováveis, Microrrede, Sistemas pico-hídricos, Conversor Boost,
Microinversores fotovoltaicos.
vi
Abstract
To reduce the social and environmental impacts generated by energy production, the
use of renewable sources has grown significantly in recent years. Small-scale pico-hydro
systems have great potential and are following environmental requirements. These systems
can be integrated with microgrids and are very promising for presenting production 24 hours
a day. Within the scope of the SilkHouse project, a water wheel was built for the production of
energy and injection into the electrical microgrid, with powers of the order of 300 W. The main
objective of this thesis is to analyze the integration of pico-hydro systems with microgrids
using photovoltaic microinverters. This approach allows the generators to work with variable
speed. For this, two different approaches were used, the first uses a protection circuit and
a DC/DC boost converter as an interface, and the other only the protection circuit. The
experimental validation was implemented on a test workbench in the laboratory, and real
context with the water wheel implemented at House of Silk. The data collected during the
tests were from three generators, a passive load, and a microinverter. With both approaches
validation, the main objective of the thesis was reached. The connection to the grid proved
to be stable and the results are encouraging for the exploration of the energetic potential of
pico-hydro systems.
Keywords: Renewable Energies, Microgrid, Pico-hydro Systems, Boost Converter, Photo-
voltaic Microinverters.
vii

Contents
List of Tables xi
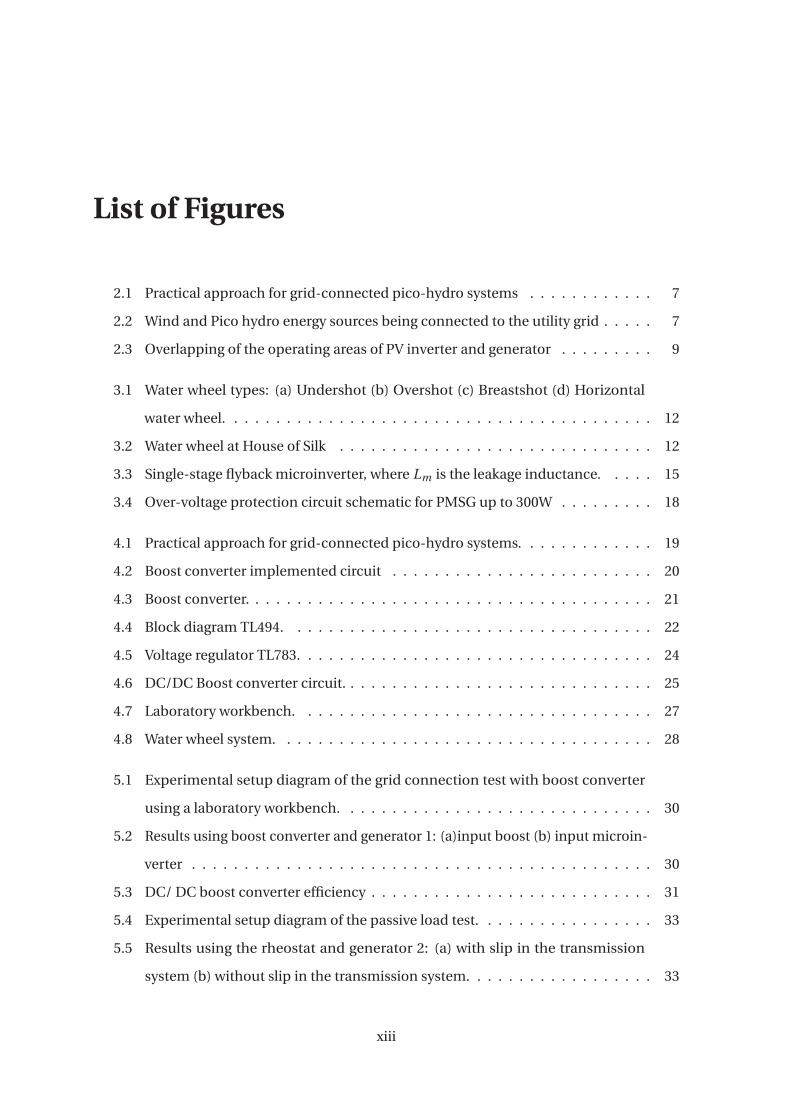
List of Figures xiii
Acronyms xiv
List of Symbols xvii
1 Introduction 1
1.1 Objectives . . . . . . . . . . . . . . . . . . . . . . . . . . . . . . . . . . . . . . . . . 2
1.2 Thesis structure . . . . . . . . . . . . . . . . . . . . . . . . . . . . . . . . . . . . . . 2
2 Grid-connected Pico-hydro Systems 5
2.1 Hydro Power . . . . . . . . . . . . . . . . . . . . . . . . . . . . . . . . . . . . . . . . 5
2.2 Pico-hydro Systems . . . . . . . . . . . . . . . . . . . . . . . . . . . . . . . . . . . . 6
2.3 Integration between generator and grid . . . . . . . . . . . . . . . . . . . . . . . . 7
3 Grid connection approach of pico-hydro systems 11
3.1 Water Wheel . . . . . . . . . . . . . . . . . . . . . . . . . . . . . . . . . . . . . . . . 11
3.2 Synchronous generators . . . . . . . . . . . . . . . . . . . . . . . . . . . . . . . . . 13
3.3 Photovoltaic inverters . . . . . . . . . . . . . . . . . . . . . . . . . . . . . . . . . . 14
3.4 Maximum Power Point Tracking for PV Systems . . . . . . . . . . . . . . . . . . . 15
3.5 Grid Connection Requirements . . . . . . . . . . . . . . . . . . . . . . . . . . . . . 16
3.6 Over-voltage protection circuit . . . . . . . . . . . . . . . . . . . . . . . . . . . . . 17
4 Water wheel grid connection strategy 19
4.1 Proposed strategy . . . . . . . . . . . . . . . . . . . . . . . . . . . . . . . . . . . . . 19
4.2 DC/DC converter . . . . . . . . . . . . . . . . . . . . . . . . . . . . . . . . . . . . . 20
4.2.1 Boost converter . . . . . . . . . . . . . . . . . . . . . . . . . . . . . . . . . . 20
ix
4.2.2 Control circuit . . . . . . . . . . . . . . . . . . . . . . . . . . . . . . . . . . . 22
4.3 Experimental test platforms . . . . . . . . . . . . . . . . . . . . . . . . . . . . . . . 25
4.3.1 Tests performed at LSE . . . . . . . . . . . . . . . . . . . . . . . . . . . . . . 26
4.3.2 Tests performed in a real context at House of Silk . . . . . . . . . . . . . . 26
5 Results and Discussion 29
5.1 Experimental results using a laboratory workbench . . . . . . . . . . . . . . . . . 29
5.2 Experimental results in a real context at Silk House . . . . . . . . . . . . . . . . . 31
5.2.1 Water wheel characterization . . . . . . . . . . . . . . . . . . . . . . . . . . 32
5.2.2 Grid connection DC/DC boost converter . . . . . . . . . . . . . . . . . . . 35
5.2.3 Grid connection without boost converter . . . . . . . . . . . . . . . . . . . 38
6 Conclusions 39
6.1 Future Work . . . . . . . . . . . . . . . . . . . . . . . . . . . . . . . . . . . . . . . . 40
References 41
x
List of Tables
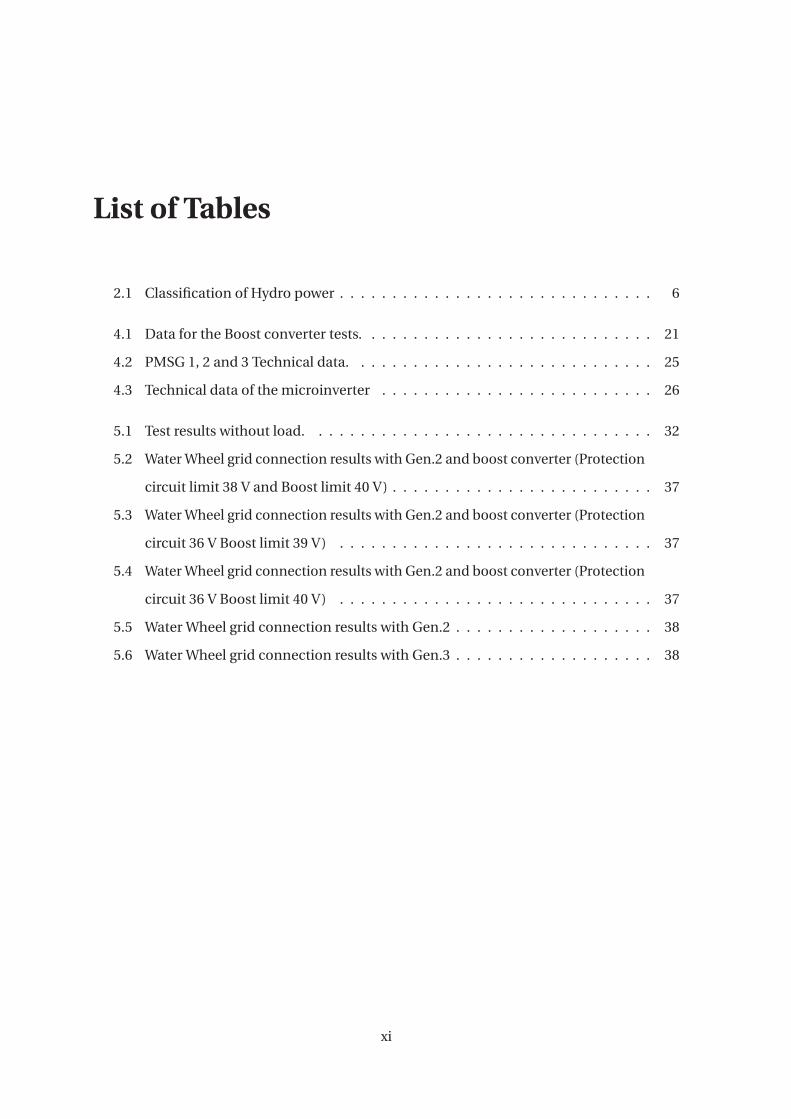
2.1 Classification of Hydro power . . . . . . . . . . . . . . . . . . . . . . . . . . . . . . 6
4.1 Data for the Boost converter tests. . . . . . . . . . . . . . . . . . . . . . . . . . . . 21
4.2 PMSG 1, 2 and 3 Technical data. . . . . . . . . . . . . . . . . . . . . . . . . . . . . 25
4.3 Technical data of the microinverter . . . . . . . . . . . . . . . . . . . . . . . . . . 26
5.1 Test results without load. . . . . . . . . . . . . . . . . . . . . . . . . . . . . . . . . 32
5.2 Water Wheel grid connection results with Gen.2 and boost converter (Protection
circuit limit 38 V and Boost limit 40 V) . . . . . . . . . . . . . . . . . . . . . . . . . 37
5.3 Water Wheel grid connection results with Gen.2 and boost converter (Protection
circuit 36 V Boost limit 39 V) . . . . . . . . . . . . . . . . . . . . . . . . . . . . . . 37
5.4 Water Wheel grid connection results with Gen.2 and boost converter (Protection
circuit 36 V Boost limit 40 V) . . . . . . . . . . . . . . . . . . . . . . . . . . . . . . 37
5.5 Water Wheel grid connection results with Gen.2 . . . . . . . . . . . . . . . . . . . 38
5.6 Water Wheel grid connection results with Gen.3 . . . . . . . . . . . . . . . . . . . 38
xi

xii
List of Figures
2.1 Practical approach for grid-connected pico-hydro systems . . . . . . . . . . . . 7
2.2 Wind and Pico hydro energy sources being connected to the utility grid . . . . . 7
2.3 Overlapping of the operating areas of PV inverter and generator . . . . . . . . . 9
3.1 Water wheel types: (a) Undershot (b) Overshot (c) Breastshot (d) Horizontal
water wheel. . . . . . . . . . . . . . . . . . . . . . . . . . . . . . . . . . . . . . . . . 12
3.2 Water wheel at House of Silk . . . . . . . . . . . . . . . . . . . . . . . . . . . . . . 12
3.3 Single-stage flyback microinverter, where Lm is the leakage inductance. . . . . 15
3.4 Over-voltage protection circuit schematic for PMSG up to 300W . . . . . . . . . 18
4.1 Practical approach for grid-connected pico-hydro systems. . . . . . . . . . . . . 19
4.2 Boost converter implemented circuit . . . . . . . . . . . . . . . . . . . . . . . . . 20
4.3 Boost converter. . . . . . . . . . . . . . . . . . . . . . . . . . . . . . . . . . . . . . . 21
4.4 Block diagram TL494. . . . . . . . . . . . . . . . . . . . . . . . . . . . . . . . . . . 22
4.5 Voltage regulator TL783. . . . . . . . . . . . . . . . . . . . . . . . . . . . . . . . . . 24
4.6 DC/DC Boost converter circuit. . . . . . . . . . . . . . . . . . . . . . . . . . . . . . 25
4.7 Laboratory workbench. . . . . . . . . . . . . . . . . . . . . . . . . . . . . . . . . . 27
4.8 Water wheel system. . . . . . . . . . . . . . . . . . . . . . . . . . . . . . . . . . . . 28
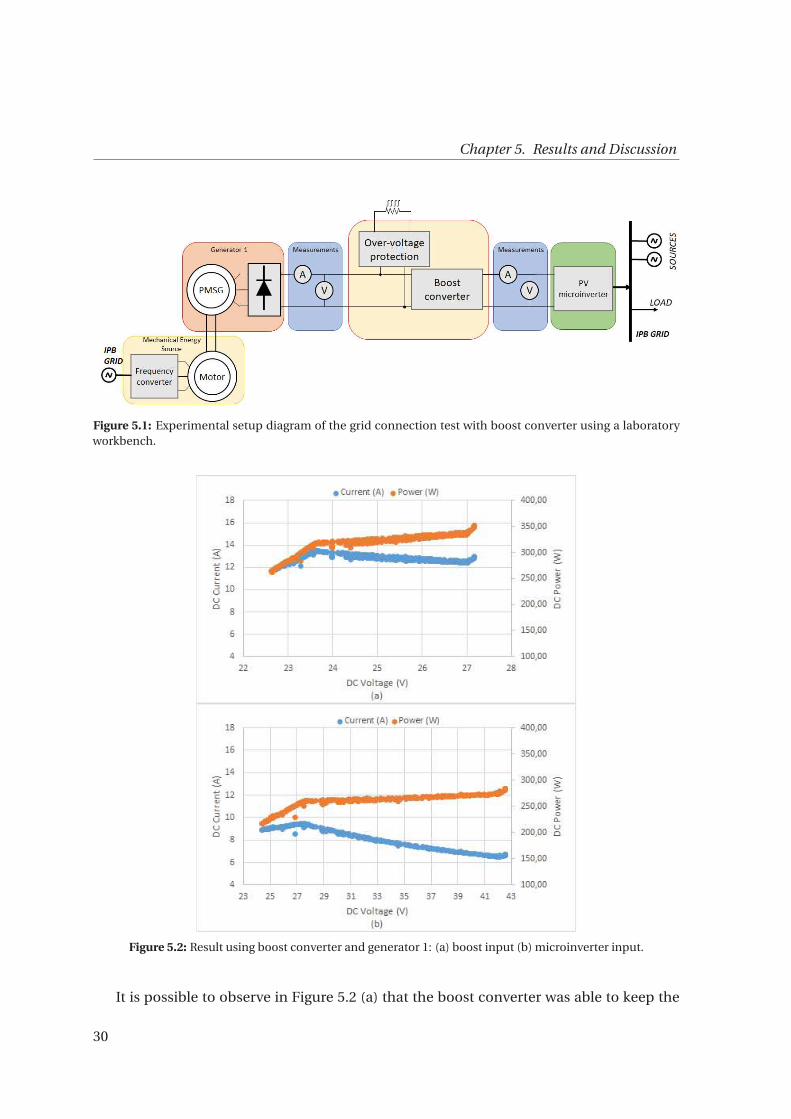
5.1 Experimental setup diagram of the grid connection test with boost converter
using a laboratory workbench. . . . . . . . . . . . . . . . . . . . . . . . . . . . . . 30
5.2 Results using boost converter and generator 1: (a)input boost (b) input microin-
verter . . . . . . . . . . . . . . . . . . . . . . . . . . . . . . . . . . . . . . . . . . . . 30
5.3 DC/ DC boost converter efficiency . . . . . . . . . . . . . . . . . . . . . . . . . . . 31
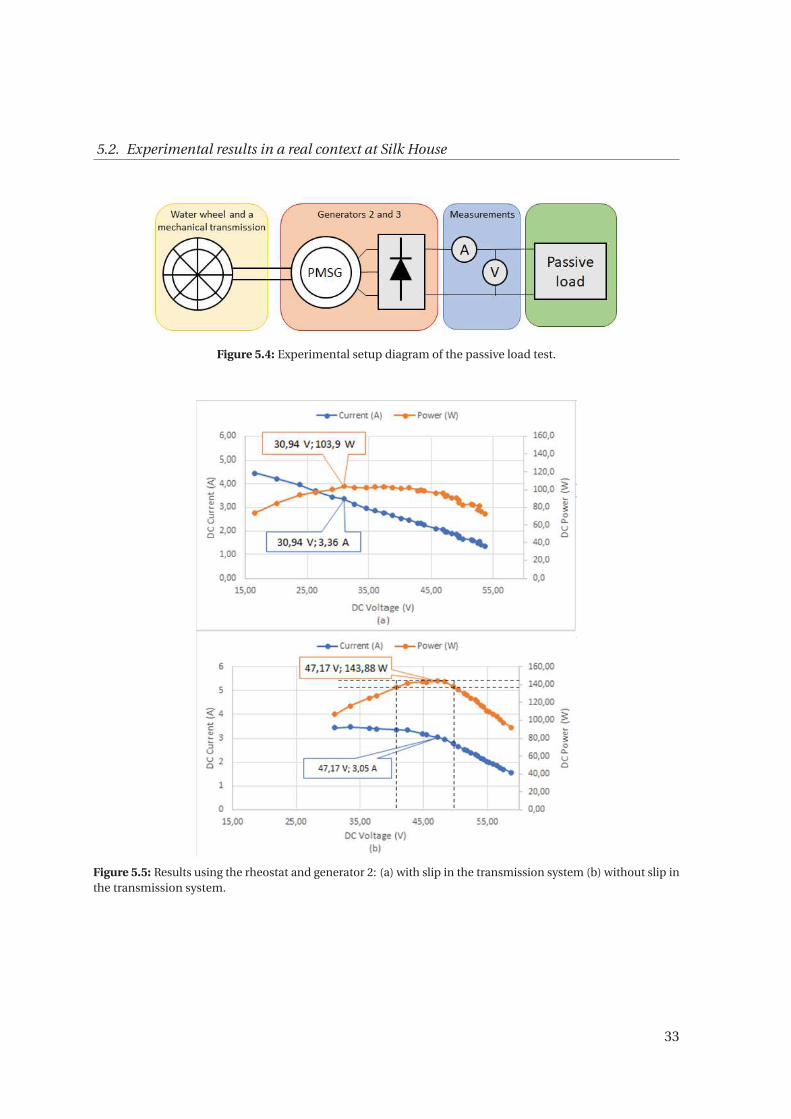
5.4 Experimental setup diagram of the passive load test. . . . . . . . . . . . . . . . . 33
5.5 Results using the rheostat and generator 2: (a) with slip in the transmission
system (b) without slip in the transmission system. . . . . . . . . . . . . . . . . . 33
xiii

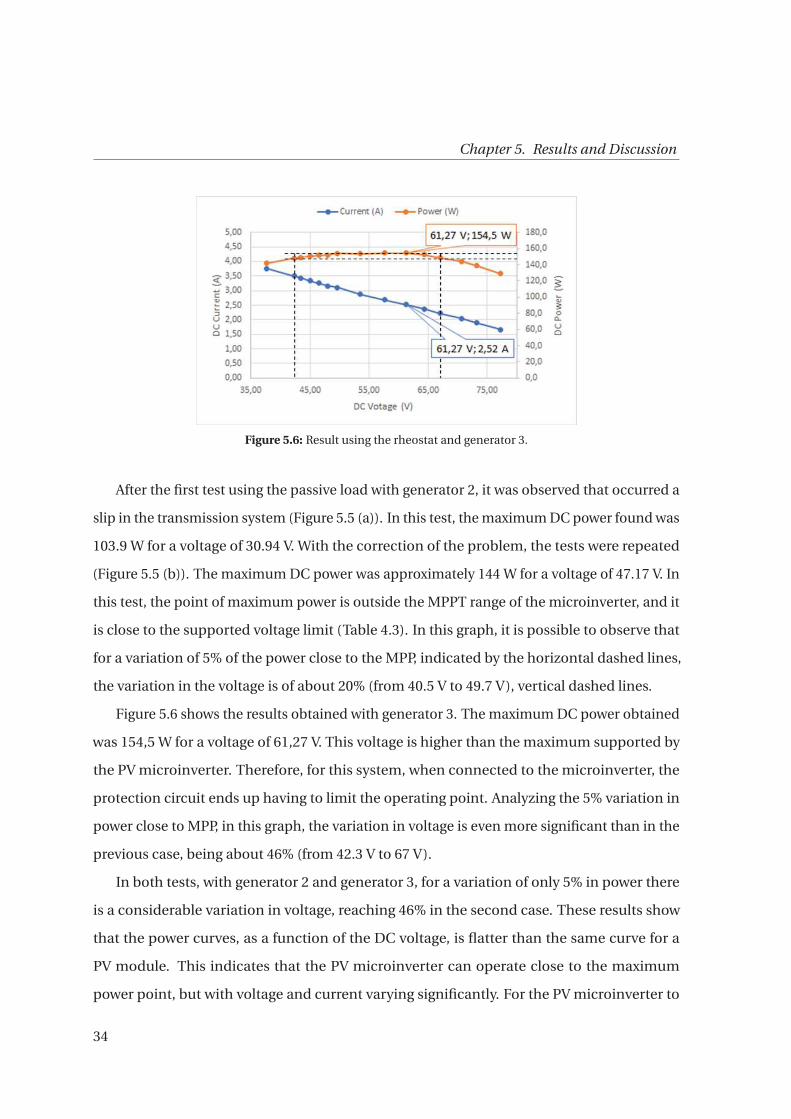
5.6 Result using the rheostat and generator 3. . . . . . . . . . . . . . . . . . . . . . . 34
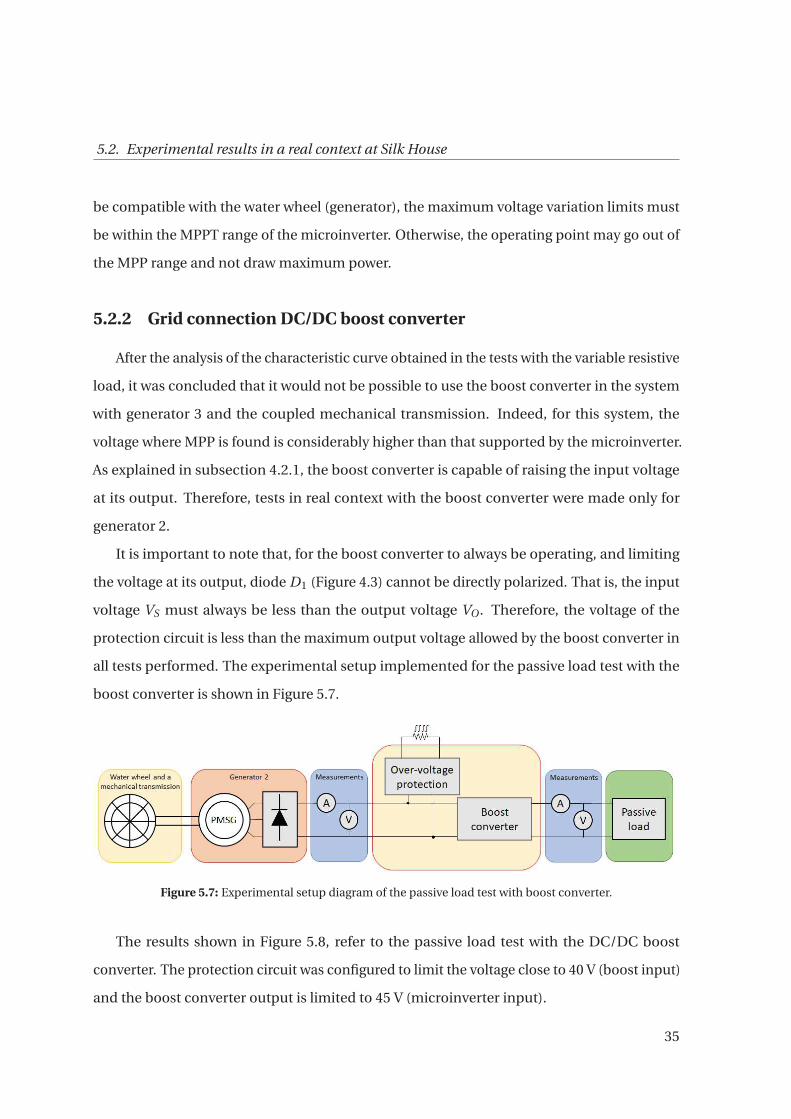
5.7 Experimental setup diagram of the passive load test with boost converter. . . . 35
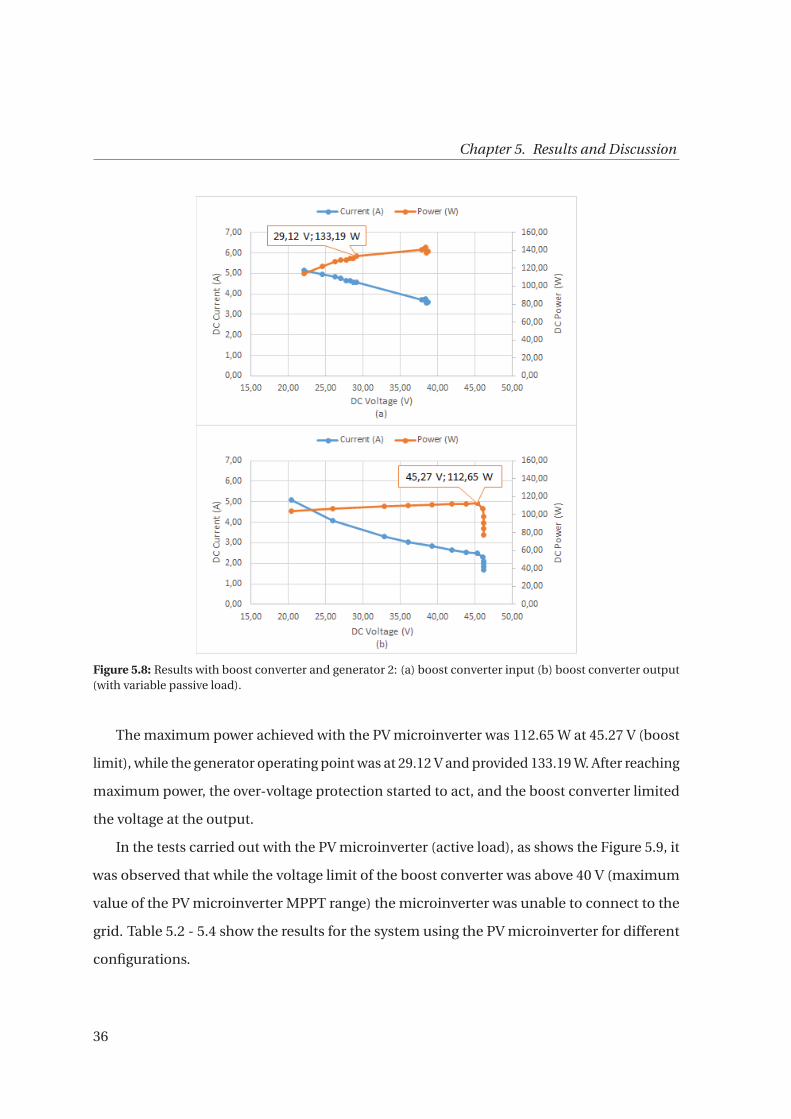
5.8 Results with boost converter and generator 2: (a) input boost converter (b) boost
converter output (with variable passive load). . . . . . . . . . . . . . . . . . . . . 36
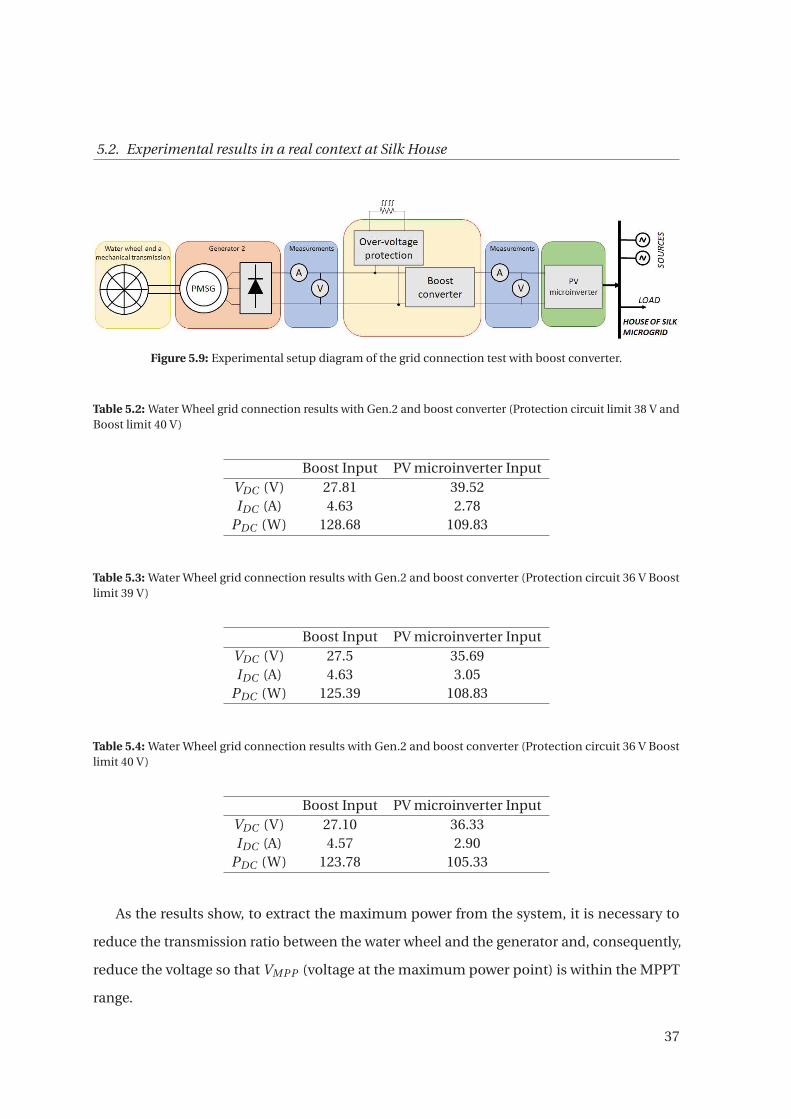
5.9 Experimental setup diagram of the grid connection test with boost converter. . 37
5.10 Experimental setup diagram of the grid connection without boost converter. . 38
xiv
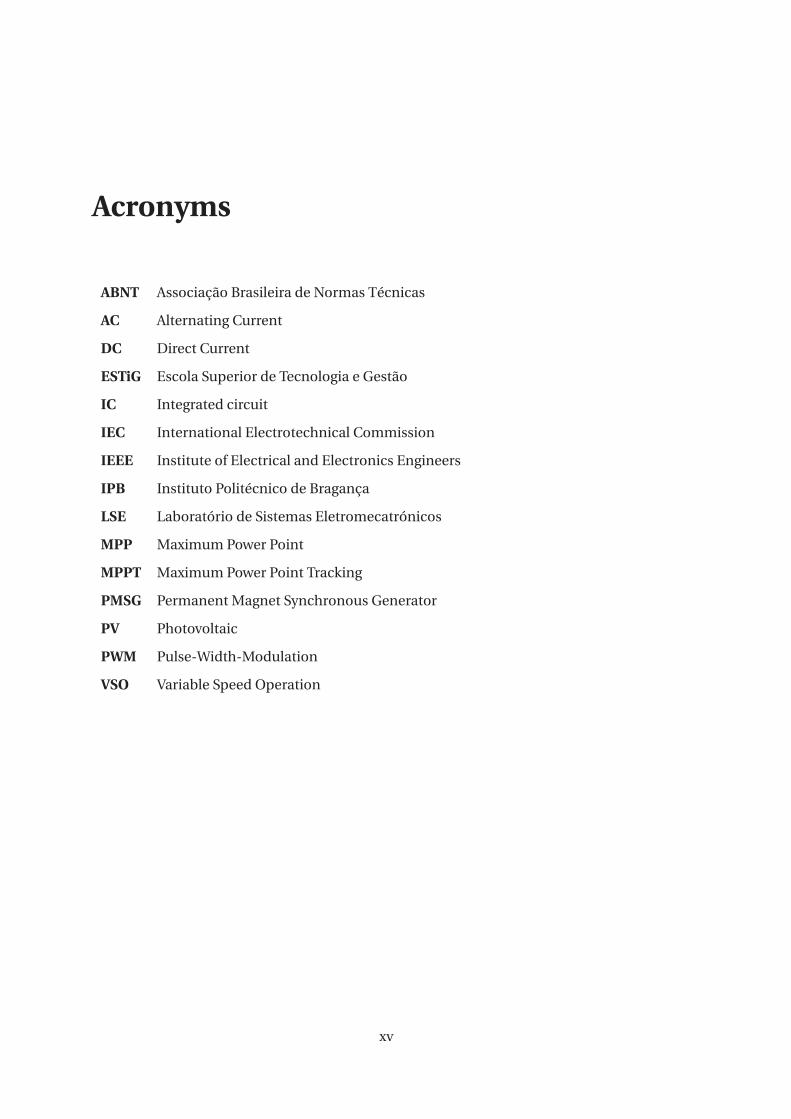
Acronyms
ABNT Associação Brasileira de Normas Técnicas
AC Alternating Current
DC Direct Current
ESTiG Escola Superior de Tecnologia e Gestão
IC Integrated circuit
IEC International Electrotechnical Commission
IEEE Institute of Electrical and Electronics Engineers
IPB Instituto Politécnico de Bragança
LSE Laboratório de Sistemas Eletromecatrónicos
MPP Maximum Power Point
MPPT Maximum Power Point Tracking
PMSG Permanent Magnet Synchronous Generator
PV Photovoltaic
PWM Pulse-Width-Modulation
VSO Variable Speed Operation
xv

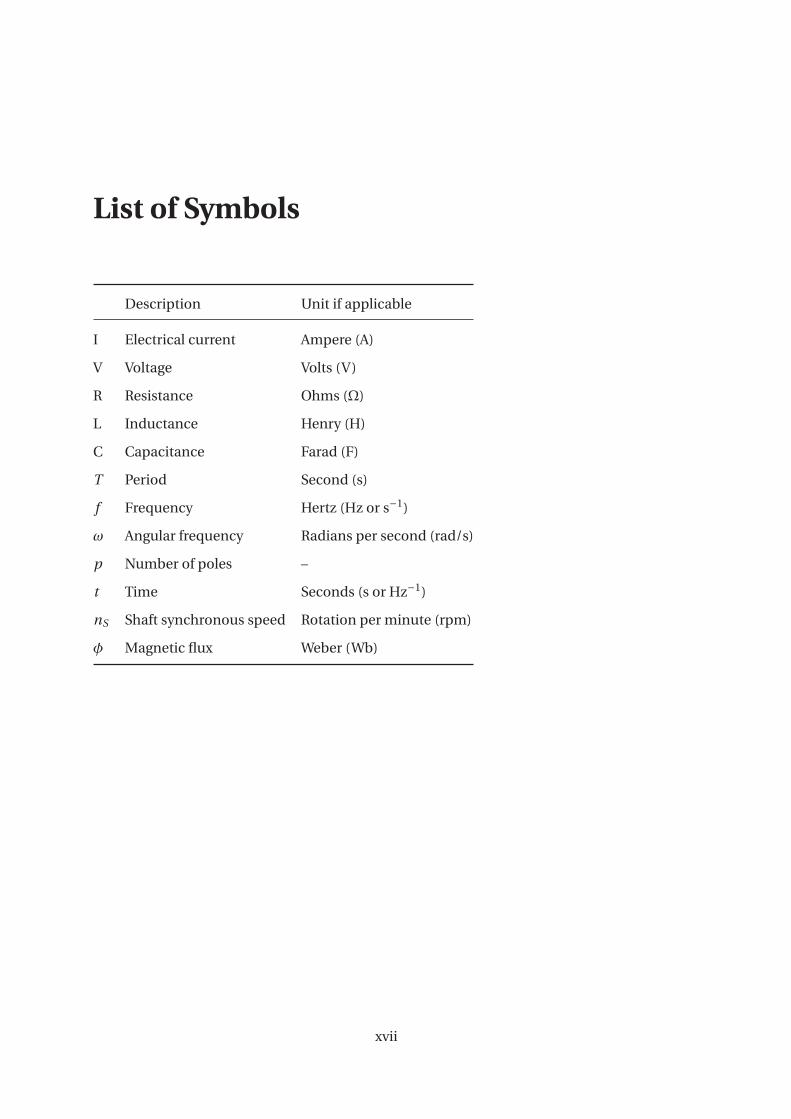
List of Symbols
Description Unit if applicable
I Electrical current Ampere (A)
V Voltage Volts (V)
R Resistance Ohms (Ω)
L Inductance Henry (H)
C Capacitance Farad (F)
T Period Second (s)
f Frequency Hertz (Hz or s−1)
ω Angular frequency Radians per second (rad/s)
p Number of poles –
t Time Seconds (s or Hz−1)
nS Shaft synchronous speed Rotation per minute (rpm)
φ Magnetic flux Weber (Wb)
xvii

Chapter 1
Introduction
The use of renewable energies as photovoltaic, wind and hydro is being encouraged due
to its importance in reducing the use of fossil fuels. These are the main responsible for the
emission of carbon dioxide (CO2) and other greenhouse gases [1]. Currently, the energy
production is responsible for more than 75% of the European Union’s greenhouse gases
emission [2]. The measures being taken to achieve climate neutrality by 2050 focus on the
energy issue, presenting three main objectives: energy efficiency first, Europe as a global
leader in renewable and a fair deal for consumers [3].
Renewable energies also allow distributed energy generation, enabling integration into
microgrids. These are systems of distributed production of energy, storage, and controllable
loads, being able to work both in an autonomous (islanded) mode as in grid-connected mode
[4].
Pico-hydro power plants are very small-scale infrastructures commonly used in stand-
alone systems, providing electricity for a house or small community [5]. The integration of
small-scale hydropower into microgrids is an ideal solution for the sustainable development
of any country with water potential.
Hydro power systems are usually connected to the grid without any power interface. To
keep the synchronization of the generator with the grid is necessary to control the water
flow [6], [7]. Chapter 3 presents the relation with the generator rotation speed and electrical
synchronization frequency.
Taking into account the seasonal variability of water flow, the efficiency of pico-hydro
systems is improved if they can work at variable speed [8]. However, for systems with variable
speed, it is necessary to use an interface between the generator and the grid. Different from
photovoltaic and wind generation, there is no commercial solution for pico-hydro, because
1
Chapter 1. Introduction
each site has different topography and hydraulic dynamics, making development, replication,
and commercialization expensive [9].
This thesis has focused on the pico-hydro system with variable speed, up to 300W. It
presents the implementation and analysis of the connection between the generator and the
photovoltaic (PV) microinverter with and without an additional power interface.
1.1 Objectives
Pico-hydro systems are very promising for integration with microgrids since they present
a generation for 24 hours a day. Within the scope of the SilkHouse project, a water wheel was
built for the production of energy and injection into the electrical microgrid, with powers of
the order of 300 W. In this context, this thesis intends to analyze the connection compatibility
between the generator and the PV microinverter. Furthermore, it is intended to develop and
study the implementation of an interface between the generator and the PV microinverter,
for connection to the electrical grid (microgrid). This interface consists of a DC/DC converter
for emulating the water wheel generator as a photovoltaic module. In both tests, a protection
circuit, developed in previous works, must be integrated into the system.
1.2 Thesis structure
• Chapter 1: Introduction
– Contains a contextualization of pico-hydro systems connected to microgrids and
the thesis objectives.
• Chapter 2: State of the Art
– It presents the state of the art that references what has already been accomplished
in this area of study.
• Chapter 3: Theoretical Background
2

1.2. Thesis structure
– Contains a brief explanation of some theoretical concepts of the parts that make
up the system.
• Chapter 4: Methodology
– Contains the proposed structure and describes the experimental methods em-
ployed at LSE and House of Silk.
• Chapter 5: Results and Discussion
– Contains the results obtained and their analysis for tests performed in the labora-
tory and a real context at House of Silk.
• Chapter 6: Conclusion
3

Chapter 2
Grid-connected Pico-hydro Systems
This chapter presents the state of the art of grid-connected pico-hydro systems. It shows
some possible approaches for the connection between the generator and grid, its restrictions
and investigations made until now. Also, it presents the integration requirements for the
approach using PV inverters in systems with variable speed.
2.1 Hydro Power
Hydroelectric generation is considered the main source of renewable energy in the world,
being the most used among all renewable sources. Council [10] shows that in 2015 hydro
power was responsible for 71% of all the renewable generation. Even with the increase of
more than 30% of the hydroelectric capacity between 2007 and 2015, the untapped potential
is approximately 10,000 TWh per year.
Hydro power plants convert the potential and kinetic energy of water into electrical energy.
For this energy to be converted, there must be a system to direct the water to the turbine.
The rotating movement of the turbine coupled to the generator is responsible for the energy
conversion. That is, speed and torque are converted into voltage and current.
To make the connection between the hydro power plant and grid, it is necessary to
synchronize frequency and voltage. There are two possible ways for this to be done. The first
is to maintain constant speed of the generator shaft using a mechanical system to control
the water flow. The second is to allow variable speed with no need for any type of water flow
control. However, this second strategy requires an interface between the generator and the
grid.
Hydroelectric production classification can be made related to its generated power as
5
Chapter 2. Grid-connected Pico-hydro Systems
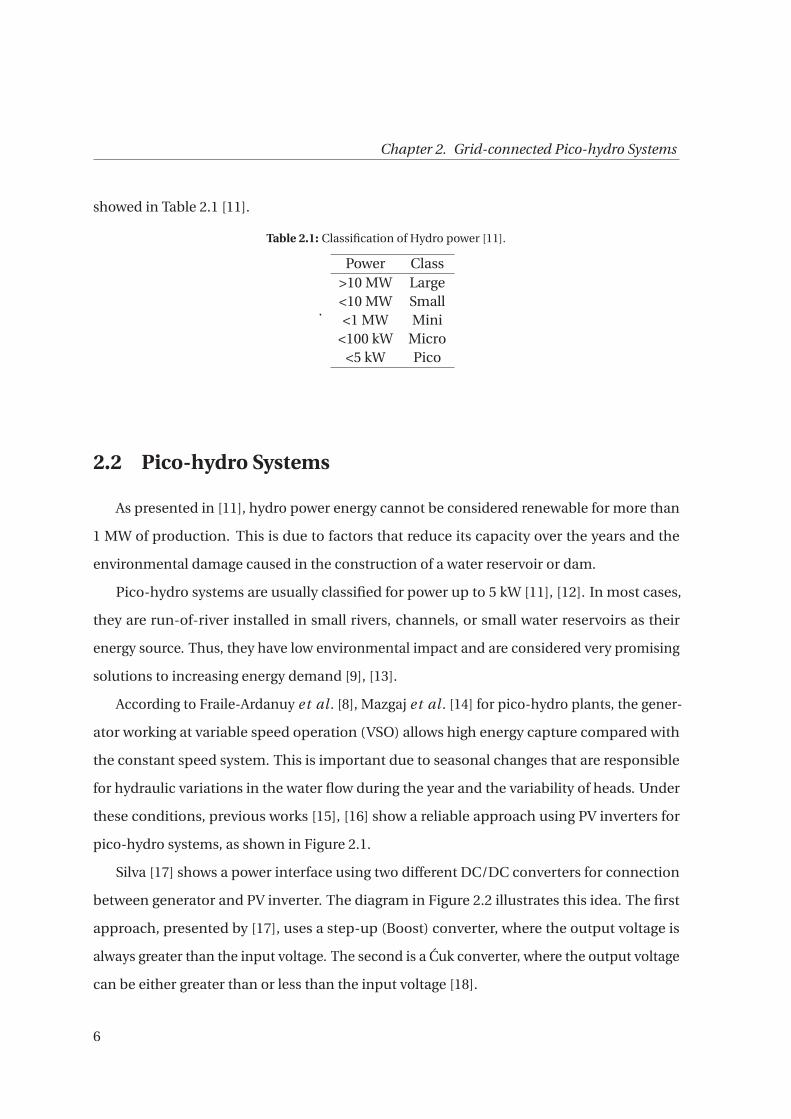
showed in Table 2.1 [11].
Table 2.1: Classification of Hydro power [11].
.
Power Class>10 MW Large<10 MW Small<1 MW Mini
<100 kW Micro<5 kW Pico
2.2 Pico-hydro Systems
As presented in [11], hydro power energy cannot be considered renewable for more than
1 MW of production. This is due to factors that reduce its capacity over the years and the
environmental damage caused in the construction of a water reservoir or dam.
Pico-hydro systems are usually classified for power up to 5 kW [11], [12]. In most cases,
they are run-of-river installed in small rivers, channels, or small water reservoirs as their
energy source. Thus, they have low environmental impact and are considered very promising
solutions to increasing energy demand [9], [13].
According to Fraile-Ardanuy et al . [8], Mazgaj et al . [14] for pico-hydro plants, the gener-
ator working at variable speed operation (VSO) allows high energy capture compared with
the constant speed system. This is important due to seasonal changes that are responsible
for hydraulic variations in the water flow during the year and the variability of heads. Under
these conditions, previous works [15], [16] show a reliable approach using PV inverters for
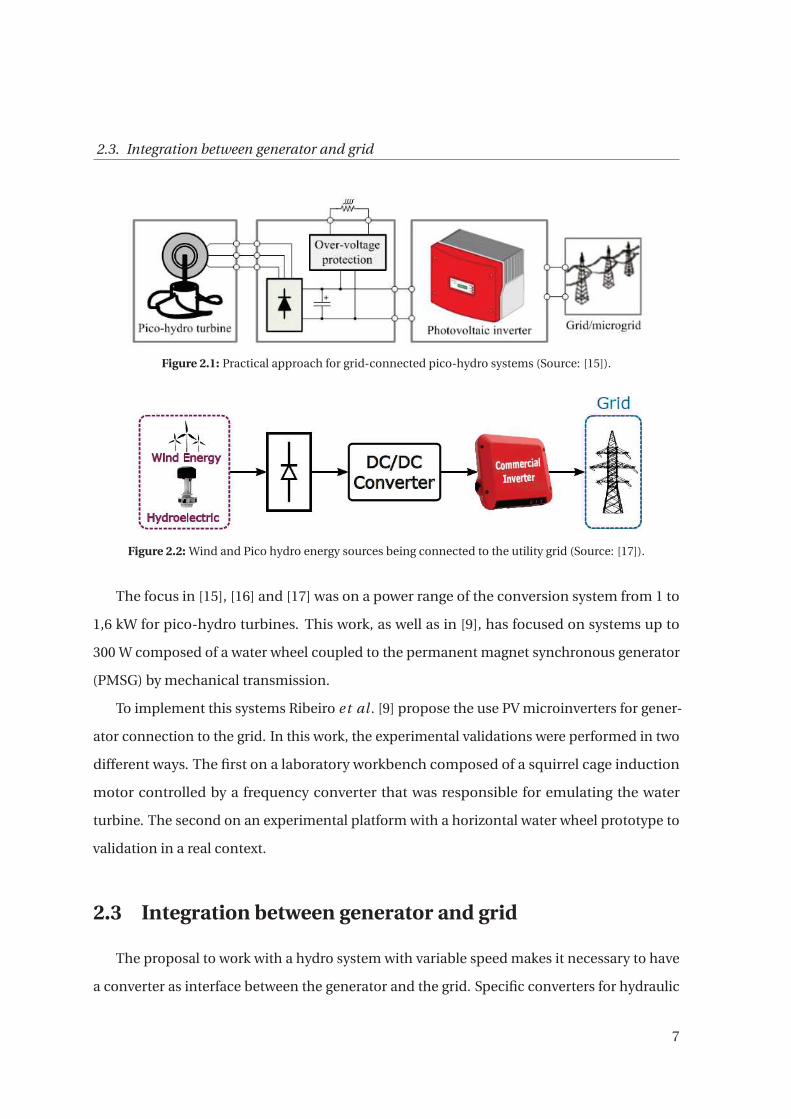
pico-hydro systems, as shown in Figure 2.1.
Silva [17] shows a power interface using two different DC/DC converters for connection
between generator and PV inverter. The diagram in Figure 2.2 illustrates this idea. The first
approach, presented by [17], uses a step-up (Boost) converter, where the output voltage is
always greater than the input voltage. The second is a Cuk converter, where the output voltage
can be either greater than or less than the input voltage [18].
6
2.3. Integration between generator and grid
Figure 2.1: Practical approach for grid-connected pico-hydro systems (Source: [15]).
Figure 2.2: Wind and Pico hydro energy sources being connected to the utility grid (Source: [17]).
The focus in [15], [16] and [17] was on a power range of the conversion system from 1 to
1,6 kW for pico-hydro turbines. This work, as well as in [9], has focused on systems up to
300 W composed of a water wheel coupled to the permanent magnet synchronous generator
(PMSG) by mechanical transmission.
To implement this systems Ribeiro et al . [9] propose the use PV microinverters for gener-
ator connection to the grid. In this work, the experimental validations were performed in two
different ways. The first on a laboratory workbench composed of a squirrel cage induction
motor controlled by a frequency converter that was responsible for emulating the water
turbine. The second on an experimental platform with a horizontal water wheel prototype to
validation in a real context.
2.3 Integration between generator and grid
The proposal to work with a hydro system with variable speed makes it necessary to have
a converter as interface between the generator and the grid. Specific converters for hydraulic
7
Chapter 2. Grid-connected Pico-hydro Systems
applications were not found on the market, due to the uniqueness of hydro sites. It is difficult
to develop a widespread solution for hydro systems, since each location needs a specific
generator, with adequate power and speed [9].
To ensure a safe and reliable integration of the PV (micro)inverter with the generator, as
in Figure 2.1, it is necessary to satisfy some prerequisites. These were introduced in [16] and
are based on the curve overlapping of the operating areas of PV inverter and PMSG and are
described as follows:
• The DC power of the generator should be between 0.4 P DC max to P DC max of the PV
inverter;
• The output DC voltage of the generator should be up to the input DC voltage of the PV
inverter;
• The rated DC current of the generator must be up to I DC max of the PV inverter;
• No-load output DC voltage of the generator for the initial work must be higher than
V PV start;
• Maximum DC voltage allowed for the protection circuit should be less than V DC max.
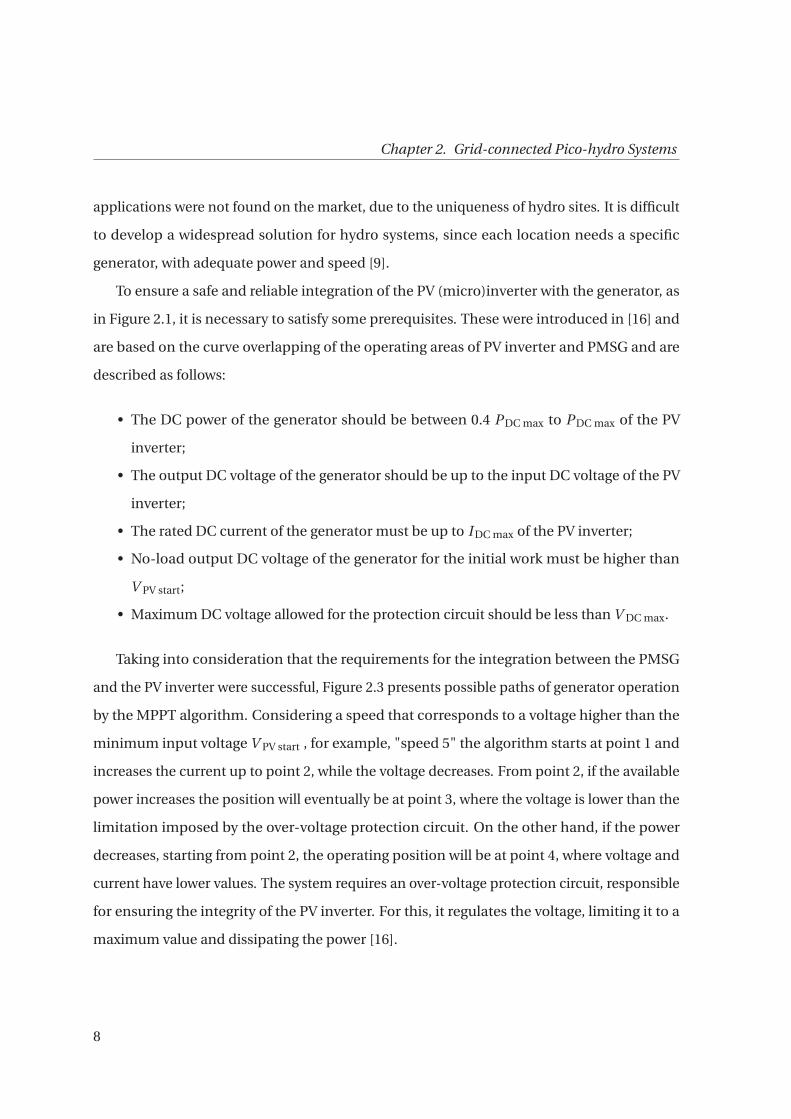
Taking into consideration that the requirements for the integration between the PMSG
and the PV inverter were successful, Figure 2.3 presents possible paths of generator operation
by the MPPT algorithm. Considering a speed that corresponds to a voltage higher than the
minimum input voltage V PV start , for example, "speed 5" the algorithm starts at point 1 and
increases the current up to point 2, while the voltage decreases. From point 2, if the available
power increases the position will eventually be at point 3, where the voltage is lower than the
limitation imposed by the over-voltage protection circuit. On the other hand, if the power
decreases, starting from point 2, the operating position will be at point 4, where voltage and
current have lower values. The system requires an over-voltage protection circuit, responsible
for ensuring the integrity of the PV inverter. For this, it regulates the voltage, limiting it to a
maximum value and dissipating the power [16].
8
2.3. Integration between generator and grid
Figure 2.3: Overlapping of the operating areas of PV inverter and generator (Source: [16]).
9


Chapter 3
Grid connection approach of pico-hydro
systems
This chapter presents a brief theoretical background on the technology required for the
grid connection approach of pico-hydro systems. It is focused on the water wheel under the
context of the SilkHouse Project.
3.1 Water Wheel
A water wheel is an old machine built to provide the driving force to drive sawmills,
pumping systems, bellows for ovens, crushers, cereal grinding, and craft workshops. The drive
surface has buckets or paddles (blades) arranged symmetrically around their axis [19], [20].
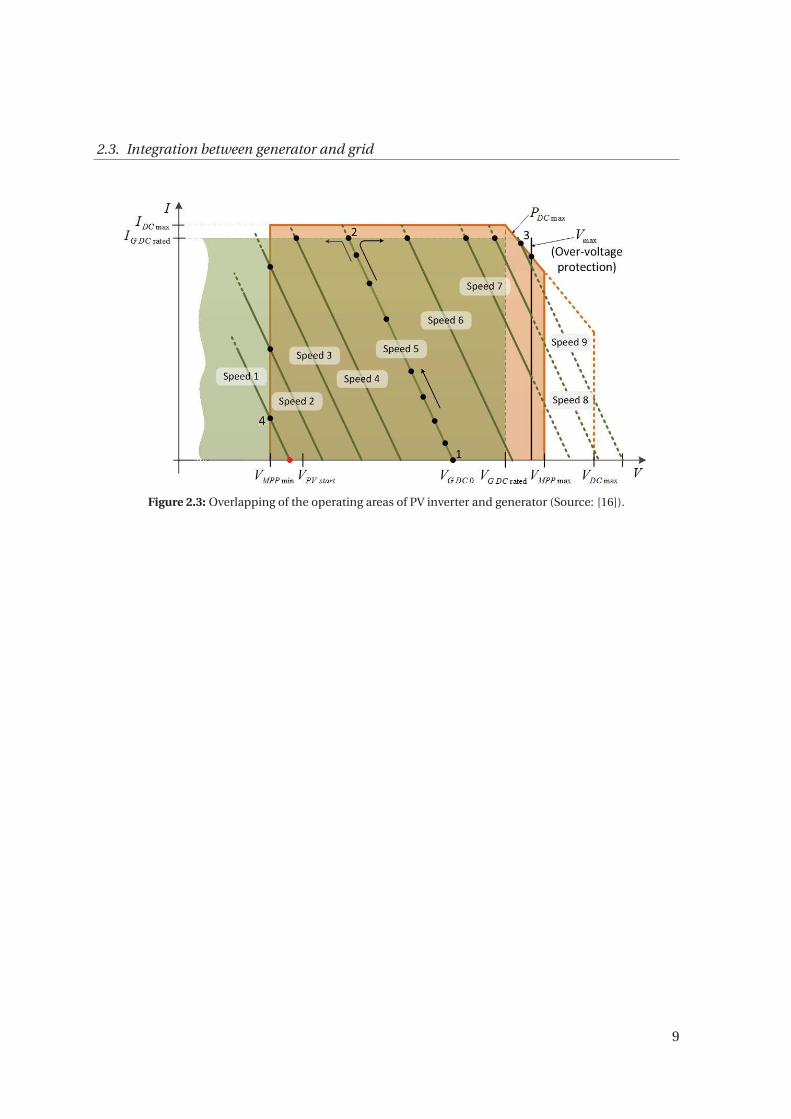
The types of water wheels vary depending on the location they are installed. Some models
are:
• Undershot: is a vertical wheel, which does not require head (Figure 3.1 (a)).
• Overshot: as the undershot, this is a vertical wheel, it requires a channel to direct the
water over the top of the water wheel (Figure 3.1 (b)).
• Breastshot: is another vertical type configuration, similar to the overshot water wheel,
but with the water inlet normally at the height of the shaft (Figure 3.1 (c)).
• Horizontal water wheel: compared to previous models this water wheel can work with
low water flow, however, they need a head to operate (Figure 3.1 (d)).
11
Chapter 3. Grid connection approach of pico-hydro systems
Figure 3.1: Water wheel types: (a) Undershot (Source: [21]) (b) Overshot (Source: [22]) (c) Breastshot (Source:[23]) (d) Horizontal water wheel (Source: [24]).
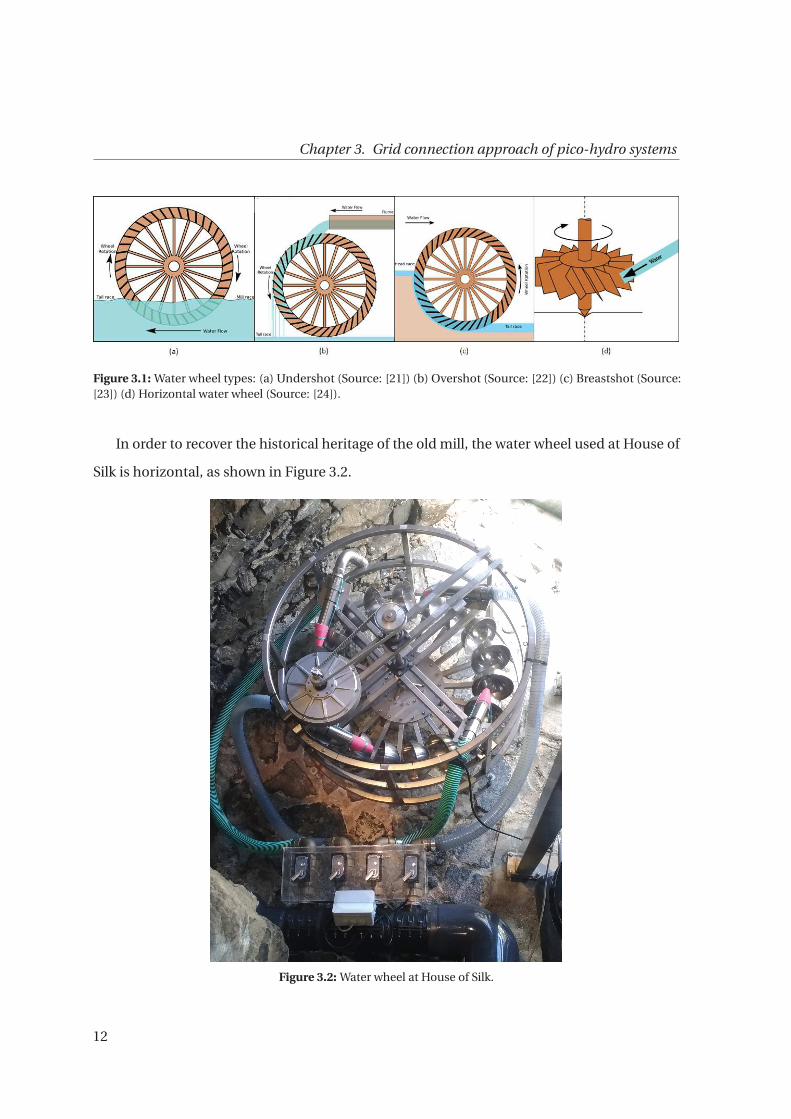
In order to recover the historical heritage of the old mill, the water wheel used at House of
Silk is horizontal, as shown in Figure 3.2.
Figure 3.2: Water wheel at House of Silk.
12
3.2. Synchronous generators
3.2 Synchronous generators
Generators are electrical machines that convert mechanical power into electrical power.
To select a generator, it is important to consider several aspects such as rated speed, output
power, voltage and current range, for on- or off-grid connection, with or without battery. The
main types of generators are [25]:
• DC brushed machine: requires a commutation mechanism (brushes or slip rings) to
convert the internal AC voltages to DC voltages at its terminals.
• Asynchronous (or induction) AC machine: the stator field induces the magnetic field of
the rotor. It is based on the principle of induction. The electrical frequency is slightly
different from the mechanical frequency.
• Synchronous AC machine: the magnetic field of the rotor is based on permanent
magnets or DC current applied to a rotor winding (electromagnets). The electrical
frequency is proportional to the mechanical speed.
The PMSG is a solution in the application of small-scale pico-hydro systems, which is
better in performance and cost when compared to other types of generators. DC generators
require frequent maintenance to replace the brushes and slip rings. Induction generators
require capacitor banks when they are used in off-grid operations to provide reactive power
to the stator windings to create the magnetic field [25].
In a PMSG the rotor magnets produce a rotating magnetic field, while the stator, where the
main voltage is induced, is connected to the load. These generators are called synchronous
because the electrical frequency produced is in sync with the rotating field produced by the
movement of the rotor of permanent magnets. Equation (3.1) shows the relationship between
the rate of rotation of the magnetic field and the electrical frequency of the stator.
fe =nsp
120(3.1)
where f e is electrical frequency [Hz], ns is the synchronous speed [rpm], p is the number
of poles.
13
Chapter 3. Grid connection approach of pico-hydro systems
Equation (3.2) shows that the voltage induced in each phase winding of the generator is
proportional to the magnetic flux φ, the frequency or speed of rotation, and the construction
of the machine.
E = Kφω (3.2)
where E is the electromotive force [V], K is a constant related to generator construction,
ω is the angular velocity of the rotor [rad/s]. If ω is expressed in electric radians per second, K
depends on the number of turns per coil, if ω is in mechanical radians per second K depends
on the number of turns per coil and poles of the generator [25].
Both Equations (3.1) and (3.2) show that a way to regulate the voltage and frequency
generated by this type of synchronous generators is to regulate the frequency or shaft speed
rotation.
In cases where the microgrids are an isolated system (off-grid), there is a need for voltage
and frequency regulation. These systems are generally used to supply a small demand, as
in villages. On the other hand, when microgrids are on-grid systems, there is a need for
synchronization with the conventional grid (voltage, frequency, and phase regulation). The
generator is connected with the grid by an interface able to make the synchronization. If an
inverter is used, it needs to follow some requirements (Section 3.5).
3.3 Photovoltaic inverters
Inverters are power electronic devices that convert a DC source in a AC output. The
photovoltaic inverter has the proposal of connecting the DC energy produced by photovoltaic
module strings or arrays in grid synchronized AC power. The categorization of these devices
can be done according to the PV power plant configuration as shown below [26]:
• Module inverters (or microinverters): usually in the 50 and 400 W range.
• String inverters: usually in the 0.4 and 2 kW range.
• Multistring inverters: usually in the 1.5 and 6 kW range.
14
3.4. Maximum Power Point Tracking for PV Systems
• Mini central inverters: usually higher than 6 kW, with three-phase topology.
• Central inverters: usually in the 100 to 1000 kW range, with three-phase topology.
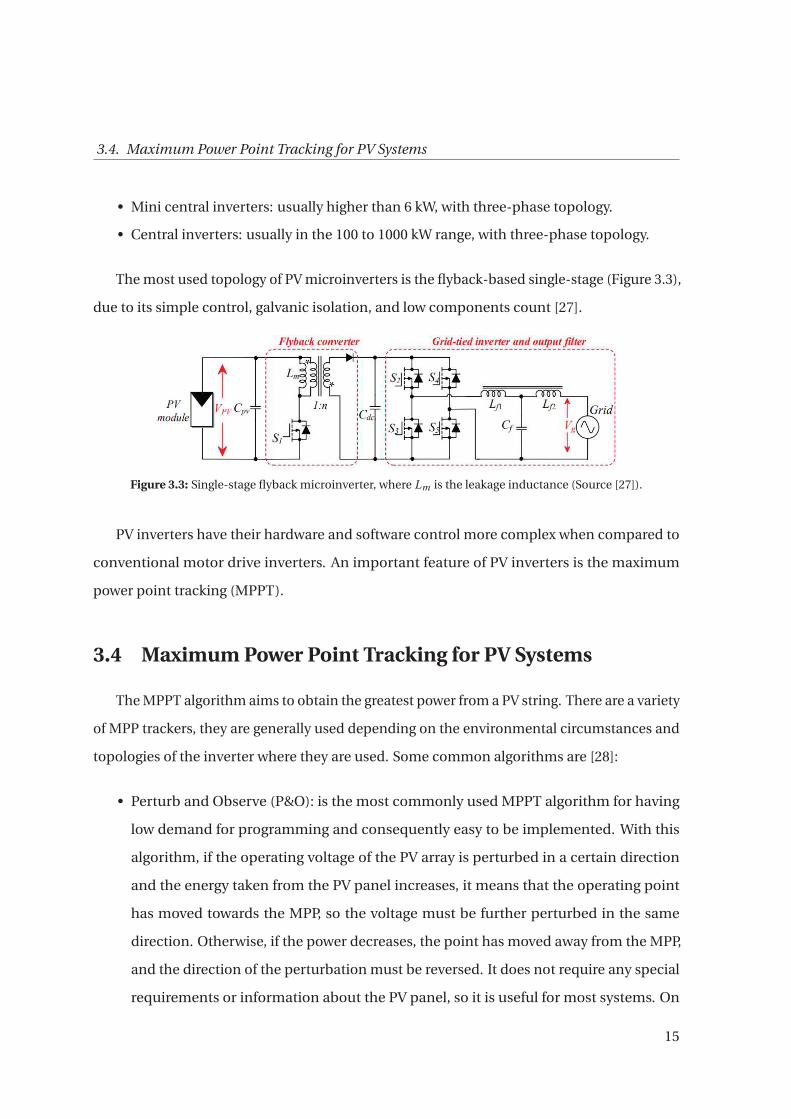
The most used topology of PV microinverters is the flyback-based single-stage (Figure 3.3),
due to its simple control, galvanic isolation, and low components count [27].
Figure 3.3: Single-stage flyback microinverter, where Lm is the leakage inductance (Source [27]).
PV inverters have their hardware and software control more complex when compared to
conventional motor drive inverters. An important feature of PV inverters is the maximum
power point tracking (MPPT).
3.4 Maximum Power Point Tracking for PV Systems
The MPPT algorithm aims to obtain the greatest power from a PV string. There are a variety
of MPP trackers, they are generally used depending on the environmental circumstances and
topologies of the inverter where they are used. Some common algorithms are [28]:
• Perturb and Observe (P&O): is the most commonly used MPPT algorithm for having
low demand for programming and consequently easy to be implemented. With this
algorithm, if the operating voltage of the PV array is perturbed in a certain direction
and the energy taken from the PV panel increases, it means that the operating point
has moved towards the MPP, so the voltage must be further perturbed in the same
direction. Otherwise, if the power decreases, the point has moved away from the MPP,
and the direction of the perturbation must be reversed. It does not require any special
requirements or information about the PV panel, so it is useful for most systems. On
15
Chapter 3. Grid connection approach of pico-hydro systems
the other hand, it is a generic algorithm, presenting oscillation and tracking problems
under a rapid increase or decrease in irradiance levels.
• Incremental Conductance (INC): similar to the P&O algorithm, but INC seeks to over-
come the limitations of P&O. Both INC and P&O, make power tracking wrongly during
time intervals characterized by changing atmospheric conditions [29].
• Constant Voltage (CV): is the least efficient compared to other methods. However, when
the irradiance is lower, it has its performance better than the INC or the P&O. So the CV
is often programmed in a combination with one of the previous algorithms.
3.5 Grid Connection Requirements
To connect to the conventional grid, commercial converters must comply with the stan-
dards established by IEC and IEEE. In 2013, was published ABNT NBR Std. 16149 by the
Brazilian Association of Technical Standards (ABNT), based on IEC 61727. The main stan-
dards are:
• IEC 61727:2004, "Photovoltaic (PV) systems - Characteristics of the utility interface"
[30].
• IEEE 1547:2018, "IEEE Standard for Interconnection and Interoperability of Distributed
Energy Resources with Associated Electric Power Systems Interfaces" [31].
• ABNT NBR 16149:2013, "Photovoltaic (PV) systems – Characteristics of the utility in-
terface". In Portuguese it is found as "Sistemas fotovoltaicos (FV) – Características da
interface de conexão com a rede elétrica de distribuição" [32].
Figueira, et al .[33] present a comparison between these three standards. Some of the
compared characteristics are: power factor and reactive power injection, limitations for DC
injection, and total demand distortion and harmonics.
16
3.6. Over-voltage protection circuit
3.6 Over-voltage protection circuit
The over-voltage protection circuit is responsible for maintaining the integrity of the
inverter, preventing damage from occurring when the generator works with no-load. This can
occur in the following situations:
• Grid failure;
• During the synchronization of the inverter with the grid;
• High power produced by the generator;
• Low power demand.
In the first two cases, the generator operates without load and the output voltage increases.
In the last two there is excess power, that is, the generated power is higher than the maximum
input power of the PV inverter.
The over-voltage protection circuit limits the output voltage by restricting the maximum
speed of the PMSG. This limitation is made by the dissipation of energy in the power resistor.
If the excess power is greater than that supported by the dissipator, the generator has its
windings short-circuited.
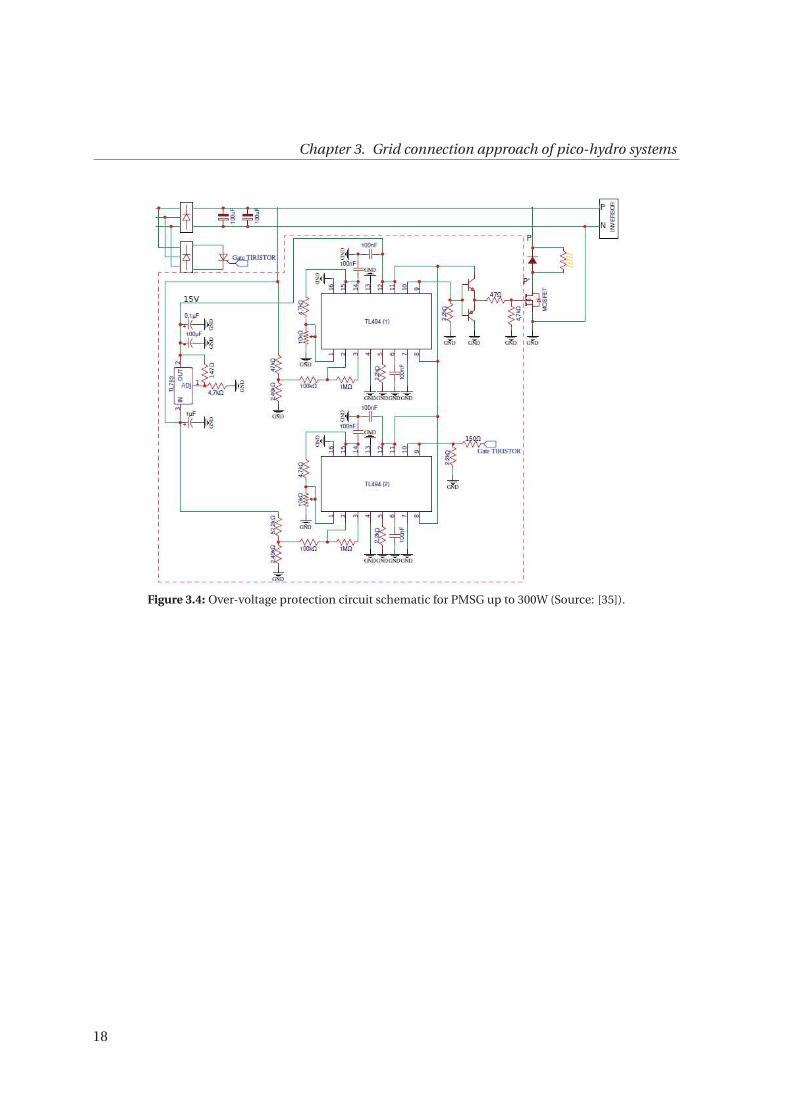
In [34] propose a low-cost over-voltage protection circuit for pico-hydro systems up to
300 W. This protection circuit, shown in Figure 3.4, consists of a step-down (buck) converter
to dissipate the energy in a power resistor and the switch device is controlled by Pulse-Width-
Modulation (PWM).
17
Chapter 3. Grid connection approach of pico-hydro systems
Figure 3.4: Over-voltage protection circuit schematic for PMSG up to 300W (Source: [35]).
18
Chapter 4
Water wheel grid connection strategy
This chapter describes the proposed structures to connect the generator with the grid and
explains the additional power interface used. In this chapter the experimental methods used
at Electromechatronic Systems Laboratory (LSE) and House of Silk are also described.
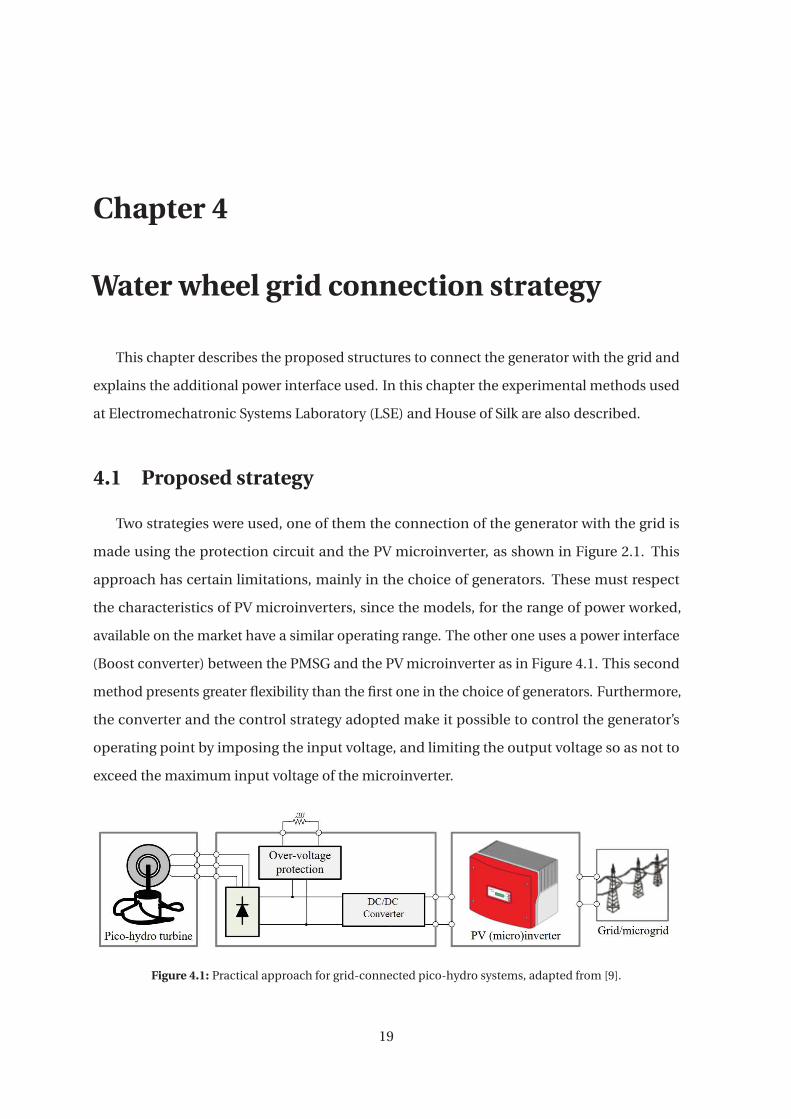
4.1 Proposed strategy
Two strategies were used, one of them the connection of the generator with the grid is
made using the protection circuit and the PV microinverter, as shown in Figure 2.1. This
approach has certain limitations, mainly in the choice of generators. These must respect
the characteristics of PV microinverters, since the models, for the range of power worked,
available on the market have a similar operating range. The other one uses a power interface
(Boost converter) between the PMSG and the PV microinverter as in Figure 4.1. This second
method presents greater flexibility than the first one in the choice of generators. Furthermore,
the converter and the control strategy adopted make it possible to control the generator’s
operating point by imposing the input voltage, and limiting the output voltage so as not to
exceed the maximum input voltage of the microinverter.
Figure 4.1: Practical approach for grid-connected pico-hydro systems, adapted from [9].
19
Chapter 4. Water wheel grid connection strategy
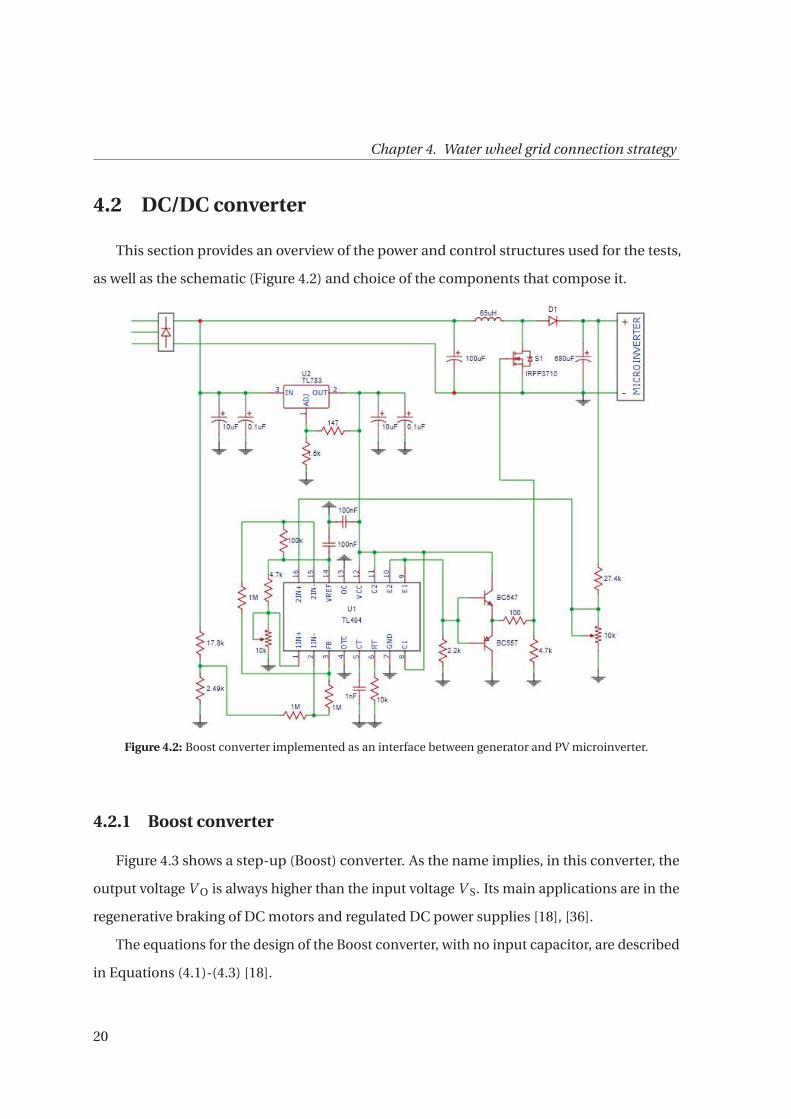
4.2 DC/DC converter
This section provides an overview of the power and control structures used for the tests,
as well as the schematic (Figure 4.2) and choice of the components that compose it.
Figure 4.2: Boost converter implemented as an interface between generator and PV microinverter.
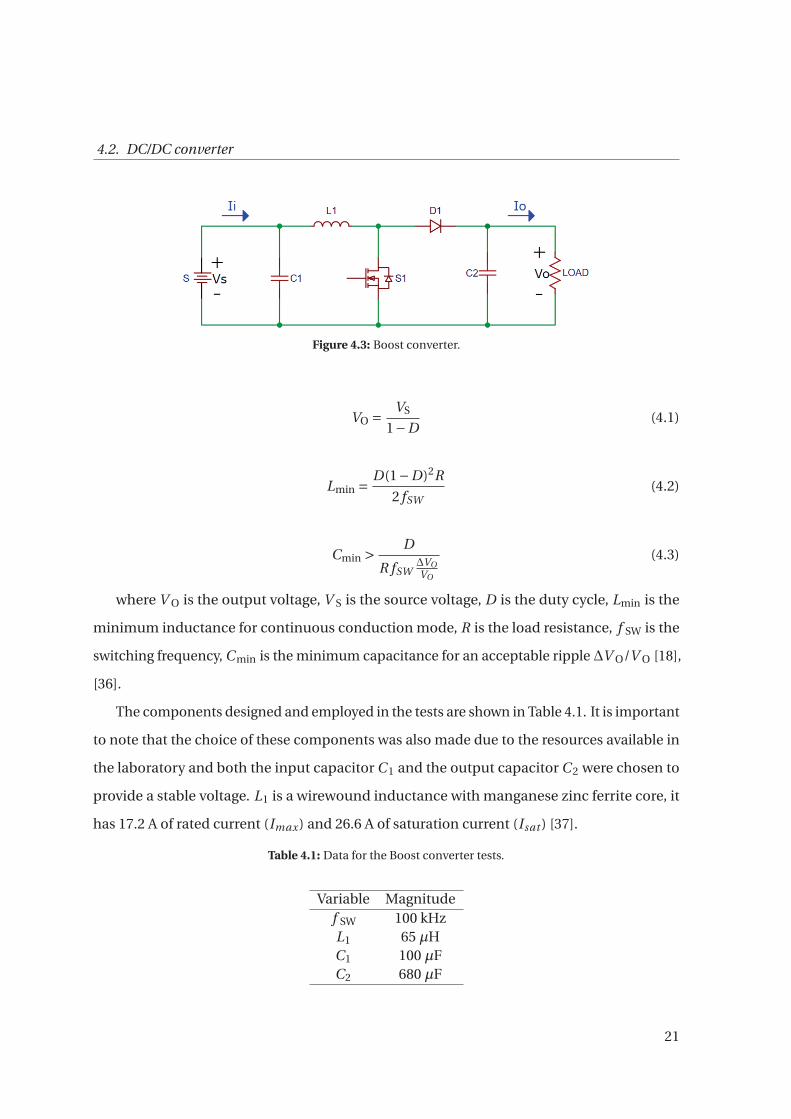
4.2.1 Boost converter
Figure 4.3 shows a step-up (Boost) converter. As the name implies, in this converter, the
output voltage V O is always higher than the input voltage V S. Its main applications are in the
regenerative braking of DC motors and regulated DC power supplies [18], [36].
The equations for the design of the Boost converter, with no input capacitor, are described
in Equations (4.1)-(4.3) [18].
20
4.2. DC/DC converter
Figure 4.3: Boost converter.
VO =
VS
1−D(4.1)
Lmin =
D(1−D)2R
2 fSW(4.2)
Cmin >
D
R fSW∆VO
VO
(4.3)
where V O is the output voltage, V S is the source voltage, D is the duty cycle, Lmin is the
minimum inductance for continuous conduction mode, R is the load resistance, f SW is the
switching frequency, C min is the minimum capacitance for an acceptable ripple ∆V O/V O [18],
[36].
The components designed and employed in the tests are shown in Table 4.1. It is important
to note that the choice of these components was also made due to the resources available in
the laboratory and both the input capacitor C 1 and the output capacitor C 2 were chosen to
provide a stable voltage. L1 is a wirewound inductance with manganese zinc ferrite core, it
has 17.2 A of rated current (Imax) and 26.6 A of saturation current (Isat ) [37].
Table 4.1: Data for the Boost converter tests.
Variable Magnitudef SW 100 kHzL1 65 µHC1 100 µFC2 680 µF
21
Chapter 4. Water wheel grid connection strategy
4.2.2 Control circuit
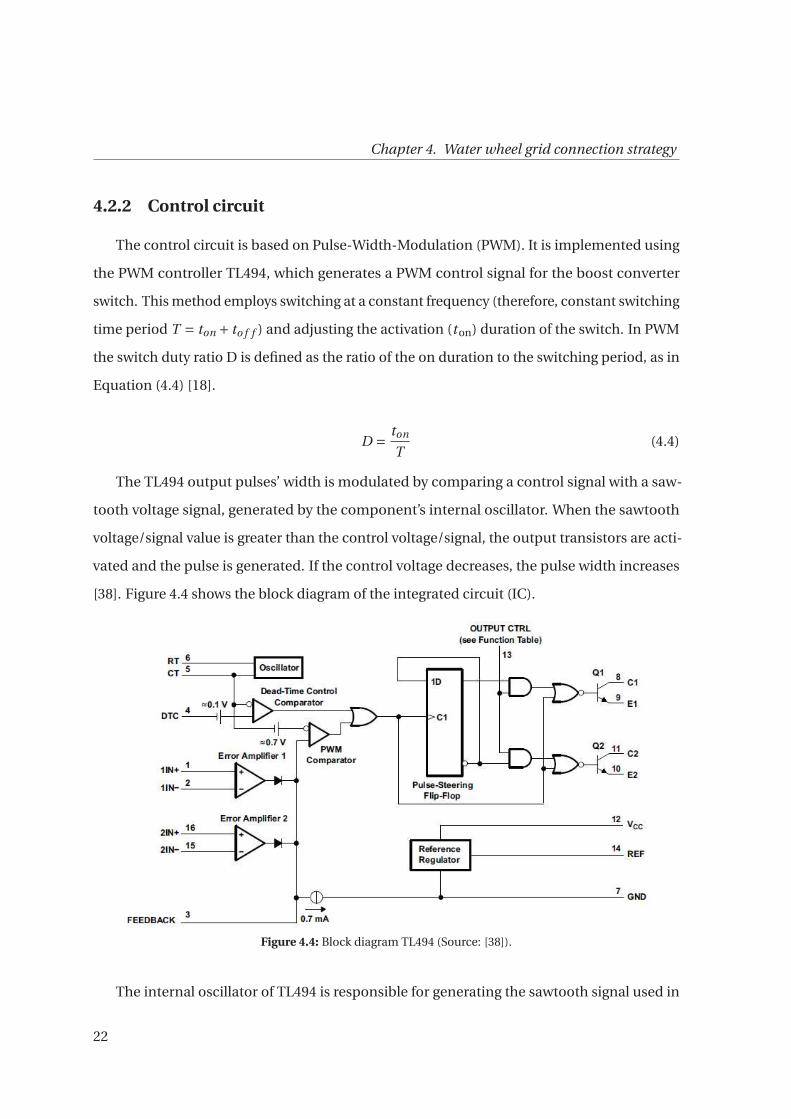
The control circuit is based on Pulse-Width-Modulation (PWM). It is implemented using
the PWM controller TL494, which generates a PWM control signal for the boost converter
switch. This method employs switching at a constant frequency (therefore, constant switching
time period T = ton + to f f ) and adjusting the activation (t on) duration of the switch. In PWM
the switch duty ratio D is defined as the ratio of the on duration to the switching period, as in
Equation (4.4) [18].
D =
ton
T(4.4)
The TL494 output pulses’ width is modulated by comparing a control signal with a saw-
tooth voltage signal, generated by the component’s internal oscillator. When the sawtooth
voltage/signal value is greater than the control voltage/signal, the output transistors are acti-
vated and the pulse is generated. If the control voltage decreases, the pulse width increases
[38]. Figure 4.4 shows the block diagram of the integrated circuit (IC).
Figure 4.4: Block diagram TL494 (Source: [38]).
The internal oscillator of TL494 is responsible for generating the sawtooth signal used in
22
4.2. DC/DC converter
the comparison with the control signal that generates the PWM. To set the operating frequency
of this oscillator a resistance RT connected to pin 6 and a capacitor CT connected to pin 5.
Equation (4.5) presents the oscillation, that is, the switching frequency.
fSW =
1
RT CT(4.5)
To have additional control over the PWM’s off time, it is enough to vary the voltage at input
pin 4, which is the input of a logic comparator present in the circuit internal. In this project,
pin 4 is connected to ground, which guarantees a minimum dead time of approximately 3%,
due to the internal displacement of 110 mV, since an open circuit is an undefined condition
[38].
TL494 contains two error operational amplifiers. In this amplifier type, one of the inputs
must have a reference voltage value while the ther is the measured signal (process variable).
Pins 2 and 15 are inverting inputs and 1 and 16 are the non-inverting inputs of the two
amplifiers present [38].
In this project, amplifier 1 (input pins 1 and 2) is used to set the input voltage, which ends
up imposing the PMSG’s operating point. Amplifier 2 (input pins 15 and 16) is responsible for
limiting the converter’s output voltage. The regulation of the input voltage and the limitation
of the output voltage are made by voltage dividers.
The voltage divider based on the 4.7 kΩ resistor and 10 kΩ trimmer sets the voltage
reference value, Vr e f 1, at pin 1. The resistors (R1 and R2) connected to pins 1 and 2 determine
the voltage values Vr e f 1 and V1 (pin 2) as in Equation (4.6).
Vr e f 1 =Vdi vR2
R1 +R2(4.6)
When the 4.7 kΩ resistor is connected to pin 14, Vdi v is equal to 5 V. Adjusting the trimmer
also at 4.7 kΩ, by equation (4.6), the voltage value Vr e f 1 is set to 2.5 V. While pin 1 receives a
fixed voltage value, pin 2 receives the value given by the voltage divider 2.49 kΩ and 17.8 kΩ.
The choice of resistors and reference voltage for amplifier 2 was made using the same logic.
The IC output has two transistors capable of transmitting the PWM signal. They can
23
Chapter 4. Water wheel grid connection strategy
be configured as open emitter/open collector. Pin 13 defines the operation mode of the
transistors according to the voltage applied to this terminal. If it is connected to the device 5
V reference, transistors operate in push-pull. For them to operate in parallel and transmitting
the same signal, pin 13 must be grounded [38].
For this project, the transistors operate in parallel, i.e. pin 13 is grounded. The pins 8 and
11 are connected to the 15 V and pins 9 and 10 are connected to each other. That configuration
confirms the connection of the transistors in parallel.
For the IC supply, pin 12 must be connected to an external power source that providing 7
V to 40 V for the device to work. This pin is the input for an internal regulator that supplies 5
V at its output (pin 14). Pin 7 is the ground for this regulator [38]. It will be used 15 V for IC
power, supplied by the voltage regulator TL783.
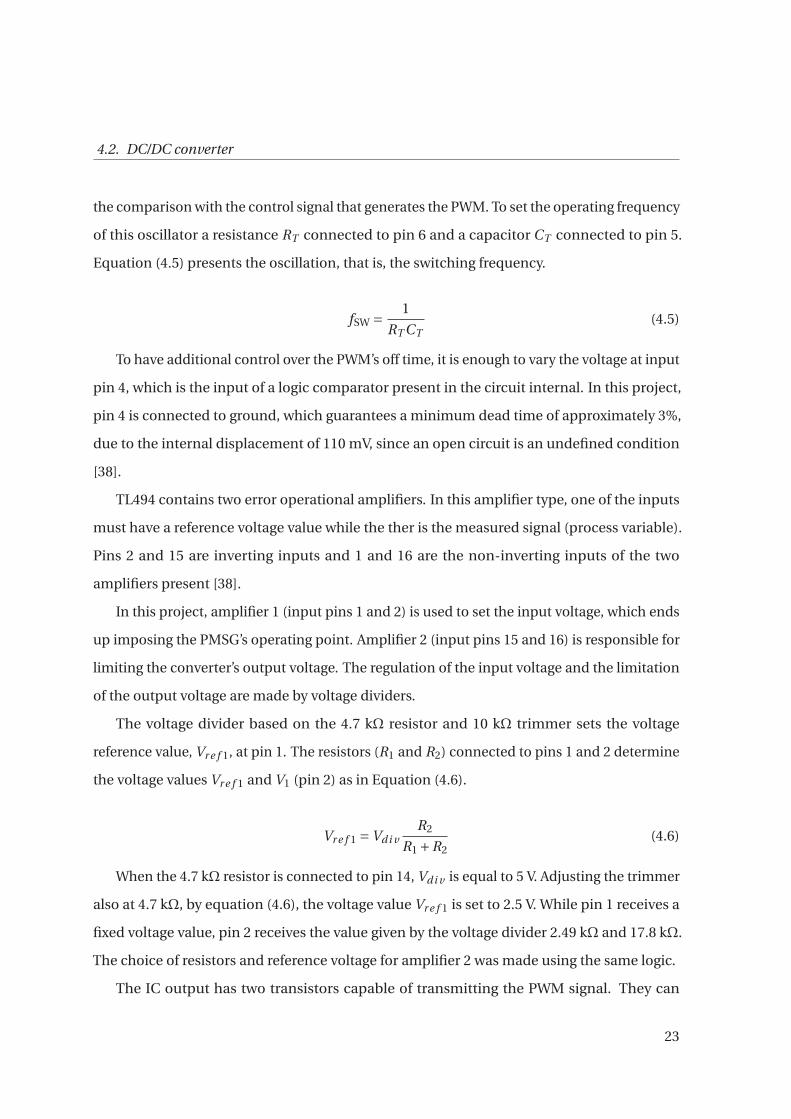
Figure 4.5 shows the TL783 regulator structure. It gets a voltage at its input VI and turns
into a lower value VO fixed at the output using a processing ratio provided by the manufacturer
itself (Equation (4.7)) [39].
Figure 4.5: Voltage regulator TL783 (Source: [39]).
VO =Vr e f
(
1+R2
R1
)
(4.7)
To obtain 15 V at the output, commercial resistances of 147 Ω for R1 and 1.6 kΩ for R2 can
be used, since a reference on the internal circuit generates 1.25 V at Vr e f 1. So VO is equal to
14.86 V, approximately 15 V.
24
4.3. Experimental test platforms
4.3 Experimental test platforms
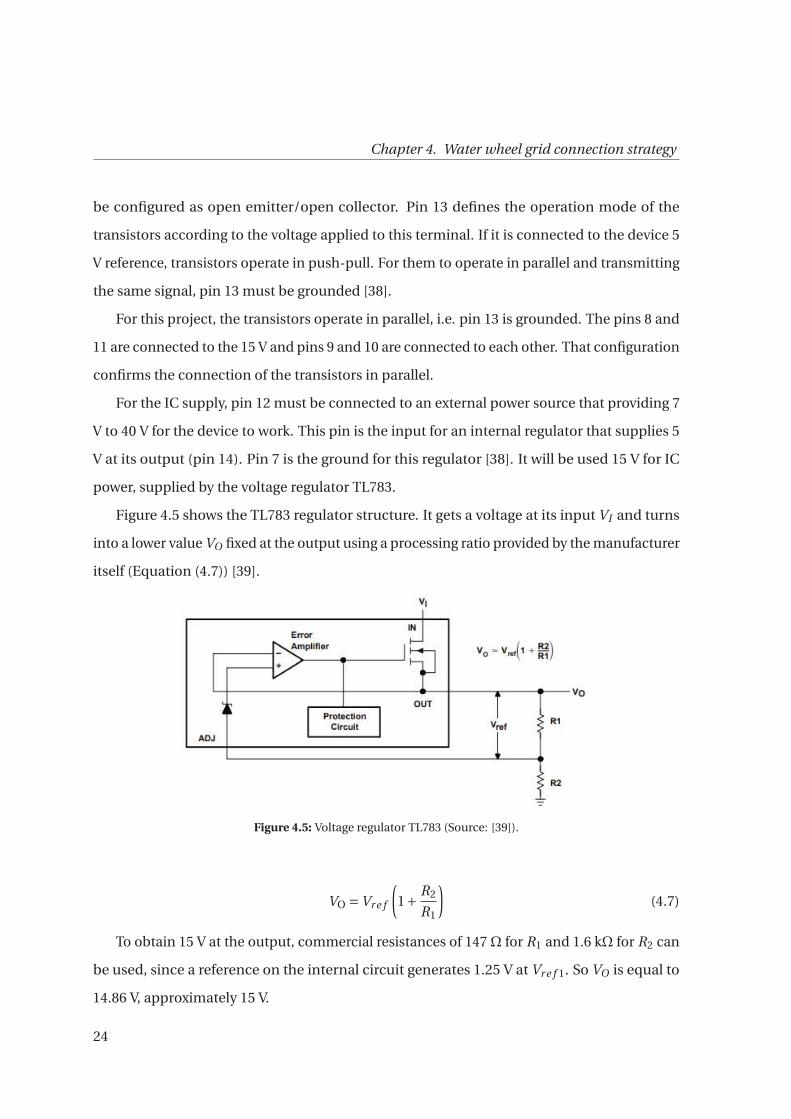
This section presents the structures and equipment used in the tests, both on a laboratory
workbench and in the real context of the water wheel implemented at House of Silk. Figure 4.6
shows the implemented boost circuit, Table 4.2 the characteristics of the generators used and
Table 4.3 the microinverter data.
Figure 4.6: DC/DC Boost converter circuit.
Table 4.2: PMSG 1 [9], 2 [9] and 3 [40] Technical data.
Gen. Speed (rpm) VDC (V) IDC (A) PDC (W)1 630 24 12.5 3002 300 28 10.7 3003 150 30 7.22 300
25
Chapter 4. Water wheel grid connection strategy
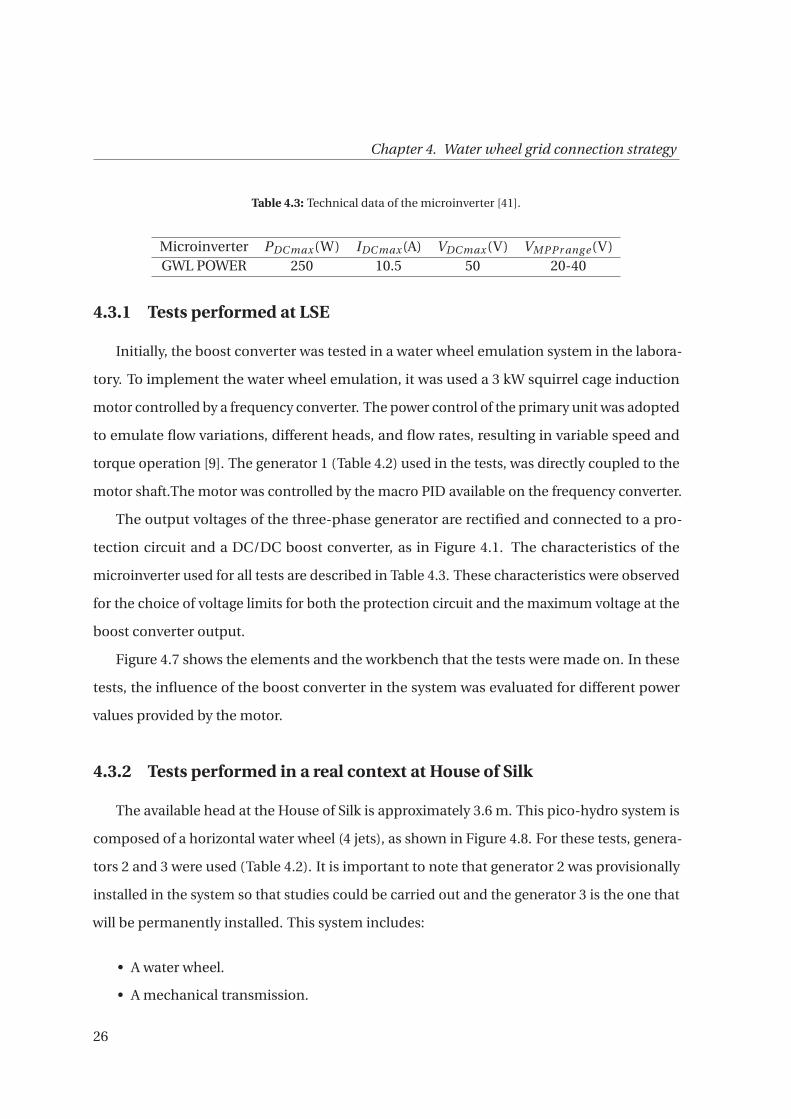
Table 4.3: Technical data of the microinverter [41].
Microinverter PDC max(W) IDC max(A) VDC max(V) VMPPr ang e (V)GWL POWER 250 10.5 50 20-40
4.3.1 Tests performed at LSE
Initially, the boost converter was tested in a water wheel emulation system in the labora-
tory. To implement the water wheel emulation, it was used a 3 kW squirrel cage induction
motor controlled by a frequency converter. The power control of the primary unit was adopted
to emulate flow variations, different heads, and flow rates, resulting in variable speed and
torque operation [9]. The generator 1 (Table 4.2) used in the tests, was directly coupled to the
motor shaft.The motor was controlled by the macro PID available on the frequency converter.
The output voltages of the three-phase generator are rectified and connected to a pro-
tection circuit and a DC/DC boost converter, as in Figure 4.1. The characteristics of the
microinverter used for all tests are described in Table 4.3. These characteristics were observed
for the choice of voltage limits for both the protection circuit and the maximum voltage at the
boost converter output.
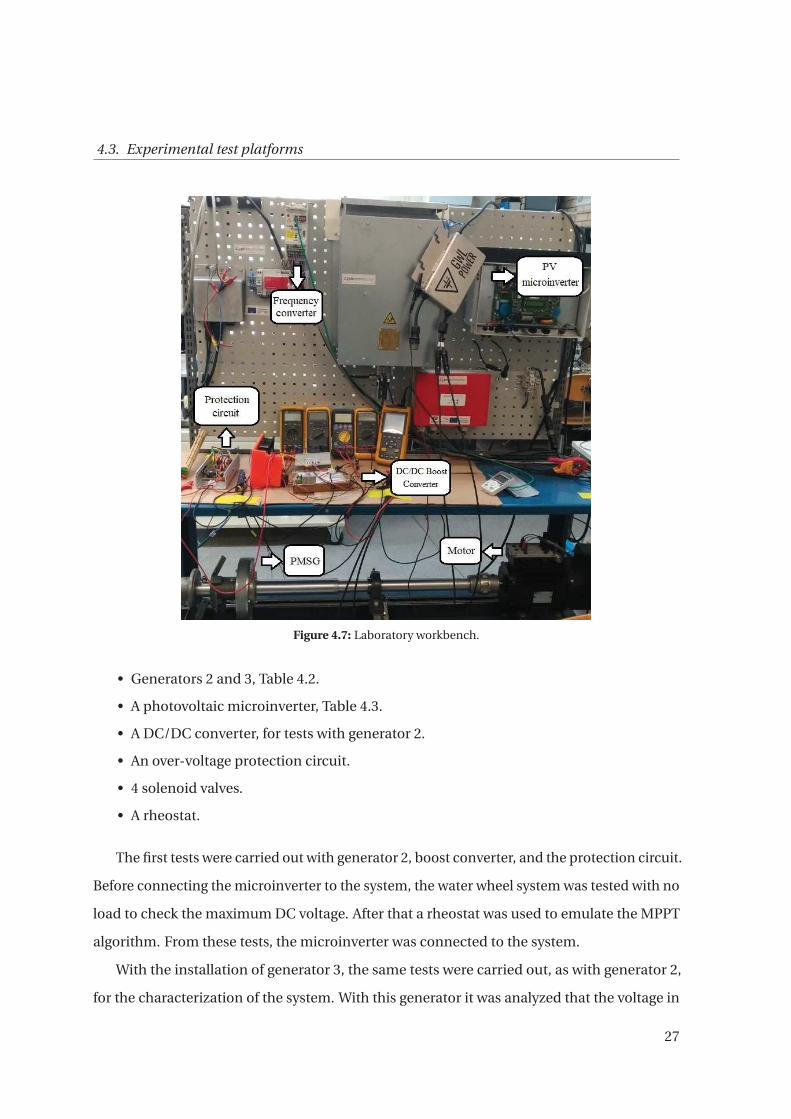
Figure 4.7 shows the elements and the workbench that the tests were made on. In these
tests, the influence of the boost converter in the system was evaluated for different power
values provided by the motor.
4.3.2 Tests performed in a real context at House of Silk
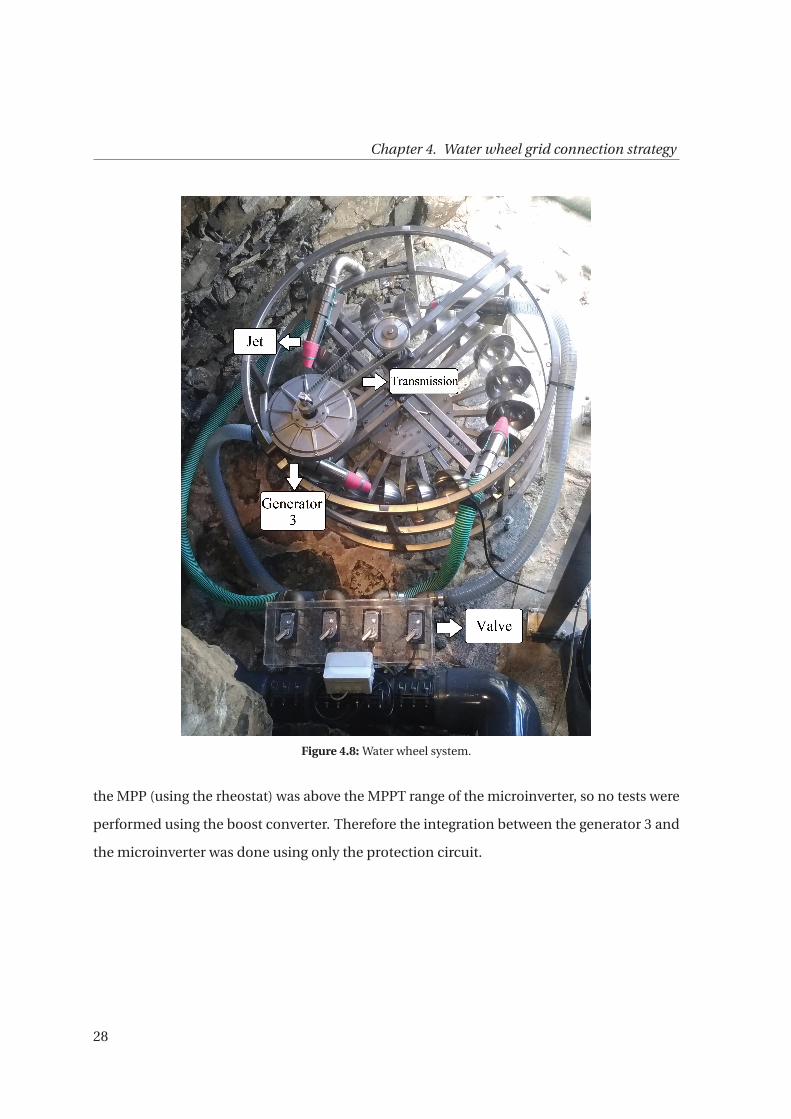
The available head at the House of Silk is approximately 3.6 m. This pico-hydro system is
composed of a horizontal water wheel (4 jets), as shown in Figure 4.8. For these tests, genera-
tors 2 and 3 were used (Table 4.2). It is important to note that generator 2 was provisionally
installed in the system so that studies could be carried out and the generator 3 is the one that
will be permanently installed. This system includes:
• A water wheel.
• A mechanical transmission.
26
4.3. Experimental test platforms
Figure 4.7: Laboratory workbench.
• Generators 2 and 3, Table 4.2.
• A photovoltaic microinverter, Table 4.3.
• A DC/DC converter, for tests with generator 2.
• An over-voltage protection circuit.
• 4 solenoid valves.
• A rheostat.
The first tests were carried out with generator 2, boost converter, and the protection circuit.
Before connecting the microinverter to the system, the water wheel system was tested with no
load to check the maximum DC voltage. After that a rheostat was used to emulate the MPPT
algorithm. From these tests, the microinverter was connected to the system.
With the installation of generator 3, the same tests were carried out, as with generator 2,
for the characterization of the system. With this generator it was analyzed that the voltage in
27
Chapter 4. Water wheel grid connection strategy
Figure 4.8: Water wheel system.
the MPP (using the rheostat) was above the MPPT range of the microinverter, so no tests were
performed using the boost converter. Therefore the integration between the generator 3 and
the microinverter was done using only the protection circuit.
28
Chapter 5
Results and Discussion
This chapter contains the results and their analysis obtained via experimentation in the
laboratory and a real context at House of Silk.
5.1 Experimental results using a laboratory workbench
Figure 5.1 presents the implemented setup for the laboratory tests. This system consists
of a frequency converter driving a three-phase induction motor to supply the mechanical
power of the generator 1 (Table 4.2). The latter is connected to a rectifier bridge, which is
connected to the ammeter (A) and the voltmeter (V), responsible for the current and voltage
measurements at the boost converter input. Then the protection circuit and the converter are
connected followed by additional measuring devices to monitor voltage and current at the PV
microinverter input. Finally, the PV microinverter extracts the power from the DC bus and
injects it into the laboratory grid with adequate voltage and frequency.
Since the MPP voltage range limit is 40 V and the maximum input voltage of the microin-
verter is 50V (see Table 4.3). The voltage VDC chosen for the protection circuit to start to
dissipate power into a resistor was 42 V, and the maximum output voltage at the boost con-
verter was 44 V. The power values in the frequency converter were 95.5%, 100%, and 100.5%.
Figure 5.2 shows the results obtained, showing the difference between the boost converter
input and the PV microinverter input. Excel software was used to organize and graph the
results obtained with the measuring devices.
29
Chapter 5. Results and Discussion
Figure 5.1: Experimental setup diagram of the grid connection test with boost converter using a laboratoryworkbench.
Figure 5.2: Result using boost converter and generator 1: (a) boost input (b) microinverter input.
It is possible to observe in Figure 5.2 (a) that the boost converter was able to keep the
30
5.2. Experimental results in a real context at Silk House
generator operating within a voltage range. This makes it possible to keep the generator at
the point of operation that would extract maximum power from the system. Also, the boost
converter is responsible for decoupling the generator and the PV microinverter operating
points.
In Figure 5.2 (b) is observed that until 27.5 V the PV microinverter is capable of processing
all the generated power. Following, the power begins to be limited by the microinverter in
approximately 250 W, and the input current starts decreasing and input voltage continues
increasing until the protection circuit starts operating at approximately 42 V, limiting the
voltage at that point. The excess power then is dissipated in the auxiliary resistance of the
protection circuit.
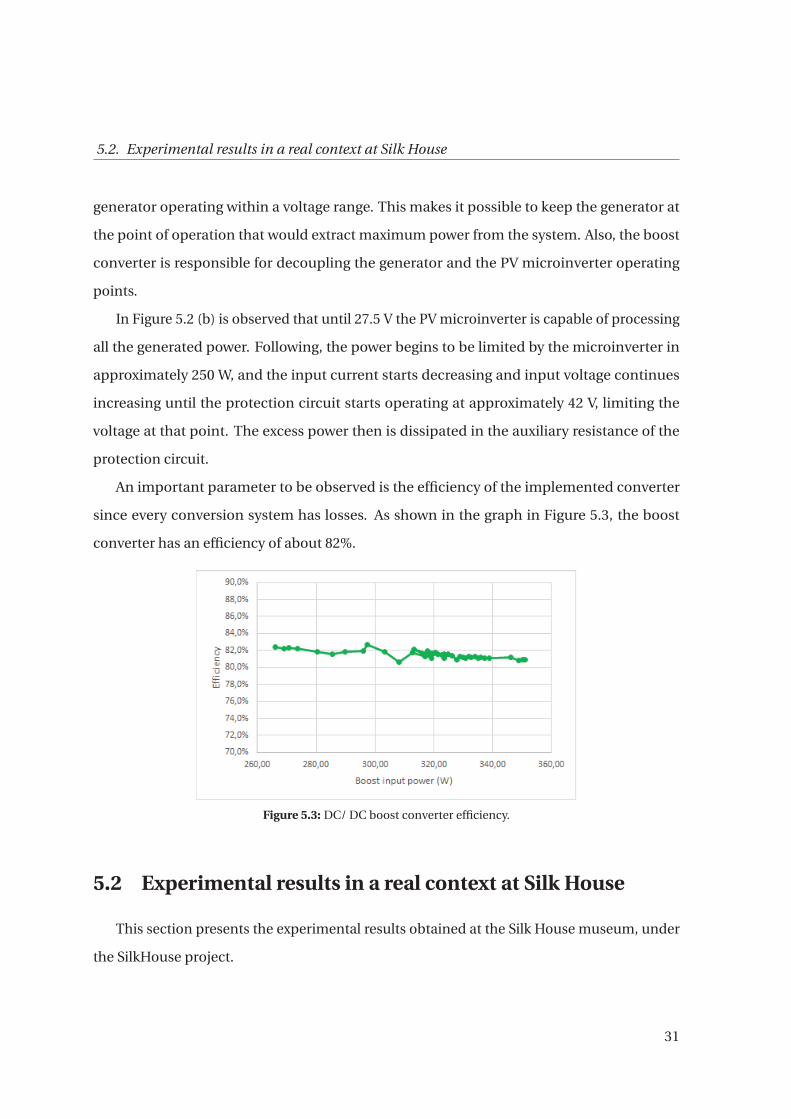
An important parameter to be observed is the efficiency of the implemented converter
since every conversion system has losses. As shown in the graph in Figure 5.3, the boost
converter has an efficiency of about 82%.
Figure 5.3: DC/ DC boost converter efficiency.
5.2 Experimental results in a real context at Silk House
This section presents the experimental results obtained at the Silk House museum, under
the SilkHouse project.
31
Chapter 5. Results and Discussion
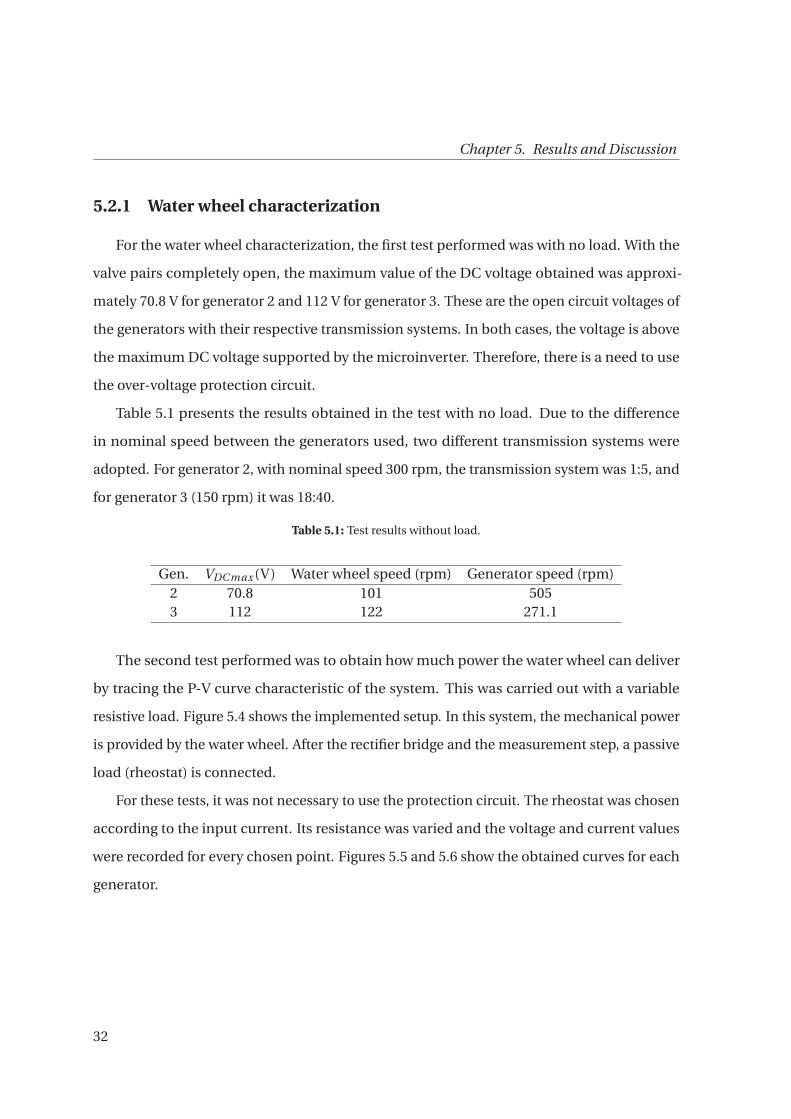
5.2.1 Water wheel characterization
For the water wheel characterization, the first test performed was with no load. With the
valve pairs completely open, the maximum value of the DC voltage obtained was approxi-
mately 70.8 V for generator 2 and 112 V for generator 3. These are the open circuit voltages of
the generators with their respective transmission systems. In both cases, the voltage is above
the maximum DC voltage supported by the microinverter. Therefore, there is a need to use
the over-voltage protection circuit.
Table 5.1 presents the results obtained in the test with no load. Due to the difference
in nominal speed between the generators used, two different transmission systems were
adopted. For generator 2, with nominal speed 300 rpm, the transmission system was 1:5, and
for generator 3 (150 rpm) it was 18:40.
Table 5.1: Test results without load.
Gen. VDC max(V) Water wheel speed (rpm) Generator speed (rpm)2 70.8 101 5053 112 122 271.1
The second test performed was to obtain how much power the water wheel can deliver
by tracing the P-V curve characteristic of the system. This was carried out with a variable
resistive load. Figure 5.4 shows the implemented setup. In this system, the mechanical power
is provided by the water wheel. After the rectifier bridge and the measurement step, a passive
load (rheostat) is connected.
For these tests, it was not necessary to use the protection circuit. The rheostat was chosen
according to the input current. Its resistance was varied and the voltage and current values
were recorded for every chosen point. Figures 5.5 and 5.6 show the obtained curves for each
generator.
32
5.2. Experimental results in a real context at Silk House
Figure 5.4: Experimental setup diagram of the passive load test.
Figure 5.5: Results using the rheostat and generator 2: (a) with slip in the transmission system (b) without slip inthe transmission system.
33
Chapter 5. Results and Discussion
Figure 5.6: Result using the rheostat and generator 3.
After the first test using the passive load with generator 2, it was observed that occurred a
slip in the transmission system (Figure 5.5 (a)). In this test, the maximum DC power found was
103.9 W for a voltage of 30.94 V. With the correction of the problem, the tests were repeated
(Figure 5.5 (b)). The maximum DC power was approximately 144 W for a voltage of 47.17 V. In
this test, the point of maximum power is outside the MPPT range of the microinverter, and it
is close to the supported voltage limit (Table 4.3). In this graph, it is possible to observe that
for a variation of 5% of the power close to the MPP, indicated by the horizontal dashed lines,
the variation in the voltage is of about 20% (from 40.5 V to 49.7 V), vertical dashed lines.
Figure 5.6 shows the results obtained with generator 3. The maximum DC power obtained
was 154,5 W for a voltage of 61,27 V. This voltage is higher than the maximum supported by
the PV microinverter. Therefore, for this system, when connected to the microinverter, the
protection circuit ends up having to limit the operating point. Analyzing the 5% variation in
power close to MPP, in this graph, the variation in voltage is even more significant than in the
previous case, being about 46% (from 42.3 V to 67 V).
In both tests, with generator 2 and generator 3, for a variation of only 5% in power there
is a considerable variation in voltage, reaching 46% in the second case. These results show
that the power curves, as a function of the DC voltage, is flatter than the same curve for a
PV module. This indicates that the PV microinverter can operate close to the maximum
power point, but with voltage and current varying significantly. For the PV microinverter to
34
5.2. Experimental results in a real context at Silk House
be compatible with the water wheel (generator), the maximum voltage variation limits must
be within the MPPT range of the microinverter. Otherwise, the operating point may go out of
the MPP range and not draw maximum power.
5.2.2 Grid connection DC/DC boost converter
After the analysis of the characteristic curve obtained in the tests with the variable resistive
load, it was concluded that it would not be possible to use the boost converter in the system
with generator 3 and the coupled mechanical transmission. Indeed, for this system, the
voltage where MPP is found is considerably higher than that supported by the microinverter.
As explained in subsection 4.2.1, the boost converter is capable of raising the input voltage
at its output. Therefore, tests in real context with the boost converter were made only for
generator 2.
It is important to note that, for the boost converter to always be operating, and limiting
the voltage at its output, diode D1 (Figure 4.3) cannot be directly polarized. That is, the input
voltage VS must always be less than the output voltage VO . Therefore, the voltage of the
protection circuit is less than the maximum output voltage allowed by the boost converter in
all tests performed. The experimental setup implemented for the passive load test with the
boost converter is shown in Figure 5.7.
Figure 5.7: Experimental setup diagram of the passive load test with boost converter.
The results shown in Figure 5.8, refer to the passive load test with the DC/DC boost
converter. The protection circuit was configured to limit the voltage close to 40 V (boost input)
and the boost converter output is limited to 45 V (microinverter input).
35
Chapter 5. Results and Discussion
Figure 5.8: Results with boost converter and generator 2: (a) boost converter input (b) boost converter output(with variable passive load).
The maximum power achieved with the PV microinverter was 112.65 W at 45.27 V (boost
limit), while the generator operating point was at 29.12 V and provided 133.19 W. After reaching
maximum power, the over-voltage protection started to act, and the boost converter limited
the voltage at the output.
In the tests carried out with the PV microinverter (active load), as shows the Figure 5.9, it
was observed that while the voltage limit of the boost converter was above 40 V (maximum
value of the PV microinverter MPPT range) the microinverter was unable to connect to the
grid. Table 5.2 - 5.4 show the results for the system using the PV microinverter for different
configurations.
36
5.2. Experimental results in a real context at Silk House
Figure 5.9: Experimental setup diagram of the grid connection test with boost converter.
Table 5.2: Water Wheel grid connection results with Gen.2 and boost converter (Protection circuit limit 38 V andBoost limit 40 V)
Boost Input PV microinverter InputVDC (V) 27.81 39.52IDC (A) 4.63 2.78
PDC (W) 128.68 109.83
Table 5.3: Water Wheel grid connection results with Gen.2 and boost converter (Protection circuit 36 V Boostlimit 39 V)
Boost Input PV microinverter InputVDC (V) 27.5 35.69IDC (A) 4.63 3.05
PDC (W) 125.39 108.83
Table 5.4: Water Wheel grid connection results with Gen.2 and boost converter (Protection circuit 36 V Boostlimit 40 V)
Boost Input PV microinverter InputVDC (V) 27.10 36.33IDC (A) 4.57 2.90
PDC (W) 123.78 105.33
As the results show, to extract the maximum power from the system, it is necessary to
reduce the transmission ratio between the water wheel and the generator and, consequently,
reduce the voltage so that VMPP (voltage at the maximum power point) is within the MPPT
range.
37
Chapter 5. Results and Discussion
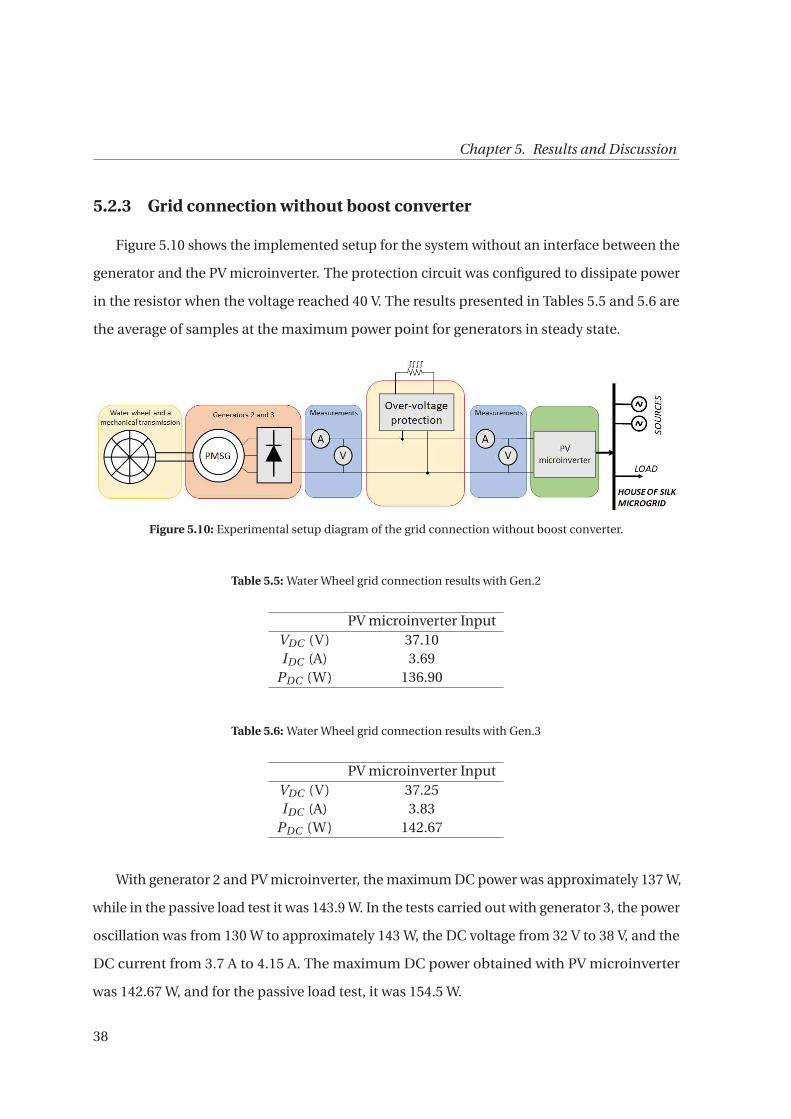
5.2.3 Grid connection without boost converter
Figure 5.10 shows the implemented setup for the system without an interface between the
generator and the PV microinverter. The protection circuit was configured to dissipate power
in the resistor when the voltage reached 40 V. The results presented in Tables 5.5 and 5.6 are
the average of samples at the maximum power point for generators in steady state.
Figure 5.10: Experimental setup diagram of the grid connection without boost converter.
Table 5.5: Water Wheel grid connection results with Gen.2
PV microinverter InputVDC (V) 37.10IDC (A) 3.69
PDC (W) 136.90
Table 5.6: Water Wheel grid connection results with Gen.3
PV microinverter InputVDC (V) 37.25IDC (A) 3.83
PDC (W) 142.67
With generator 2 and PV microinverter, the maximum DC power was approximately 137 W,
while in the passive load test it was 143.9 W. In the tests carried out with generator 3, the power
oscillation was from 130 W to approximately 143 W, the DC voltage from 32 V to 38 V, and the
DC current from 3.7 A to 4.15 A. The maximum DC power obtained with PV microinverter
was 142.67 W, and for the passive load test, it was 154.5 W.
38
Chapter 6
Conclusions
The application of small-scale hydro systems proved to be feasible considering the search
for renewable sources due to climate changes and production for 24 hours a day. The water
wheel system implemented at the House of Silk has a purpose to recover the historical heritage
of the place, where there was a former mill, with a utility adapted to the present: energy
generation in a sustainable way.
For the pico-hydro system up to 300 W, the integration of synchronous generators with
PV microinverters was studied, using a protection circuit and a DC/DC converter or only the
protection circuit. Experimental tests were performed in the laboratory, using a water wheel
emulation system, and in a real context at the House of the Silk.
The application of a power interface between the generator and the PV microinverter was
proposed in this work, and proved to be significant. Since it provides the decoupling between
the parts, allowing both the generator and the microinverter to work with different points of
operation. It also presents the control of the generator’s operating point so that it operates at
a point that extracts maximum power from the system.
At House of Silk, the implementation without the DC/DC converter proved to be more
efficient. In the system without the converter, the maximum power reached was 142.67 W.
Meanwhile, with the converter, it was 109.83 W, due to the specifications imposed by the PV
microinverter and the intrinsic losses of the converter.
Although the implementation without a converter presents results with greater power than
those with the boost converter, an efficient power interface can be of great importance. Indeed,
the system has a very flat power vs DC voltage curve (compared to the photovoltaic P-V curve)
around the MPP. It was verified that there is a considerable variation in voltage for a variation
within 5% of the power. The results obtained show that, for many pico-hydro turbines, the
39
Chapter 6. Conclusions
voltage range, in normal operation, may be higher than the MPPT range of microinverters.
This indicates that the grid connection using microinverters with water wheels presents this
challenge in its implementation. Therefore, the additional power interface, emulating water
wheels as PV modules, presents itself as a possible alternative for the solution of this challenge.
6.1 Future Work
This section presents suggestions for future work related to the topic in question, intending
to improve the implementation of pico-hydro systems.
The focus of future works should be on two objectives, first in the efficiency of the power
interface. The second must aim to decouple the operating points of the generator and the
microinverter or photovoltaic inverter. This allows extracting the maximum power from the
generator (water wheel) and fixing or reducing the operating point range at the input of the
(micro)inverter. The implementation of a buck-boost converter with current control at the
output, emulating the photovoltaic modules, seems to be the most promising solution. At
the generator output, the voltage must be able to vary widely, to be compatible with different
generators (speed-torque pair). Furthermore, the over-voltage protection must be integrated
into the same interface.
40
References
[1] H. Ritchie and M. Roser, “Fossil fuels”, Our World in Data, 2020, https://ourworldindata.org/fossil-fuels.
(visited on May 7, 2020).
[2] European Commission, Energy research and innovation. [Online]. Available: https://ec.europa.eu/info/
research-and-innovation/research-area/energy-research-and-innovation_en (visited on May 13, 2020).
[3] ——, Energy research and innovation strategy. [Online]. Available: https://ec.europa.eu/info/research-
and-innovation/research-area/energy-research-and-innovation/strategy_en (visited on May 13, 2020).
[4] F. Katiraei, R. Iravani, N. Hatziargyriou, and A. Dimeas, “Microgrids management”, IEEE Power and
Energy Magazine, vol. 6, no. 3, pp. 54–65, 2008.
[5] S. J. Williamson, A. Griffo, B. H. Stark, and J. D. Booker, “Control of parallel single-phase inverters in a
low-head pico-hydro off-grid network”, in IECON 2013 - 39th Annual Conference of the IEEE Industrial
Electronics Society, 2013, pp. 1571–1576.
[6] O. Paish, “Small hydro power: Technology and current status”, Renewable and sustainable energy reviews,
vol. 6, no. 6, pp. 537–556, 2002.
[7] A. Lahimer, M. Alghoul, K. Sopian, N. Amin, N. Asim, and M. Fadhel, “Research and development aspects
of pico-hydro power”, Renewable and Sustainable Energy Reviews, vol. 16, no. 8, pp. 5861–5878, 2012.
[8] J. Fraile-Ardanuy, J. R. Wilhelmi, J. J. Fraile-Mora, and J. I. Pérez, “Variable-speed hydro generation:
Operational aspects and control”, IEEE Transactions on energy conversion, vol. 21, no. 2, pp. 569–574,
2006.
[9] G. M. Ribeiro, W. Maidana, V. Leite, and Â. Ferreira, “Grid connection approach for very small-scale pico-
hydro systems using pv microinverters”, in IECON 2019-45th Annual Conference of the IEEE Industrial
Electronics Society, IEEE, vol. 1, 2019, pp. 2372–2376.
[10] W. E. Council, World energy resources|2016. [Online]. Available: https://www.worldenergy.org/assets/
images/imported/2016/10/World-Energy-Resources-Full-report-2016.10.03.pdf (visited on Jun. 22,
2020).
[11] K. Sopian and J. A. Razak, “Pico hydro: Clean power from small streams”, in Proceedings of the 3rd World
Scientific and Engineering Academy and Society International Conference on Renewable Energy Sources,
Tenerife, Spain, vol. 13, 2009.
41
References
[12] M. Basar, A Ahmad, N Hasim, and K. Sopian, “Introduction to the pico hydro power and the status of
implementation in malaysia”, in 2011 IEEE Student Conference on Research and Development, IEEE, 2011,
pp. 283–288.
[13] European Commission, Hydropower. [Online]. Available: https://ec.europa.eu/info/research- and-
innovation/research-area/energy-research-and-innovation/hydropower_en (visited on May 23, 2020).
[14] W. Mazgaj, Z. Szular, T. Wegiel, and T. Sobczyk, “Small hydropower plant with variable speed pm genera-
tor”, Przeglad Elektrotechniczny, vol. 87, no. 5, pp. 282–287, 2011.
[15] V. Leite, J. Couto, Â. Ferreira, and J. Batista, “A practical approach for grid-connected pico-hydro systems
using conventional photovoltaic inverters”, in 2016 IEEE International Energy Conference (ENERGYCON),
IEEE, 2016, pp. 1–6.
[16] V. Leite, Â. Ferreira, J. Couto, and J. Batista, “Compatibility analysis of grid-connected pico-hydro systems
using conventional photovoltaic inverters”, in 2016 18th European Conference on Power Electronics and
Applications (EPE’16 ECCE Europe), IEEE, 2016, pp. 1–9.
[17] L. C. d. Silva, “Power interface for grid-connected pico-hydro systems using pv inverters”, Master’s thesis,
Instituto Politécnico de Bragança, 2019.
[18] N. Mohan, T. Undeland, and W. Robbins, Power electronics: converters, applications, and design, ser. Power
Electronics: Converters, Applications, and Design. John Wiley & Sons, 2003, vol. 1, ISBN: 9780471226932.
[19] B. Lewis, J. Cimbala, and A. Wouden, “Major historical developments in the design of water wheels
and francis hydroturbines”, in IOP Conference Series: Earth and Environmental Science, IOP Publishing,
vol. 22, 2014, p. 012 020.
[20] P.-L. Viollet, Water Engineering in Ancient Civilizations: 5,000 Years of History. CRC Press, 2007.
[21] Wikimedia Commons, Undershot water wheel schematic. [Online]. Available: https://upload.wikimedia.
org/wikipedia/commons/thumb/1/12/Undershot_water_wheel_schematic.svg/1138px-Undershot_
water_wheel_schematic.svg.png (visited on Oct. 2, 2020).
[22] ——, Overshot water wheel schematic. [Online]. Available: https://upload.wikimedia.org/wikipedia/
commons/thumb/5/53/Overshot_water_wheel_schematic.svg/991px- Overshot_water_wheel_
schematic.svg.png (visited on Oct. 2, 2020).
[23] ——, Breastshot water wheel schematic. [Online]. Available: https://upload.wikimedia.org/wikipedia/
commons/thumb/8/86/Breastshot_water_wheel_schematic.svg/705px-Breastshot_water_wheel_
schematic.svg.png (visited on Oct. 2, 2020).
[24] Malcolm.boura, Horizontal water wheel schematic. [Online]. Available: https://upload.wikimedia.org/
wikipedia/commons/4/45/Vertical_waterwheel_simple.svg (visited on Oct. 2, 2020).
42
References
[25] S. J. Chapman, Fundamentos de máquinas elétricas. AMGH Editora, 2013.
[26] R. Teodorescu, M. Liserre, and P. Rodriguez, Grid converters for photovoltaic and wind power systems.
John Wiley & Sons, 2011, vol. 29.
[27] J. Yuan, F. Blaabjerg, Y. Yang, A. Sangwongwanich, and Y. Shen, “An overview of photovoltaic microinvert-
ers: Topology, efficiency, and reliability”, in 2019 IEEE 13th International Conference on Compatibility,
Power Electronics and Power Engineering (CPE-POWERENG), IEEE, 2019, pp. 1–6.
[28] D. Hohm and M. Ropp, “Comparative study of maximum power point tracking algorithms using an
experimental, programmable, maximum power point tracking test bed”, in Conference Record of the
Twenty-Eighth IEEE Photovoltaic Specialists Conference-2000 (Cat. No. 00CH37036), IEEE, 2000, pp. 1699–
1702.
[29] N. Femia, G. Petrone, G. Spagnuolo, and M. Vitelli, “Optimization of perturb and observe maximum
power point tracking method”, IEEE transactions on power electronics, vol. 20, no. 4, pp. 963–973, 2005.
[30] “IEC 61727:2004, IEC standard photovoltaic (pv) systems – characteristics of the utility interface”, IEC,
Standard, pp. 1–23, Dec. 2004.
[31] “IEEE standard for interconnection and interoperability of distributed energy resources with associated
electric power systems interfaces”, IEEE Std 1547-2018 (Revision of IEEE Std 1547-2003), pp. 1–138, 2018.
[32] “ABNT NBR 16149: Standard photovoltaic (pv) systems – characteristics of the utility interface”, ABNT,
Standard, 2013.
[33] H. H. Figueira, H. L. Hey, L. Schuch, C. Rech, and L. Michels, “Brazilian grid-connected photovoltaic
inverters standards: A comparison with iec and ieee”, in 2015 IEEE 24th International Symposium on
Industrial Electronics (ISIE), 2015, pp. 1104–1109.
[34] I. C. Scotta, G. M. Ribeiro, W. Maidana, and V. Leite, “Over-voltage protection for pico-hydro genera-
tion using pv microinverters”, in Ibero-American Congress on Information Management and Big Data,
Springer, 2019, pp. 25–37.
[35] I. C. Scotta, “Circuitos de proteção contra sobretensão para turbinas pico-hídricas e eólicas ligadas à
rede elétrica através de inversores eletrónicos”, Master’s thesis, Instituto Politécnico de Bragança, 2019.
[36] A. Ahmed, Power Electronics For Technology. PEARSON EDUCATION (US), 1998, ISBN: 9780132310697.
[37] Würth Elektronik, “Datasheet: WE-HCFT round wire THT high current inductor”. [Online]. Available:
https://pt.mouser.com/datasheet/2/445/7443783533650-1721979.pdf (visited on Oct. 2, 2020).
[38] Texas Instrument, “Datasheet: TL494 pulse-width-modulation control circuits”, Electronic Publication,
1983.
43

References
[39] ——, “Datasheet: TL783 high-voltage adjustable regulator”, Electronic Publication, 1981.
[40] Hefei Top Grand Energy Technology Co. ltd, “Wind power generator TEGET320-I-0.3KW-150R”.
[41] G. W. Logistic, “Micro-inverters technical details and specifications”, 2019.
44