Embed Size (px)
Citation preview
ANALYSIS OF GSM CALL FLOW WITH SS7
MESSAGES & OPTIMIZATION IN GSM
NETWORK
PROJECT REPORT
Submitted by
GAYATHRI S
Register No: 14MAE004
in partial fulfillment for the requirement of award of the
degree
of
MASTER OF ENGINEERING
in
APPLIED ELECTRONICS
Department of Electronics and Communication Engineering
KUMARAGURU COLLEGEOF TECHNOLOGY
(An autonomous institution affiliated to Anna University, Chennai)
COIMBATORE-641049
ANNA UNIVERSITY: CHENNAI 600 025
APRIL 2016
2
BONAFIDE CERTIFICATE
Certified that this project report titled “ANALYSIS OF CALL FLOW WITH
SS7 MESSAGES AND OPTIMIZATION IN GSM NETWORK” is the
bonafide work of GAYATHRI S [Reg. No. 14MAE004] who carried out the
research under my supervision. Certified further, that to the best of my
knowledge the work reported herein does not form part of any other project or
dissertation on the basis of which a degree or award was conferred on an earlier
occasion on this or any other candidate.
HHHH
The Candidate with university Register No. 14MAE004 was examined by us
in the project viva –voice examination held on............................
SIGNATURE
Dr.M.Alagumeenaakshi, Ph.d.,
PROJECT SUPERVISOR
Department of ECE
Kumaraguru College of Technology
Coimbatore-641 049
SIGNATURE
Dr. A.VASUKI, Ph.d.,
HEAD OF THE DEPARTMENT
Department of ECE
Kumaraguru College of Technology
Coimbatore-641 049

3
ACKNOWLEDGEMENT
First, I would like to express my praise and gratitude to the Lord, who has
showered his grace and blessings enabling me to complete this project in an excellent
manner.
I express my sincere thanks to the management of Kumaraguru College of
Technology and Joint Correspondent Shri. Shankar Vanavarayar for the kind
support and for providing necessary facilities to carry out the work.
I would like to express my sincere thanks to our beloved Principal
Dr.R.S.Kumar, Kumaraguru College of Technology, who encouraged me with his
valuable thoughts.
I would like to thank Dr.A.Vasuki,Ph.d., Head of the Department, Electronics
and Communication Engineering, for her kind support in completion of the project.
In particular, I wish to thank with everlasting gratitude to the project
coordinator Mrs.S.Umamaheswai,M.E.,(Ph.D)., Associate Professor, Department of
ECE and I wish to convey my deep sense of gratitude to all teaching and non-teaching
staff of ECE Department for their help and cooperation.
I am greatly privileged to express my heartfelt thanks to my project guide
Dr.M.Alagumeenaakshi,Ph.D.,Assisstant Professor(SRG), Department of ECE, for
her expert counseling and guidance to make this project to a great deal of success.
make this project to a great deal of success.
I would like to thank Mr.K.Ramesh (Sub-Divisional Engineer) from
RGMTTC (Rajiv Gandhi Memorial Telecom Training Centre) of BSNL (Bharat
Sanchar Nigam Limited) at Chennai, for his support in completion of this project
successful.
Finally, I thank my parents and my family members for giving me the moral
support and abundant blessings in all of my activities and my dear friends who helped
me to endure my difficult times with their unfailing support and warm wishes.
Iii
4
ABSTRACT
As cellular communication has become one of the fast growing communication
medium with dynamically increasing usage and users. It requires a constant
evaluation towards its parameters to ensure the quality and performance. RF
optimization is a way to optimize the GSM network and to evaluate the quality of
service. This project is proposed with an intention of reducing the call drops, which
seems to be a very high issue among the subscribers as well as among the service
providers. It is found that call drops in conventional networks is less than 0.01% and
in mobile network it is greater than 0.1%. As per TRAI (Telecom Regularity
Authority of India), call drops have doubled in last one year. Call drops jumped
two-fold on 2G and 65% on 3G networks. Since continuation of an active call is a
prime importance in cellular system, a new approach has been designed to minimize
the rate of call drops as well as increase the quality of the network related to
customer satisfaction and performance of cellular operator to enhance the revenue of
the company. This approach deals with the design of increasing the number of
carriers in each sector of the BTS (Base Transceiver Station). This leads to the
reduction call drops to a greater extent even during peak hours. The improvement in
number of carriers from 3|3|3 to 5|5|5 is done by radio frequency planning in BCCH
(Broadcast Channel) and optimisation in TCH (Traffic Channel). The optimisation
process is done using a commercial tool “RF AGILENT TEST DRIVE TOOL”,
which pinpoints the spot where capacity issues exist in radio access network.
This project also provides a way to increase the signal strength at various areas
with in a cell thereby increasing the coverage area of the cell and reduce the amount
of call dropping and call blocking for both long call and short call and ensure a
successful call handoff. This helps the operator to successfully utilize the limited
number of available carrier to produce greater quality. Also effective utilization of
the carrier makes the system more economical.
5
TABLE OF CONTENTS
CHAPTER NO. TITLE PAGE NO.
ABSTRACT iv
LIST OF FIGURES vii
LIST OF ABBREVIATIONS viii
1 INTRODUCTION 1
1.1 INTRODUCTION TO MOBILE
COMMUNICATION
1
1.2 DUPLEXING
METHODOLOGY
2
1.2.1 Frequency Division Duplex 2
1.2.2 Time Division Duplex 2
1.3 MULTIPLE ACCESS
TECHNOLOGIES
2
1.3.1 Frequency Division Multiple
Access
3
1.3.2 Time Division Multiple Access 3
1.3.3 Code Division Multiple Access 4
1.4 GEOGRAPHICAL AREAS OF
THE GSM NETWORK
4
1.5 GSM ARCHITECTURE 5
6
1.5.1 Network and Switching
subsystem
6
1.5.1.1 Mobile Switching Centre 6
1.5.1.2 Home Location Register 6
1.5.1.3 Visitor Location Register 6
1.5.1.4 Equipment Identity
Register
7
1.5.1.5 Authentication Centre 7
1.5.2 Operation and Maintenance
Centre
7
1.5.3 Base Station Subsystem 8
1.5.3.1 Base Transceiver Station 8
1.5.3.2 Base Station Controller 8
1.5.4 Mobile Station 8
1.5.4.1 The Terminal 8
1.5.4.2 The SIM 9
1.6 CONTROL CHANNELS 9
1.6.1 Traffic channels 10
1.6.1.1 Traffic Channel Full rate 10
1.6.1.2 Traffic Channel Full rate 10
1.6.1.3 Enhanced Full Rate 10
7
1.6.2 Broadcast channels 10
1.6.3 Common control channels 11
1.6.4 Dedicated control channels 12
1.7 TELECOM SIGNALING
MECHANISM
13
1.8 PROJECT OUTLINE 17
2 LITERATURE SURVEY 18
3 RF OPTIMIZATION 22
3.1 INTRODUCTION TO RF
OPTIMIZATION
22
3.2 THE OPTIMIZATION
PROCESS
22
3.3 DRIVE TESTING 23
3.4 WORKING EQUIPMENT 25
3.5 PARAMETERS MEASURED 25
3.6 FREQUENTLY OBSERVED
ISSUES
26
3.6.1 Cell Dragging 26
3.6.2. Dropped Calls 26
3.6.3. Ping-Ponging 26
3.6.4. System Busy 27
3.6.5. Handover boundary 27
8
3.6.6. Blocked Calls 27
3.7 SOLUTIONS PROPOSED 28
3.8 SUMMARY 28
4 AGILENT DRIVE TEST TOOL
CONFIGURATION
29
4.1 INTRODUCTION 29
4.2 PARAMETERS TO MEASURE 30
4.3 HARDWARE
REQUIREMENTS
33
4.4 PROCESS OF
CONFIGURATION
34
4.5 MS MODE OF THE DRIVE
TEST
36
4.5.1 IDLE mode 36
4.5.2 Long Call mode 37
4.5.3 Short Call mode 38
4.6 Receiver Quality Plot 40
4.7 Receiver Level Plot 41
5 RESULTS AND DISCUSSIONS 42
6 CONCLUSION AND FUTURE
ENHANCEMENT
50
REFERENCES 52
9
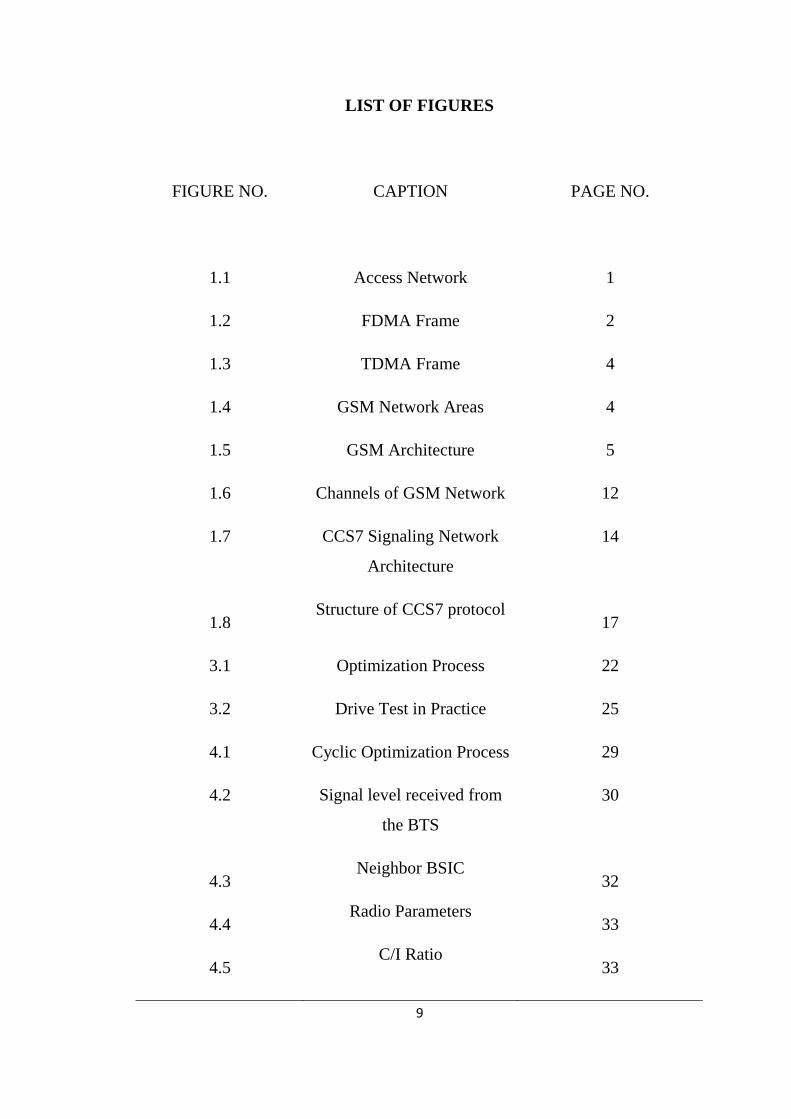
LIST OF FIGURES
FIGURE NO. CAPTION PAGE NO.
1.1 Access Network 1
1.2 FDMA Frame 2
1.3 TDMA Frame 4
1.4 GSM Network Areas 4
1.5
1.6
1.7
1.8
GSM Architecture
Channels of GSM Network
CCS7 Signaling Network
Architecture
Structure of CCS7 protocol
5
12
14
17
3.1 Optimization Process 22
3.2
4.1
4.2
4.3
4.4
4.5
Drive Test in Practice
Cyclic Optimization Process
Signal level received from
the BTS
Neighbor BSIC
Radio Parameters
C/I Ratio
25
29
30
32
33
33
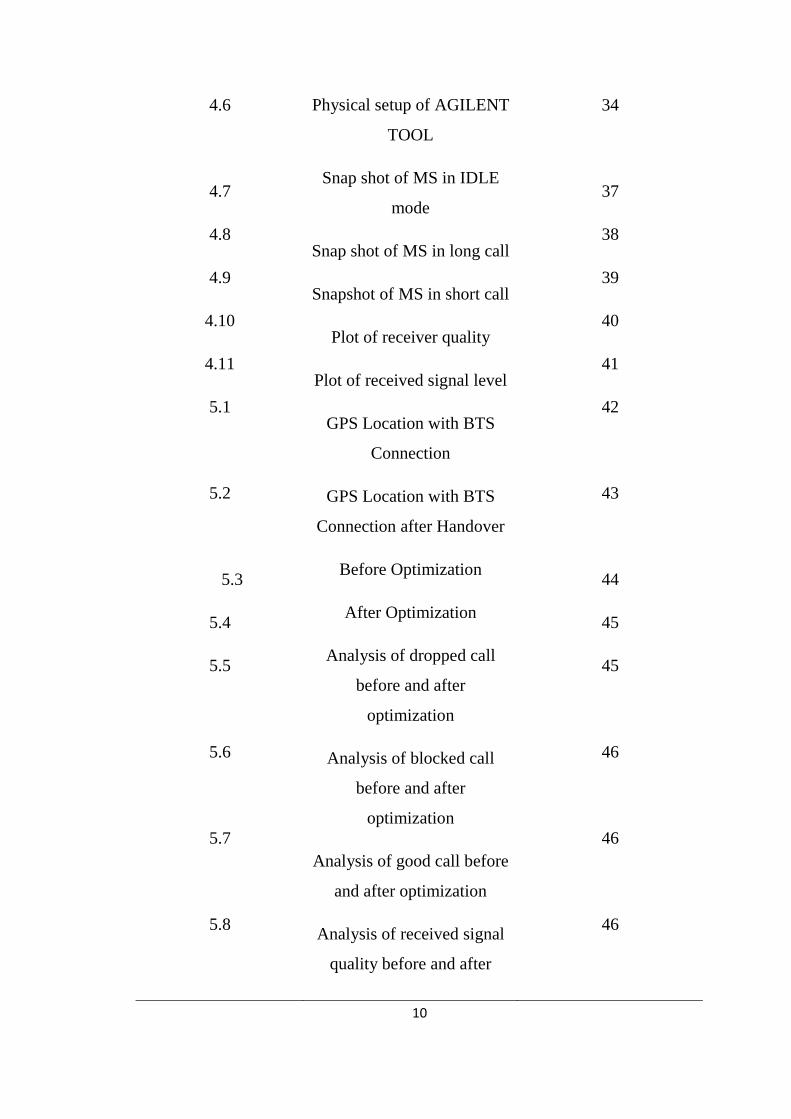
10
4.6
4.7
4.8
4.9
4.10
4.11
5.1
5.2
5.3
5.4
5.5
5.6
5.7
5.8
Physical setup of AGILENT
TOOL
Snap shot of MS in IDLE
mode
Snap shot of MS in long call
Snapshot of MS in short call
Plot of receiver quality
Plot of received signal level
GPS Location with BTS
Connection
GPS Location with BTS
Connection after Handover
Before Optimization
After Optimization
Analysis of dropped call
before and after
optimization
Analysis of blocked call
before and after
optimization
Analysis of good call before
and after optimization
Analysis of received signal
quality before and after
34
37
38
39
40
41
42
43
44
45
45
46
46
46
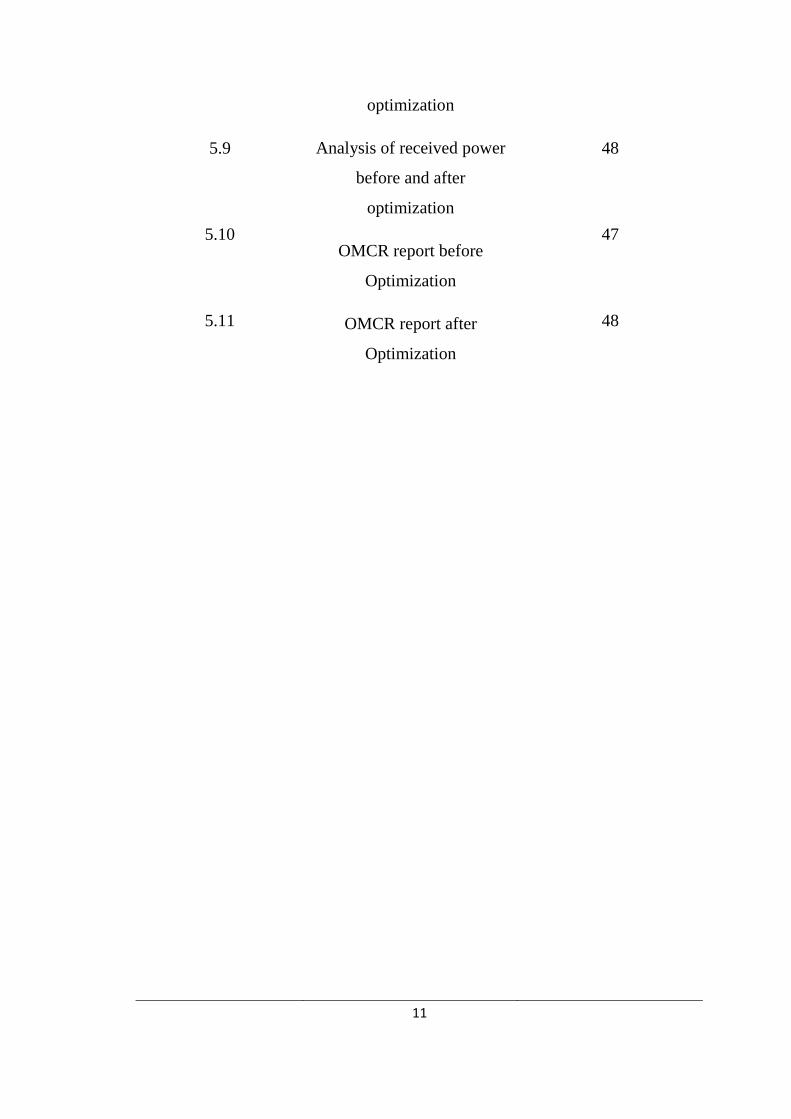
11
5.9
5.10
5.11
optimization
Analysis of received power
before and after
optimization
OMCR report before
Optimization
OMCR report after
Optimization
48
47
48

12
13
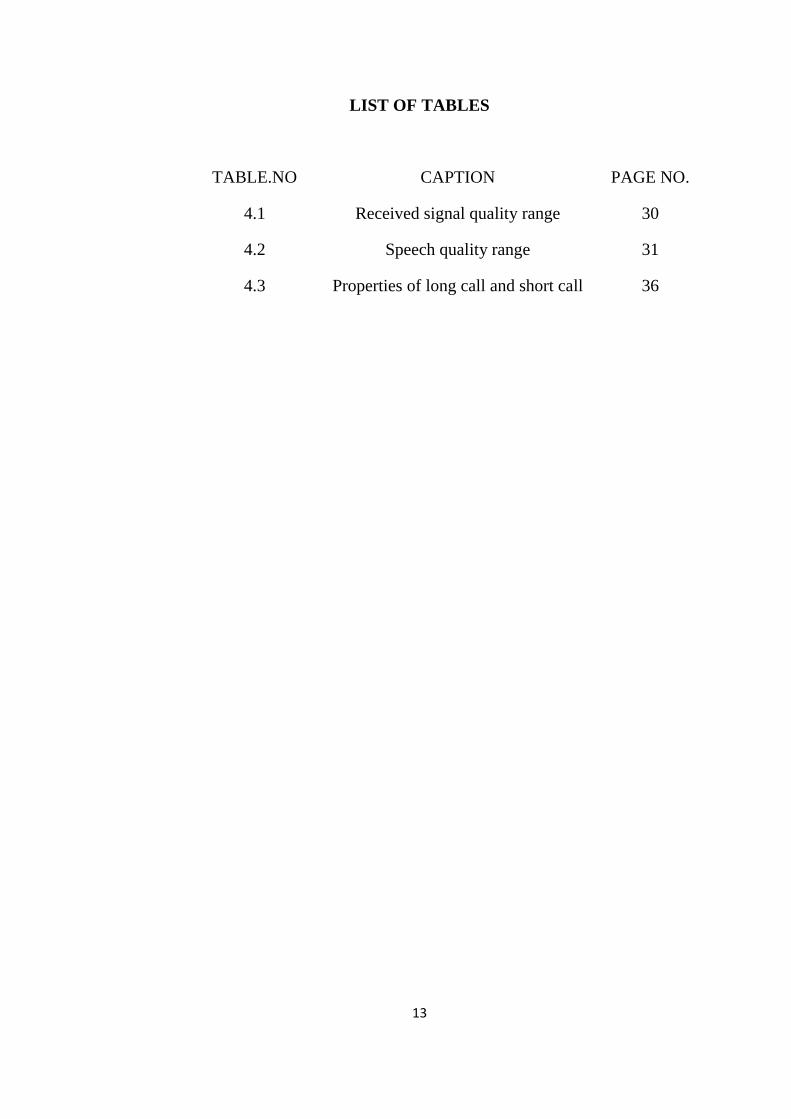
LIST OF TABLES
TABLE.NO CAPTION PAGE NO.
4.1 Received signal quality range 30
4.2 Speech quality range 31
4.3 Properties of long call and short call 36
14
LIST OF ABBREVIATIONS
GSM Global System for Mobile
FDMA Frequency Division Multiple Access
TDMA Time Division Multiple Access
CDMA Code Division Multiple Access
NSS Network Switching and Subsystem
MSC Mobile Switching Centre
HLR Home Location Register
VLR Visitor Location Register
EIR Equipment Identity Register
AUC Authentication Centre
OMC Operation and Maintenance Center
BSS Base Station Subsystem
BTS Base Transceiver Station
BSC Base Station Controller
MS Mobile Station
ND Network Dimensioning
QOS Quality Of Service
PSTN Public Switched Telephone Network
PLMN Public Land Mobile Network
15
LU Location Updation
LAI Location Area Identity
TCH Traffic Channel
BCCH Broadcast Control Channel
RACH Random Access Channel
AGCH Access Grant Channel
SIM Subscriber Identity Module
TMSI Temporary Mobile Subscriber Identity
ISDN International Service Digital Network
MSISDN Mobile Station International Service Digital Network
MSRN Mobile Station Roaming Number
ARFCN Absolute Radio Frequency Channel Number
ATOOL
OMCR
SDCCH
CBCH
Acceptance, Test Or Launch Language
Operation Maintenance and Center-Radio
Standalone Dedicated Control Channel
Cell Broadcast Channel
16
CHAPTER-1
INTRODUCTION
1.1 Introduction to Mobile Communication:
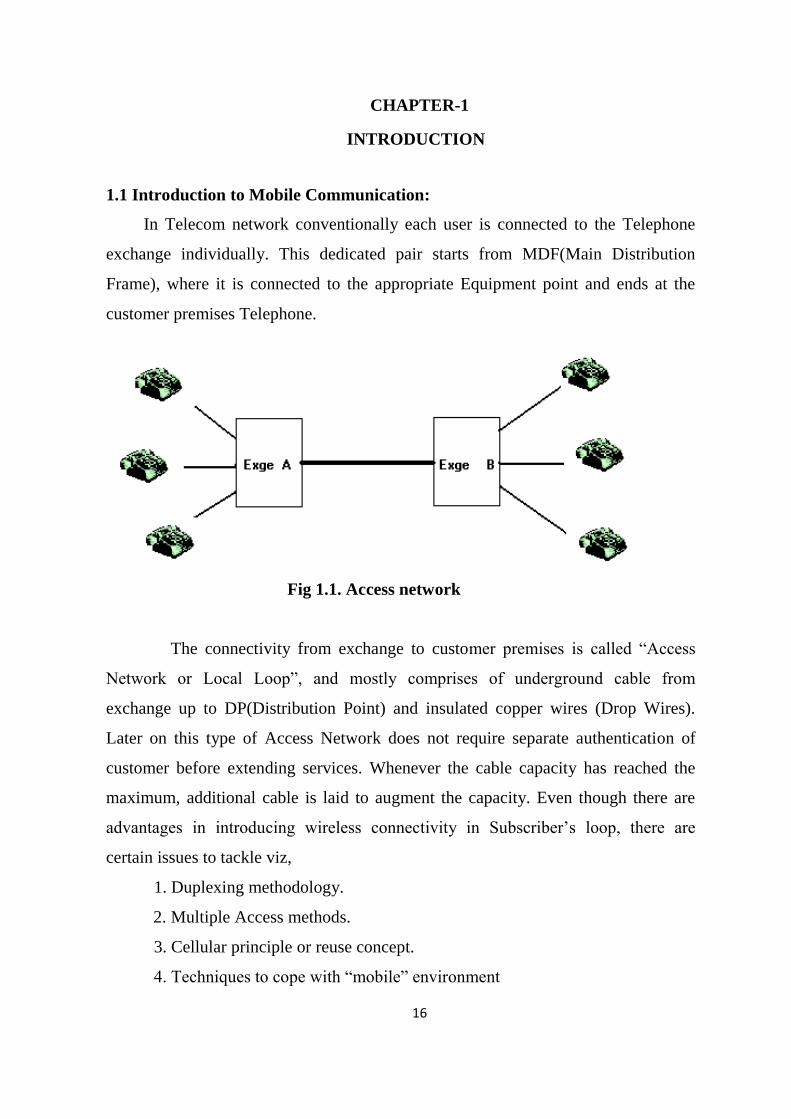
In Telecom network conventionally each user is connected to the Telephone
exchange individually. This dedicated pair starts from MDF(Main Distribution
Frame), where it is connected to the appropriate Equipment point and ends at the
customer premises Telephone.
Fig 1.1. Access network
The connectivity from exchange to customer premises is called “Access
Network or Local Loop”, and mostly comprises of underground cable from
exchange up to DP(Distribution Point) and insulated copper wires (Drop Wires).
Later on this type of Access Network does not require separate authentication of
customer before extending services. Whenever the cable capacity has reached the
maximum, additional cable is laid to augment the capacity. Even though there are
advantages in introducing wireless connectivity in Subscriber’s loop, there are
certain issues to tackle viz,
1. Duplexing methodology.
2. Multiple Access methods.
3. Cellular principle or reuse concept.
4. Techniques to cope with “mobile” environment
17
1.2 Duplexing Methodology:
Duplexing is the technique by which the send and receive paths are separated
over the medium, since transmission entities (modulator, amplifiers, demodulators)
are involved.
There are two types of duplexing:
• Frequency Division Duplexing (FDD)
•Time Division Duplexing (TDD)
1.2.1 Frequency Division Duplexing (FDD):
Different Frequencies are used to send and receive paths and hence there will
be a forward band and reverse band. Duplexer is needed if simultaneous
transmission (send) and reception (receive) methodology is adopted .Frequency
separation between forward band and reverse band is constant.
1.2.2 Time Division Duplexing (TDD):
TDD uses different time slots for transmission and reception paths. Single
radio frequency can be used in both the directions instead of two as in FDD. No
duplexer is required. Only a fast switching synthesizer, RF filter path and fast
antenna switch are needed. It increases the battery life of mobile phones.
GSM and CDMA systems use Frequency Division Duplexing and corDECT
uses Time Division Duplexing.
1.3 Multiple Access methodologies:
The technique of dynamically sharing the finite limited radio spectrum by
multiple users is called Multiple Access Technique. By adopting multiple access
techniques, all users cannot get the services simultaneously and some amount of
blocking is introduced by the system. This is known as GOS (Grade of Service).
Generally there are three different types of multiple access technologies. They are
• Frequency Division Multiple Access (FDMA)
• Time Division Multiple Access (TDMA)
• Code Division multiple Access (CDMA)
18
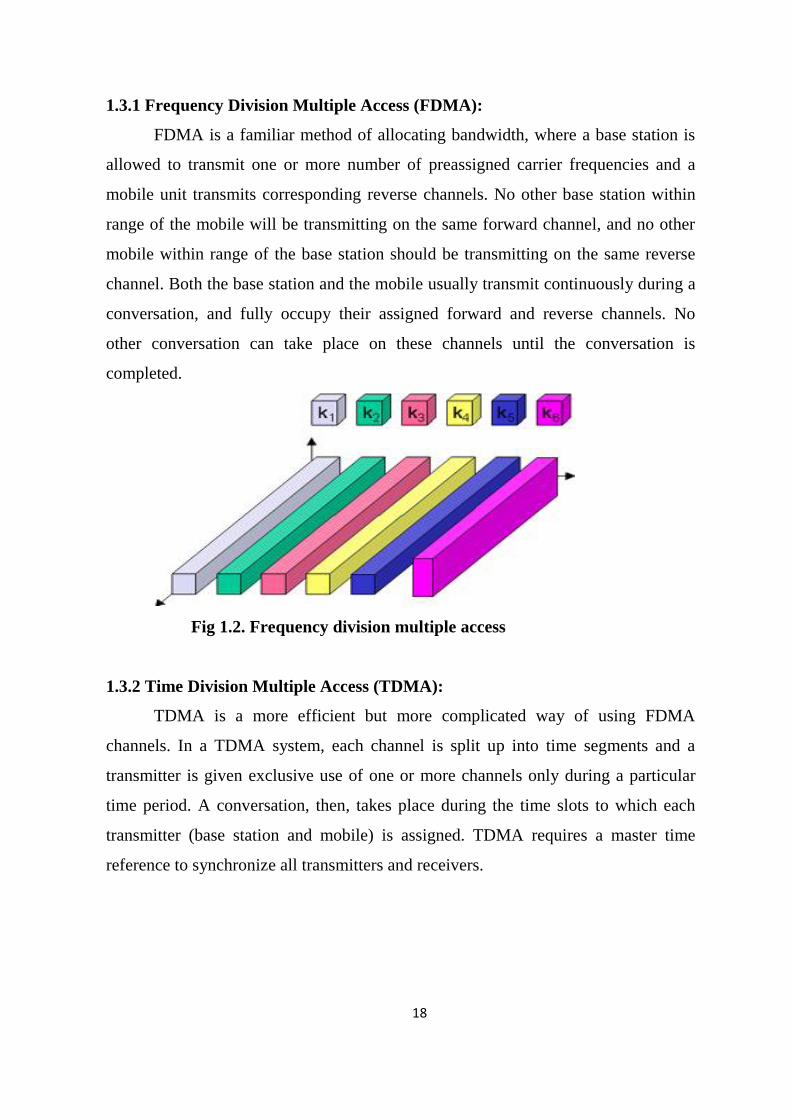
1.3.1 Frequency Division Multiple Access (FDMA):
FDMA is a familiar method of allocating bandwidth, where a base station is
allowed to transmit one or more number of preassigned carrier frequencies and a
mobile unit transmits corresponding reverse channels. No other base station within
range of the mobile will be transmitting on the same forward channel, and no other
mobile within range of the base station should be transmitting on the same reverse
channel. Both the base station and the mobile usually transmit continuously during a
conversation, and fully occupy their assigned forward and reverse channels. No
other conversation can take place on these channels until the conversation is
completed.
Fig 1.2. Frequency division multiple access
1.3.2 Time Division Multiple Access (TDMA):
TDMA is a more efficient but more complicated way of using FDMA
channels. In a TDMA system, each channel is split up into time segments and a
transmitter is given exclusive use of one or more channels only during a particular
time period. A conversation, then, takes place during the time slots to which each
transmitter (base station and mobile) is assigned. TDMA requires a master time
reference to synchronize all transmitters and receivers.

19
Fig 1.3. Time division multiple access
1.3.3 Code Division Multiple Access (CDMA):
CDMA is fundamentally different than TDMA and FDMA whereas FDMA
and TDMA transmit a strong signal in a narrow frequency band but CDMA
transmits a relatively weak signal across a wide frequency band. Using a technique
called direct sequence spread spectrum, the data to be transmitted are combined with
a pseudo-noise code (a pre-determined binary sequence that appears random) and
transmitted broadband. CDMA under Interim Standard 95(IS-95) uses a bandwidth
of 1.25MHz. The pseudo-noise code (PN code) is a series of binary "chips" that are
much shorter in duration than the data bits. Since the chips appear to be in a random
pattern and there are many chips per data bit (in IS-95 there are 128 chips for each
data bit), the modulated result appears to normal (FDMA) receivers as background
noise.
1.4 Geographical areas of the GSM network:
The Fig 1.4 presents the different areas that form a GSM network.
Fig 1.4. GSM network areas
20
A cell identified by its Cell Global Identity number (CGI) corresponds to the
radio coverage of a base transceiver station. A Location Area (LA) is identified by
its Location Area Identity (LAI) number which is a group of cells served by a single
Mobile Switching Centre/ Visitor Location Register (MSC/VLR). A group of
location areas under the control of the same MSC/VLR defines the MSC/VLR area.
A Public Land Mobile Network (PLMN) is the area served by one network operator.
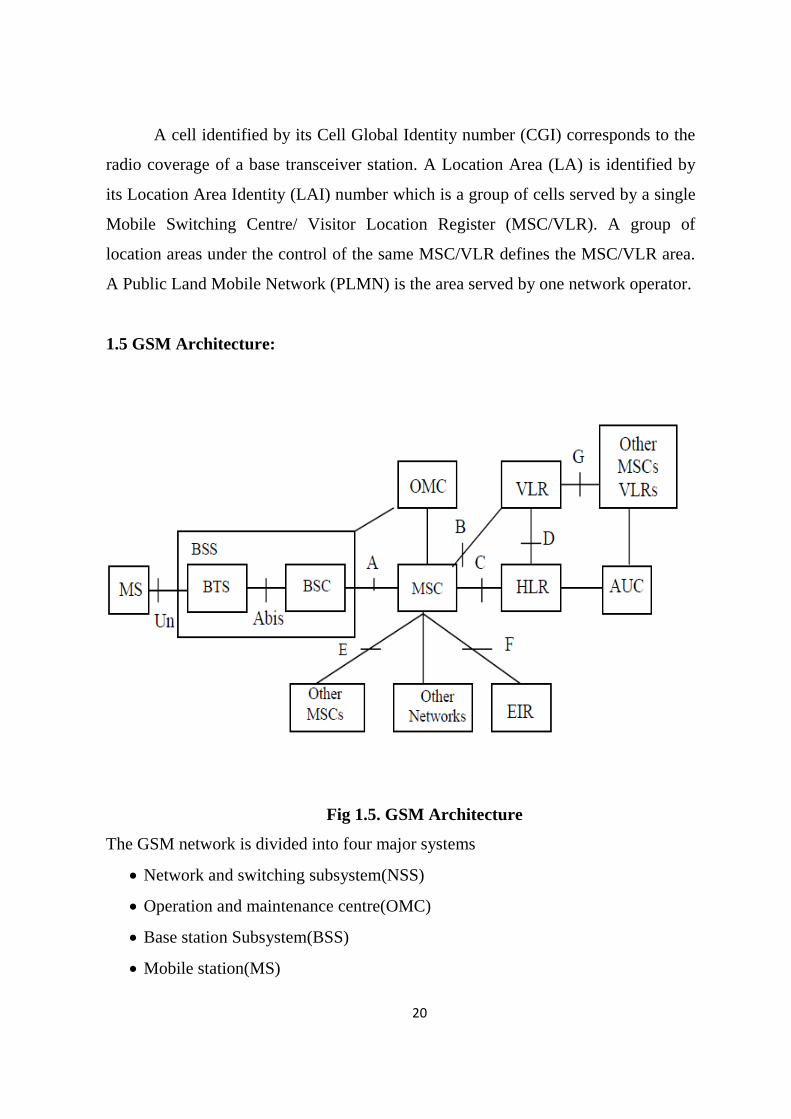
1.5 GSM Architecture:
Fig 1.5. GSM Architecture
The GSM network is divided into four major systems
Network and switching subsystem(NSS)
Operation and maintenance centre(OMC)
Base station Subsystem(BSS)
Mobile station(MS)
21
1.5.1 Network and switching subsystem (NSS):
The NSS is responsible for performing call processing and subscriber-related
functions. The switching system includes the following functional units:
Mobile Switching centre
Home location register
Visitor location register
Equipment identity register
Authentication centre
1.5.1.1 Mobile switching centre (MSC):
MSC performs all switching functions for all mobile stations located in the
geographic area controlled by its assigned BSS’s. Also it interfaces with
PSTN(Public Switched Telephone Network) with other MSC’s and other system
entities.
1.5.1.2 Home location registers (HLR):
The HLR is the main database of permanent subscriber information for a
mobile network. The HLR is an integral component of CDMA (code division
multiple access), TDMA (time division multiple access) and GSM (Global System
for Mobile communications) networks.
It contains
The identity of mobile subscriber called IMSI
ISDN(Integrated Services Digital Network) directory number of mobile
station
Subscription information on services
Service restrictions.
1.5.1.3Visitor location registers (VLR):
The VLR always integrated with the MSC. When a mobile station roams into a
new MSC area, the VLR gets connected to that MSC, which would request data
about the mobile station from the HLR. Later, if the mobile station makes a call, the
VLR will have the information needed for call setup without having to interrogate
the HLR.
22
1.5.1.4 Equipment identity registers (EIR):
Equipment identity register consists of identity of mobile station equipment
called IMEI( International Mobile Station Equipment Identity), which may be valid,
suspect and prohibited. The information is available in the form of three lists.
White list - the terminal which is allowed to connect to the network.
Black list - the terminal reported as stolen are not kept approved. They are not
allowed to connect to the network.
Grey list - The grey list consists of the IMEI numbers of the devices which are
outside of the white and black lists and of which electronic communication
connections are open.
1.5.1.5 Authentication Centre (AUC):
It is associated with the HLR. It stores an identity key called Ki for each
mobile subscriber. This key is used to generate the authentication triplets.
It is authenticated using a RAND(random number)
It consists of SRES(signed response)-to authenticate IMSI
Also, it has another key called Kc(Cipher key)- to cipher
communication over the radio path between the MS and the network.
1.5.2 Operation and Maintenance Centre (OMC):
The OMC function allows the operator to monitor and control the system as
well as to modify the conFiguration of the elements of the system. Not only the OSS
acts as a part of the OMC but also the BSS and NSS participate in its functions as it
is shown in the following examples:
• The components of the BSS and NSS provide the operator with all the
information it needs. This information is then passed to the OSS which is in charge
of analyzing it and control the network.
• The self-test tasks usually incorporated in the components of the BSS and
NSS, also contribute to the OAM functions.
• The BSC, which is in charge of controlling several BTS's is another
example of an OAM function performed outside the OSS.
23
1.5.3 Base Station Subsystem (BSS):
The BSS connects the Mobile Station and the NSS. It is in charge of the
transmission and reception. The BSS comprises of BTS (Base Transceiver Station)
and BSC (Base Station Controller).
The characteristics of the Base Station System (BSS) are:
• The BSS is responsible for communicating with mobile stations in cell
areas.
• One BSC controls one or more BTSs and can perform inter-BTS and intra-
BTS handovers
• The BTS serves one or more cells in the cellular network and contains one
or more TRXs (Transceivers or radio units).
• The TRX serves full duplex communications to the MS.
The BSS can be divided into two parts:
1.5.3.1 The Base Transceiver Station (BTS):
The BTS corresponds to the transceivers and antennas used in each cell of the
network. A BTS is usually placed in the centre of a cell. Its transmitting power
defines the size of a cell. Each BTS has up to sixteen transceivers depending on the
density of users in the cell.
1.5.3.2 The Base Station Controller (BSC):
The BSC controls a group of BTS and manages their radio resources. A BSC
is principally in charge of handovers, frequency hopping, exchange functions and
control of the radio frequency power levels of the BTSs.
The BSS takes the authentication of OMCR (Operation Maintenance Control for
Radio Network). It maintains the entire network elements. OMCR is a centralised
monitor system for BSC, BTS and TCU(Transceiver Coding Unit).
1.5.4 Mobile Station (MS):
A Mobile Station consists of two main elements:
1.5.4.1 The Terminal:
There are different types of terminals distinguished principally by their power
and application:
24
• The 'fixed' terminals are the ones installed in cars. Their maximum allowed
output power is 20 W.
• The GSM portable terminals can also be installed in vehicles. Their
maximum allowed output power is 8W.
• The handheld terminals have experienced the biggest success in weight and
volume, which are continuously decreasing. These terminals can emit up to 2 W.
The evolution of technologies allows decreasing the maximum allowed power to 0.8
W.
1.5.4.2 The SUBSCRIBER IDENTITY MODULE (SIM):
The SIM is a smart card that identifies the terminal. By inserting the SIM card
into the terminal, the user can have access to all the subscribed services. Without the
SIM card, the terminal is not operational. The SIM card is protected by a four-digit
Personal Identification Number (PIN). In order to identify the subscriber to the
system, the SIM card contains some parameters of the user such as its International
Mobile Subscriber Identity (IMSI).
Another advantage of the SIM card is the mobility of the users. In fact, the only
element that personalizes a terminal is the SIM card. Therefore, the user can have
access to its subscribed services in any terminal using its SIM card.
1.6 Control channels:
One or more logical channels can be transmitted on a physical channel. There
are different types of logical channels. The type of logical channel is determined by
the function of the information transmitted over it.
The following types of logical channels exist:
Traffic channels
Broadcast channels
Common control channels
Dedicated control channels
Note that the first channel type carries speech and data, and the other types control
information (signalling).
25
1.6.1 TRAFFIC CHANNELS (TCH):
The traffic channels are used to send speech or data services. There are two
types of traffic channels. They are distinguished by their transmission rates. The
following traffic channels are provided:
1.6.1.1 TCH/F (Traffic Channel Full rate):
The TCH/F carries information at a gross bit rate of 22.8 Kbit/s (after channel
coding). The net (or effective) bit rate at the TCH/F is for speech 13 Kbit/s and for
data 12, 6 or 3.6 Kbit/s (before channel coding). The transmission rates of the data
services allow services which are compatible to the existing, respectively, 9.6, 4.8
and 2.4 Kbit/s PSTN and ISDN services.
1.6.1.2 TCH/H (Traffic Channel Half rate):
The TCH/H carries information at a gross bit rate of 11.4 Kbit/s. The net bit
rate at the TCH/H is for speech 5.6 Kbit/s and for data 6 or 3.6 Kbit/s.
1.6.1.3 TCH/EFR (Enhanced Full rate):
The EFR provides a voice coding algorithm offering improved speech quality.
The algorithm is fully compatible with a BSM(Base Station Manager) speech
quality. The algorithm is fully compatible with a GSM 13 Kbit/s speech channel.
The main benefit will be improved voice quality which offers prospects to compete
with PSTN networks. A TCH/F or a TCH/H may also be used to send signalling
information (for example call forwarding and short messages).
1.6.2 BROADCAST CHANNELS
The information distributed over the broadcast channels helps the mobile
stations to orient themselves in the mobile radio network.
The broadcast channels are point-to-multipoint channels which are only defined for
the downlink direction (BTS to the mobile station). They are four types:
26
1.6.2.1 BCCH (Broadcast Control Channel):
The BCCH gives information about the system configuration parameters (for
example Local Area Identification, Cell Identity and Neighbour Cells) the mobile
station. Using this information the mobile stations can choose the best cell to attach
to. The BCCH is also known as beacon.
1.6.2.2 FCCH (Frequency Correction Channel):
To communicate with the BTS, the mobile station must tune to the BTS. The
FCCH transmits a constant frequency shift of the radio frequency carrier that can be
used by the mobile station for frequency correction.
1.6.2.3 SCH (Synchronization Channel):
The SCH is used to time synchronize the mobile stations. The data on this
channel carries the TDMA frame number and the BSIC (Base Station Identity
Code).
1.6.2.4 CBCH (Cell Broadcast Channel):
The CBCH is used for the transmission of generally accessible information
(Short Message Service messages) in a cell, which can be polled by the mobile
station.
1.6.3 COMMON CONTROL CHANNELS
Common control channels are specified as point-to-multipoint channels which
only operate in one direction of transmission, either in the uplink or downlink
direction. There are three types:-
1.6.3.1 PCH (Paging Channel):
The PCH is used in the downlink direction for paging the mobile stations.
27
1.6.3.2 AGCH (Access Grant Channel):
The AGCH is also used in the downlink direction. A logical channel for a
connection is allocated via the AGCH if the mobile station has requested such a
channel via the RACH.
1.6.3.3 RACH (Random Access Channel):
The RACH is used in the uplink direction by the mobile stations for
requesting a channel for a connection. It is an access channel that uses the slotted
Aloha access scheme.
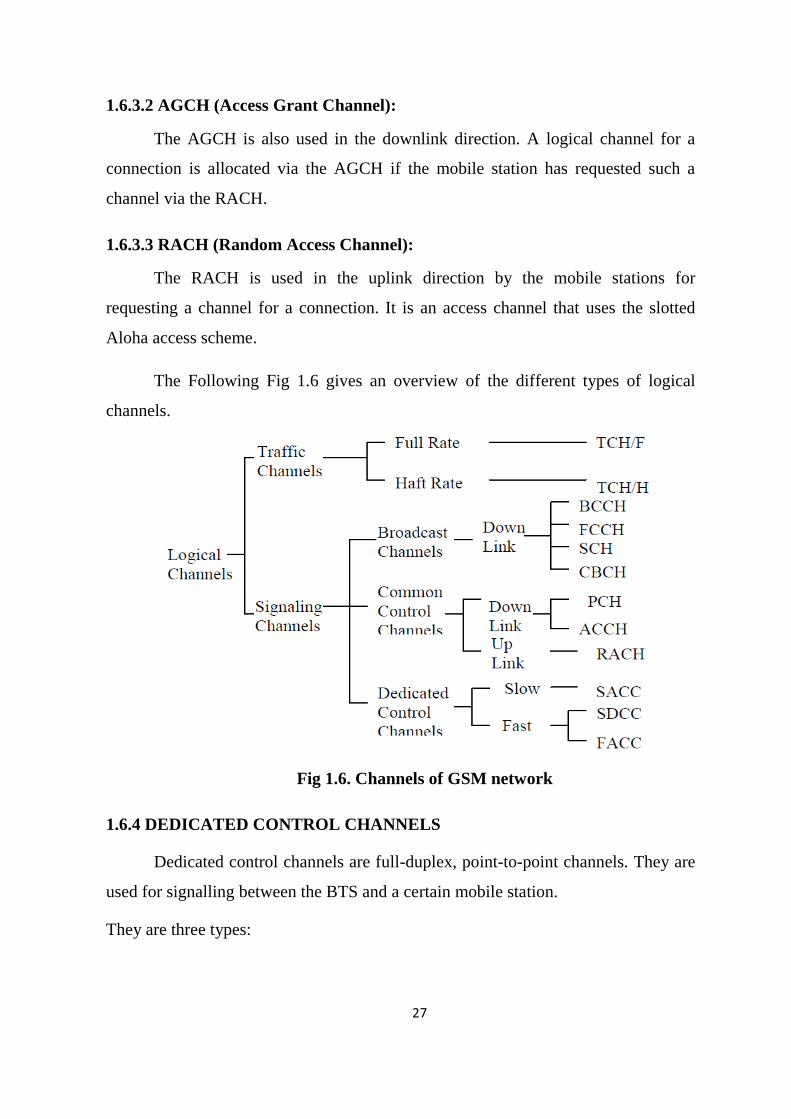
The Following Fig 1.6 gives an overview of the different types of logical
channels.
Fig 1.6. Channels of GSM network
1.6.4 DEDICATED CONTROL CHANNELS
Dedicated control channels are full-duplex, point-to-point channels. They are
used for signalling between the BTS and a certain mobile station.
They are three types:
28
1.6.4.1 SACCH (Slow Associated Control Channel):
The SACCH is a duplex channel which is always allocated to a TCH or
SDCCH. The SACCH is used for transmission of signalling data, radio link
supervision measurements, transmit power control and timing advance data. Note
that the SACCH is only used for non-urgent procedures.
1.6.4.2 FACCH (Fast Associated Control Channel):
The FACCH is used as a main signalling link for the transmission of
signalling data (for example handover commands). It is also required for every call
set-up and release. During the call, the FACCH data is transmitted over the allocated
TCH instead of traffic data; this is marked by a flag called a stealing flag. The
process of stealing a TCH for FACCH data is called pre-emption.
1.6.4.3 SDCCH (Stand-alone Dedicated Control Channel):
The SDCCH is a duplex, point-to-point channel which is used for signalling
in higher layers. It carries all signalling between the BTS and the mobile station
when no TCH is allocated. The SDCCHs are used for service requests (for example
Short Message Service), location updates, subscriber authentication, ciphering
initiation, equipment validation and assignment to a TCH. The net SDCCH bit rate is
about 0.8 Kbit/s.
1.7 Telecom Signalling Mechanism:
Before initiation of a call, signalling is the first process in telecom network. In
wired network, signalling is the mechanism for end to end process. Signalling
System7 (SS7) is architecture for performing out-of-band signalling in support of the
call-establishment, billing, routing, and information-exchange functions of the public
switched telephone network (PSTN). It identifies functions to be performed by a
signalling-system network and a protocol to enable their performance. There are two
types of signalling mechanism such as Common Channel Signalling(CCS) and
Common Associate Signalling(CAS).
29
At present, CCS7 signalling is the leading signalling mechanism because traffic
handling capacity is high since separate bandwidth is given for each process hence
timeslot is not wasted.
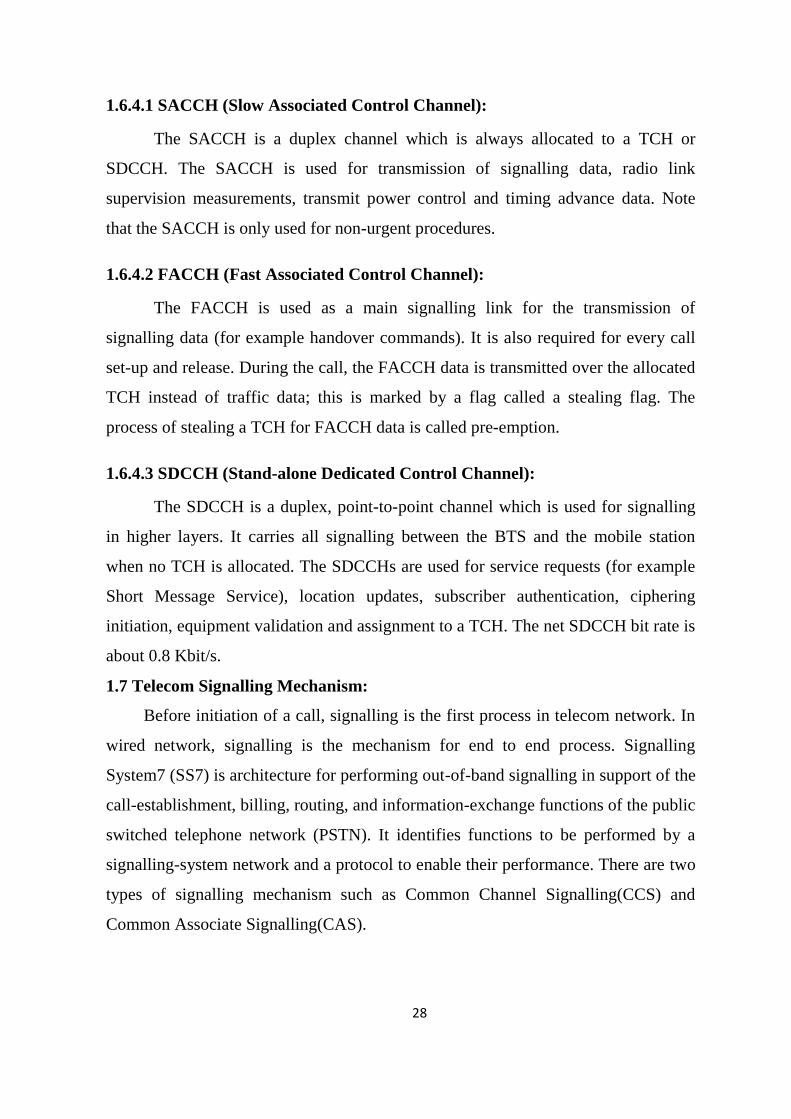
As users of the PSTN, signalling is exchanged with network elements all the
time. Examples of signalling between a telephone user and the telephone network
include: dialling digits, providing dial tone, accessing a voice mailbox, sending a
call-waiting tone, dialling *66 (to retry a busy number), etc. SS7 is a means by
which elements of the telephone network exchange information. Information is
conveyed in the form of messages.
Fig 1.7 CCS7 signalling network architecture
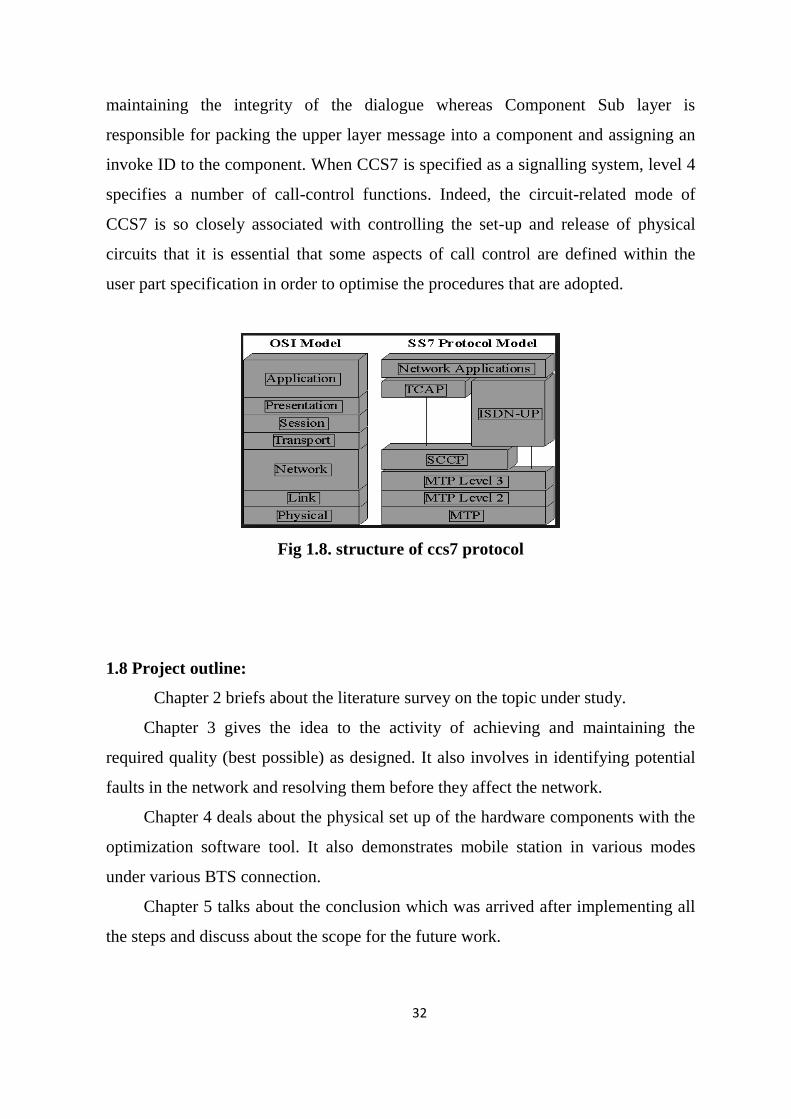
The architecture of CCS7 protocol is based on the OSI layer whereas Level-1.
Any node with the capability of handling CCS7 is termed a Signalling Point. The
direct interconnection of two signalling points with CCS7 uses one or more
signalling links. Level 1 of the 4-level structure defines the physical, electrical and
functional characteristics of the signalling link. Defining such characteristics within
level 1 means that the rest of the signalling system (level 2 to 4) can be independent
of the adopted transmission medium. Any changes within level1 do not affect the
higher levels and also the interface between levels 1 and 2 is kept constant. In a
30
digital environment, usually the physical link is a 64 Kbps channel. This is typically
within a digital transmission system using pulse-code modulation (PCM). Other
types of link (including analogue) can be used without affecting levels 2 to 4.
Level 2 defines the functions that are relevant to an individual signalling link,
including error control and link monitoring. Thus, level 2 is responsible for the
reliable transfer of signalling information between two directly connected signalling
points. If errors occur during transmission of the signalling information, it is
responsibility of level 2 to invoke procedures to correct the errors. Such
characteristics can be optimised without affecting the rest of the signalling system,
provided that the interfaces to levels 1 and 3 remain constant.
The functions those are common to more than one signalling link, i.e.
signalling network functions and „signalling network management‟ functions.
When a message is transferred between two exchanges, there are usually
several route that the message is transferred between two exchanges, there are
usually several routes that the message can take including via a signal-transfer point.
The message-handling functions are responsible for routing of the messages Through
the signalling network to correct exchange. Signalling network management
functions control the configuration of the signalling network. These functions
include network reconfigurations in response to status change in the network. For
example, if an exchange within the signalling network fails, the level 3 of CCS7 can
re-route messages and avoid the exchange that has failed.
Message Transfer Point (MTP) Levels 1 to 3 constitute a transfer that is
responsible for transferring information in messages from one signalling point to
another. The combination of level 1 to 3 is known as the message transfer point
(MTP). The MTP controls a number of signalling message links and network
management functions to ensure correct delivery to appropriate exchange in an
uncorrupted form and in the sequence that they were sent, even under failure
conditions in the network.
31
Level 4 comprises the „user parts‟. The meaning of the messages transferred
by the MTP and the sequence of actions for a particular application is defined by the
„user parts‟. A key feature is that many different user parts may use the standardised
MTP. Hence, if new requirements arise, that had not been foreseen previously, the
relevant user part can be enhanced without modifying the transfer mechanism or
affecting other user parts. Three user parts have been defined, the Telephone User
Part (TUP), the ISDN User Part (ISUP) and the Data User Part (DUP). Along with
SCCP, this provides the Network Layer functionalities of the OSI model. The user
parts of NSP are Operations and Maintenance Application Part (OMAP) and Mobile
Application Part (MAP). Signalling connection control Part (SCCP) The Signalling
Connection Control Part (SCCP) has the functions of the network as well as the
transport layers of the CCS7 protocol stack. Together with the MTP, it provides true
OSI transport layer capabilities. Unlike MTP which provides only datagram service,
SCCP provides connection –oriented and connection-less service as well. Thus,
while MTP is sufficient for circuit switched applications like TUP and ISUP, for
non-circuit related applications, such as database querying, the enhanced addressing
capability of SCCP is required. SCCP has a unique scheme of addressing and
routing based on Global Titles. SCCP utilizes the service OF MTP to route its
payload from one node to other. In addition to routing transaction related messages
submitted by the Transaction Capabilities Application Part (TCAP), SCCP also
segments and sequences large TCAP messages to fit into the MTP packet size. At
the distant node it is the responsibility of the peer SCCP to re-assemble the
segmented message.
Transaction Capabilities Application Part (TCAP) TCAP is an application part in the
CCS7 stack and is responsible for establishing dialogue with remote databases. It
carries the data of higher layers like INAP and MAP and invokes remote operations.
An operation at remote end requires a series of queries and responses as part of
a TCAP dialogue. TCAP layer is a compound layer in the sense that it is composed
of two sub-layers, namely, Transaction Sub layer (TSL) and Component Sub layer
(CSL). Transaction Sub layer is responsible for establishing, managing and
32
maintaining the integrity of the dialogue whereas Component Sub layer is
responsible for packing the upper layer message into a component and assigning an
invoke ID to the component. When CCS7 is specified as a signalling system, level 4
specifies a number of call-control functions. Indeed, the circuit-related mode of
CCS7 is so closely associated with controlling the set-up and release of physical
circuits that it is essential that some aspects of call control are defined within the
user part specification in order to optimise the procedures that are adopted.
Fig 1.8. structure of ccs7 protocol
1.8 Project outline:
Chapter 2 briefs about the literature survey on the topic under study.
Chapter 3 gives the idea to the activity of achieving and maintaining the
required quality (best possible) as designed. It also involves in identifying potential
faults in the network and resolving them before they affect the network.
Chapter 4 deals about the physical set up of the hardware components with the
optimization software tool. It also demonstrates mobile station in various modes
under various BTS connection.
Chapter 5 talks about the conclusion which was arrived after implementing all
the steps and discuss about the scope for the future work.
33
CHAPTER-2
LITERATURE SURVEY
The literature survey is done based on reduction of call drops, performance of
existing handovers, concept of MIMO antennas and call block theory, optimization
issues, network quality and coverage of the GSM network. Based on the survey, this
project proposes the method of RF planning and optimization.
1. Effective frequency planning to achieve improved KPI's, TCH and
SDCCH drops for a real GSM cellular network.
The objective of this paper is to provide a quality
communication to maximum the number of users. To establish
the quality communication, they have been investigated KPI (key performance
indicators), TCH (traffic channel) and SDCCH (stand alone dedicated control
channel) drop on 93 GSM sites for a cellular operator in a city of India. This paper
found a significant improvement in KPI's, TCH drop and SDCCH drop which
performs the previous frequency plan. TCH drop in NBH period is improved by 15
%, SDCCH drop in NBH (national busy hour) period is improved by 6 %. In this
paper, during BBH (bouncing busy hour) period as per TRAI (telecom regulatory
authority of India) guideline TCH drop ≤ 2 % is improved by 47 % and SDCCH
drop ≤ 2 % is improved by 43 % with respect to previous frequency plan has been
observed. It is relevant with customer satisfaction and enhances revenue for the
cellular operator.
2. Improving Call Setup Success Rate in GSM service area using RF
optimisation.
All GSM operators use Key Performance Indicators (KPIs) to judge
their network performance and evaluate the Quality of Service (QoS) regarding end
user perceived quality. KPIs are becoming increasingly important in the context
of network rollouts as well as within mature network optimization cycles. The
performance of the mobile network is measured based on several counters describing
34
the most important events over a measurement period. The KPIs are derived with the
help of these counters using different formulations. Call Setup Success Rate (CSSR)
is one of the most important KPIs used by all mobile operators.
3. A design approach to maximize handover performance success rate and
enhancement of voice quality samples for a GSM cellular network.
In this paper, a new approach has been designed to maximize handover
success rate (HOSR) and voice quality for a GSM cellular network.
To improve handover, neighbour list verification is done and unnecessary
neighbours are deleted. The results are found as overall HOSR (handover success
rate) in NBH (national busy hour) is improved by 11 % and during BBH (bouncing
busy hour) HOSR ≥ 95 %improved by 12 % in comparison of previous frequency
plan. Additionally, voice quality samples in DL (downlink) and UL (uplink) are
also improved. In NBH period DL RX (receiver) quality samples(0-
5) improved by 8% and UL RX quality samples (0-5) improved by 2% over previous
quality samples.
4. Reducing Call Drop in Mobile Cellular Communication by using MIMO
Antenna.
In this manuscript, call drops are reduced in mobile cellular communication
by using MIMO (multiple input and multiple output) antennas. The multiple reasons
behind the call drop is handover failure call drops, LAPD (Link Access Protocol on
D-channel) call drops and the radio frequency call drops. A novel approach to
solving these problems of call drops has been discussed by using MIMO antenna.
5. Impact of mobility on call block, call drops and optimal cell size in small
cell networks.
Assuming Poisson call arrivals at random positions with random velocities,
they have discussed about the characterization of handovers at the boundaries. In this
paper, the explicit expressions for call block and call drop probabilities using tools
from spatial queuing theory have been derived. These expressions are used to derive
35
optimal cell sizes for various profiles of velocities in small cell networks via some
numerical examples.
6. RF optimization issues in GSM networks.
The paper describes simple procedure for cellular network performance
estimation. In this paper, it has been analytically proved that optimization of an
existing cellular network using different methodologies and fine parameter tuning to
offer remarkable QoS to the end users can be performed. Optimization teams use
QoS reports in order to detect bad service quality areas. GSM network RF
performance evaluation is based on some major KPIs such as Call set up success
rate (CSSR), Handover Success Rate (HSR), Call Drop Rate (CDR) ASCOM tool.
7. Radio Frequency Optimization & QoS Evaluation in Operational GSM
Network.
This paper describes simple procedure for cellular network performance
estimation. Also, it has been analytically proved that we can optimize an existing
cellular network using different methodologies and fine parameter tuning to offer
remarkable QoS to the end users. The QoS reports based on different key parameters
such as Call set up success rate (CSSR), Call Drop Rate(CDR), Handover Success
Rate (HSR) and Traffic channel(TCH) congestion rate are duly beneficial for
Management team to compare network performance with the competitor’s one
called as benchmarking and to plan network evolution and strategy.
8. Cost Effective Coverage and Capacity Optimization in Wireless Cellular
Networks.
This paper presented a cost effective coverage and capacity optimization
method for connection oriented wireless cellular networks. The method allows
traffic overflows into neighbour networks when coverage and capacity limitations
arise within the home network. Extra RF spectrum licensure and deployment of new
network nodes are avoided by utilizing available resources at neighbour networks,
hence reducing both capital expenditure (CAPEX) and operational expenses
36
(OPEX). Performance evaluation of the model using MATLAB simulations reveals
significant improvement to the QoS offered to subscribers. Most techniques used for
coverage and capacity optimization results in the increase of network complexity,
radio frequency interferences.
9. A quantitative study of authentication and QoS in wireless IP networks.
In this paper, the impact of authentication on security and quality of service
(QOS) in combination of mobility and traffic patterns, which are critical to deliver
secure and efficient services in wireless IP networks are investigated. The system
performance with respect to authentication delay and call dropping probability at
different security levels based on a system model and challenging response
authentication mechanism are analyzed. Therefore, this work provides an in-depth
understanding of the authentication impact and reveals a framework for future
design of efficient authentication schemes. By taking traffic and mobility patterns
into account, a direct and quantitative relationship between the security and QoS
through the authentication can be established.
37
CHAPTER 3
RF OPTIMIZATION
3.1Introduction:
As voice and data networks continue to grow and expand worldwide, the
need for network deployment and test tools grows accordingly. Wireless service
providers need to attract new customers and retain existing customers while
maintaining the highest quality of service throughout their networks. Network
equipment manufacturers need to gain rapid acceptance of their infrastructure, which
requires fast and accurate optimization of the network. Optimization of the
network, expanding service coverage, and introducing new technologies and data
services are critical to the retention and acquisition of customers.
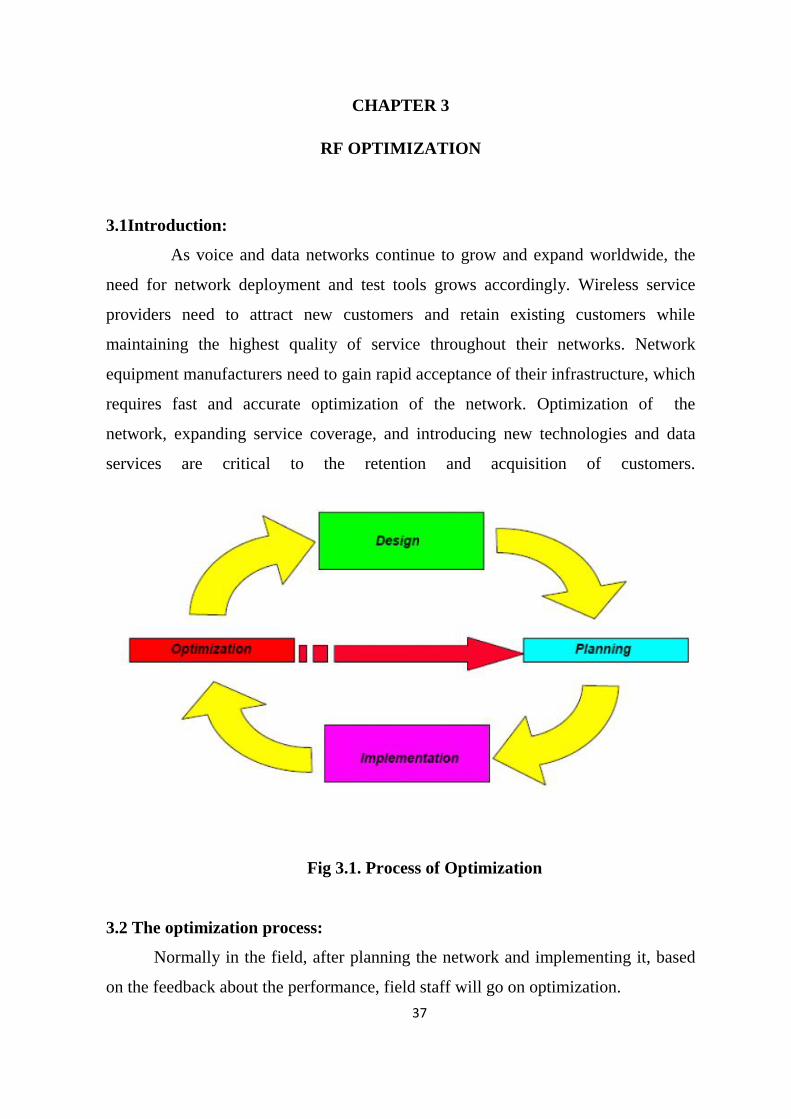
Fig 3.1. Process of Optimization
3.2 The optimization process:
Normally in the field, after planning the network and implementing it, based
on the feedback about the performance, field staff will go on optimization.
38
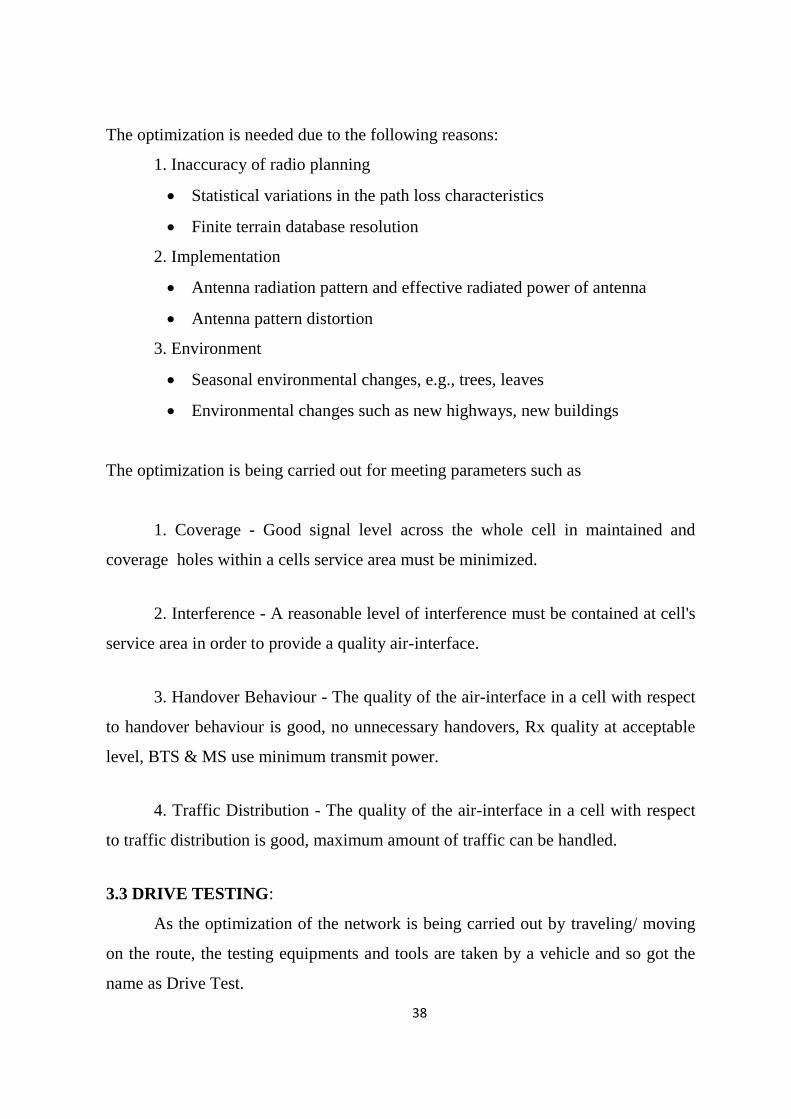
The optimization is needed due to the following reasons:
1. Inaccuracy of radio planning
Statistical variations in the path loss characteristics
Finite terrain database resolution
2. Implementation
Antenna radiation pattern and effective radiated power of antenna
Antenna pattern distortion
3. Environment
Seasonal environmental changes, e.g., trees, leaves
Environmental changes such as new highways, new buildings
The optimization is being carried out for meeting parameters such as
1. Coverage - Good signal level across the whole cell in maintained and
coverage holes within a cells service area must be minimized.
2. Interference - A reasonable level of interference must be contained at cell's
service area in order to provide a quality air-interface.
3. Handover Behaviour - The quality of the air-interface in a cell with respect
to handover behaviour is good, no unnecessary handovers, Rx quality at acceptable
level, BTS & MS use minimum transmit power.
4. Traffic Distribution - The quality of the air-interface in a cell with respect
to traffic distribution is good, maximum amount of traffic can be handled.
3.3 DRIVE TESTING:
As the optimization of the network is being carried out by traveling/ moving
on the route, the testing equipments and tools are taken by a vehicle and so got the
name as Drive Test.
39
For Optimization purpose, the drive tests are carried out on different
occasions.
Initial network coverage verification and benchmarking
Verification before and after changes
Locating and measuring interference
Locating areas where traffic problems exist
Locate coverage holes
Preventive maintenance
Simultaneous measurements of the other networks
Before taking drive test the entire geographical coverage area is divided into three
groups as Primary, Secondary and Miscellaneous routes as follows.
Primary route(Major Road level)
Includes all major roads, highways and wide thoroughfares
Secondary route(street level)
Includes all streets, subdivisions and compounds when accessible
Miscellaneous routes (in-building and special locations)
Includes golf courses, beach resorts, shopping malls, department stores, convention
centres, hotels and resorts.
And depending upon the different environment (areas), there may be
complaint on poor quality, call disconnection etc. for which we have to go for the
analysis of data. And the following Data Collection is possible in the drive tests
which are essential for network development
40
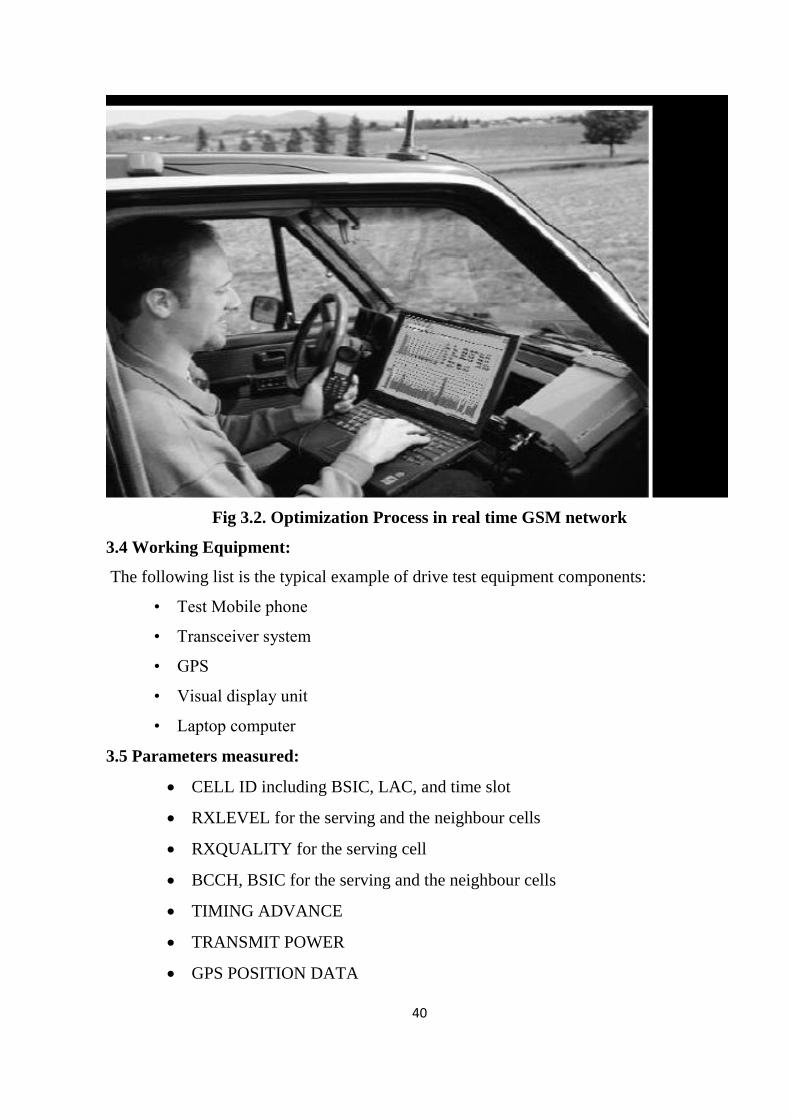
Fig 3.2. Optimization Process in real time GSM network
3.4 Working Equipment:
The following list is the typical example of drive test equipment components:
• Test Mobile phone
• Transceiver system
• GPS
• Visual display unit
• Laptop computer
3.5 Parameters measured:
CELL ID including BSIC, LAC, and time slot
RXLEVEL for the serving and the neighbour cells
RXQUALITY for the serving cell
BCCH, BSIC for the serving and the neighbour cells
TIMING ADVANCE
TRANSMIT POWER
GPS POSITION DATA
41
3.6 Frequently observed issues:
The frequently encountered performance problems during drive tests are:
1. Cell Dragging
2. Dropped Calls
3. Ping-Ponging
4. System Busy
5. Handover boundary
6. Blocked Calls
3.6.1 Cell Dragging:
Calls may drag a cell beyond the desired handover boundary. This might result
dropped calls or bad Rx quality.
Suggestions:
• Create an appropriate neighbour cell list
• Change HO parameters such as thresholds, margin, cell baring, etc
• Check serving cell’s cell identifier in the neighbour cell’s neighbour list
• Check neighbour cell’s BCCH, BSIC, LAC, Cell ID, etc
3.6.2 Dropped Calls
Dropped calls are caused by either RF environments or incorrect system
parameters
Suggestions:
• Check if an appropriate neighbour cell list is defined
• Check HO parameters
• Existing or new coverage holes
• Interference, Co-channels, Adjacent channels or External interference
• Serving cells might go down, coverage smaller as before
• Abnormalities such as call setup failure
3.6.3 Ping Ponging
The Server keeps changing and occurs as a result of bad audio quality
Suggestions:
• Interference, Co-channels, Adjacent channels or External interference
42
• Lack of dominant server
• Poor coverage
• Not optimal antenna configuration
3.6.4 System Busy:
The subscriber gets System busy on several call attempts and site appears
consistently on the traffic.
Suggestions:
Short Term:
• Reduce the traffic on the congested cell/site. However, the proposed
changes must not create any unacceptable problems such as coverage holes, dropped
calls, etc short term solutions are re-design the antenna configuration, add additional
RTs, change BTS configuration
Long Term:
• Build a new cell site to off-load traffic
3.6.5 Handover Boundary:
Handovers do not occur at the desired HO boundary, the result is an
imbalance in traffic distribution across the system
Suggestions:
• Check if an appropriate neighbour cell list is defined
• Check HO parameters
• Inappropriate antenna configurations of the serving and neighbour cells
• Interference, Co-channels, Adjacent channels or External interference
• No TCH available (neighbour cells congestion)
3.6.6 Blocked Calls:
The call gets disconnected without the availability of the channels for call
process.
Suggestions:
Solve internal interference through checking frequency planning
43
After internal interference is excluded, the external interference with spectrum
analyzer should be located.
3.7 Solutions proposed:
AGILENT TEST DRIVE TOOL provides you the full suite of key
performance indicators spanning radio and handset environment
With these KPI’s and smart reporting, you can quickly identify anomalies and
then drill down to pinpoint the root cause.
It will reduce the time required to solve issues leading to greater productivity.
3.8 Summary
This chapter explained about the significance of the drive test and challenges in
the drive test. This test analyses the potential problems existing in the system and
provides solutions to them before they affect the network performance.
44
CHAPTER-4
AGILENT DRIVE TEST TOOL CONFIGURATION
4.1 Introduction:
Agilent technologies have introduced the industry’s first integrated test
solution that in a single protocol analysis tool, seamlessly combines mobile device
data captured from a RF interface and from a mobile terrestrial network. Rapid
growth in the number of subscribers and in-data network usage has challenged the
radio access network in both RF capacity and data throughput performance
measurements and without visibility to the air interface, network operators must
manually correlate data from independent drive test and protocol analysis tools.
Agilent’s E6474A drive test tool has revolutionized and simplified end to end
troubleshooting. The software allows users to correlate signalling procedures from
the air interface and radio access network interfaces in a single view to detect and
troubleshoot problems from the mobile phone to the network.
With the help of RF AGILENT test drive tool (ATDT) the intelligent data is
plotted in visual maps. With this we can easily see where the capacity parameters
exist in your radio access network by ATDT. This helps to plan the capital
expenditures to address areas that will give a best return on the investment done.
Features:
Cost effective
Extensive phone support
Comprehensive technology support
Easy, flexible alarms
Network performance improves as the maintenance cost go down
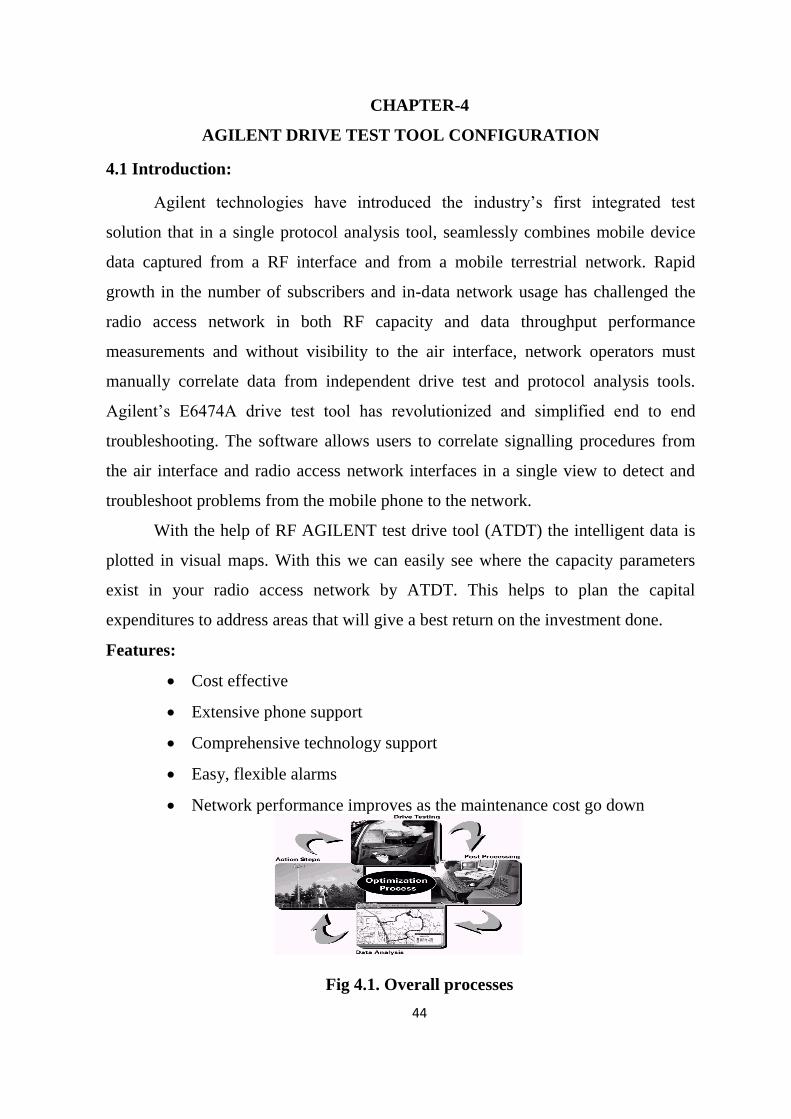
Fig 4.1. Overall processes
45
4.2 PARAMETERS TO MEASURE:
Rx level [Received signal level]
Rx Qual[Received signal quality]
SQI [Speech Quality Index]
Other factors
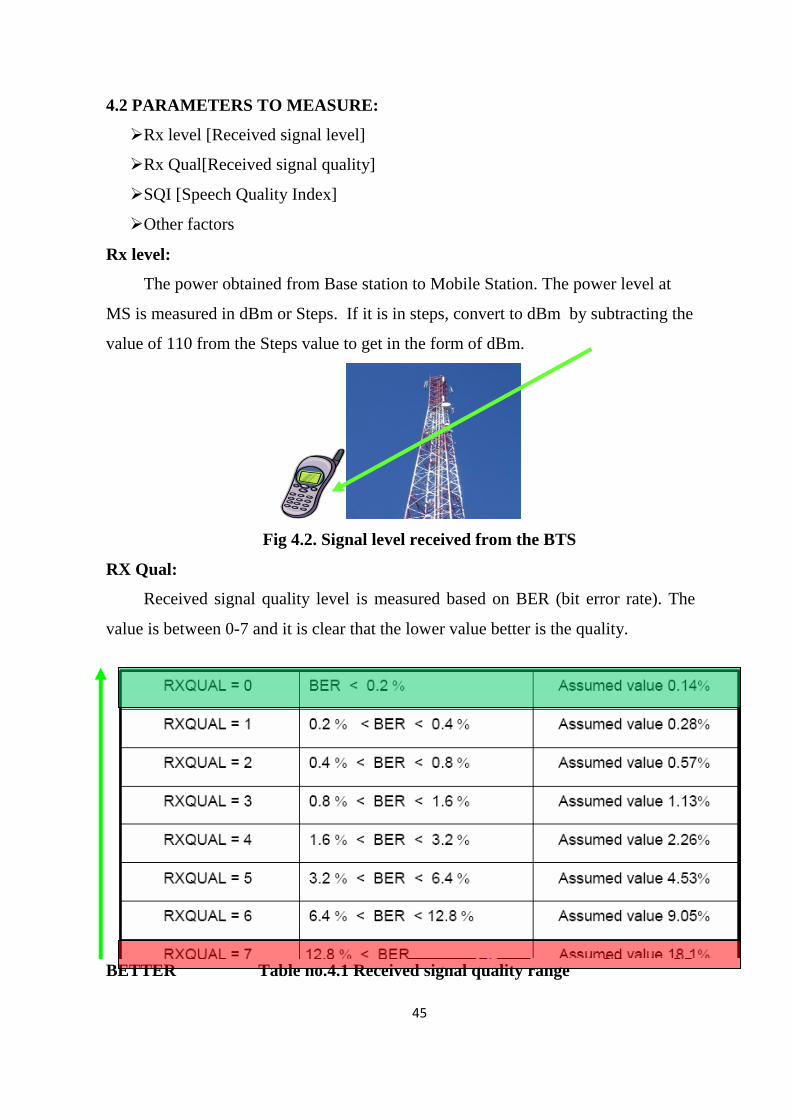
Rx level:
The power obtained from Base station to Mobile Station. The power level at
MS is measured in dBm or Steps. If it is in steps, convert to dBm by subtracting the
value of 110 from the Steps value to get in the form of dBm.
Fig 4.2. Signal level received from the BTS
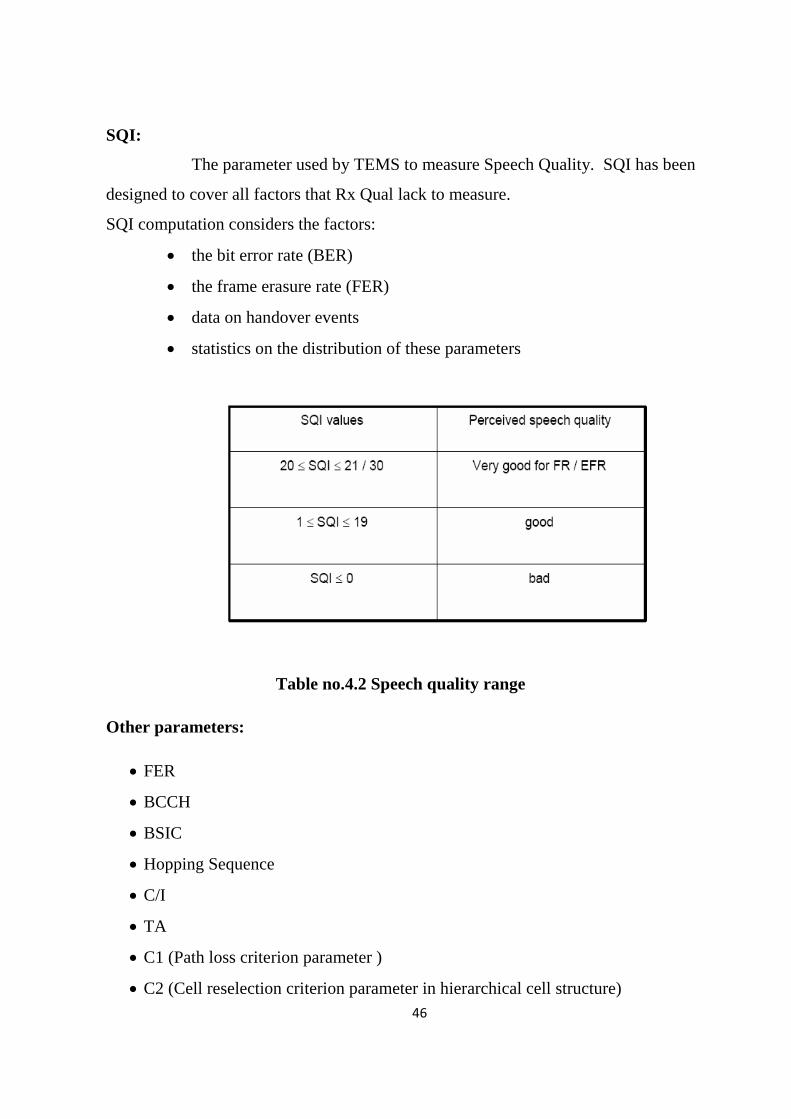
RX Qual:
Received signal quality level is measured based on BER (bit error rate). The
value is between 0-7 and it is clear that the lower value better is the quality.
BETTER Table no.4.1 Received signal quality range
46
SQI:
The parameter used by TEMS to measure Speech Quality. SQI has been
designed to cover all factors that Rx Qual lack to measure.
SQI computation considers the factors:
the bit error rate (BER)
the frame erasure rate (FER)
data on handover events
statistics on the distribution of these parameters
Table no.4.2 Speech quality range
Other parameters:
FER
BCCH
BSIC
Hopping Sequence
C/I
TA
C1 (Path loss criterion parameter )
C2 (Cell reselection criterion parameter in hierarchical cell structure)
47
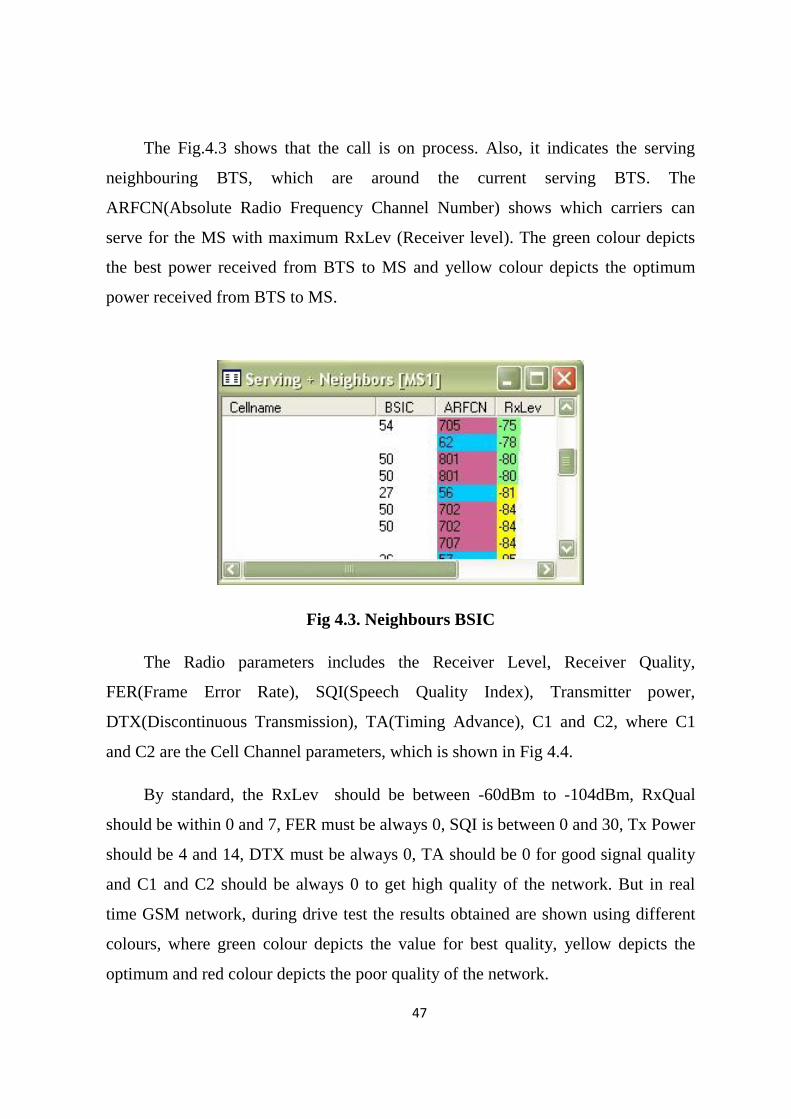
The Fig.4.3 shows that the call is on process. Also, it indicates the serving
neighbouring BTS, which are around the current serving BTS. The
ARFCN(Absolute Radio Frequency Channel Number) shows which carriers can
serve for the MS with maximum RxLev (Receiver level). The green colour depicts
the best power received from BTS to MS and yellow colour depicts the optimum
power received from BTS to MS.
Fig 4.3. Neighbours BSIC
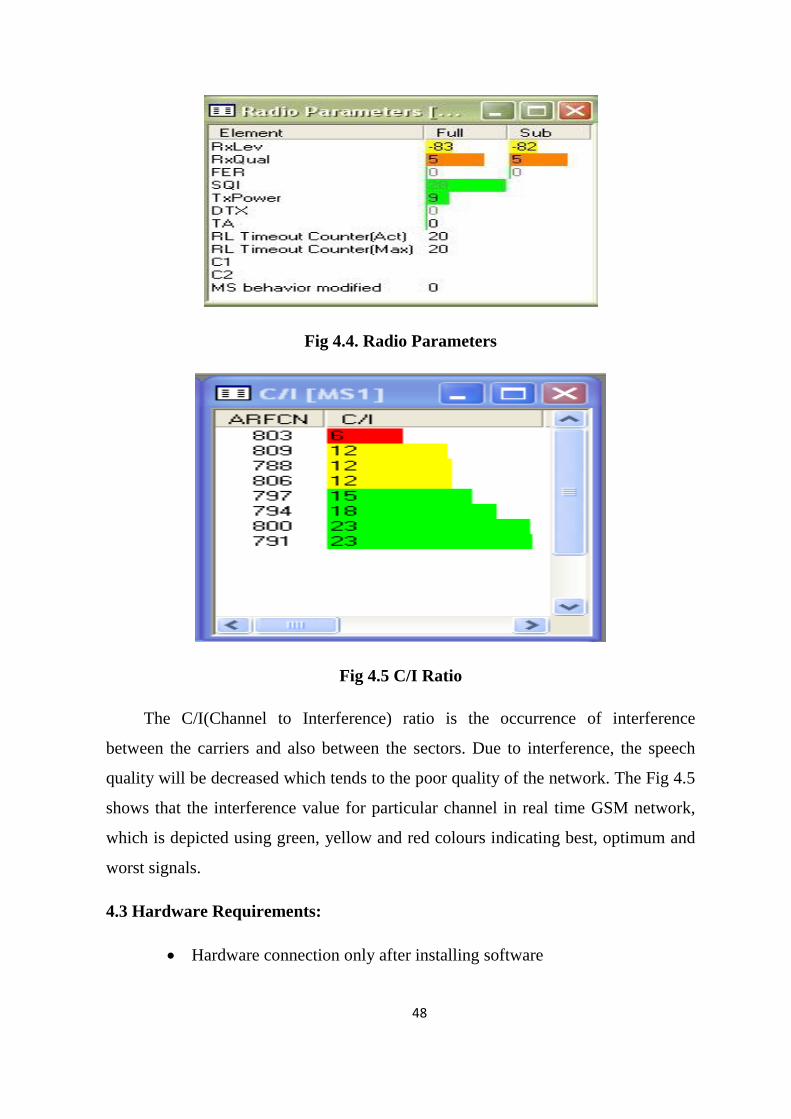
The Radio parameters includes the Receiver Level, Receiver Quality,
FER(Frame Error Rate), SQI(Speech Quality Index), Transmitter power,
DTX(Discontinuous Transmission), TA(Timing Advance), C1 and C2, where C1
and C2 are the Cell Channel parameters, which is shown in Fig 4.4.
By standard, the RxLev should be between -60dBm to -104dBm, RxQual
should be within 0 and 7, FER must be always 0, SQI is between 0 and 30, Tx Power
should be 4 and 14, DTX must be always 0, TA should be 0 for good signal quality
and C1 and C2 should be always 0 to get high quality of the network. But in real
time GSM network, during drive test the results obtained are shown using different
colours, where green colour depicts the value for best quality, yellow depicts the
optimum and red colour depicts the poor quality of the network.
48
Fig 4.4. Radio Parameters
Fig 4.5 C/I Ratio
The C/I(Channel to Interference) ratio is the occurrence of interference
between the carriers and also between the sectors. Due to interference, the speech
quality will be decreased which tends to the poor quality of the network. The Fig 4.5
shows that the interference value for particular channel in real time GSM network,
which is depicted using green, yellow and red colours indicating best, optimum and
worst signals.
4.3 Hardware Requirements:
Hardware connection only after installing software
49
High speed direct connect Hub expands the serial communication
capabilities of computer
The computer and hub communicate via USB (Universal Serial Bus)
and the hub converts USB to serial ports (maxi. 6) for connecting
phones(2), digital Receivers(2) , GPS Receiver and also for providing
power to all devices, phone battery charging, phone audio monitoring.
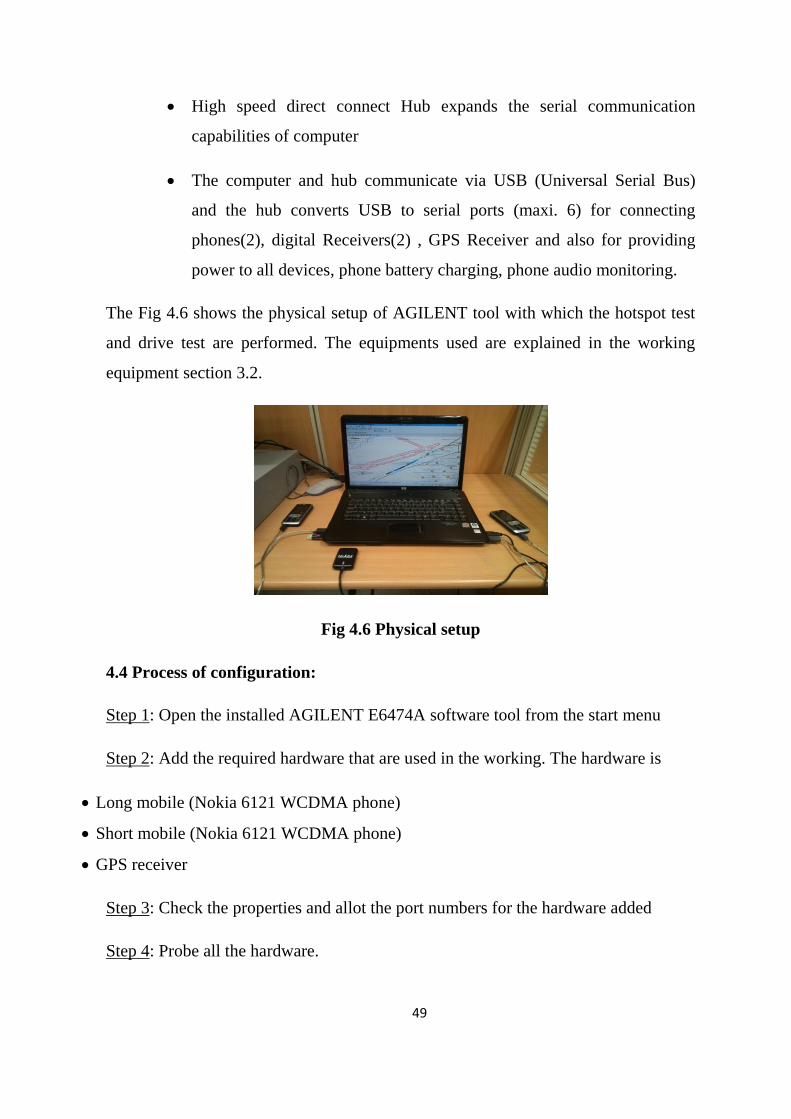
The Fig 4.6 shows the physical setup of AGILENT tool with which the hotspot test
and drive test are performed. The equipments used are explained in the working
equipment section 3.2.
Fig 4.6 Physical setup
4.4 Process of configuration:
Step 1: Open the installed AGILENT E6474A software tool from the start menu
Step 2: Add the required hardware that are used in the working. The hardware is
Long mobile (Nokia 6121 WCDMA phone)
Short mobile (Nokia 6121 WCDMA phone)
GPS receiver
Step 3: Check the properties and allot the port numbers for the hardware added
Step 4: Probe all the hardware.
50
Probing refers to the establishment of the logical connection to the established
physical connection in the step 2
Step 5: Add the map
For our project we considered the TN map which is already provided by
the software as per the requirements of area to be considered. The Parameters-
RXLevel(Sub) and RXQuality(sub) are to be dragged into the map
Step 6: Add cell site
For the map we added in the Step 5 we need to consider some area for
the study of parameters. So we considered area of Chennai as the region for the cell
site. These cell sites are to be embedded in the map
Step 7: Call control
With this step we establish a test bench platform for the functioning and
controlling of the long and short calls
Step 8: Add data items
In this we open the dialogue boxes of our study and observe the
variations of the parameters during the call process. The various data items added are
Call Status
GSM 3GPP
GSM servers and neighbours
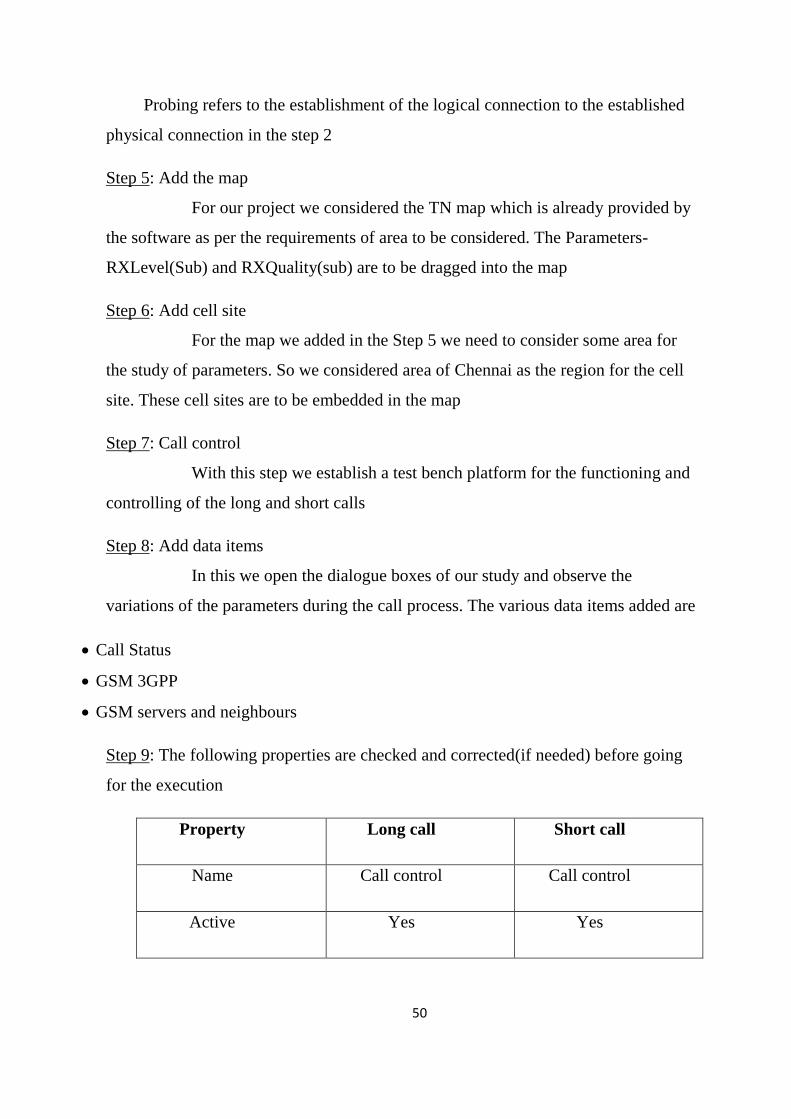
Step 9: The following properties are checked and corrected(if needed) before going
for the execution
Property Long call Short call
Name Call control Call control
Active Yes Yes
51
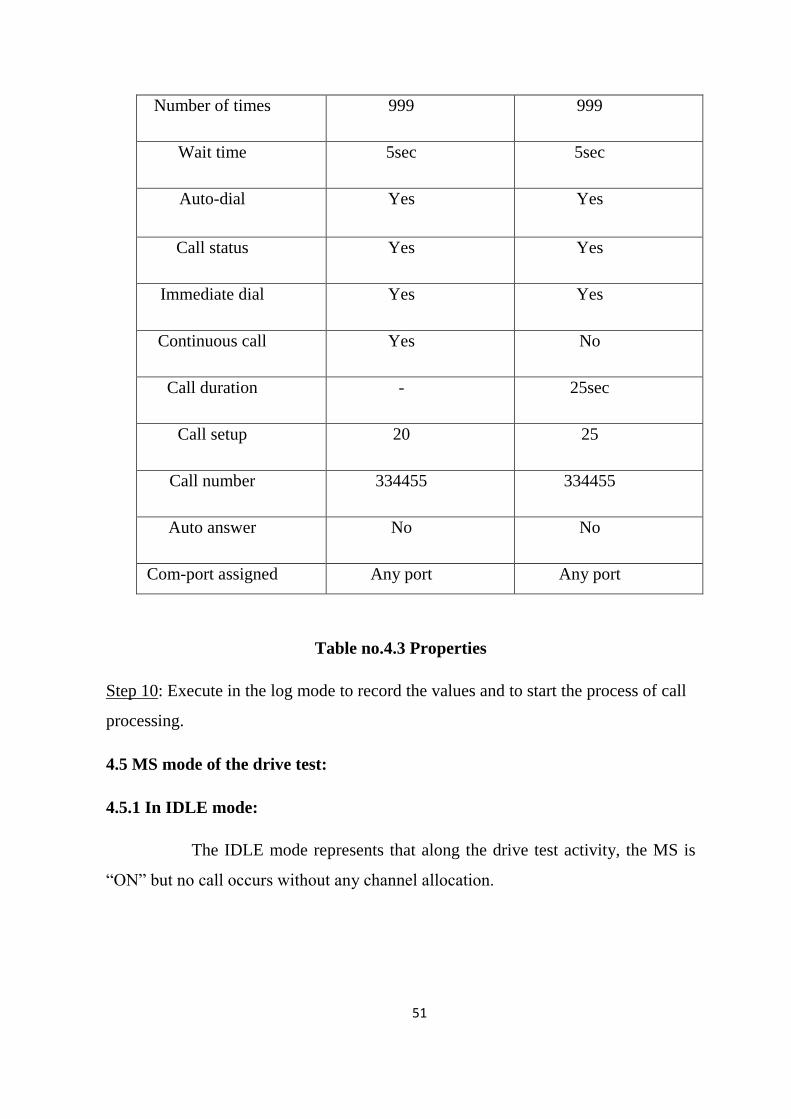
Number of times 999 999
Wait time 5sec 5sec
Auto-dial Yes Yes
Call status Yes Yes
Immediate dial Yes Yes
Continuous call Yes No
Call duration - 25sec
Call setup 20 25
Call number 334455 334455
Auto answer No No
Com-port assigned Any port Any port
Table no.4.3 Properties
Step 10: Execute in the log mode to record the values and to start the process of call
processing.
4.5 MS mode of the drive test:
4.5.1 In IDLE mode:
The IDLE mode represents that along the drive test activity, the MS is
“ON” but no call occurs without any channel allocation.
52
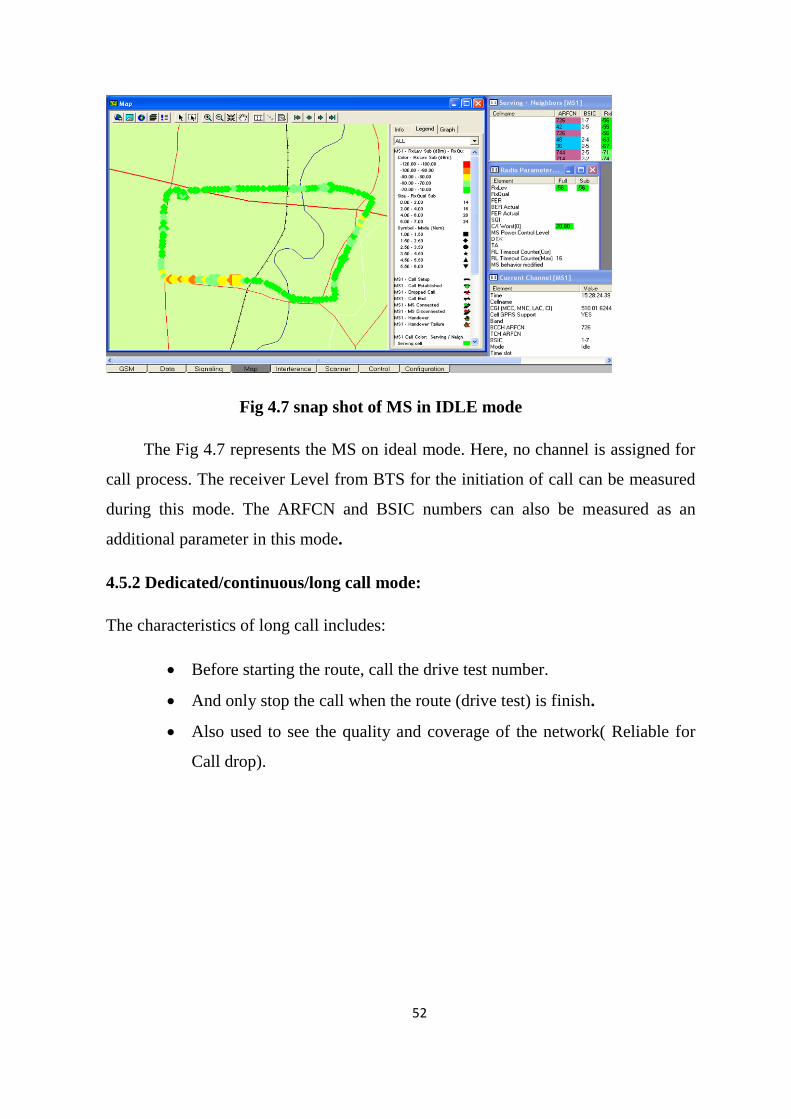
Fig 4.7 snap shot of MS in IDLE mode
The Fig 4.7 represents the MS on ideal mode. Here, no channel is assigned for
call process. The receiver Level from BTS for the initiation of call can be measured
during this mode. The ARFCN and BSIC numbers can also be measured as an
additional parameter in this mode.
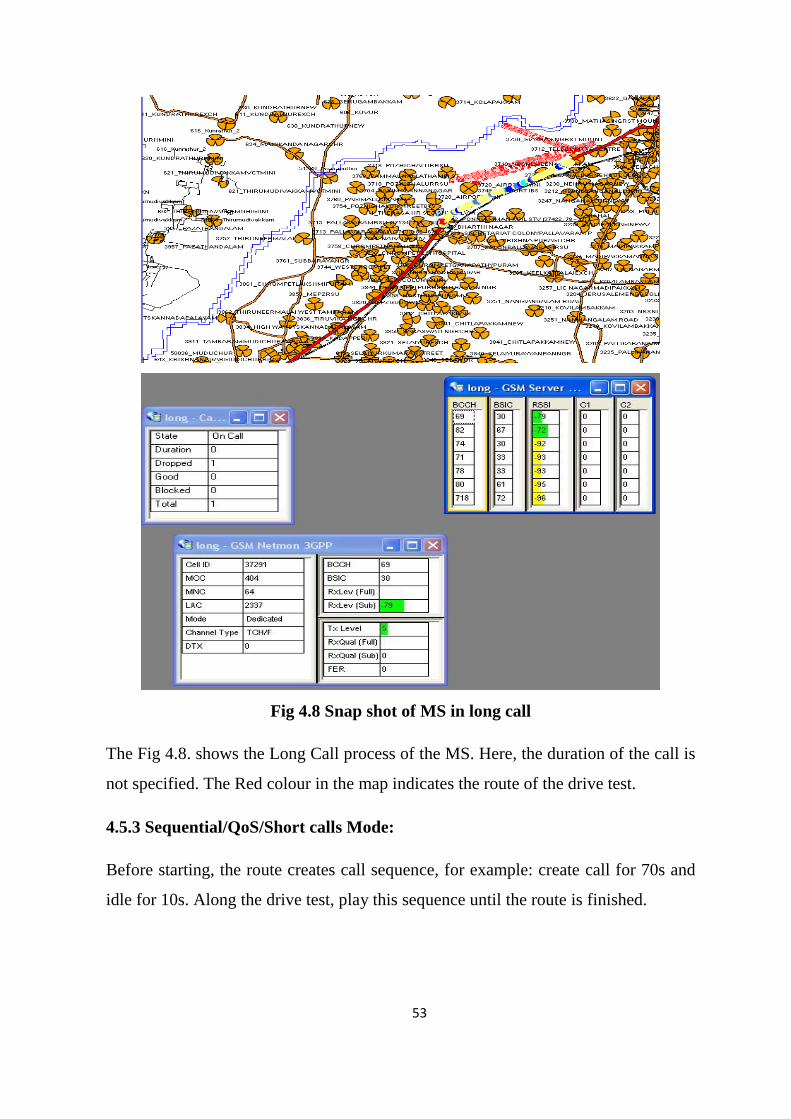
4.5.2 Dedicated/continuous/long call mode:
The characteristics of long call includes:
Before starting the route, call the drive test number.
And only stop the call when the route (drive test) is finish.
Also used to see the quality and coverage of the network( Reliable for
Call drop).
53
Fig 4.8 Snap shot of MS in long call
The Fig 4.8. shows the Long Call process of the MS. Here, the duration of the call is
not specified. The Red colour in the map indicates the route of the drive test.
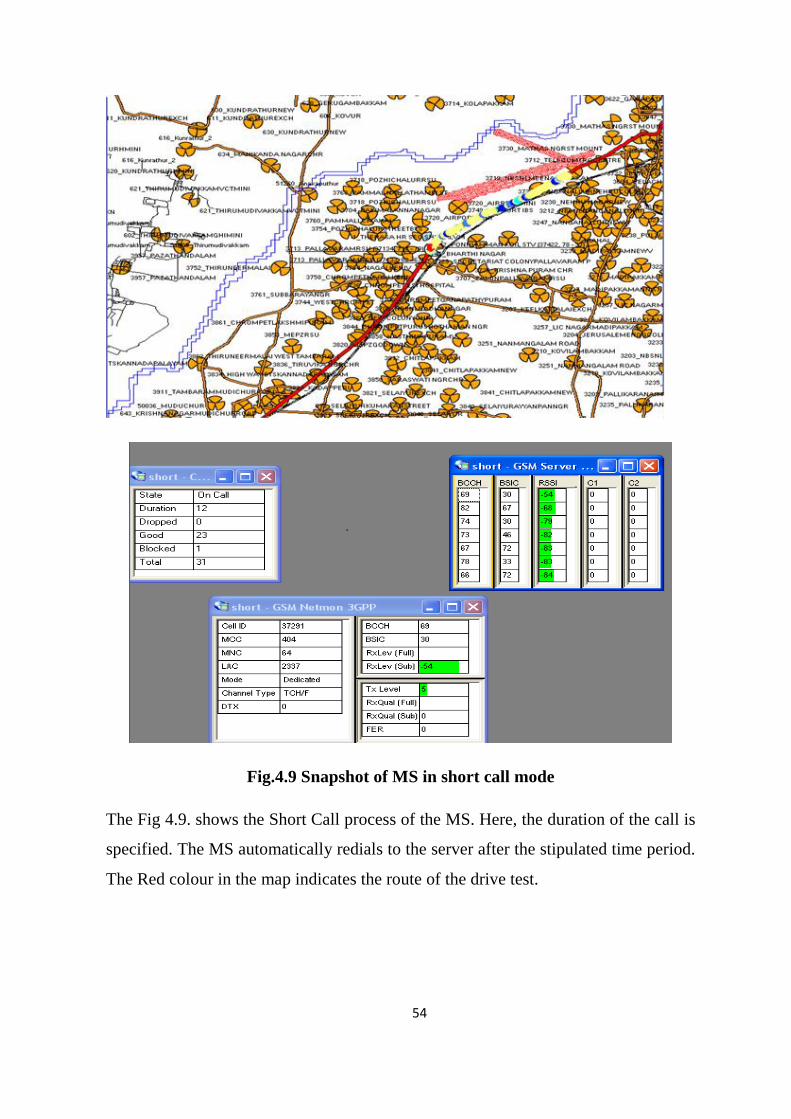
4.5.3 Sequential/QoS/Short calls Mode:
Before starting, the route creates call sequence, for example: create call for 70s and
idle for 10s. Along the drive test, play this sequence until the route is finished.
54
Fig.4.9 Snapshot of MS in short call mode
The Fig 4.9. shows the Short Call process of the MS. Here, the duration of the call is
specified. The MS automatically redials to the server after the stipulated time period.
The Red colour in the map indicates the route of the drive test.
55
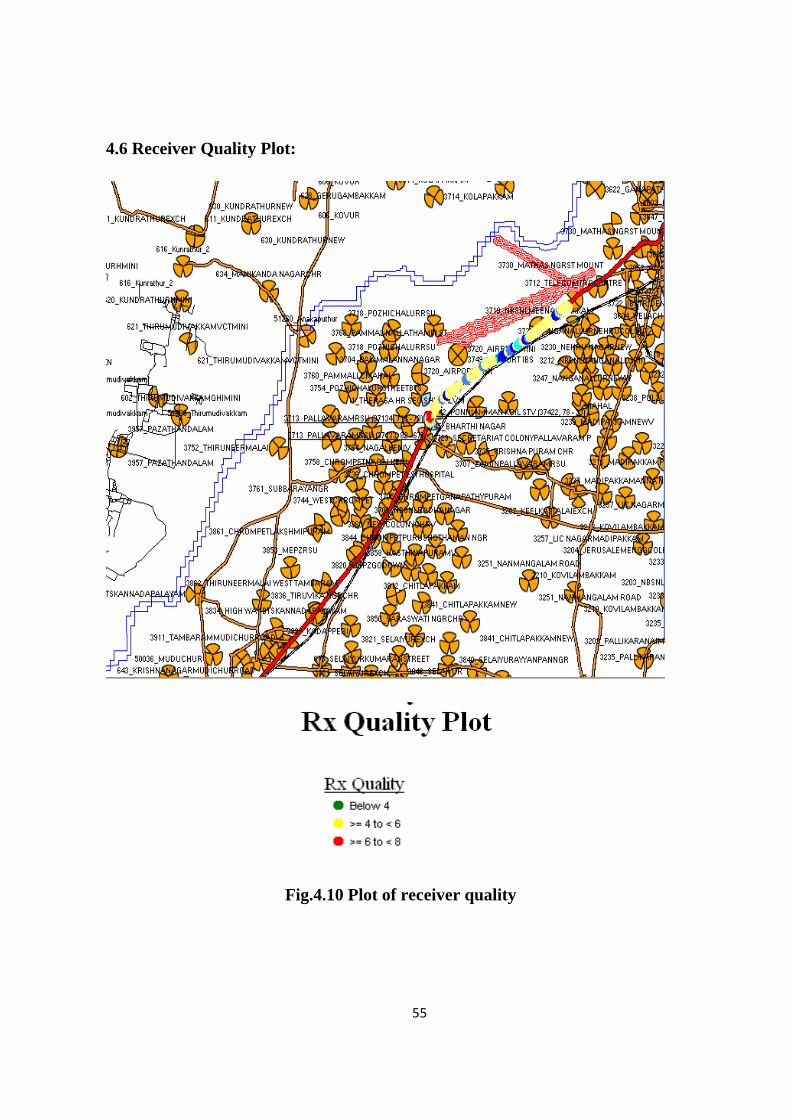
4.6 Receiver Quality Plot:
Fig.4.10 Plot of receiver quality
56
The Fig 4.10 shows the receiver quality of the network. The receiver quality of the
network lies between 0 and 7. The green, yellow and red colour indicates the best,
optimum and poor receiver quality respectively.
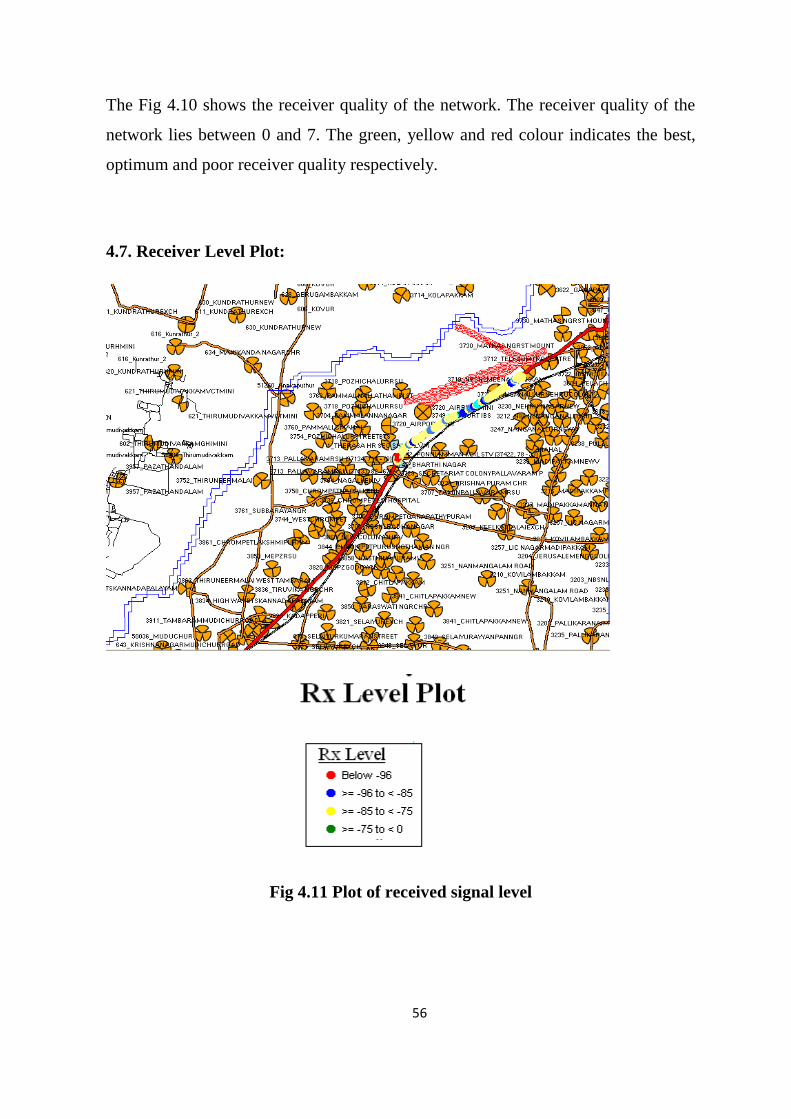
4.7. Receiver Level Plot:
Fig 4.11 Plot of received signal level
57
The Fig 4.11 shows the receiver level of the network. The receiver level of the
network lies between -60 to -104 in practice. The green, yellow and red colour
indicates the best, optimum and poor receiver quality respectively.
58
CHAPTER-5
RESULTS AND DISCUSSION
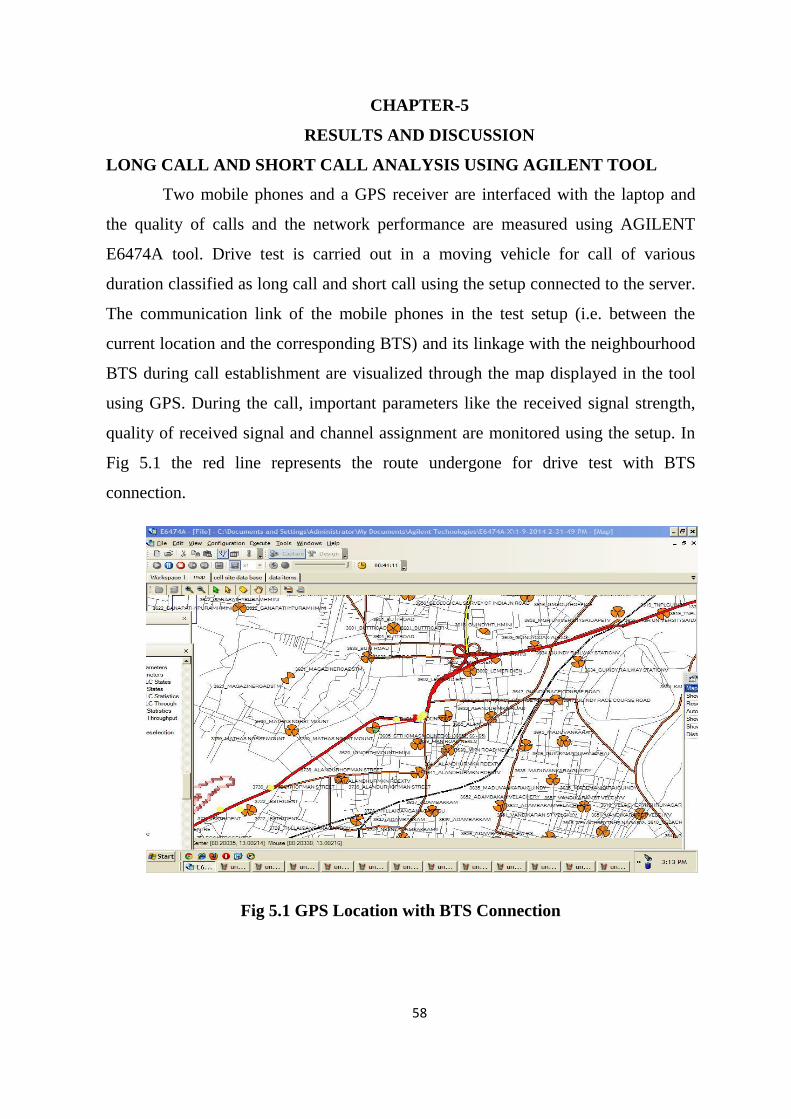
LONG CALL AND SHORT CALL ANALYSIS USING AGILENT TOOL
Two mobile phones and a GPS receiver are interfaced with the laptop and
the quality of calls and the network performance are measured using AGILENT
E6474A tool. Drive test is carried out in a moving vehicle for call of various
duration classified as long call and short call using the setup connected to the server.
The communication link of the mobile phones in the test setup (i.e. between the
current location and the corresponding BTS) and its linkage with the neighbourhood
BTS during call establishment are visualized through the map displayed in the tool
using GPS. During the call, important parameters like the received signal strength,
quality of received signal and channel assignment are monitored using the setup. In
Fig 5.1 the red line represents the route undergone for drive test with BTS
connection.
Fig 5.1 GPS Location with BTS Connection
59
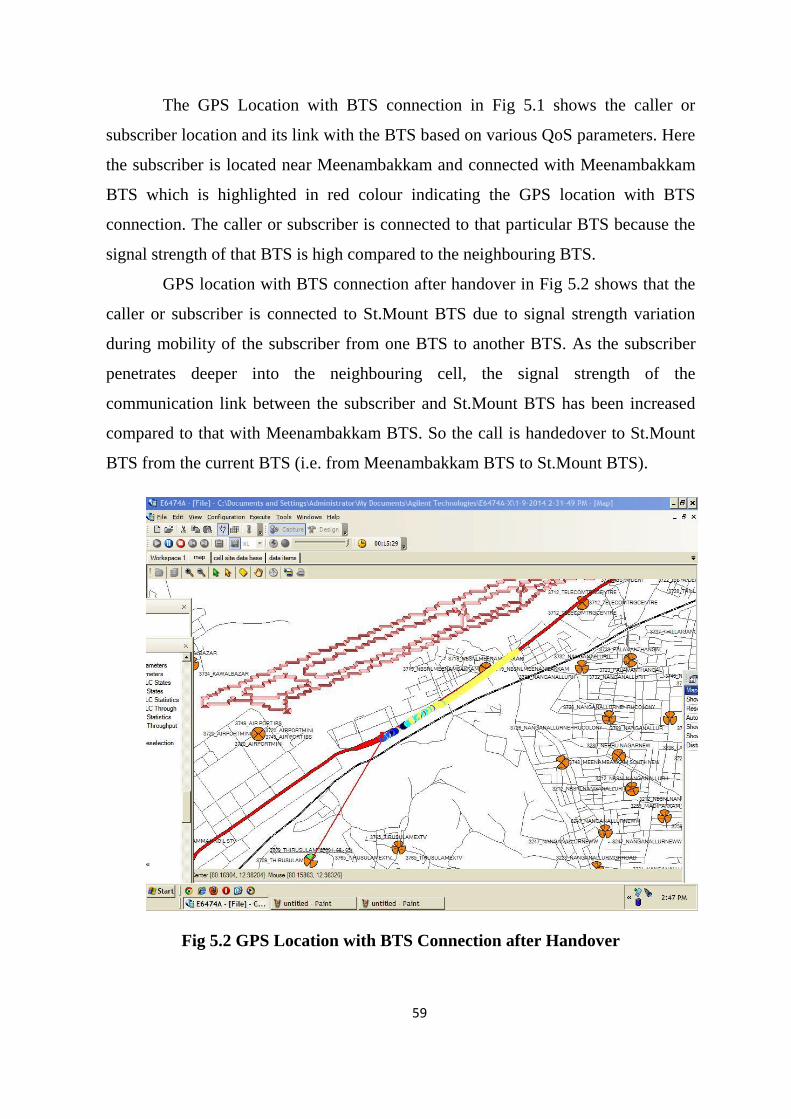
The GPS Location with BTS connection in Fig 5.1 shows the caller or
subscriber location and its link with the BTS based on various QoS parameters. Here
the subscriber is located near Meenambakkam and connected with Meenambakkam
BTS which is highlighted in red colour indicating the GPS location with BTS
connection. The caller or subscriber is connected to that particular BTS because the
signal strength of that BTS is high compared to the neighbouring BTS.
GPS location with BTS connection after handover in Fig 5.2 shows that the
caller or subscriber is connected to St.Mount BTS due to signal strength variation
during mobility of the subscriber from one BTS to another BTS. As the subscriber
penetrates deeper into the neighbouring cell, the signal strength of the
communication link between the subscriber and St.Mount BTS has been increased
compared to that with Meenambakkam BTS. So the call is handedover to St.Mount
BTS from the current BTS (i.e. from Meenambakkam BTS to St.Mount BTS).
Fig 5.2 GPS Location with BTS Connection after Handover
60
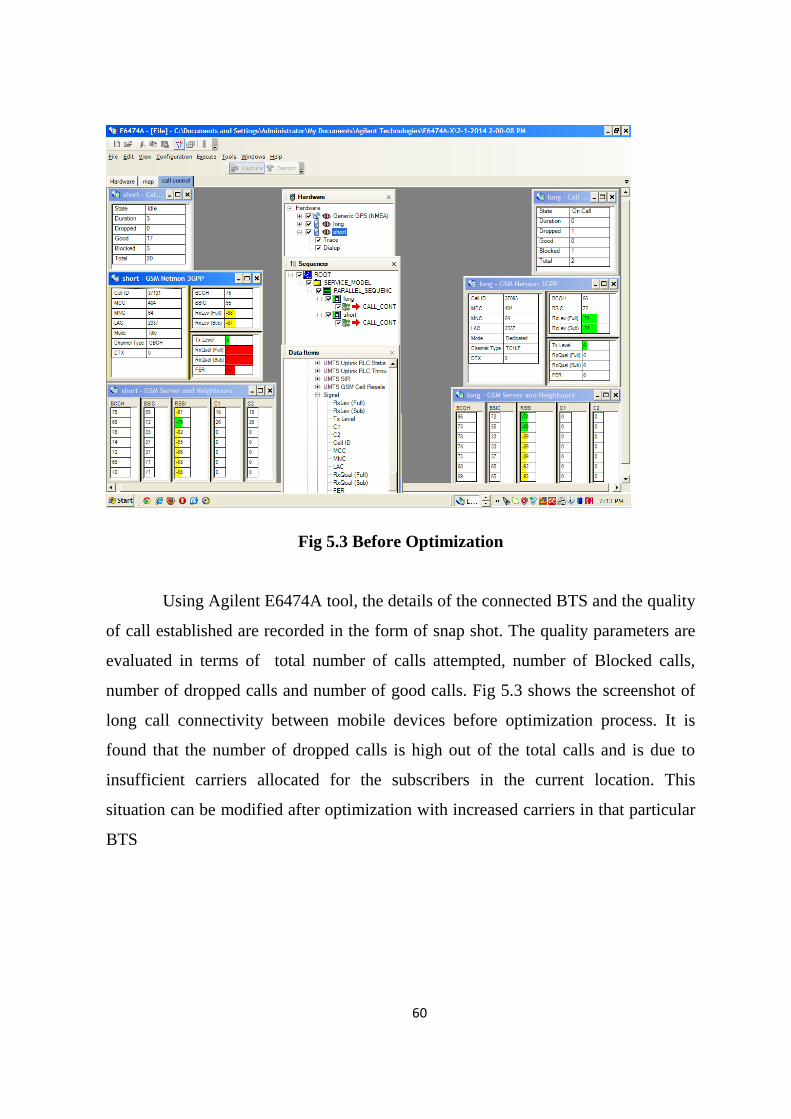
Fig 5.3 Before Optimization
Using Agilent E6474A tool, the details of the connected BTS and the quality
of call established are recorded in the form of snap shot. The quality parameters are
evaluated in terms of total number of calls attempted, number of Blocked calls,
number of dropped calls and number of good calls. Fig 5.3 shows the screenshot of
long call connectivity between mobile devices before optimization process. It is
found that the number of dropped calls is high out of the total calls and is due to
insufficient carriers allocated for the subscribers in the current location. This
situation can be modified after optimization with increased carriers in that particular
BTS
45
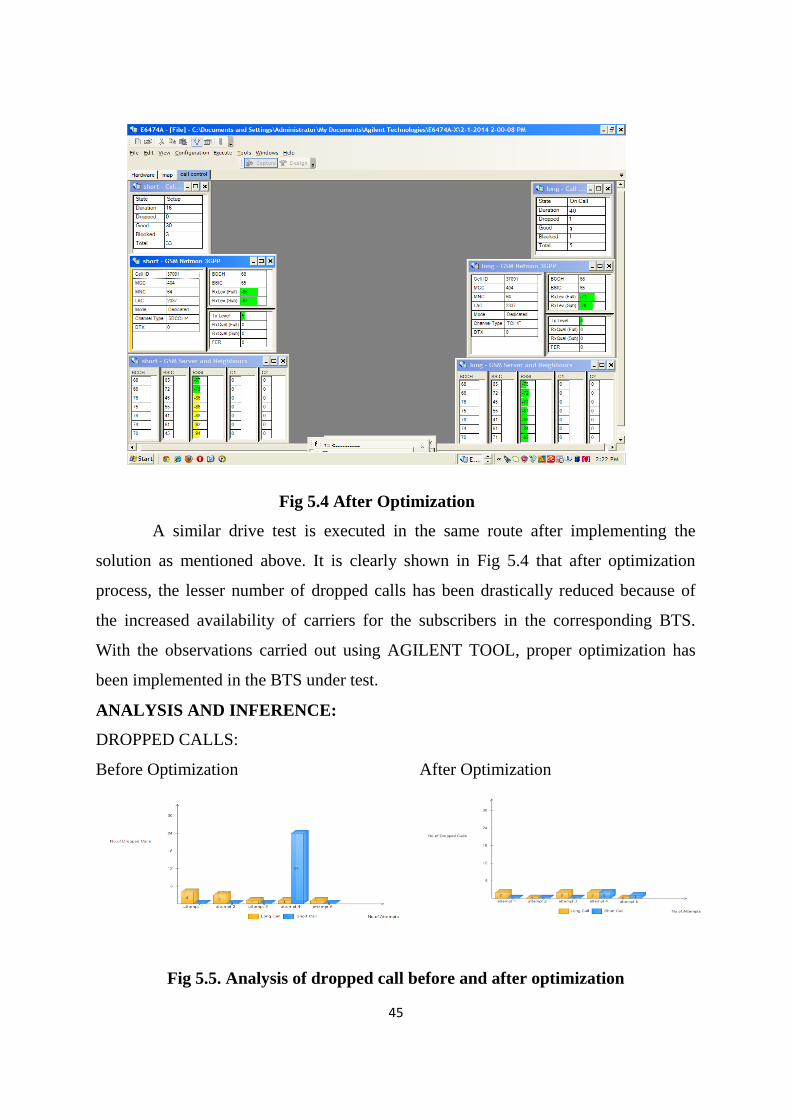
Fig 5.4 After Optimization
A similar drive test is executed in the same route after implementing the
solution as mentioned above. It is clearly shown in Fig 5.4 that after optimization
process, the lesser number of dropped calls has been drastically reduced because of
the increased availability of carriers for the subscribers in the corresponding BTS.
With the observations carried out using AGILENT TOOL, proper optimization has
been implemented in the BTS under test.
ANALYSIS AND INFERENCE:
DROPPED CALLS:
Before Optimization
After Optimization
Fig 5.5. Analysis of dropped call before and after optimization
46
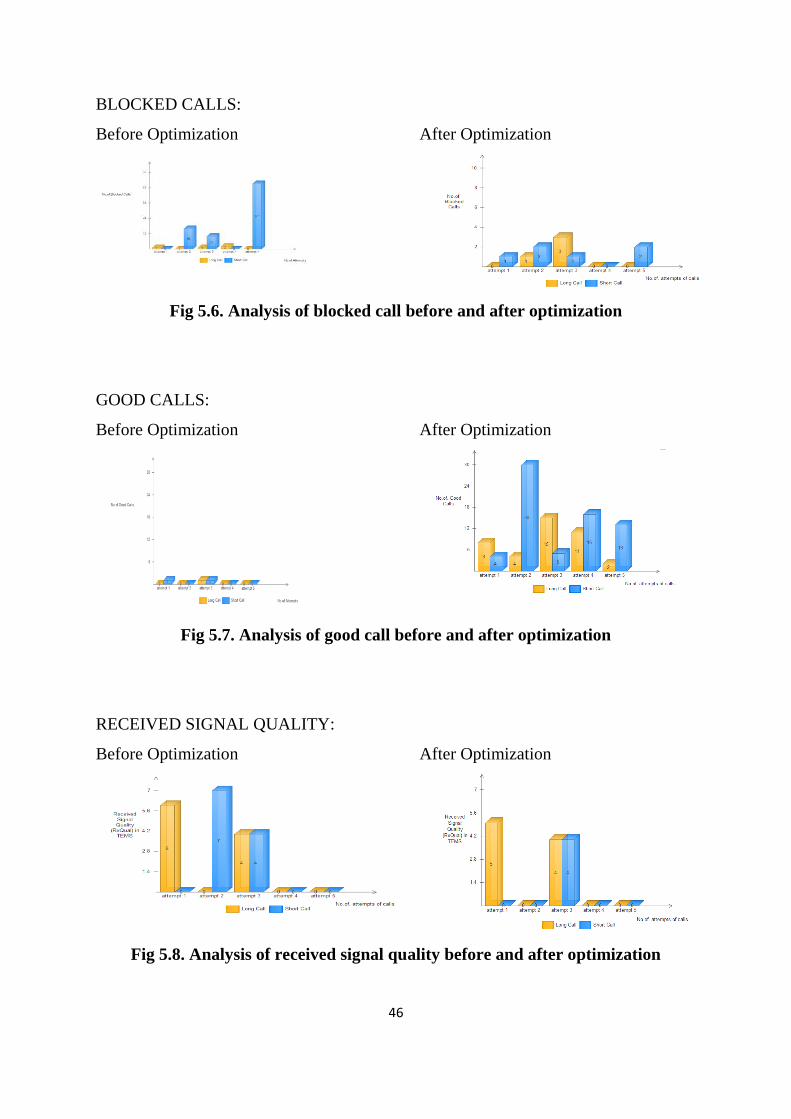
BLOCKED CALLS:
Before Optimization
After Optimization
Fig 5.6. Analysis of blocked call before and after optimization
GOOD CALLS:
Before Optimization
After Optimization
Fig 5.7. Analysis of good call before and after optimization
RECEIVED SIGNAL QUALITY:
Before Optimization
After Optimization
Fig 5.8. Analysis of received signal quality before and after optimization
46
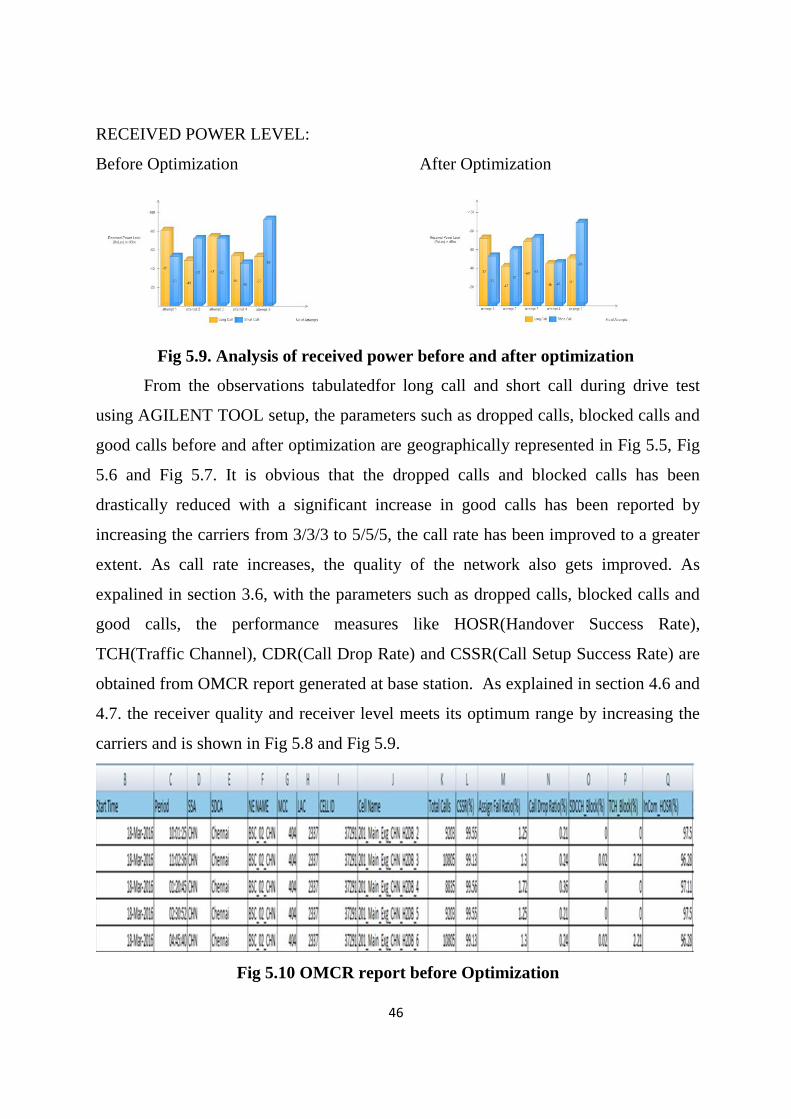
RECEIVED POWER LEVEL:
Before Optimization
After Optimization
Fig 5.9. Analysis of received power before and after optimization
From the observations tabulatedfor long call and short call during drive test
using AGILENT TOOL setup, the parameters such as dropped calls, blocked calls and
good calls before and after optimization are geographically represented in Fig 5.5, Fig
5.6 and Fig 5.7. It is obvious that the dropped calls and blocked calls has been
drastically reduced with a significant increase in good calls has been reported by
increasing the carriers from 3/3/3 to 5/5/5, the call rate has been improved to a greater
extent. As call rate increases, the quality of the network also gets improved. As
expalined in section 3.6, with the parameters such as dropped calls, blocked calls and
good calls, the performance measures like HOSR(Handover Success Rate),
TCH(Traffic Channel), CDR(Call Drop Rate) and CSSR(Call Setup Success Rate) are
obtained from OMCR report generated at base station. As explained in section 4.6 and
4.7. the receiver quality and receiver level meets its optimum range by increasing the
carriers and is shown in Fig 5.8 and Fig 5.9.
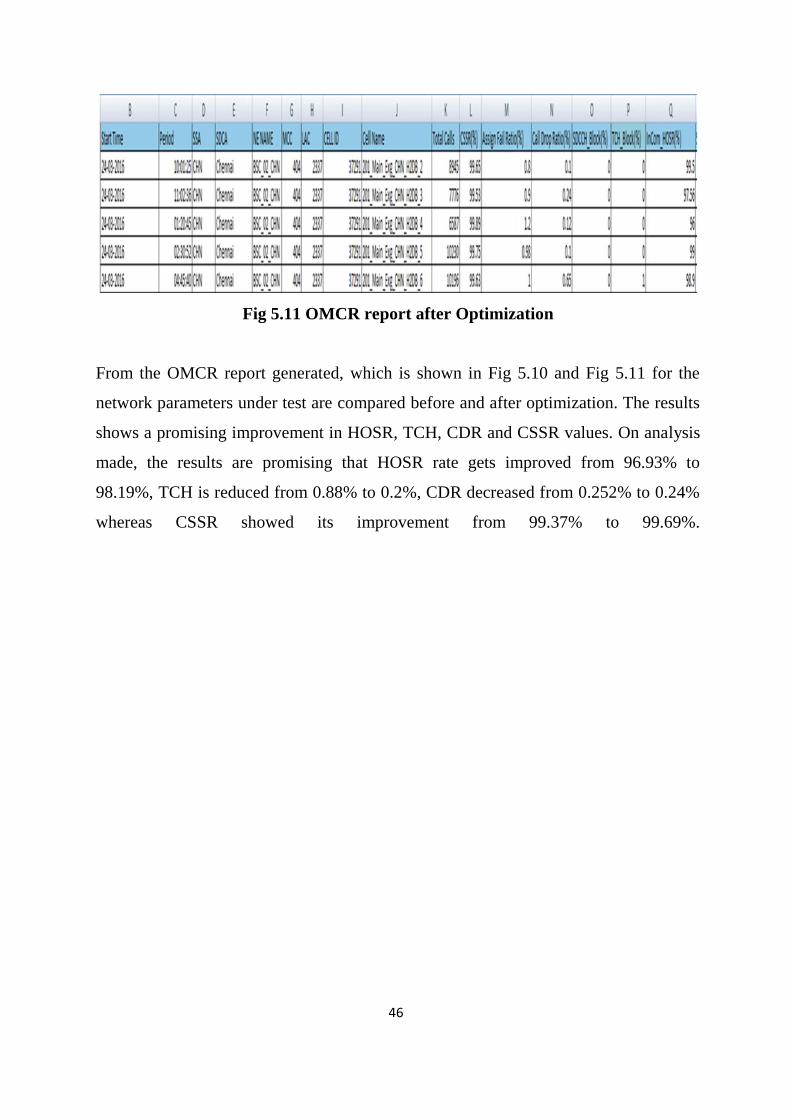
Fig 5.10 OMCR report before Optimization
46
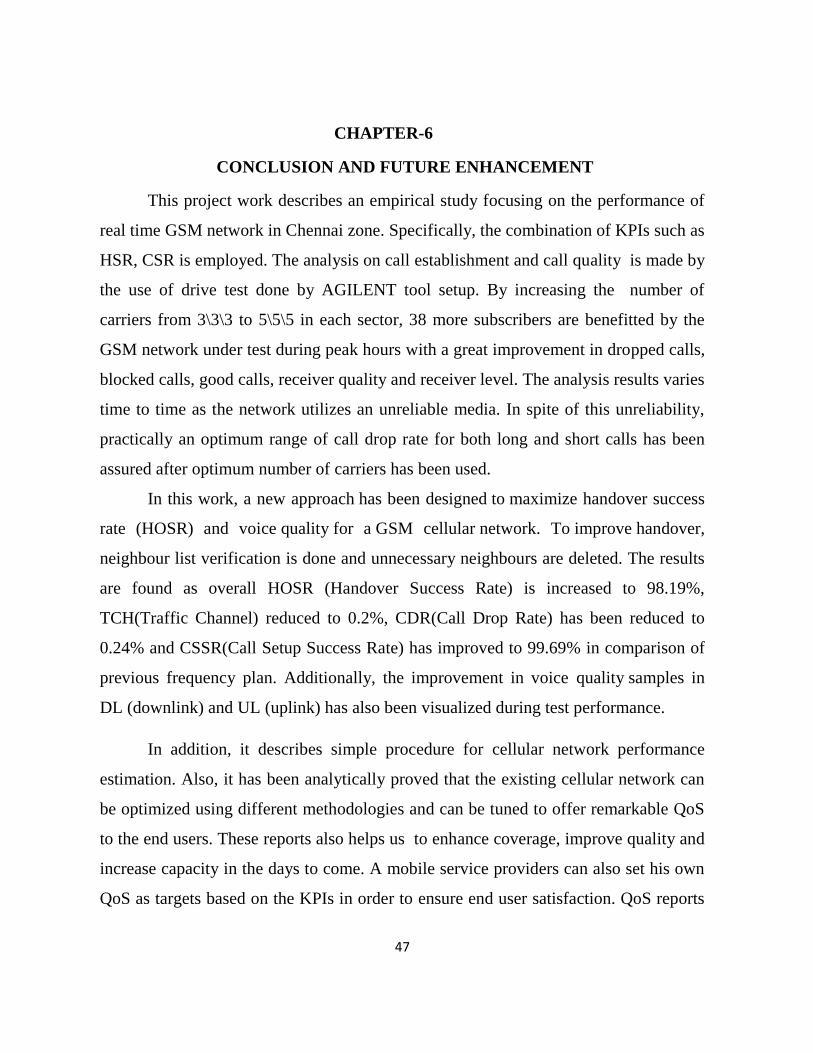
Fig 5.11 OMCR report after Optimization
From the OMCR report generated, which is shown in Fig 5.10 and Fig 5.11 for the
network parameters under test are compared before and after optimization. The results
shows a promising improvement in HOSR, TCH, CDR and CSSR values. On analysis
made, the results are promising that HOSR rate gets improved from 96.93% to
98.19%, TCH is reduced from 0.88% to 0.2%, CDR decreased from 0.252% to 0.24%
whereas CSSR showed its improvement from 99.37% to 99.69%.
47
CHAPTER-6
CONCLUSION AND FUTURE ENHANCEMENT
This project work describes an empirical study focusing on the performance of
real time GSM network in Chennai zone. Specifically, the combination of KPIs such as
HSR, CSR is employed. The analysis on call establishment and call quality is made by
the use of drive test done by AGILENT tool setup. By increasing the number of
carriers from 3\3\3 to 5\5\5 in each sector, 38 more subscribers are benefitted by the
GSM network under test during peak hours with a great improvement in dropped calls,
blocked calls, good calls, receiver quality and receiver level. The analysis results varies
time to time as the network utilizes an unreliable media. In spite of this unreliability,
practically an optimum range of call drop rate for both long and short calls has been
assured after optimum number of carriers has been used.
In this work, a new approach has been designed to maximize handover success
rate (HOSR) and voice quality for a GSM cellular network. To improve handover,
neighbour list verification is done and unnecessary neighbours are deleted. The results
are found as overall HOSR (Handover Success Rate) is increased to 98.19%,
TCH(Traffic Channel) reduced to 0.2%, CDR(Call Drop Rate) has been reduced to
0.24% and CSSR(Call Setup Success Rate) has improved to 99.69% in comparison of
previous frequency plan. Additionally, the improvement in voice quality samples in
DL (downlink) and UL (uplink) has also been visualized during test performance.
In addition, it describes simple procedure for cellular network performance
estimation. Also, it has been analytically proved that the existing cellular network can
be optimized using different methodologies and can be tuned to offer remarkable QoS
to the end users. These reports also helps us to enhance coverage, improve quality and
increase capacity in the days to come. A mobile service providers can also set his own
QoS as targets based on the KPIs in order to ensure end user satisfaction. QoS reports
48
based on different KPIs are duly beneficial for management team to compare network
performance with the competitor’s one and to plan proper network strategy.
Future Enhancement
In future, there is an opportunity to improve the network performance by focusing on
the various other factors such as the missing neighbour relations, proposing new sites or
sector additions with before & after coverage plots, proposing antenna tilt changes,
proposing antenna type changes, BTS equipment/filter change, re–tuning of interfered
frequencies, base station identity code/BSIC changes, adjusting handover margins (Power
Budget, Level, Quality, and Umbrella HOs), adjusting accessibility parameters (RX Lev
Acc Min, etc.,), changing power parameters, Tower Mounted Amplifier/TMA adds.
Moreover, it is hereby strongly recommended that all mobile operators must ensure a
better QoS up to certain threshold and baselines in order to satisfy official regulatory bodies
who penalize operators in case of customer complaints regarding service quality.
Hence, during radio network planning, it is suggested to all mobile service providers
that they must divert attention towards better network dimensioning and topology, allocated
band scanning, traffic prediction and modelling, network operational expense (OPEX), and
network parameter settings to avoid subsequent issues during optimization phase. Secondly,
end users require stringent QoS, which compels cellular service providers to optimize
network performance to meet revenue and commercial targets as well.
49
REFERENCES
[1]Halonen T., Romero J., Melero J (2003), "GSM, GPRS and EDGE performance", John
Wiley & Sons Ltd,.
[2] ITU-T recommendation G. 1000 (2001), Communication quality of service: A
framework and definition.
[3]Bilal Haider, M Zafrullah Khan, M.K.Islam, "Radio Frequency Optimization and QOS in
operational GSM network".
[4]S.Kyriazakos,G.Karetsos,E. Gkroustiotis, C. Kechagias, P. Fournogerakis (2001),
"Congestion Study and Resource Management in Cellular Networks of present and Future
Generation", IST Mobile summit, Barcelona, Spain.
[5]Jens Zander (2001), "Radio Resource Management for Wireless Networks". Artech
House Inc.,.
[6] Wireless Communications, Principles and Practice, 2nd edition, Theodore S. Rappaport,
Pearson publications.
[7] Oyetunji.O (2014), "Improving call setup success rate in GSM service area using RF
optimisation", Electronics, Computer and Computation (ICECCO), 11th International
Conference.
[8]Singh,P.; Kumar,M.; Das,A., (2014), "Effective frequency
planning to achieve improved KPI's, TCH and SDCCH drops for a
real GSM cellular network", Signal Propagation and Computer Technology (ICSPCT), .
[9] Singh, P.; Kumar, M.; Das, A., (2014), "A design approach to maximize handover
performance success rate and enhancement of voice quality samples for
a GSM cellular network", Signal Propagation and Computer Technology (ICSPCT).
50
[10] Rohit Das1 , Vikas2 , Hrishikesh Narayan Tripathi, (2014), "Reducing Call Drop in
Mobile Cellular Communication by using MIMO Antenna", IJARCSSE, Vol 4, Issue 1.
[11] Sreenath Ramanath, Veeraruna Kavitha, Eitan Altman INRIA, Sophia-Antipolis.
(2011), "Impact of mobility on call block, call drops and optimal cell size in small cell
networks", Wireless Communications, IEEE Transactions on vol 3, issue 1,.
[12] Sh.O.Seytnazarov, (2010) 'RF optimization issues in GSM networks' , in the
Application of Information and Communication Technologies (AICT).
[13] Giriraj Sharma, Ashish Kumar Bansal, April (2014) 'A Practical Approach to
Improve GSM Network Quality by RF Optimization', in the International Journal of
Engineering and Advanced Technology (IJEAT) ISSN: 2249 – 8958, Vol-3, Issue-4.
[14] Bilal Haider, M. Zafrullah and M. K. Islam. (2009), "Radio Frequency Optimization &
QoS Evaluation in Operational GSM Network", in the Proceedings of the World Congress
on Engineering and Computer Science.
[15] Sadath Kalolo, Anael Sam and Dina Machuve, Justinian Anatory, (2013), "Cost
Effective Coverage and Capacity Optimization in Wireless Cellular Networks", IRACST –
International Journal of Computer Networks and Wireless Communications (IJCNWC),
ISSN: 2250-3501 Vol.3, No4.
[16] Liang, W. ; Dept. of Electr. & Comput. Eng., North Carolina State Univ., Raleigh, NC,
USA ; Wenye Wang, (2005), "A quantitative study of authentication and QoS in wireless IP
networks" in the proceedings of INFOCOM, 24th Annual Joint Conference of the IEEE
Computer and Communications Societies. Proceedings IEEE (Volume:2 ).
[17] Osahenvemwen, O.A. and Ikheba, O.S (2015), "Evaluation of QoS in Mobile
Communication Networks", in International Journal of Computer Science and
Telecommunications , Vol- 6, Issue 11.
51
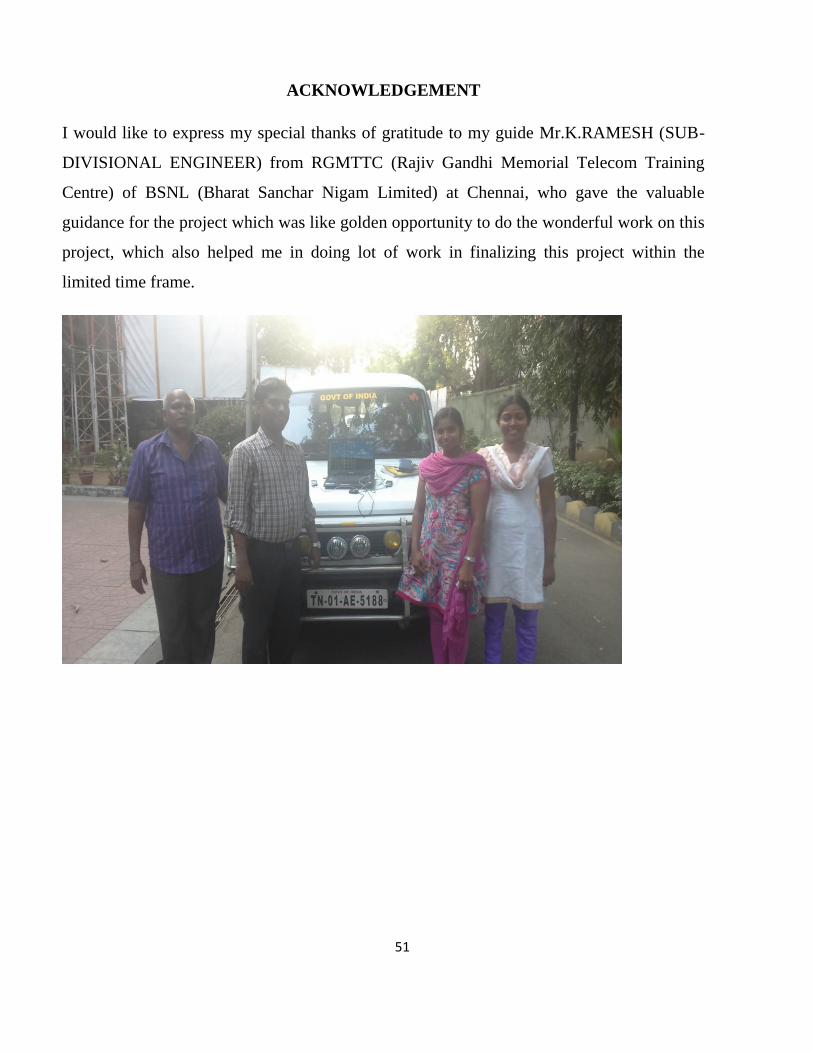
ACKNOWLEDGEMENT
I would like to express my special thanks of gratitude to my guide Mr.K.RAMESH (SUB-
DIVISIONAL ENGINEER) from RGMTTC (Rajiv Gandhi Memorial Telecom Training
Centre) of BSNL (Bharat Sanchar Nigam Limited) at Chennai, who gave the valuable
guidance for the project which was like golden opportunity to do the wonderful work on this
project, which also helped me in doing lot of work in finalizing this project within the
limited time frame.
52
LIST OF PUBLICATIONS
Presented a paper titled " ANALYSIS OF GSM CALL FLOW WITH SS7
MESSAGES & OPTIMIZATION IN GSM NETWORK " in the IEEE Sponsored
International Conference On Innovations In Information, Embedded And
Communication Systems (ICIIECS '16) during 17 & 18 March 2016 at Karpagam
College of Engineering, Coimbatore.