Embed Size (px)
Citation preview
Analysis of Ionospheric Anomalies due to Space Weather
Conditions by using GPS-TEC Variations
Asst. Prof. Dr. Mustafa ULUKAVAK 1, Prof. Dr. Mualla YALÇINKAYA2
İstanbul, May 7, 2018
1Harran University, Şanlıurfa, Turkey
2Karadeniz Technical University, Trabzon, Turkey
Presented at th
e FIG Congress 2018,
May 6-11, 2018 in
Ista
nbul, Turkey

Outline
2
I- Aim of the Study
III- Space Weather Conditions
V- What We Do?
VI- Findings
IV- Estimating GPS-TEC Variation and Analysis
II- Ionosphere

I- Aim of the Study
3
In this study;
Effects of space weather conditions on
ionospheric TEC changes are examined.
II- Ionosphere
The atmospheric layer surrounding the Earth is composed of 99%
Nitrogen (N2) and Oxygen (O2) and Carbon Dioxide (CO2) and other
gaseous structures (Rishbeth and Garriott, 1969; Ratcliffe, 1972;
Kelley, 1989).
4
The atmosphere of the Earth is divided into various layers
depending on the activity of the Sun, the gravity and magnetic
field of the Earth, the temperature and the degree of ionization.

II- Ionosphere
5
Depending on the temperature,
troposphere,
stratosphere,
mesosphere,
thermosphere
exosphere.
Depending on the ionization,
neutral ionosphere up to 70 km,
magnetosphere from 70 km to 1000 km.
II- Ionosphere
6
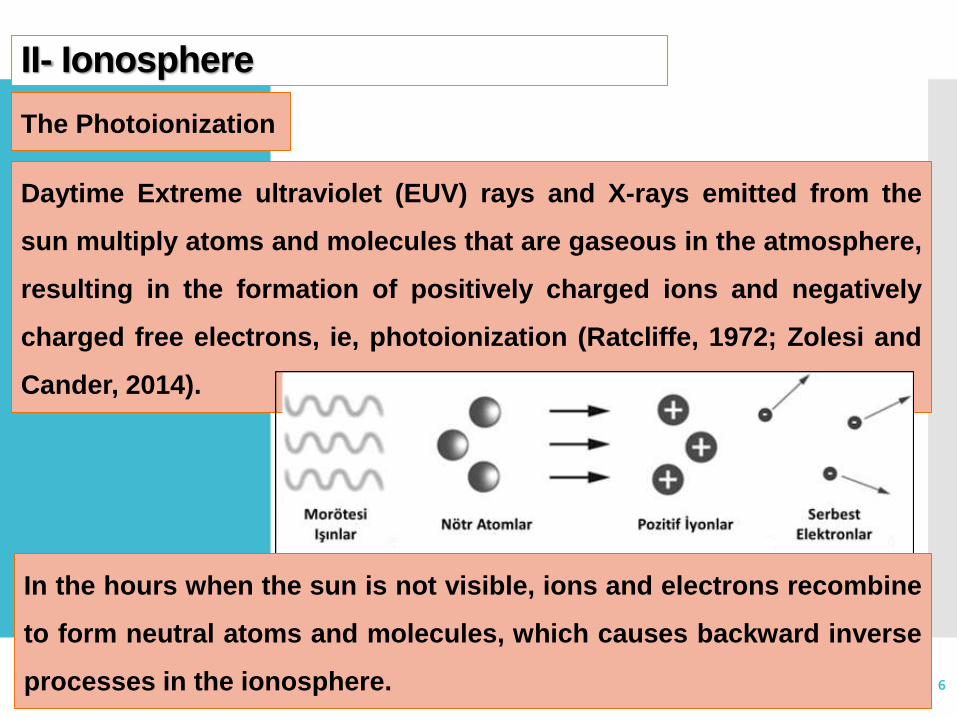
The Photoionization
Daytime Extreme ultraviolet (EUV) rays and X-rays emitted from the
sun multiply atoms and molecules that are gaseous in the atmosphere,
resulting in the formation of positively charged ions and negatively
charged free electrons, ie, photoionization (Ratcliffe, 1972; Zolesi and
Cander, 2014).
In the hours when the sun is not visible, ions and electrons recombine
to form neutral atoms and molecules, which causes backward inverse
processes in the ionosphere.
III- Space Weather Conditions
7
Due to solar and / or geomagnetic activity, time-dependent changes in
the Solar System, including the magnetosphere, ionosphere, and
thermosphere conditions, form the space weather conditions. Solar
activities can affect Earth's space weather conditions in three different
ways.

8
The first is the CME-Coronal Mass Ejections, which radiates hot plasma
to the outer space,
The second is the high-velocity plasma released from the coronal mass
ejections forming the solar winds,
The third is the Solar bursts with the magnetic energy released with
intense radiation.
III- Space Weather Conditions
9
The influence of the ionosphere layer causes major changes such as
changing the density distribution in the ionosphere, increasing or
decreasing the TEC values, and impairing the current balance in the
ionosphere (Komjathy, 1997).
In order to model these changes in the ionosphere, it is necessary to
define the solar activity and / or geomagnetic indices and determine the
solar and geomagnetic effect levels. In order to interpret the solar and
geomagnetic activities that cause the change in the ionosphere, indices
called as variables of space weather conditions are used.
III- Space Weather Conditions
10
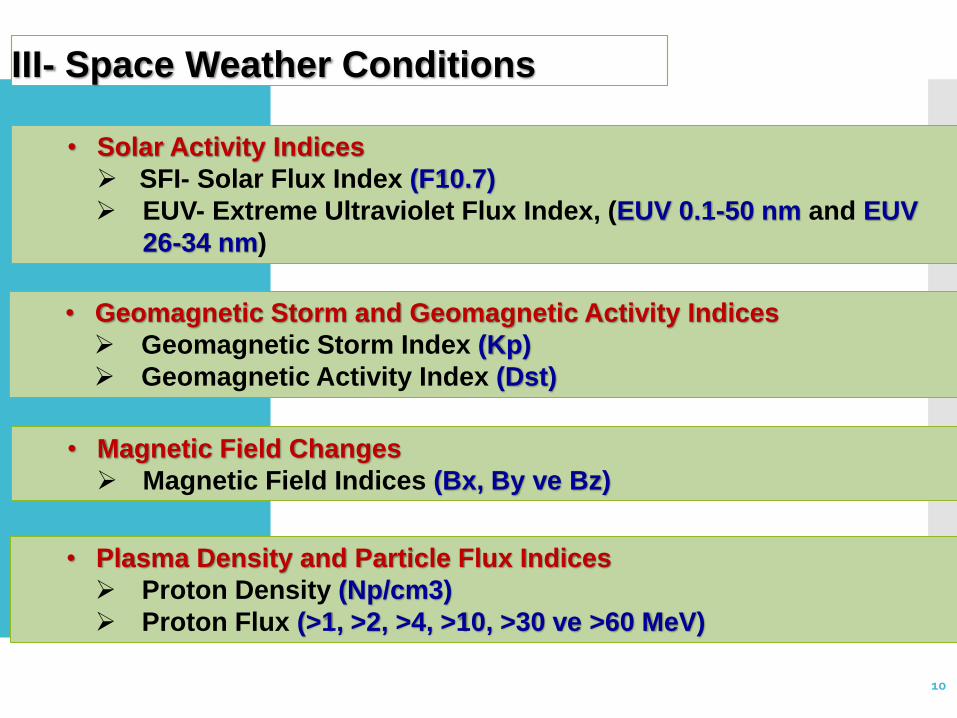
• Solar Activity Indices
➢ SFI- Solar Flux Index (F10.7)
➢ EUV- Extreme Ultraviolet Flux Index, (EUV 0.1-50 nm and EUV
26-34 nm)
• Geomagnetic Storm and Geomagnetic Activity Indices
➢ Geomagnetic Storm Index (Kp)
➢ Geomagnetic Activity Index (Dst)
• Magnetic Field Changes
➢ Magnetic Field Indices (Bx, By ve Bz)
• Plasma Density and Particle Flux Indices
➢ Proton Density (Np/cm3)
➢ Proton Flux (>1, >2, >4, >10, >30 ve >60 MeV)
III- Space Weather Conditions

IV- Estimating GPS-TEC Variation and Analysis
11
GPS signals are delayed when passing through the ionosphere.
The ionosphere structure reflects the waves at frequencies of 30 MHz
and below.
The signals at 50 MHz and above can pass through the ionosphere, but
are subject to attenuation and delay in the ionosphere (Schaer, 1999).
(Şentürk and Çepni, 2014)
Signaldelay
Total ElectronContent (TEC)
Ionosphere
Mezosphere
Stratosphere
Troposphere
Earth surface

12
Leveling (Smoothing) coefficient 𝑩𝒎, 𝜱𝟒 combined with STEC values;
𝑺𝑻𝑬𝑪𝒖𝒎 𝒏 =
𝟏
𝑨
𝒇𝟏𝟐𝒇𝟐
𝟐
𝒇𝟐𝟐 − 𝒇𝟏
𝟐 ൯𝑩𝒎 −𝜱𝟒,𝒖𝒎 𝒏 − ሺ𝑫𝑪𝑩
𝒎+𝑫𝑪𝑩𝒖
VTEC variations (Klobuchar, 1986), can be obtained by single-layer
ionosphere model with mapping function
𝑴 𝒛𝒎 𝒏 =𝑺𝑻𝑬𝑪𝒖
𝒎 𝒏
𝑽𝑻𝑬𝑪𝒖𝒎 𝒏
𝒛𝒎 𝒏 : receiver and satellite zenith angle
Vertical Total Electron Content (VTEC)
Calibrated STEC variations can be obtained by eliminating satellite and
receiver DCBs, from the each satellite and receiver arc
IV- Estimating GPS-TEC Variation and Analysis
13
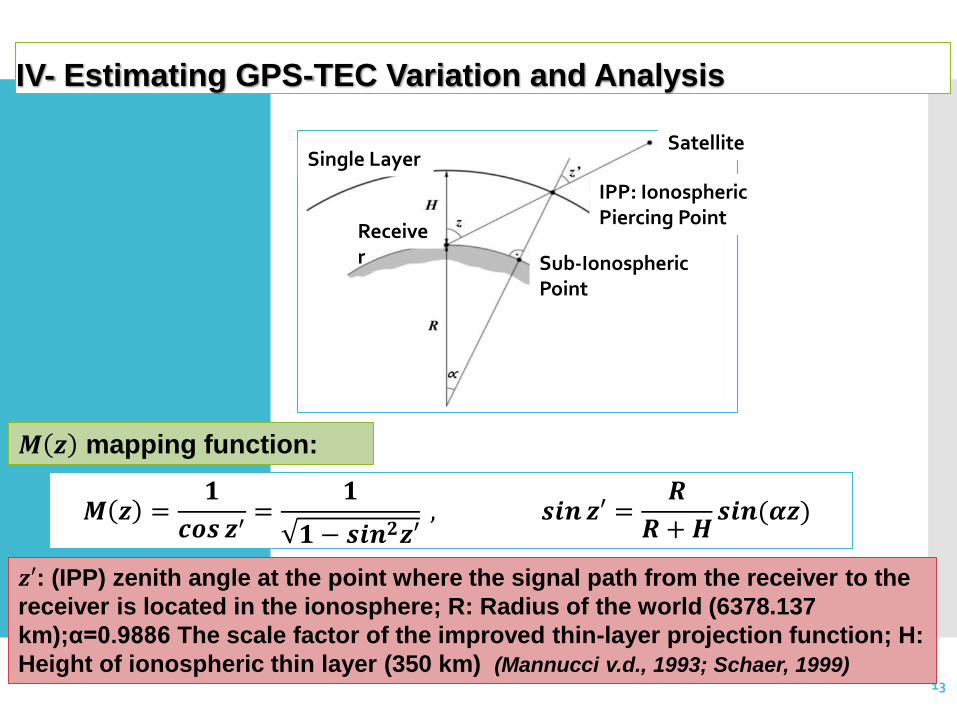
𝒛′: (IPP) zenith angle at the point where the signal path from the receiver to the
receiver is located in the ionosphere; R: Radius of the world (6378.137
km);α=0.9886 The scale factor of the improved thin-layer projection function; H:
Height of ionospheric thin layer (350 km) (Mannucci v.d., 1993; Schaer, 1999)
𝑴 𝒛 =𝟏
𝒄𝒐𝒔 𝒛′=
𝟏
𝟏 − 𝒔𝒊𝒏𝟐𝒛′, 𝒔𝒊𝒏 𝒛′ =
𝑹
𝑹 +𝑯𝒔𝒊𝒏ሺ𝜶𝒛)
𝑴 𝒛 mapping function:
Single LayerSatellite
IPP: IonosphericPiercing Point
Sub-IonosphericPoint
Receiver
IV- Estimating GPS-TEC Variation and Analysis
14
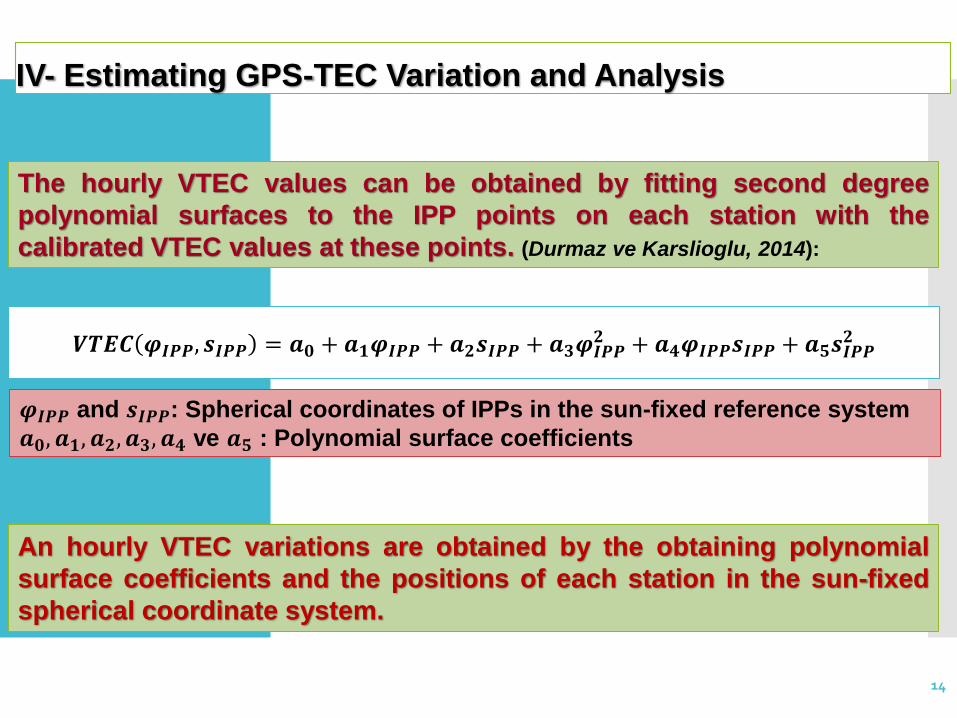
The hourly VTEC values can be obtained by fitting second degree
polynomial surfaces to the IPP points on each station with the
calibrated VTEC values at these points. (Durmaz ve Karslioglu, 2014):
𝝋𝑰𝑷𝑷 and 𝒔𝑰𝑷𝑷: Spherical coordinates of IPPs in the sun-fixed reference system
𝒂𝟎, 𝒂𝟏, 𝒂𝟐, 𝒂𝟑, 𝒂𝟒 ve 𝒂𝟓 : Polynomial surface coefficients
𝑽𝑻𝑬𝑪 𝝋𝑰𝑷𝑷, 𝒔𝑰𝑷𝑷 = 𝒂𝟎 + 𝒂𝟏𝝋𝑰𝑷𝑷 + 𝒂𝟐𝒔𝑰𝑷𝑷 + 𝒂𝟑𝝋𝑰𝑷𝑷𝟐 + 𝒂𝟒𝝋𝑰𝑷𝑷𝒔𝑰𝑷𝑷 + 𝒂𝟓𝒔𝑰𝑷𝑷
𝟐
An hourly VTEC variations are obtained by the obtaining polynomial
surface coefficients and the positions of each station in the sun-fixed
spherical coordinate system.
IV- Estimating GPS-TEC Variation and Analysis

15
VTEC anomalies affected by ionospheric changes can be calculated
according to the moving median (MM) method between quartiles (Liu
vd., 2009);
• Lower quartiles (LQ) and upper quartiles (UQ) are obtain.
• VTEC values are determined in the normal distribution with mean
(m) and standard deviation (σ), MM, LQ and UQ values are
determined at m and 1.34σ confidence interval (Klotz ve Johnson,
1983).
• Lower Boundary (LB) values LB = MM – 1.5(MM – LQ)
Upper Boundary (UB) values UB = MM + 1.5(UQ – MM)
• Positive anomaly variations are over the upper boundaries
• Negative anomaly variations are below the lower boundaries
If the anomalies found within one day are higher or lower than the
limit values of more than one third, the day is considered abnormal
day. (Liu v.d., 2009).
IV- Estimating GPS-TEC Variation and Analysis
V- What We Do?
16
• The continuity of the GPS observations belonging to the IGS
stations was checked,
• The index values of the space weather conditions investigated,
• Relation between the space weather condition indices and
ionospheric TEC variations were examined.
In this study;

17
• Analysis result of Space Weather Conditions,
• Calculation of Ionospheric TEC variations,
• Analysis of space weather condition with ionospheric TEC
variations,
VI- Findings
SPACE WEATHER CONDITION INDICES DATA
18
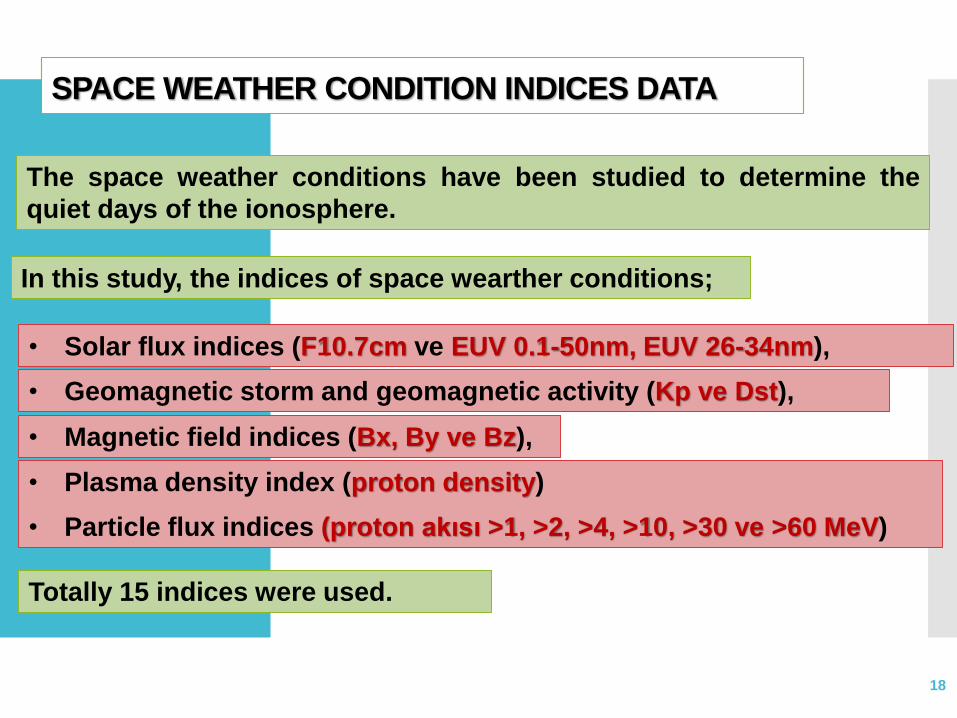
The space weather conditions have been studied to determine the
quiet days of the ionosphere.
In this study, the indices of space wearther conditions;
• Solar flux indices (F10.7cm ve EUV 0.1-50nm, EUV 26-34nm),
• Geomagnetic storm and geomagnetic activity (Kp ve Dst),
• Magnetic field indices (Bx, By ve Bz),
• Plasma density index (proton density)
• Particle flux indices (proton akısı >1, >2, >4, >10, >30 ve >60 MeV)
Totally 15 indices were used.

19
ANALYSIS OF SPACE WEATHER CONDITIONS
Analysis of the solar activity (SA) indices (F10.7cm and EUV 0.1-50nm,
EUV 26-34nm) (F10.7 limit value 150 sfu; EUV peak)
20
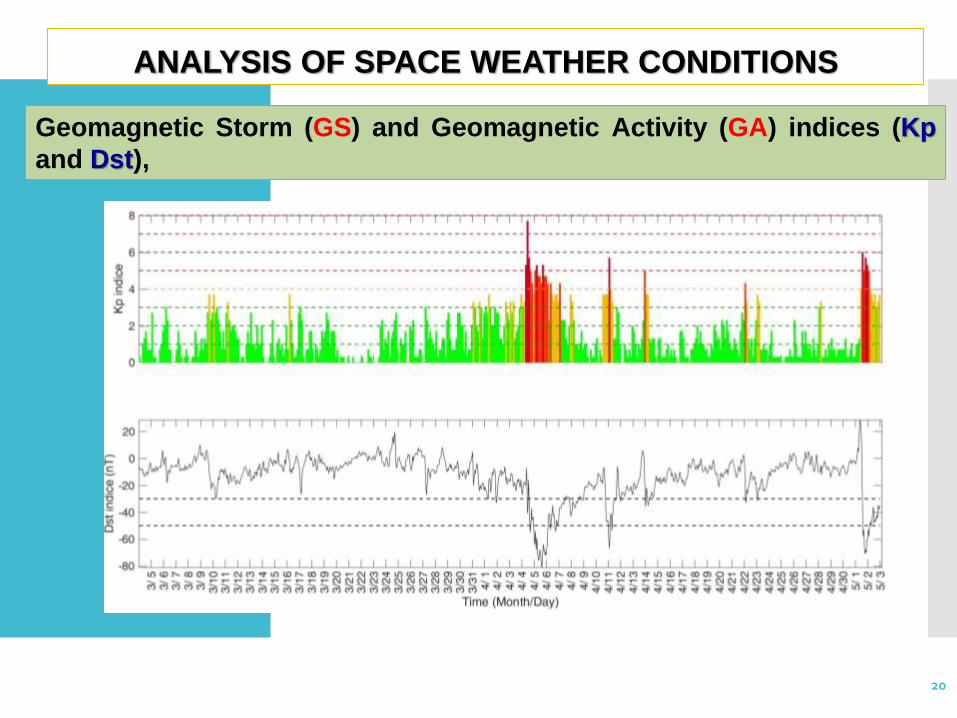
ANALYSIS OF SPACE WEATHER CONDITIONS
Geomagnetic Storm (GS) and Geomagnetic Activity (GA) indices (Kp
and Dst),

21
ANALYSIS OF SPACE WEATHER CONDITIONS
Magnetic Field (MF) Indices (Bx, By and Bz),
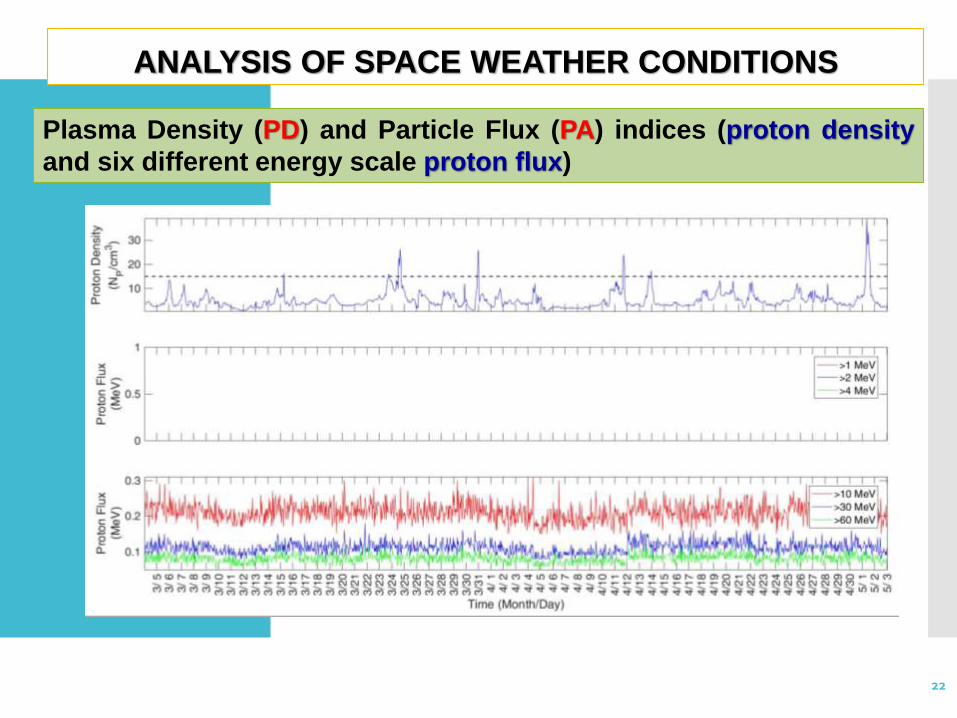
22
Plasma Density (PD) and Particle Flux (PA) indices (proton density
and six different energy scale proton flux)
ANALYSIS OF SPACE WEATHER CONDITIONS
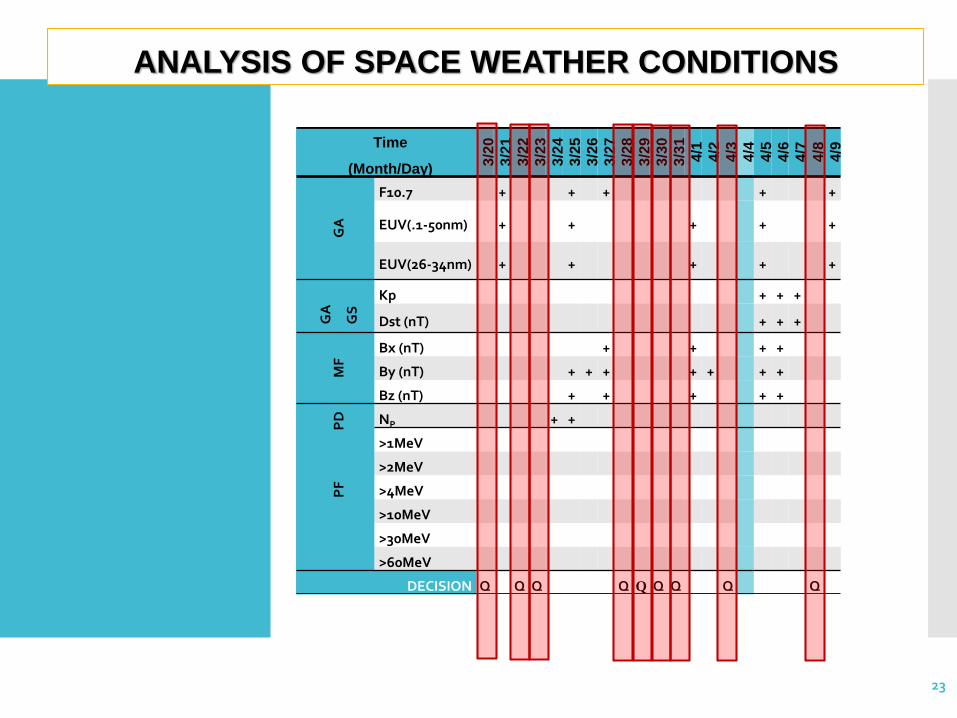
Time
(Month/Day)
3/2
0
3/2
1
3/2
2
3/2
3
3/2
4
3/2
5
3/2
6
3/2
7
3/2
8
3/2
9
3/3
0
3/3
1
4/1
4/2
4/3
4/4
4/5
4/6
4/7
4/8
4/9
GA
F10.7 + + + + +
EUV(.1-50nm) + + + + +
EUV(26-34nm) + + + + +
GA
GS
Kp + + +
Dst (nT) + + +M
FBx (nT) + + + +
By (nT) + + + + + + +
Bz (nT) + + + + +
PF
P
D NP + +
>1MeV
>2MeV
>4MeV
>10MeV
>30MeV
>60MeV
DECISION Q Q Q Q Q Q Q Q Q
23
ANALYSIS OF SPACE WEATHER CONDITIONS

24
Upper Bound
Lower Bound
Median Values
GPS-TEC Variations
Positive Anomaly
Negative Anomaly
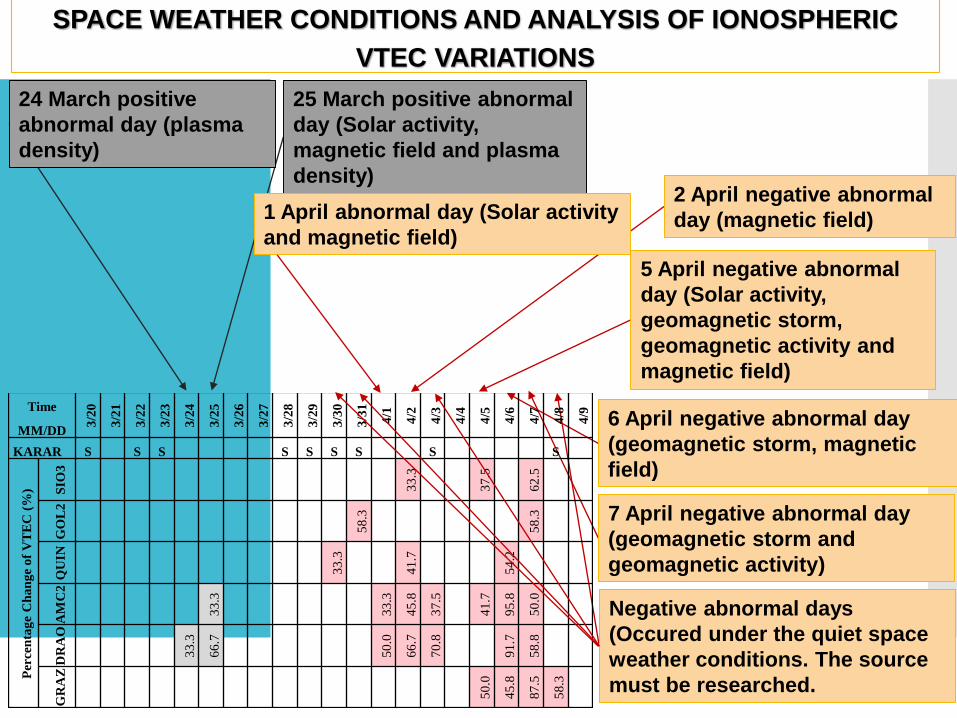
Time
MM/DD
3/2
0
3/2
1
3/2
2
3/2
3
3/2
4
3/2
5
3/2
6
3/2
7
3/2
8
3/2
9
3/3
0
3/3
1
4/1
4/2
4/3
4/4
4/5
4/6
4/7
4/8
4/9
KARAR S S S S S S S S S
Per
cen
tag
eC
ha
ng
eo
f V
TE
C (
%) SIO
3
33.3
37.5
62.5
GO
L2
58.3
58.3
QU
IN
33.3
41.7
54.2
AM
C2
33.3
33.3
45.8
37.5
41.7
95.8
50.0
DR
AO
33.3
66.7
50.0
66.7
70.8
91.7
58.8
GR
AZ
50.0
45.8
87.5
58.3 25
24 March positive
abnormal day (plasma
density)
25 March positive abnormal
day (Solar activity,
magnetic field and plasma
density)
1 April abnormal day (Solar activity
and magnetic field)
2 April negative abnormal
day (magnetic field)
5 April negative abnormal
day (Solar activity,
geomagnetic storm,
geomagnetic activity and
magnetic field)
6 April negative abnormal day
(geomagnetic storm, magnetic
field)
7 April negative abnormal day
(geomagnetic storm and
geomagnetic activity)
Negative abnormal days
(Occured under the quiet space
weather conditions. The source
must be researched.
SPACE WEATHER CONDITIONS AND ANALYSIS OF IONOSPHERIC
VTEC VARIATIONS

Thanks For Your Attention…
26