Embed Size (px)
Citation preview

Analysis of laser ablation plumes by laserinduced breakdown spectroscopy and
quadrupole mass spectrometry: a comparative study
Cowpe, JS, Astin, JS, Pilkington, RD, Hill, AE, Longson, M and Robinson, T
Title Analysis of laser ablation plumes by laserinduced breakdown spectroscopy and quadrupole mass spectrometry: a comparative study
Authors Cowpe, JS, Astin, JS, Pilkington, RD, Hill, AE, Longson, M and Robinson, T
Type Conference or Workshop Item
URL This version is available at: http://usir.salford.ac.uk/1561/
Published Date 2006
USIR is a digital collection of the research output of the University of Salford. Where copyright permits, full text material held in the repository is made freely available online and can be read, downloaded and copied for noncommercial private study or research purposes. Please check the manuscript for any further copyright restrictions.
For more information, including our policy and submission procedure, pleasecontact the Repository Team at: [email protected].
Title: Analysis of Laser Ablation Plumes by Laser-Induced Breakdown Spectroscopy
and Quadrupole Mass Spectrometry: a Preliminary Study
Author names and affiliations: J.S. Cowpe*a, J.S. Astina, R.D. Pilkingtona, A.E. Hilla,
M. Longsonb, T. Robinsonb
a Institute for Materials Research, University of Salford, Salford, M5 4WT, UK.
b MKS Instruments UK Ltd, 2 St Georges Court, Hanover Business Park, Altrincham,
Cheshire, WA14 5UA, UK.
*Corresponding author: J. S. Cowpe. [email protected]
Institute for Materials Research, Room 105 Maxwell Building, University of Salford,
Salford, M5 4WT, UK. Telephone: +44-161-295-5268
Abstract: Plasma plumes resulting from Nd:YAG laser ablation of copper and
Fecralloy (Fe 72.8%, Cr 22%, Al 5%, Zr trace, Y trace) have been analysed
simultaneously with Laser-Induced Breakdown Spectroscopy (LIBS) and Laser
Ablation Mass Spectrometry (LAMS). A commercially available Residual Gas
Analyser (RGA) was employed to perform mass spectrometric analysis of the neutral
and ionic species created during the laser ablation process. Investigations of laser
repetition rate have shown that increasing the frequency of the laser pulse rate is
detrimental to the mass spectra produced; the average detectable partial pressure drops
and the relative standard deviation of the signal increases. The RGA has been shown to
be susceptible to corruption of measurement due to pump oil contamination when
recording the partial pressure of neutral species created by the ablation event. Lack of
1

synchronisation between the transient laser pulse and the RGA mass scan results in
variable partial pressure readings when analysing both neutral and ionic species.
LAMS is able to detect small trace amounts of Zirconium and Yttrium in Fecralloy;
LIBS is unable to resolve these trace amounts, but is shown to be unaffected by
chamber pump oil contamination.
Keywords: LIBS, mass spectrometry, quadrupole, residual gas analyser, laser ablation
2

1. Introduction
1.1 Laser-Induced Breakdown Spectroscopy
Laser Induced Breakdown Spectroscopy (LIBS) is an atomic emission spectroscopy
technique that employs a high powered, pulsed laser beam as the excitation source.
LIBS historically has been a qualitative technique but over the last few years it has
developed into a pseudo-quantitative materials micro-analysis technique, capable of
determining the elemental composition of solids, liquids and gases [1]. The output of
the laser is focussed onto the sample surface (or the effective surface for a gas) and if
the fluence exceeds a certain threshold value (typically ≈108 Wcm-2; this value is
material-specific [1]), then the analyte is ablated forming a plume propagating from the
surface. This ablated material is composed of neutral particles, free electrons and
highly ionised atoms, and expands as high temperature (≈104 K) plasma [2].
Spectroscopic analysis of the optical emission from the decaying species in the plume
enables identification of the material under test.
Relatively poor sensitivity and complex matrix effects have hindered the quantitative
application of LIBS [3]. The optical thickness of plasmas generated by laser ablation
results in self-absorption of certain resonant emission lines, leading to non-linearity in
the spectra produced [4]. Self absorbed spectral lines will have measured intensities
lower than those predicted for a given elemental concentration; the observed elemental
concentrations may differ from the actual composition of the analyte. For
environmental monitoring, forensic applications and process control etc. this inaccuracy
is unacceptable. Numerous calibration methods have been developed to counteract and
correct for this effect [5], and several iterative calibration-free studies have and are
being conducted [6]. Construction of calibration curves from standard samples [7, 8]
requires a large number of reference samples for accurate calibration, which in the case
of complex multi-elemental substances can be impractical and expensive. It can prove
to be extremely difficult to analyse unknown samples if a suitable calibration has not
been previously undertaken. Bulajic et al. [6] and Yaroschyk et al. [9] have shown that
calibration-free methods require complex algorithms to generate predicted spectra. In
order to examine a large wavelength range using a single spectrum, the resolution is
necessarily reduced due to the coarser grating required. Identification of emission lines
in complicated spectra can be problematic, resulting in inaccurate spectral interpretation
that can lead to errors in compositional analysis.
3
This preliminary study was conducted to ascertain the viability of combining a
relatively inexpensive quadrupole mass spectrometer with a LIBS system to resolve
ambiguities that may exist within the LIBS spectrum.
1.2 Laser Ablation/Ionisation Mass spectrometry
Mass spectrometry (MS) has previously been coupled with laser ablation as a sampling
method in Laser Ablation-Inductively Coupled Plasma-Mass Spectrometry (LA-ICP-
MS) [10-13] and Matrix Assisted Laser Desorption-Ionisation (MALDI) [14,15] and
also as an ionisation and sampling source for Laser Ablation Mass Spectrometry
(LAMS) / Laser Ionisation Mass Spectrometry (LIMS) [16]. LIMS and LAMS are
usually performed using expensive Time of Flight (ToF) MS analysis to overcome
difficulties in synchronisation of a mass scan to the transient nature of a laser ablation
event. Recent developments associated with the quadrupole mass spectrometer offer the
potential for this small, relatively inexpensive instrument to be used as a flexible
analytical tool.
Neutral species generated from laser ablation of polymers have been investigated [17]
using quadrupole mass spectrometry. Ion energetics of ZnTe laser ablation plumes
were measured using both ToF and quadrupole MS; the two techniques yielding
comparable results [18]. Previous research combining results from simultaneous LIBS
and MS have been restricted to the use of ToF analysis [19]. Several groups have
applied a quadrupole mass filter to LIMS with varying degrees of success. Kuzuya et
al. [20] employed a quadrupole mass filter to monitor the ion signals produced from
laser ablation of metals, metal alloys and ceramics, obtaining reproducible spectra with
less than 1% standard deviation in ion signal.
In this study we use a commercially available 300 amu MicroVision Plus Residual Gas
Analyser (RGA) supplied by MKS Spectra.
4
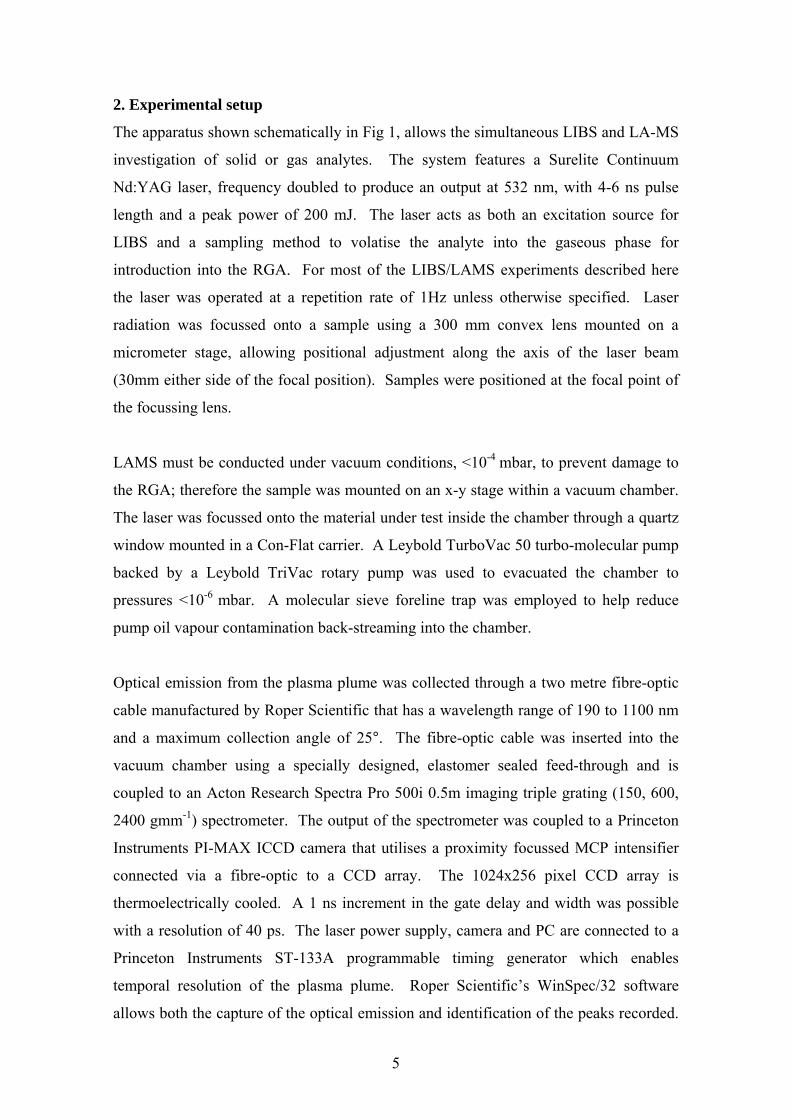
2. Experimental setup
The apparatus shown schematically in Fig 1, allows the simultaneous LIBS and LA-MS
investigation of solid or gas analytes. The system features a Surelite Continuum
Nd:YAG laser, frequency doubled to produce an output at 532 nm, with 4-6 ns pulse
length and a peak power of 200 mJ. The laser acts as both an excitation source for
LIBS and a sampling method to volatise the analyte into the gaseous phase for
introduction into the RGA. For most of the LIBS/LAMS experiments described here
the laser was operated at a repetition rate of 1Hz unless otherwise specified. Laser
radiation was focussed onto a sample using a 300 mm convex lens mounted on a
micrometer stage, allowing positional adjustment along the axis of the laser beam
(30mm either side of the focal position). Samples were positioned at the focal point of
the focussing lens.
LAMS must be conducted under vacuum conditions, <10-4 mbar, to prevent damage to
the RGA; therefore the sample was mounted on an x-y stage within a vacuum chamber.
The laser was focussed onto the material under test inside the chamber through a quartz
window mounted in a Con-Flat carrier. A Leybold TurboVac 50 turbo-molecular pump
backed by a Leybold TriVac rotary pump was used to evacuated the chamber to
pressures <10-6 mbar. A molecular sieve foreline trap was employed to help reduce
pump oil vapour contamination back-streaming into the chamber.
Optical emission from the plasma plume was collected through a two metre fibre-optic
cable manufactured by Roper Scientific that has a wavelength range of 190 to 1100 nm
and a maximum collection angle of 25°. The fibre-optic cable was inserted into the
vacuum chamber using a specially designed, elastomer sealed feed-through and is
coupled to an Acton Research Spectra Pro 500i 0.5m imaging triple grating (150, 600,
2400 gmm-1) spectrometer. The output of the spectrometer was coupled to a Princeton
Instruments PI-MAX ICCD camera that utilises a proximity focussed MCP intensifier
connected via a fibre-optic to a CCD array. The 1024x256 pixel CCD array is
thermoelectrically cooled. A 1 ns increment in the gate delay and width was possible
with a resolution of 40 ps. The laser power supply, camera and PC are connected to a
Princeton Instruments ST-133A programmable timing generator which enables
temporal resolution of the plasma plume. Roper Scientific’s WinSpec/32 software
allows both the capture of the optical emission and identification of the peaks recorded.
5

All experiments were conducted with a spectrometer gain of 100, 10 spectrum
accumulations, camera gate delay of 600 ns, camera gate width of 800 ns and
spectrometer input slit width of 70 µm. The x-y stage was used to move to a fresh spot
on the sample for each analysis.
Figure 1: Schematic diagram of the combined LIBS/LAMS apparatus.
Analysis of the gaseous species within the vacuum chamber was conducted using an
MKS MicroVision Plus 300 amu Residual Gas Analyser (RGA) with integer mass
resolution. The RGA was mounted vertically at the base of the chamber and so was not
in direct line-of-sight of the laser ablation plume; therefore the RGA does not sample
the plume directly, but rather analyses the residual gases present in the chamber and
monitors their respective partial pressures. The RGA is controlled using MKS
Instruments’ Process Eye Professional v5.22.0 software and the data obtained
manipulated using MKS Instruments’ Recall v5.22.0 software.
The RGA possesses an integral hot filament ion source which ordinarily ionises neutral
species by electron bombardment for subsequent analysis. These ions are separated
according to their mass to charge ratio (m/z) by the quadrupole mass analyser.
Externally ionised particles are repelled by the RGA’s ion optics; removal of the ion
optics and filament ion source enables analysis of ions created during the ablation event.
For any given ablation event, the RGA may be configured to analyse either the neutral
6
species or the ions within the plume. The RGA was programmed to scan repeatedly
through a range of m/z ratios; an increase in the partial pressures of the gaseous species
inside the chamber was observed as the laser was fired. It is inferred that the increased
gas load was due to the ablation of the target material, and thus may be analysed to
determine the composition of the sample.
When recording over large mass ranges the scan time of the RGA is long (10.52
seconds for a full 300 amu scan) compared with the transient laser ablation event. To
increase the scan frequency and accuracy only masses known to be of interest were
monitored. Initial background spectra were obtained before laser ablation of the sample
was carried out. 100 laser pulses were fired and changes in the partial pressures of the
masses of interest recorded over time. It was assumed that the sample materials used
were homogeneous and that no compositional change with depth due to laser drilling
occurred. All mass spectra were captured using a gain of 20 k on the Faraday cup
detector, minimum detectable partial pressure 2.7 x 10⁻¹¹mbar.
Initial LIBS/LAMS investigations were conducted in order to determine whether the
RGA was able to accurately discern the isotopic ratio of copper and validate the use of
the system. The optimum repetition rate for the laser was found by performing LAMS
of copper at various laser pulse frequencies. Simultaneous LIBS/LAMS analysis of
Fecralloy (Fe 72.8%, Cr 22%, Al 5%, Zr trace, Y trace) was conducted to determine
whether either technique can be employed to detect trace amounts of minor elements in
a major element matrix.
7
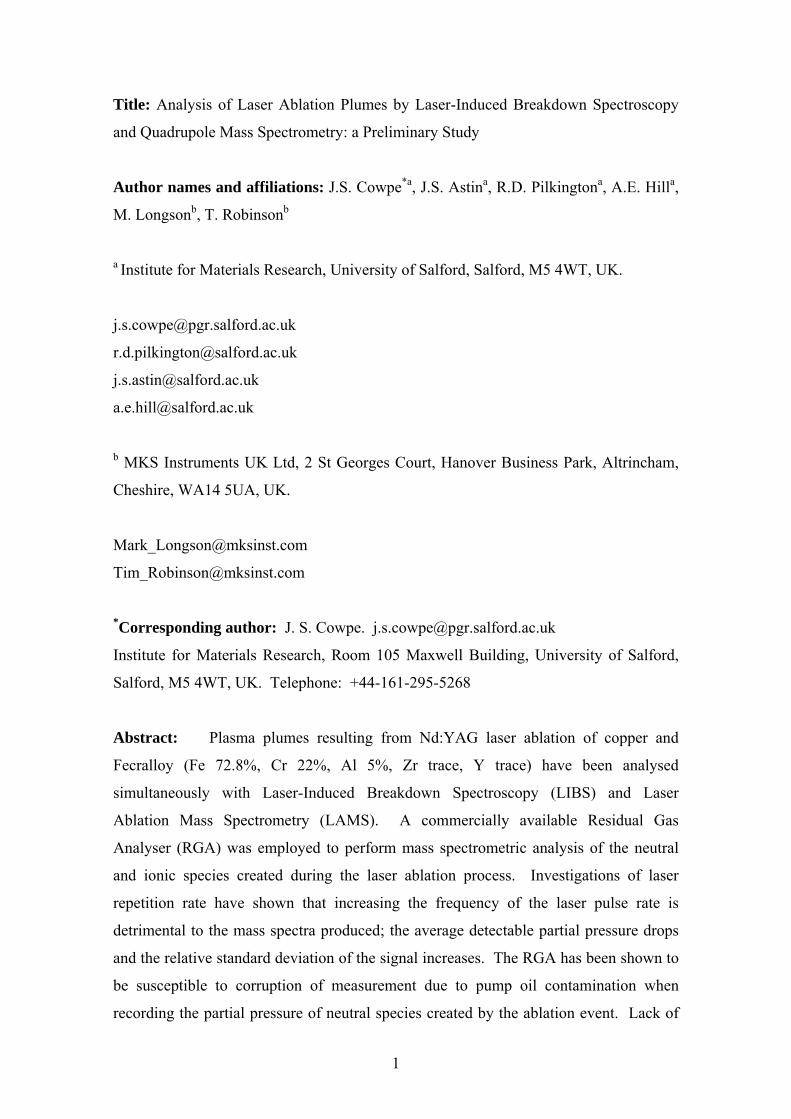
3. Results and Discussion
3.1.1 Initial copper observations- LIBS
0
100
200
300
400
500
600
700
800
218 219 220 221 222 223
wavelength (nm)
coun
ts (A
.U.)
captured spectrumCu ICuII
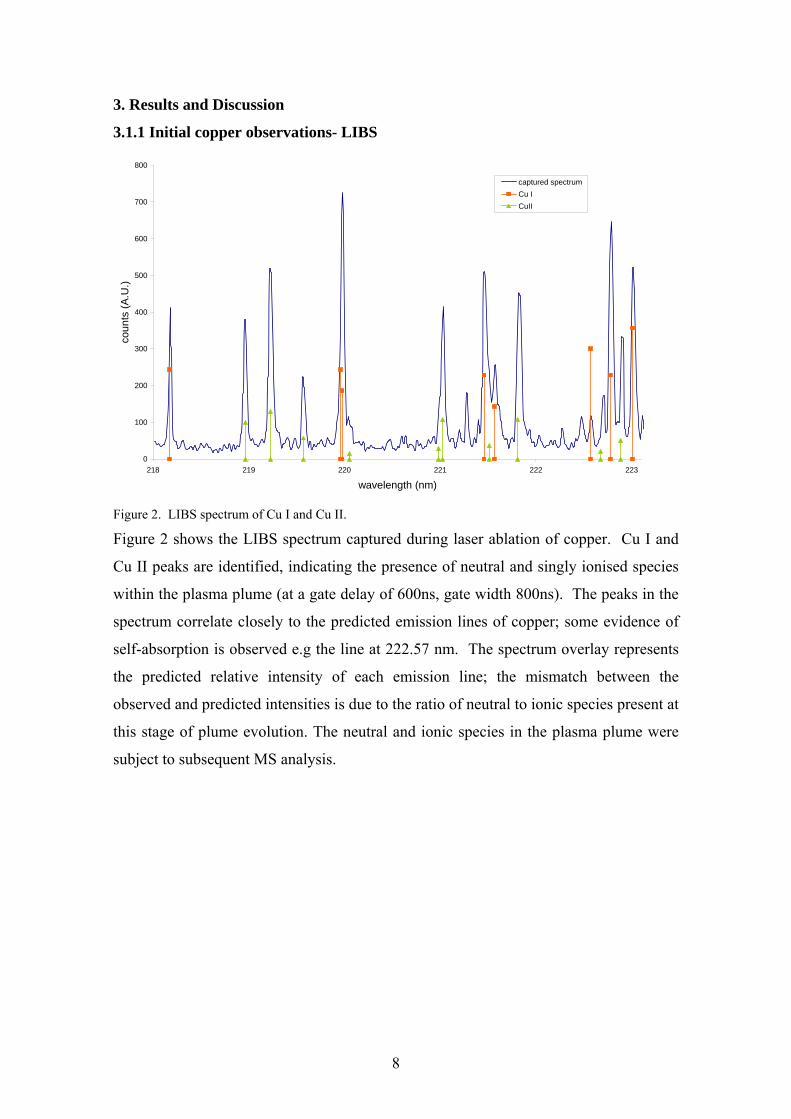
Figure 2. LIBS spectrum of Cu I and Cu II.
Figure 2 shows the LIBS spectrum captured during laser ablation of copper. Cu I and
Cu II peaks are identified, indicating the presence of neutral and singly ionised species
within the plasma plume (at a gate delay of 600ns, gate width 800ns). The peaks in the
spectrum correlate closely to the predicted emission lines of copper; some evidence of
self-absorption is observed e.g the line at 222.57 nm. The spectrum overlay represents
the predicted relative intensity of each emission line; the mismatch between the
observed and predicted intensities is due to the ratio of neutral to ionic species present at
this stage of plume evolution. The neutral and ionic species in the plasma plume were
subject to subsequent MS analysis.
8
3.1.2 Initial copper observations- MS
1.00E-09
1.00E-08
1.00E-07
1.00E-06
0 100 200 300 400 500 600
Scan Number
Part
ial P
ress
ure
(mba
r)
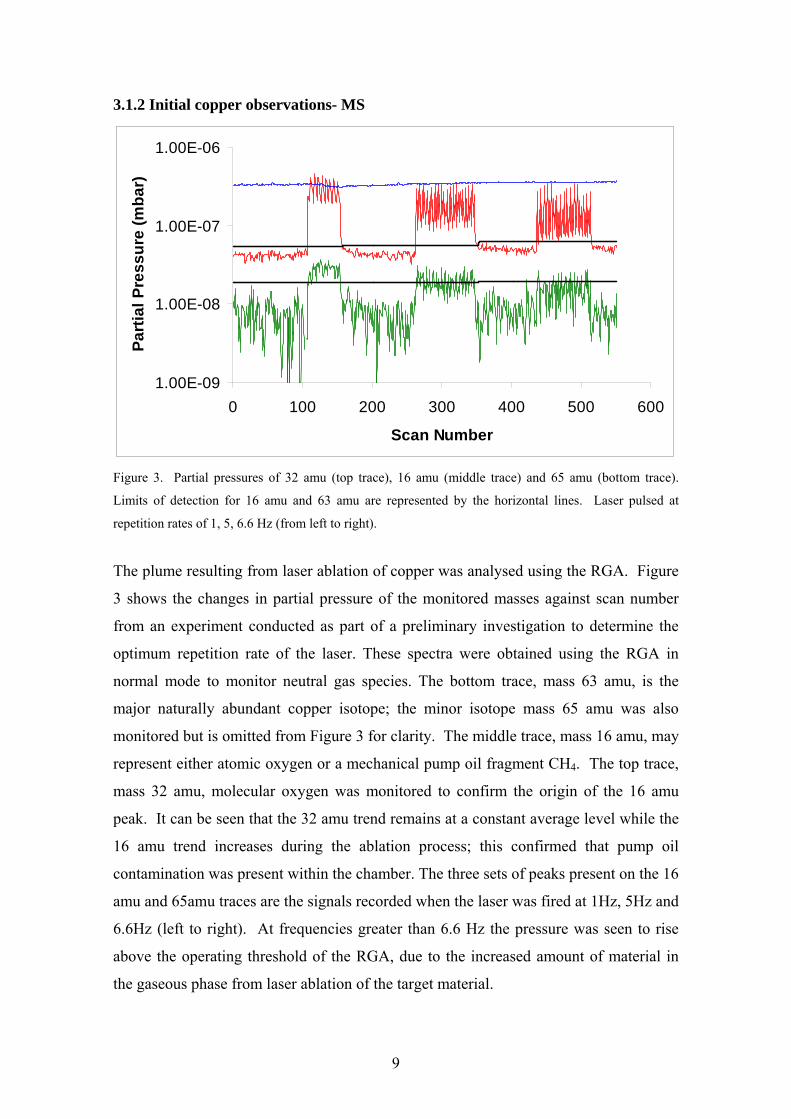
Figure 3. Partial pressures of 32 amu (top trace), 16 amu (middle trace) and 65 amu (bottom trace).
Limits of detection for 16 amu and 63 amu are represented by the horizontal lines. Laser pulsed at
repetition rates of 1, 5, 6.6 Hz (from left to right).
The plume resulting from laser ablation of copper was analysed using the RGA. Figure
3 shows the changes in partial pressure of the monitored masses against scan number
from an experiment conducted as part of a preliminary investigation to determine the
optimum repetition rate of the laser. These spectra were obtained using the RGA in
normal mode to monitor neutral gas species. The bottom trace, mass 63 amu, is the
major naturally abundant copper isotope; the minor isotope mass 65 amu was also
monitored but is omitted from Figure 3 for clarity. The middle trace, mass 16 amu, may
represent either atomic oxygen or a mechanical pump oil fragment CH4. The top trace,
mass 32 amu, molecular oxygen was monitored to confirm the origin of the 16 amu
peak. It can be seen that the 32 amu trend remains at a constant average level while the
16 amu trend increases during the ablation process; this confirmed that pump oil
contamination was present within the chamber. The three sets of peaks present on the 16
amu and 65amu traces are the signals recorded when the laser was fired at 1Hz, 5Hz and
6.6Hz (left to right). At frequencies greater than 6.6 Hz the pressure was seen to rise
above the operating threshold of the RGA, due to the increased amount of material in
the gaseous phase from laser ablation of the target material.
9

The horizontal lines across the 16amu and 63 amu traces represent the limits of
detectable signal (LODS) for the given masses at their respective pressures. A
detectable signal is defined as one being greater than 3 times the standard deviation of
the background signal (laser not firing). Any signal lower than this cannot be resolved
from the background noise. The background steadily rises after each run of laser shots
due to the increased amount of gas phase ablated material in the chamber. The LODS
was recalculated before each experiment to account for the variance in background
level.
It can be seen that increasing the repetition rate of the laser is detrimental to the signal
obtained. The mean detected partial pressure drops and the relative standard deviation
of the signal increases, as shown in Figure 4.
16 amu
0.0E+00
5.0E-08
1.0E-07
1.5E-07
2.0E-07
2.5E-07
3.0E-07
3.5E-07
1 5 6.6
Frequency (Hz)
Pres
sure
(mba
r)
0
10
20
30
40
50
60
Rel
ativ
e SD
(%)
63 amu
0.0E+00
5.0E-08
1.0E-07
1.5E-07
2.0E-07
2.5E-07
3.0E-07
1 5 6.6
Frequency (Hz)
Pres
sure
(mba
r)
0
5
10
15
20
25
30
35
40
Rel
ativ
e SD
(%)
Figure 4. Mean detected partial pressure and relative standard deviation versus laser repetition rate, 16
amu (left) and 63 amu (right).
The 63 amu trace (Figure 3) is barely above the defined limit of detection with the laser
pulsing at 6.6Hz. Operating the laser at higher pulse frequencies effectively lowers the
sensitivity of the RGA. The rise in background signal on the 16 and 63 amu traces is
due to the increased amount of each gaseous phase within the chamber as a result of the
laser ablation process. The partial pressure of mass 16 features a ‘saw tooth’ profile
which becomes more evident with increased laser pulse frequency. It is believed that
this is due to a lack of synchronisation between the short laser pulse and the RGA mass
scan (in this case 0.87 s at a minimum detectable partial pressure of 2.0 x 10⁻¹¹ mbar).
10
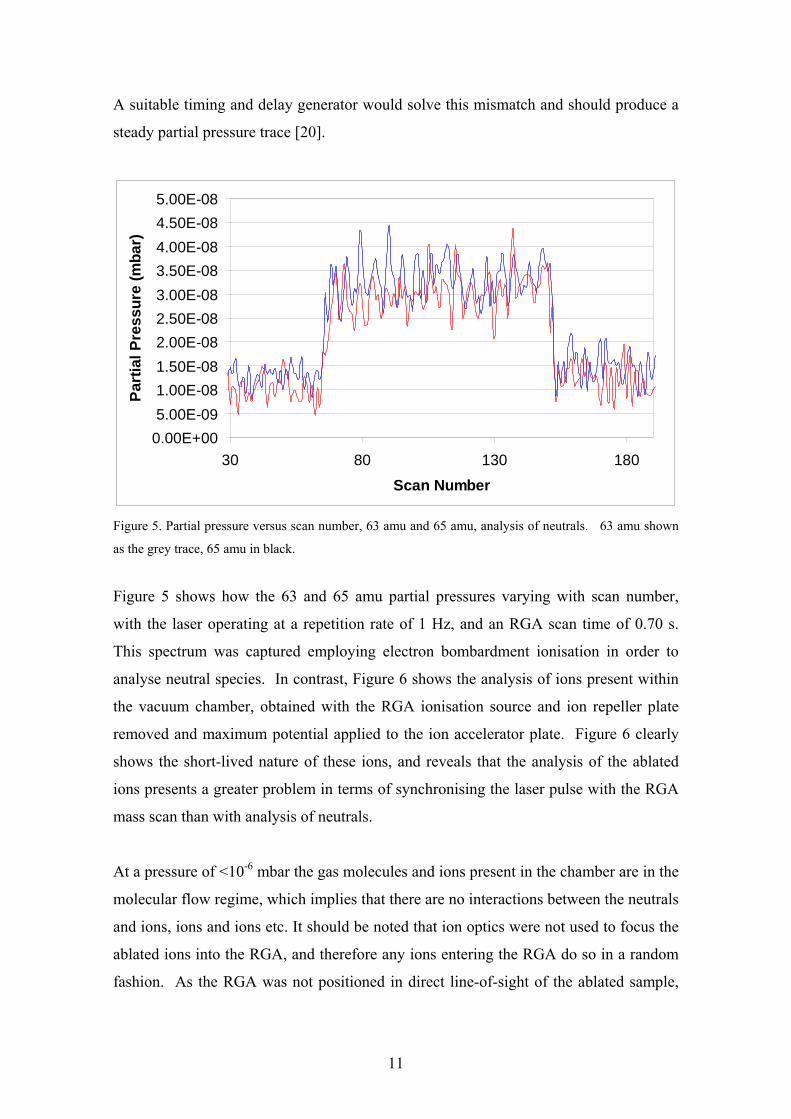
A suitable timing and delay generator would solve this mismatch and should produce a
steady partial pressure trace [20].
0.00E+005.00E-091.00E-081.50E-082.00E-082.50E-083.00E-083.50E-084.00E-084.50E-085.00E-08
30 80 130 180
Scan Number
Part
ial P
ress
ure
(mba
r)
Figure 5. Partial pressure versus scan number, 63 amu and 65 amu, analysis of neutrals. 63 amu shown
as the grey trace, 65 amu in black.
Figure 5 shows how the 63 and 65 amu partial pressures varying with scan number,
with the laser operating at a repetition rate of 1 Hz, and an RGA scan time of 0.70 s.
This spectrum was captured employing electron bombardment ionisation in order to
analyse neutral species. In contrast, Figure 6 shows the analysis of ions present within
the vacuum chamber, obtained with the RGA ionisation source and ion repeller plate
removed and maximum potential applied to the ion accelerator plate. Figure 6 clearly
shows the short-lived nature of these ions, and reveals that the analysis of the ablated
ions presents a greater problem in terms of synchronising the laser pulse with the RGA
mass scan than with analysis of neutrals.
At a pressure of <10-6 mbar the gas molecules and ions present in the chamber are in the
molecular flow regime, which implies that there are no interactions between the neutrals
and ions, ions and ions etc. It should be noted that ion optics were not used to focus the
ablated ions into the RGA, and therefore any ions entering the RGA do so in a random
fashion. As the RGA was not positioned in direct line-of-sight of the ablated sample,
11

the number of ions entering the RGA is small compared to the number of ions colliding
with the chamber walls and subsequently neutralised.
0.00E+00
2.00E-08
4.00E-08
6.00E-08
8.00E-08
1.00E-07
1.20E-07
1.40E-07
1.60E-07
50 100 150 200 250
Scan Number
Part
ial P
ress
ure
(mba
r)
Mass 63Mass 65
Figure6. Partial pressure versus scan number, 63 amu and 65 amu, analysis of ions. 63 amu shown as the
grey trace, 65 amu in black.
0.00
10.00
20.00
30.00
40.00
50.00
60.00
70.00
80.00
copper neutral ave neutralpeak
ion ave ion peak
% 6365
Figure 7. 63 amu and 65 amu- a comparison of the measured neutral and ion signals to the natural
abundance of the two copper isotopes. Average signals (neutral ave, ion ave) and peak signals (neutral
peak, ion peak) are shown.
12

Figure 7 compares the natural abundance of the two isotopes of copper [21] to the
relative percentage of mass 63 amu and mass 65 amu observed when analysing either
the neutral or ionic species produced by laser ablation of copper. Two different
methods were employed to determine the relative abundance of 63 amu and 65 amu
species within the vacuum chamber; measuring the average partial pressure signal of
each mass during laser firing, or maximum peak signal for each mass during laser
firing. These two methods were applied to the analysis of neutral and ionic species. It
can be seen that the average ion signal provides the closest correlation to the natural
abundance of the two copper isotopes. A proposed reason for this mismatch in the
neutral signals may be that pump oil fragments provide extra contributions to the partial
pressures recorded for 63 and 65 amu. As the quadrupole has integer mass resolution it
is extremely difficult to ascertain the true nature of the particles contributing to the
partial pressure scans of 63 and 65 amu with the current experimental configuration.
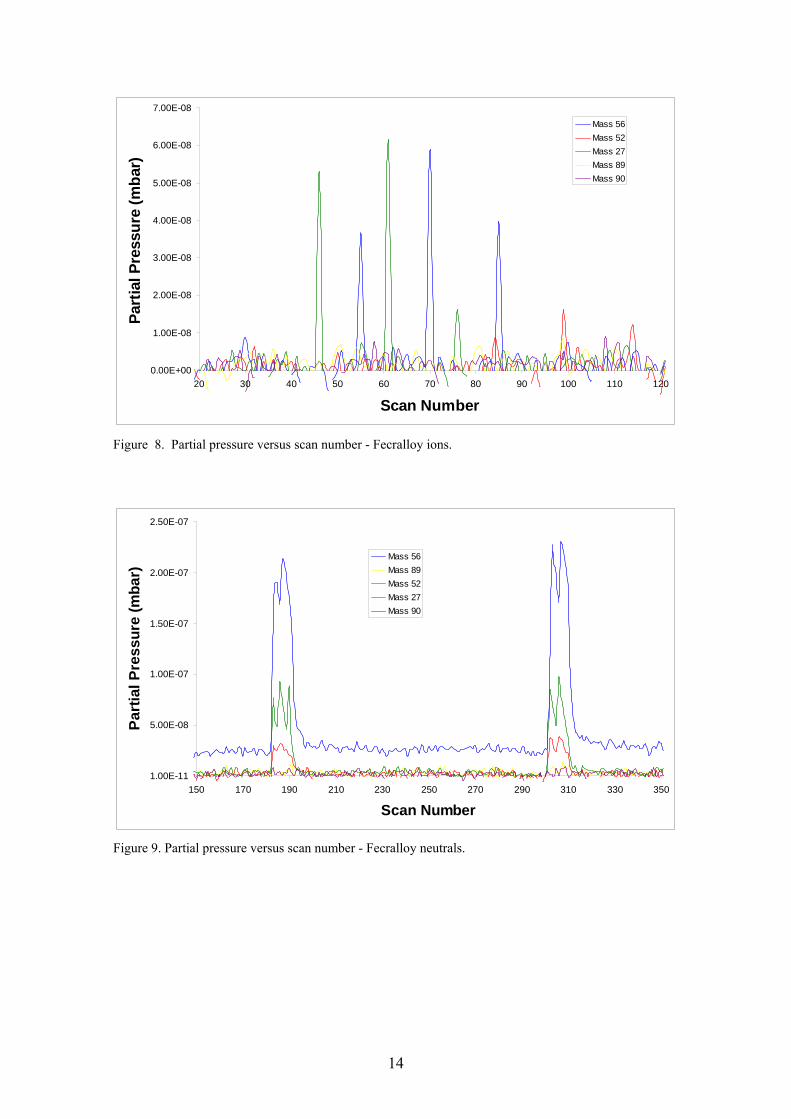
3.2 Fecralloy
Fecralloy is an alloy of iron (72.8%), chromium (22%), aluminium (5%), and trace
amounts of zirconium and yttrium (≈0.1%). Simultaneous LIBS/LAMS analysis of
Fecralloy was conducted to determine whether either technique would detect small trace
amounts of minor elements within a major element matrix. The m/z peaks monitored
using LAMS were: Fe - 56 amu; Cr - 52 amu; Al – 27 amu; Z - 89 amu and Y - 90 amu.
Figures 8 and 9 show the partial pressures versus scan number for Fecralloy ions and
neutrals respectively. It can be seen that the iron, aluminium and chromium peaks are
well resolved whilst the minor elements, zirconium and yttrium, are just discernable
above the background noise.
Figure 10 shows the LIBS spectrum of Fecralloy captured in the 301 - 313.5 nm range
using the 2400 gmm-1 diffraction grating. This wavelength range was chosen as all the
components of Fecralloy have strong emission lines within this region. The iron,
aluminium and chromium are clearly seen, whilst the zirconium and yttrium cannot be
resolved above the background noise. Due to matrix effects and self absorption within
the plasma plume, the accurate composition of Fecralloy cannot be determined from the
LIBS spectrum without the use of a set of calibration standards.
13
0.00E+00
1.00E-08
2.00E-08
3.00E-08
4.00E-08
5.00E-08
6.00E-08
7.00E-08
20 30 40 50 60 70 80 90 100 110 120
Scan Number
Part
ial P
ress
ure
(mba
r)Mass 56Mass 52Mass 27Mass 89Mass 90
Figure 8. Partial pressure versus scan number - Fecralloy ions.
1.00E-11
5.00E-08
1.00E-07
1.50E-07
2.00E-07
2.50E-07
150 170 190 210 230 250 270 290 310 330 350
Scan Number
Part
ial P
ress
ure
(mba
r)
Mass 56Mass 89Mass 52Mass 27Mass 90
Figure 9. Partial pressure versus scan number - Fecralloy neutrals.
14

0
1000
2000
3000
4000
5000
6000
7000
301 306 311
wavelength (nm)
coun
ts (A
.U.) spectrum
CrFeYZrAl
Figure 10. LIBS spectrum of Fecralloy.
0
10
20
30
40
50
60
70
80
atoms ions actual
%27 amu52 amu56 amu
Fig 11. Percentage composition of major elements of Fecralloy as determined from neutrals (left), and
ions (middle) compared to manufacturer’s given composition (right).
Figure 11 shows the percentage composition of Fecralloy as determined by monitoring
the neutral and ionic ablation species, compared to the manufacturers’ stated
composition. If the ratio of iron to chromium is considered, then it can be seen that the
ion signal ratio is close to that of the manufacturers’ specification (approximately
15

3.5:1), whereas the neutral signal ratio (approx 6:1) is greater by almost a factor of 2.
The aluminium percentages as determined from both neutral and ion species analysis
show a large discrepancy when compared with the actual stated composition. The
perceived elevated percentage of aluminium may be due to the fact that the natural
oxide of Fecralloy is Al2O3 (alumina) [22], and this surface layer will contribute to the
disproportionate amount of aluminium recorded.
4. Conclusion
Although not situated in an optimum sampling position, the RGA is able to detect small
concentrations of material that the LIBS system has difficulty detecting. By
investigating laser ablation of copper and Fecralloy it has been shown that the direct
analysis of the ions produced by the ablation process yields a more accurate
compositional determination than analysis of the neutral species.
The RGA was found to be too sensitive to chamber contamination when applied to
analysis of neutral species. Pump oil molecules present within the chamber are ionised
by the RGA ion source along with the ablated analyte neutrals. These high molecular
weight long chain hydrocarbons have complex cracking patterns that can contribute a
significant increase in the partial pressure signals recorded for a large range of masses.
In the case of the 2 peaks that were monitored during the copper study (63 and 65 amu),
it is now believed that the inclusion of C5H3+ and C5H5
+ pump oil fragments has led to
erroneous results when using the RGA with its associated hot filament ion source. Even
though a fore-line oil filter was incorporated in the system it is known that oil molecules
can still backstream into the vacuum chamber. These molecules tend to adsorb on to all
the internal chamber surfaces; at a pressure of 10-6 mbar, there are approximately 106
molecules adsorbed on the walls of the system for each molecule in the gas phase [23].
During the ablation process, the expanding plume promotes electron/ion-stimulated
desorption of oil contamination from interior chamber surfaces, and it is these
molecules that are subsequently ionised and then analysed by the RGA. The limitations
imposed by the relatively slow scan speed of the quadrupole mass spectrometer could
be overcome by using an expensive Time of Flight mass spectrometer. The
synchronisation of the RGA mass scan to the transient laser pulse has to be addressed if
quadrupole LAMS is to be a used as an accurate, reproducible analytical technique.
16
LIBS was found to be unable to detect trace amount of zirconium and yttrium in
Fecralloy, but proved to be unaffected by the pump oil vapour contamination in the
process chamber, providing unambiguous elemental analysis of the major components
of Fecralloy.
References:
[1] J.M. Vadillo, J.J. Laserna, Laser-induce plasma spectrometry: truly a surface
analytical tool, Spectrochimica Acta Part B 59 (2004) 147-161.
[2] D.A. Rwak, B.C. Castle, B.W. Smith, J.D. Winefordner, Recent Trends and the
Future of Laser-Induced Plasma Spectroscopy, Trends in Analytical Chemistry 17
(1998) 453-461.
[3] J. Vrenegor, R. Noll, V. Sturm, Investigation of matrix effects in laser-induced
breakdown spectroscopy plasmas of high-alloy steel for matrix and minor elements,
Spectrochimica Acta Part B 60 (2005) 1083-1091.
[4] A.M. El Sherbini, TH. M. El Sherbini, H. Hegazy, G. Cristoferetti, S. Legnaioli,
V. Palleschi, L. Pardini, A. Salvetti, E. Tognoni, Evaluation of self-absorption
coefficients of aluminium emission lines in laser-induced breakdown spectroscopy
measurements, Spectrochimica Acta Part B 60 (2005) 1573-1579.
[5] V. Lazic, R. Barbini, F. Calao, R. Fantoni, A. Palucci, Self-absorption model in
quantitative laser induced breakdown spectroscopy measurements on soils and
sediments, Spectrochimica Acta Part B 56 (2001) 807-820.
[6] D. Bulajic, M. Corsi, G. Cristoferetti, S. Legnaioli, V. Palleschi, A. Salvetti, E.
Tognoni, A procedure for correcting self absorption in calibration free-laser induced
breakdown spectroscopy, Spectrochimica Acta Part B 57 (2002) 339-353.
[7] B. Sallé, D.A. Cremers, S. Maurice, R.C. Wiens, Laser-induced breakdown
spectroscopy for space exploration applications: Influence of the ambient pressure on
the calibration curves prepared from soil and clay samples, Spectrochimica Acta Part B
60 (2005) 479-490.
17

[8] P. Stavropoulos, C. Palagas, G.N. Angelopoulos, D.N. Papamantellos, S. Couris,
Calibration Measurements in laser-induced breakdown spectroscopy using nanosecond
and picosecond lasers, Spectrochimica Acta Part B 59 (2004) 1885-1892.
[9] P. Yaroshchyk, D. Body, R.J.S. Morrison, B.L. Chadwick, A semi-quantitative
standard-less analysis method for laser-induced breakdown spectroscopy,
Spectrochimica Acta Part B 61 (2006) 200-209.
[10] J. S. Becker, Applications of inductively coupled plasma mass spectrometry and
laser ablation inductively coupled plasma mass spectrometry in materials
science, Spectrochimica Acta Part B 57 (2002) 1805-1820.
[11] C. J. Scadding, R. J. Watling, A. G. Thomas, The potential of using laser
ablation inductively coupled plasma time of flight mass spectrometry (LA-ICP-TOF-
MS) in the forensic analysis of micro debris, Talanta 67 (2005) 414-424.
[12] M. Bi, A.M. Ruiz, I. Gornushkin, B.W. Smith and J. D. Winefordner, Profiling
of patterned metal layers by laser ablation inductively coupled plasma mass
spectrometry (LA-ICP-MS) , Applied Surface Science 158 (2000) 197-204.
[13] R. Bugoi, B. Constantinescu, C. Neelmeijer, F. Constantin, The potential of
external IBA and LA-ICP-MS for obsidian elemental characterization, Nuclear
Instruments and Methods in Physics Research Section B 226 (2004) 136-146.
[14] J. J. Corr, P. Kovarik, B. B. Schneider, J. Hendrikse, A. Loboda, T. R. Covey,
Design Considerations for High Speed Quantitative Mass Spectrometry with MALDI
Ionization , Journal of the American Society for Mass Spectrometry 17 (2006) 1129-
1141.
[15] Z. Liu, K. L. Schey, Optimization of a MALDI TOF-TOF mass spectrometer for
intact protein analysis, Journal of the American Society for Mass Spectrometry 16
(2005) 482-490.
[16] L. Matus, M. Seufert, K. P. Jochum, Ion yield of a laser plasma mass
18

19
spectrometer, International Journal of Mass Spectrometry and Ion Processes 84 (1988)
101-111.
[17] S. Lazare, W. Guan, D. Drillhole, High sensitivity quadrupole mass
spectrometry of neutrals sputtered by UV laser ablation of polymers, Applied Surface
Science 96-98 (1996) 605-610.
[18] M.C. Kelly, G.G. Gomlak, V.G. Panayotov, C. Cresson, J. Rodney, B.D.
Koplitz, Energetics of pulsed laser ablation species as determined by quadrupole and
time-of-flight mass spectrometry, Applied Surface Science 127-129 (1998) 988-993.
[19] C.C Garcia, J.M Vadillo, S. Palanco, J. Ruiz, J.J. Laserna, Comparative analysis
of layered materials using laser induced plasma spectroscopy and laser-ionisation time-
of-flight mass spectrometry, Spectrochimica Acta Part B 56 (2001) 923-931.
[20] M. Kuzuya, Y. Ohoka, H. Katoh, H. Sakanashi, Application of a quadrupole
mass filter to laser ionisation mass spectrometry: synchronisation between the laser
pulse and the mass scan, Spectrochimica Acta Part B 53 (1998) 123-129.
[21] E. de Hoffmann, V. Stroobant, Mass Spectrometry Principles and Applications,
second ed., John Wiley and Sons 2003. Table of Isotopic Abundances, 374-379.
[22] D. Naumenko, W. J. Quadakkers, A. Galerie, Y. Wouters and S. Jourdain,
Parameters affecting transient oxide formation on FeCrAl based foil and fibre materials,
Materials At High Temperatures 20 (2003) 287–293.
[23] J.L. de Segovia, A review of electron stimulated desorption processes
influencing the measurement of pressure or gas composition in ultra high vacuum
systems, Vacuum, 47 (1996) 333-340.