Embed Size (px)
Citation preview
ANALYSIS OF METALS AND ACID-LABILE SULFIDE IN PROTEINS
Antonio J. Pierik Technical University of Kaiserslautern Dept. of Chemistry
N
N
SN+
CH3
CH3
NCH
3
CH3
OC
N
C
CO
N
HR
O C
N
CH
C
ON
R
Cu2+
O
O
NN
NN
-O3S
-O3S
3
Fe2+
1. Introduction
A convenient way to study the metal centres in proteins is the application of spectroscopic
techniques. The EU practical training course on chemistry of metals in biological systems has lectures
focussing on various techniques: EXAFS, MCD, EPR, Mössbauer, NMR, etc. In all cases very
sophisticated methods for data acquisition and analysis are used. The (quantitative) interpretation of the
obtained results relies on an accurate determination of the number of metal ions in the protein and their
absolute concentration. The simple equation below shows that three variables are needed.
molecular mass of protein * metal conc. (mol/l)
no. metal ions/molecule =
protein concentration (mg/ml)
Reliable determination of each of the three variables in the above quotient is necessary. The
same applies for determination of the stoichiometry of prosthetic groups, acid-labile sulphide and
selenocysteine.
This hand-out contains a general introduction to the techniques used for quantification of
proteins (Chapter 2), molecular mass determination (Chapter 3), determination of metal (Chapter 4),
acid-labile sulphide content (Chapter 5), references (Chapter 6) and three protocols (Chapter 7). It is
impossible to cover the entire field of metal analysis. Therefore, I will pay particular attention to the
techniques used in the practical exercise. The limitations of the respective methods and some recent
developments will be outlined. For detailed information on analytical methods for determination of
cofactors the reader should refer to the biochemically-oriented literature on the proteins containing the
cofactor of interest. A screening of the cumulative indices of 'Methods in Enzymology' directs you to
analytical procedures for haem, B12, flavin, molybdopterin, PQQ, TPP, selenocysteine and FeMoco
determinations.
The practical exercise will familiarize you with the determination of the iron and acid-labile
sulphide content of an iron-sulphur protein from the anaerobic bacterium Clostridium symbiosum. This
brownish [Fe-S] protein catalyzes the dehydration of (R)-2-hydroxyglutaryl-CoA to (E)-glutaconyl-
CoA. It has been isolated by Mr. M. Hetzel, one of the participants (Philipps University, Marburg).
According to [91] the enzym contains 7.5 ± 0.3 non-heme Fe, 8.1 ± 0.4 acid labile sulphide ions and 1.0
± 0.1 FMN per αβ heterodimer. The Fe/S is arranged in two [4Fe-4S] clusters. Based on the DNA-
derived primary sequence [91] the molecular mass of the protein is 97017.5 Da (HgdA, α is 53982.8
Da, HgdB, β is 43034.7 Da [92-93]).We will measure the protein concentration with the microbiuret
method (Chapter 7.1.). Determination of the molecular mass will be omitted since the structural genes
have been sequenced. After determination of iron with ferene (Chapter 7.2.) and acid-labile sulphide
with the methylene blue method (Chapter 7.3.) the Fe and S2- / protein stoichiometry can be calculated
by substitution of the respective values in the equation. Detailed analytical procedures for the three
determinations have been given, all reagents have been prepared, the practical exercise merely involves
the 'Procedure' part. Comparison of your results with those of the other participants is useful. It is
convenient not only to calculate stoichiometries, but also to present molar extinction coefficients for the
Fe2+-ferene complex and methylene blue compound formed. In case of the micro-biuret method the
relevant parameters are reagent blank and absorbance per milligram protein.
If you have performed identical experiments in your laboratory, you might prefer not to
reproduce these experiments here. In that case I would suggest to substitute the determinations by an
experiment, which investigates the Fe2+-ferene or Cu2+-polypeptide ligation.
2. Quantification of protein
The bio-inorganic chemist is faced with the analysis of a highly complex chemical. The
composition and amino acid sequence of a protein is unique. This variability makes protein
quantification difficult. As our proteins of interest additionally contain metal ions or other prosthetic
groups further complications are anticipated.
A classification of methods for protein determination can be made, based on the part of the
protein giving rise to a quantitative response:
1. Elemental composition (nitrogen and carbon content)
2. Functional groups:
2A. Peptide-bond ((micro)-biuret and far ultraviolet absorbance)
2B. Amino acid side-chains (Lowry, BCA, Coomassie and 280 nm)
3. Amino acids (after hydrolysis)
4. Total protein (dry weight and turbidimetric)
════════════════════════════════════════════════
Amount needed Method(s)
(mg protein)
════════════════════════════════════════════════
>10 Dry weight & Kjehldahl nitrogen
0.1-2 (Micro-)Biuret & Amino acid analysis
0.01-0.1 Lowry & Bicinchoninic acid (Pierce test)
0.002-0.1 Coomassie (Bradford)
════════════════════════════════════════════════
2.1. Quantification of protein: Elemental composition
An average metalloprotein contains some 53% carbon, 20% oxygen, 17% nitrogen and 7%
hydrogen (m/m). The remainder is sulphur and metal. More exceptionally phosphorus or selenium is
present. Although the C/O/N/H content of individual proteins will vary, it is sufficiently constant to be
of use for the determination of the protein content. Due to the overwhelming presence of water in protein
preparations and the hygroscopic nature of proteins only carbon and nitrogen are useful. The sulphur
content of proteins is variable. One of the classic protein determinations is the Kjeldahl nitrogen
determination [1,78]. Absence of nitrogen contaminants (nucleic acids, ammonium salts and some
Good's buffers) is an obvious prerequisite. The amino acid composition and the content of nitrogen
containing prosthetic groups should be checked to verify the routinely used 6.25 conversion factor
[2,79]. Analysis of the total organic carbon content was found to be a sensitive and reliable method for
estimation of microgram quantities of protein [79]. Corrections for moderate glycosylation of the protein
and the presence of mM concentrations of carbon-containing buffers are small.
2.2. Quantification of protein: Functional groups
Proteins contain a number of functional groups which can be used to give a response in a
spectrophoto- or spectrofluorometric determination. A very obvious common property is the presence
of peptide bonds. The (micro)biuret [7-9] method and the methods based on the 190-205 nm [10,80]
absorbance make use of the ubiquitous peptide bonds. Nucleic acids, the variable aromatic amino acid
content and cofactors make the use of 190-205 nm absorbance subject to error. The frequently used
biuret reaction has fewer drawbacks. As the biuret reaction is believed to occur by coordination of one
copper ion by four deprotonated peptide bonds [11], it is chemically well-defined. This has been
experimentally verified for bovine serum albumin during a previous Training Course in Louvain-la-
Neuve.
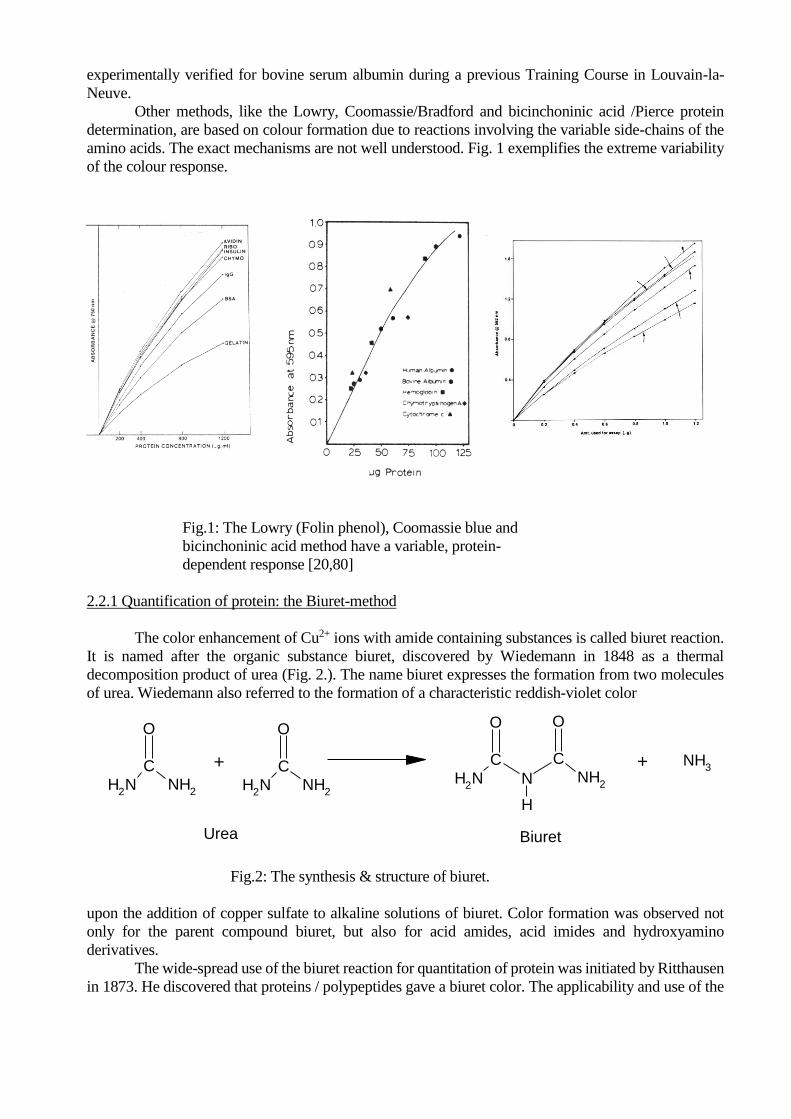
Other methods, like the Lowry, Coomassie/Bradford and bicinchoninic acid /Pierce protein
determination, are based on colour formation due to reactions involving the variable side-chains of the
amino acids. The exact mechanisms are not well understood. Fig. 1 exemplifies the extreme variability
of the colour response.
Fig.1: The Lowry (Folin phenol), Coomassie blue and
bicinchoninic acid method have a variable, protein-
dependent response [20,80]
2.2.1 Quantification of protein: the Biuret-method
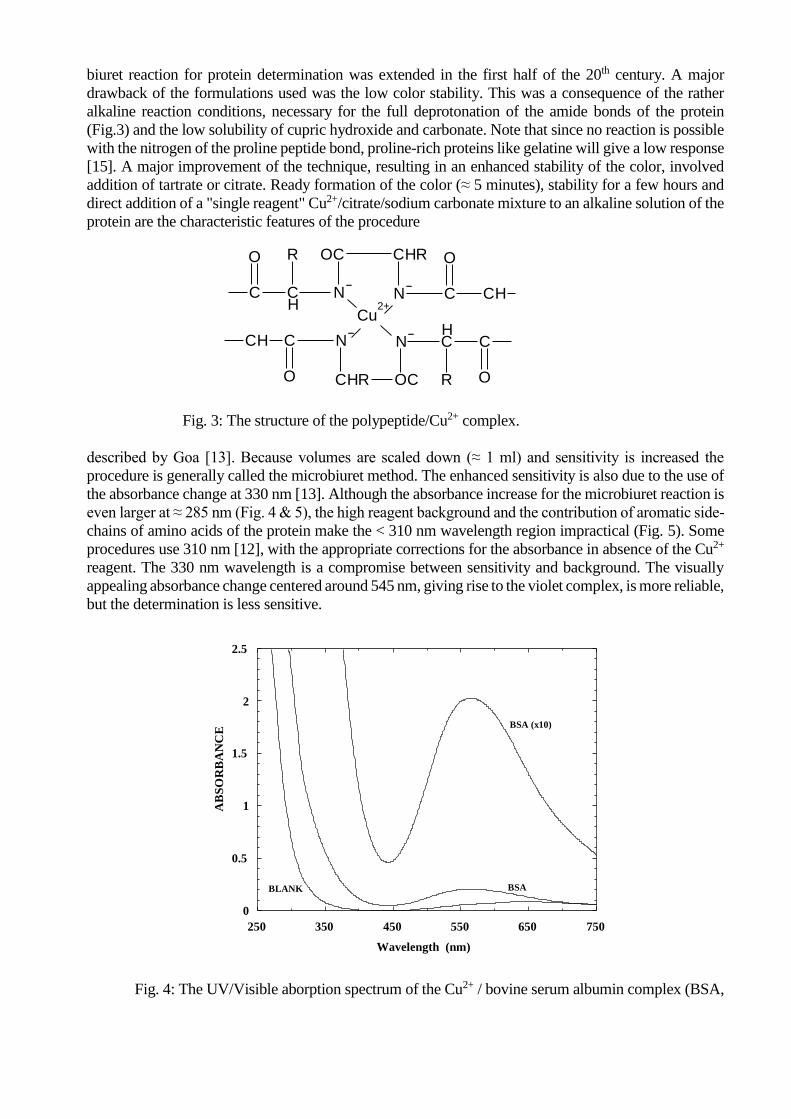
The color enhancement of Cu2+ ions with amide containing substances is called biuret reaction.
It is named after the organic substance biuret, discovered by Wiedemann in 1848 as a thermal
decomposition product of urea (Fig. 2.). The name biuret expresses the formation from two molecules
of urea. Wiedemann also referred to the formation of a characteristic reddish-violet color
Fig.2: The synthesis & structure of biuret.
upon the addition of copper sulfate to alkaline solutions of biuret. Color formation was observed not
only for the parent compound biuret, but also for acid amides, acid imides and hydroxyamino
derivatives.
The wide-spread use of the biuret reaction for quantitation of protein was initiated by Ritthausen
in 1873. He discovered that proteins / polypeptides gave a biuret color. The applicability and use of the
O
CNH
2NH
2
O
CNH
2NH
2
+
O
CNH
2
O
C
NNH2
H
NH3+
Urea Biuret
biuret reaction for protein determination was extended in the first half of the 20th century. A major
drawback of the formulations used was the low color stability. This was a consequence of the rather
alkaline reaction conditions, necessary for the full deprotonation of the amide bonds of the protein
(Fig.3) and the low solubility of cupric hydroxide and carbonate. Note that since no reaction is possible
with the nitrogen of the proline peptide bond, proline-rich proteins like gelatine will give a low response
[15]. A major improvement of the technique, resulting in an enhanced stability of the color, involved
addition of tartrate or citrate. Ready formation of the color (≈ 5 minutes), stability for a few hours and
direct addition of a "single reagent" Cu2+/citrate/sodium carbonate mixture to an alkaline solution of the
protein are the characteristic features of the procedure
Fig. 3: The structure of the polypeptide/Cu2+ complex.
described by Goa [13]. Because volumes are scaled down (≈ 1 ml) and sensitivity is increased the
procedure is generally called the microbiuret method. The enhanced sensitivity is also due to the use of
the absorbance change at 330 nm [13]. Although the absorbance increase for the microbiuret reaction is
even larger at ≈ 285 nm (Fig. 4 & 5), the high reagent background and the contribution of aromatic side-
chains of amino acids of the protein make the < 310 nm wavelength region impractical (Fig. 5). Some
procedures use 310 nm [12], with the appropriate corrections for the absorbance in absence of the Cu2+
reagent. The 330 nm wavelength is a compromise between sensitivity and background. The visually
appealing absorbance change centered around 545 nm, giving rise to the violet complex, is more reliable,
but the determination is less sensitive.
0
0.5
1
1.5
2
2.5
250 350 450 550 650 750
Wavelength (nm)
AB
SO
RB
AN
CE
BSA (x10)
BSABLANK
Fig. 4: The UV/Visible aborption spectrum of the Cu2+ / bovine serum albumin complex (BSA,
C
O
CH
N
R OC CHR
N C CH
O
C
O
CH
N
ROCCHR
NCCH
O
Cu2+
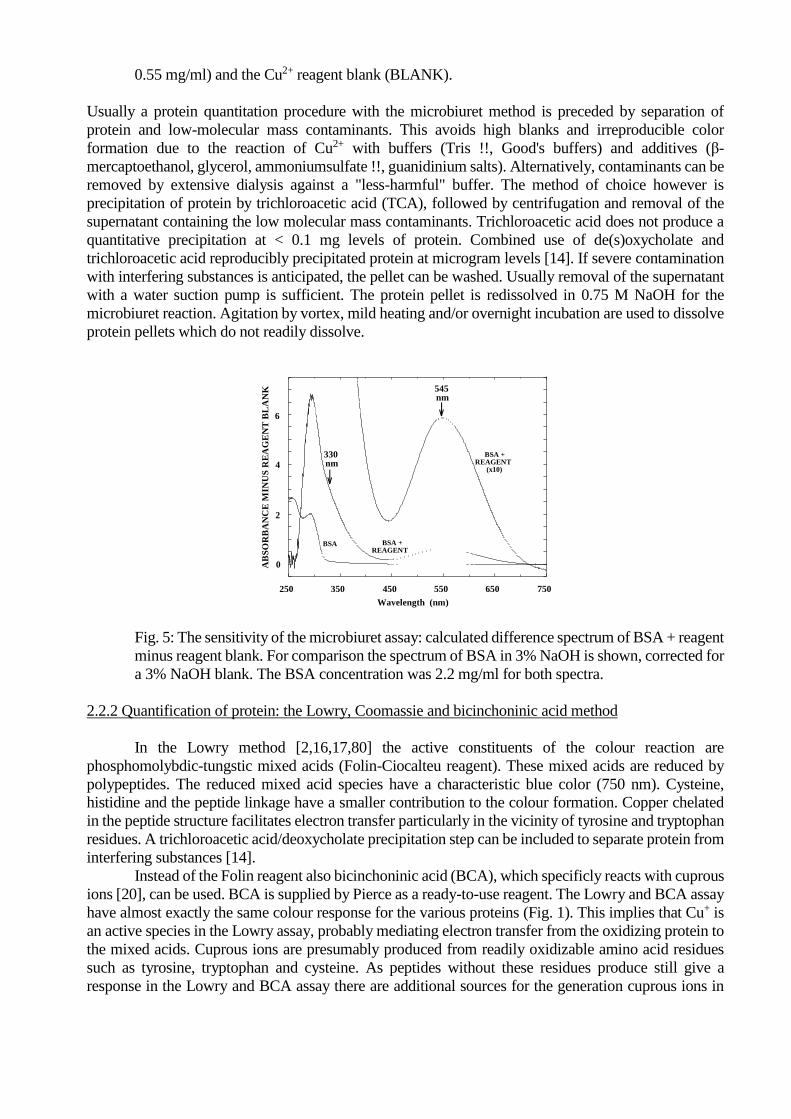
0.55 mg/ml) and the Cu2+ reagent blank (BLANK).
Usually a protein quantitation procedure with the microbiuret method is preceded by separation of
protein and low-molecular mass contaminants. This avoids high blanks and irreproducible color
formation due to the reaction of Cu2+ with buffers (Tris !!, Good's buffers) and additives (β-
mercaptoethanol, glycerol, ammoniumsulfate !!, guanidinium salts). Alternatively, contaminants can be
removed by extensive dialysis against a "less-harmful" buffer. The method of choice however is
precipitation of protein by trichloroacetic acid (TCA), followed by centrifugation and removal of the
supernatant containing the low molecular mass contaminants. Trichloroacetic acid does not produce a
quantitative precipitation at < 0.1 mg levels of protein. Combined use of de(s)oxycholate and
trichloroacetic acid reproducibly precipitated protein at microgram levels [14]. If severe contamination
with interfering substances is anticipated, the pellet can be washed. Usually removal of the supernatant
with a water suction pump is sufficient. The protein pellet is redissolved in 0.75 M NaOH for the
microbiuret reaction. Agitation by vortex, mild heating and/or overnight incubation are used to dissolve
protein pellets which do not readily dissolve.
250 350 450 550 650 750
0
2
4
6
AB
SO
RB
AN
CE
MIN
US
RE
AG
EN
T B
LA
NK
BSA BSA +REAGENT
BSA +REAGENT
(x10)
330nm
545nm
Wavelength (nm)
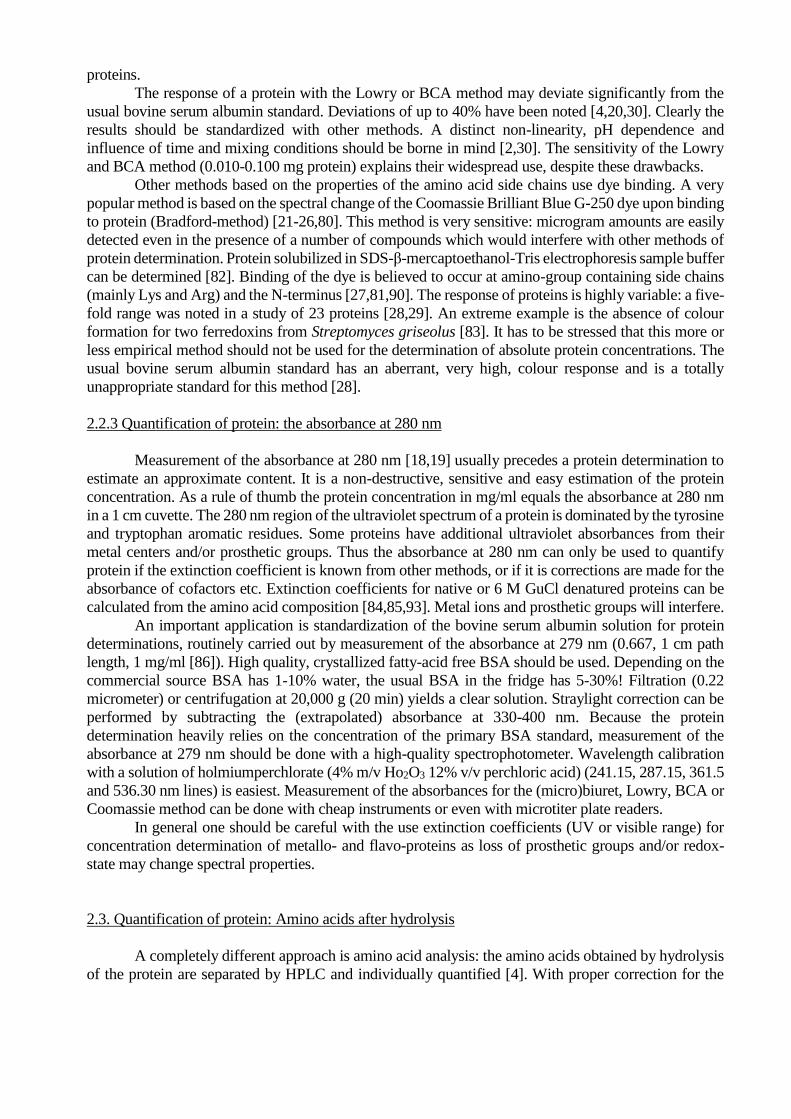
Fig. 5: The sensitivity of the microbiuret assay: calculated difference spectrum of BSA + reagent
minus reagent blank. For comparison the spectrum of BSA in 3% NaOH is shown, corrected for
a 3% NaOH blank. The BSA concentration was 2.2 mg/ml for both spectra.
2.2.2 Quantification of protein: the Lowry, Coomassie and bicinchoninic acid method
In the Lowry method [2,16,17,80] the active constituents of the colour reaction are
phosphomolybdic-tungstic mixed acids (Folin-Ciocalteu reagent). These mixed acids are reduced by
polypeptides. The reduced mixed acid species have a characteristic blue color (750 nm). Cysteine,
histidine and the peptide linkage have a smaller contribution to the colour formation. Copper chelated
in the peptide structure facilitates electron transfer particularly in the vicinity of tyrosine and tryptophan
residues. A trichloroacetic acid/deoxycholate precipitation step can be included to separate protein from
interfering substances [14].
Instead of the Folin reagent also bicinchoninic acid (BCA), which specificly reacts with cuprous
ions [20], can be used. BCA is supplied by Pierce as a ready-to-use reagent. The Lowry and BCA assay
have almost exactly the same colour response for the various proteins (Fig. 1). This implies that Cu+ is
an active species in the Lowry assay, probably mediating electron transfer from the oxidizing protein to
the mixed acids. Cuprous ions are presumably produced from readily oxidizable amino acid residues
such as tyrosine, tryptophan and cysteine. As peptides without these residues produce still give a
response in the Lowry and BCA assay there are additional sources for the generation cuprous ions in
proteins.
The response of a protein with the Lowry or BCA method may deviate significantly from the
usual bovine serum albumin standard. Deviations of up to 40% have been noted [4,20,30]. Clearly the
results should be standardized with other methods. A distinct non-linearity, pH dependence and
influence of time and mixing conditions should be borne in mind [2,30]. The sensitivity of the Lowry
and BCA method (0.010-0.100 mg protein) explains their widespread use, despite these drawbacks.
Other methods based on the properties of the amino acid side chains use dye binding. A very
popular method is based on the spectral change of the Coomassie Brilliant Blue G-250 dye upon binding
to protein (Bradford-method) [21-26,80]. This method is very sensitive: microgram amounts are easily
detected even in the presence of a number of compounds which would interfere with other methods of
protein determination. Protein solubilized in SDS-β-mercaptoethanol-Tris electrophoresis sample buffer
can be determined [82]. Binding of the dye is believed to occur at amino-group containing side chains
(mainly Lys and Arg) and the N-terminus [27,81,90]. The response of proteins is highly variable: a five-
fold range was noted in a study of 23 proteins [28,29]. An extreme example is the absence of colour
formation for two ferredoxins from Streptomyces griseolus [83]. It has to be stressed that this more or
less empirical method should not be used for the determination of absolute protein concentrations. The
usual bovine serum albumin standard has an aberrant, very high, colour response and is a totally
unappropriate standard for this method [28].
2.2.3 Quantification of protein: the absorbance at 280 nm
Measurement of the absorbance at 280 nm [18,19] usually precedes a protein determination to
estimate an approximate content. It is a non-destructive, sensitive and easy estimation of the protein
concentration. As a rule of thumb the protein concentration in mg/ml equals the absorbance at 280 nm
in a 1 cm cuvette. The 280 nm region of the ultraviolet spectrum of a protein is dominated by the tyrosine
and tryptophan aromatic residues. Some proteins have additional ultraviolet absorbances from their
metal centers and/or prosthetic groups. Thus the absorbance at 280 nm can only be used to quantify
protein if the extinction coefficient is known from other methods, or if it is corrections are made for the
absorbance of cofactors etc. Extinction coefficients for native or 6 M GuCl denatured proteins can be
calculated from the amino acid composition [84,85,93]. Metal ions and prosthetic groups will interfere.
An important application is standardization of the bovine serum albumin solution for protein
determinations, routinely carried out by measurement of the absorbance at 279 nm (0.667, 1 cm path
length, 1 mg/ml [86]). High quality, crystallized fatty-acid free BSA should be used. Depending on the
commercial source BSA has 1-10% water, the usual BSA in the fridge has 5-30%! Filtration (0.22
micrometer) or centrifugation at 20,000 g (20 min) yields a clear solution. Straylight correction can be
performed by subtracting the (extrapolated) absorbance at 330-400 nm. Because the protein
determination heavily relies on the concentration of the primary BSA standard, measurement of the
absorbance at 279 nm should be done with a high-quality spectrophotometer. Wavelength calibration
with a solution of holmiumperchlorate (4% m/v Ho2O3 12% v/v perchloric acid) (241.15, 287.15, 361.5
and 536.30 nm lines) is easiest. Measurement of the absorbances for the (micro)biuret, Lowry, BCA or
Coomassie method can be done with cheap instruments or even with microtiter plate readers.
In general one should be careful with the use extinction coefficients (UV or visible range) for
concentration determination of metallo- and flavo-proteins as loss of prosthetic groups and/or redox-
state may change spectral properties.
2.3. Quantification of protein: Amino acids after hydrolysis
A completely different approach is amino acid analysis: the amino acids obtained by hydrolysis
of the protein are separated by HPLC and individually quantified [4]. With proper correction for the
recovery of labile amino acids and different responses of the amino acid-derivatives the content of the
amino acids is summed to yield a quantification of protein. Norleucine is added prior to hydrolysis as
an internal standard to correct for losses from transfer to and injection into the HPLC instrument. This
method yields accurate results, if an experimental set-up for routine amino acid analysis and experience
with hydrolysis is available. Separation of the amino acids by HPLC can be omitted and replaced by an
overall reaction of the amino acid mixture with for instance ninhydrin [5], trinitrobenzene sulfonate [6],
or ortho-phtaldialdehyde [80].
2.4. Quantification of protein: Total protein
Two methods quantify protein based on the full polypeptide: dry weight determination [3] and
turbidimetric procedures [18]. Turbidimetric techniques yield different values with different proteins
and use milligram amounts. It is an old method and is seldomly used.
Dry weight determination is a very straightforward method. Without standardization with other
proteins or amino acids the amount of protein is measured. Unfortunately this method requires milligram
amounts of protein. The hygroscopic nature of lyophilized protein and the removal of buffers/salts have
to be borne in mind. If >>10 mg amounts of protein are available the other protein determinations can
be calibrated against the dry weight determination.
3. Molecular Mass Determination
3.1. Accurate determinations: DNA sequencing and Mass spectrometry
One commonly has DNA sequence data on the structural gene of the protein of interest. After
translation into the aminoacid sequence this gives an extremely accurate molecular mass [93] when
appropriate checks (N- and C-terminal sequences, iso-enzymes?, subunit-structure) have been made.
Expanding routine use of molecular biological techniques and improved methodologies (PCR,
automated sequencing) has replaced many of the ‘classic’ techniques of molecular mass determination.
Especially the cloning of proteins of procaryotes and genome sequencing has become a routine. A
typical example are the redox-enzymes of Desulfovibriones (cytochromes, hydrogenases, flavodoxin,
rubredoxin, rubrerythrin, sulfite reductases), which were initially characterized, then cloned in a time
span of 6 years after 40 years of physical characterization [52]. Now the genome sequence of
Desulfovibrio vulgaris is almost finished [94].
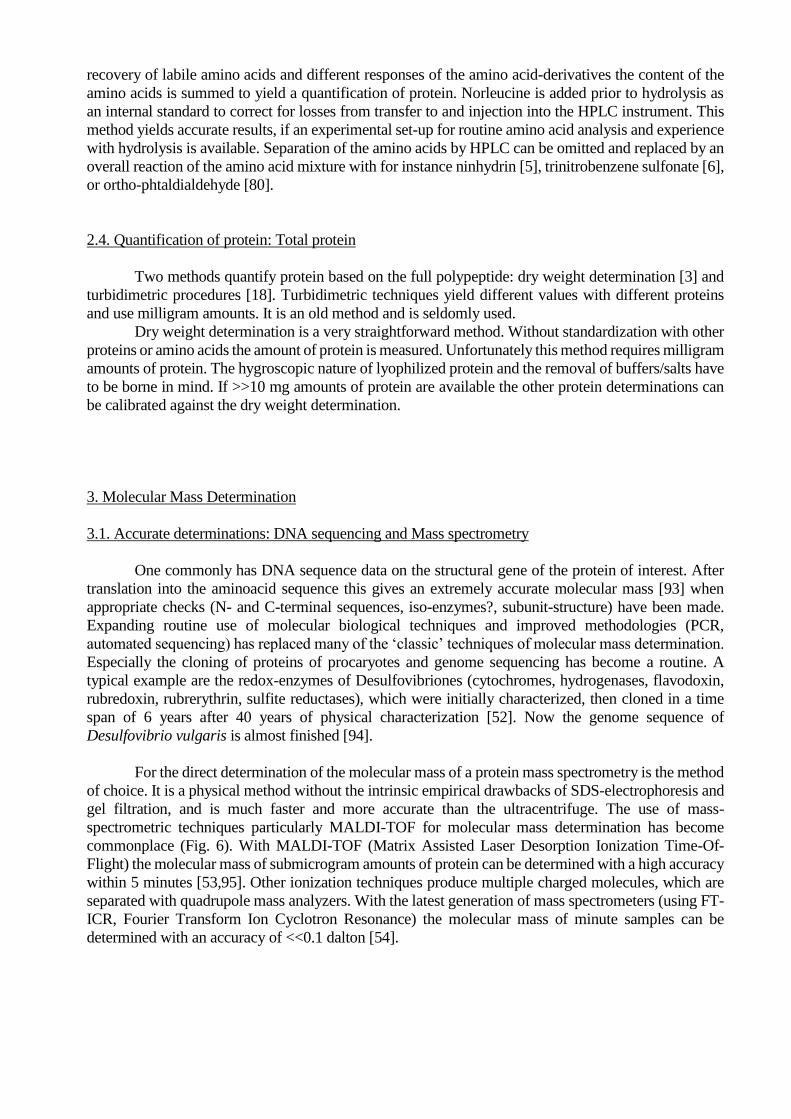
For the direct determination of the molecular mass of a protein mass spectrometry is the method
of choice. It is a physical method without the intrinsic empirical drawbacks of SDS-electrophoresis and
gel filtration, and is much faster and more accurate than the ultracentrifuge. The use of mass-
spectrometric techniques particularly MALDI-TOF for molecular mass determination has become
commonplace (Fig. 6). With MALDI-TOF (Matrix Assisted Laser Desorption Ionization Time-Of-
Flight) the molecular mass of submicrogram amounts of protein can be determined with a high accuracy
within 5 minutes [53,95]. Other ionization techniques produce multiple charged molecules, which are
separated with quadrupole mass analyzers. With the latest generation of mass spectrometers (using FT-
ICR, Fourier Transform Ion Cyclotron Resonance) the molecular mass of minute samples can be
determined with an accuracy of <<0.1 dalton [54].
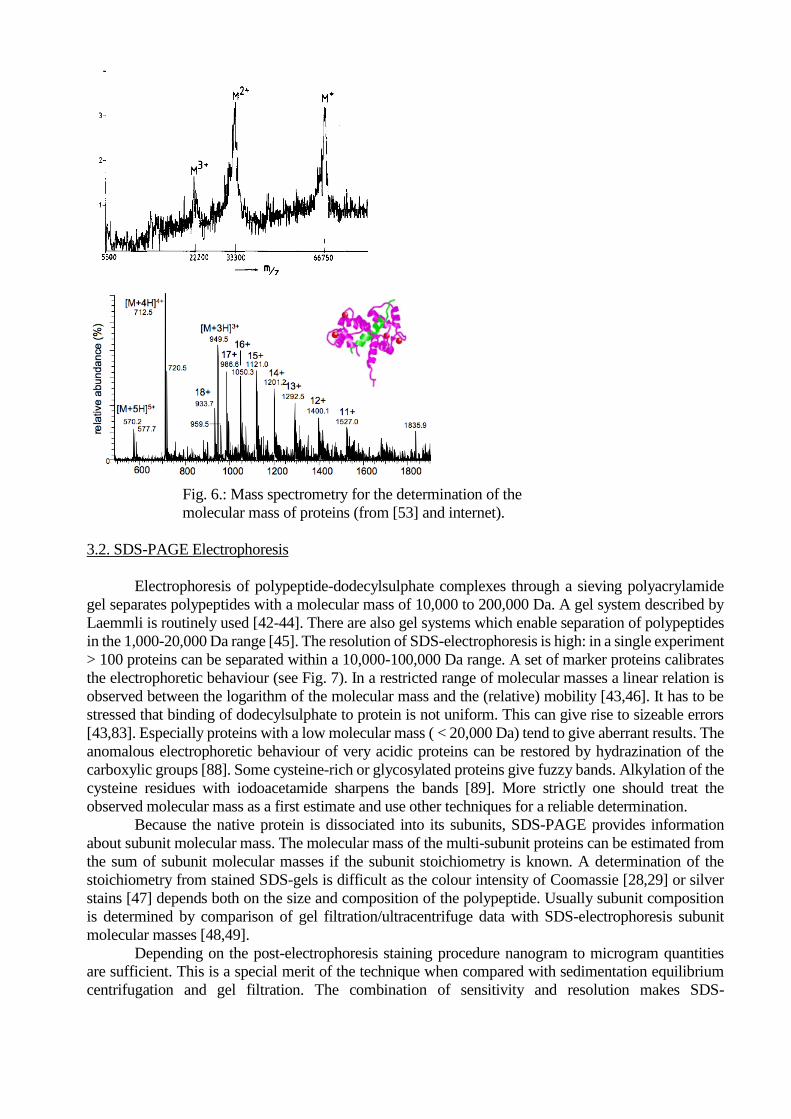
Fig. 6.: Mass spectrometry for the determination of the
molecular mass of proteins (from [53] and internet).
3.2. SDS-PAGE Electrophoresis
Electrophoresis of polypeptide-dodecylsulphate complexes through a sieving polyacrylamide
gel separates polypeptides with a molecular mass of 10,000 to 200,000 Da. A gel system described by
Laemmli is routinely used [42-44]. There are also gel systems which enable separation of polypeptides
in the 1,000-20,000 Da range [45]. The resolution of SDS-electrophoresis is high: in a single experiment
> 100 proteins can be separated within a 10,000-100,000 Da range. A set of marker proteins calibrates
the electrophoretic behaviour (see Fig. 7). In a restricted range of molecular masses a linear relation is
observed between the logarithm of the molecular mass and the (relative) mobility [43,46]. It has to be
stressed that binding of dodecylsulphate to protein is not uniform. This can give rise to sizeable errors
[43,83]. Especially proteins with a low molecular mass ( < 20,000 Da) tend to give aberrant results. The
anomalous electrophoretic behaviour of very acidic proteins can be restored by hydrazination of the
carboxylic groups [88]. Some cysteine-rich or glycosylated proteins give fuzzy bands. Alkylation of the
cysteine residues with iodoacetamide sharpens the bands [89]. More strictly one should treat the
observed molecular mass as a first estimate and use other techniques for a reliable determination.
Because the native protein is dissociated into its subunits, SDS-PAGE provides information
about subunit molecular mass. The molecular mass of the multi-subunit proteins can be estimated from
the sum of subunit molecular masses if the subunit stoichiometry is known. A determination of the
stoichiometry from stained SDS-gels is difficult as the colour intensity of Coomassie [28,29] or silver
stains [47] depends both on the size and composition of the polypeptide. Usually subunit composition
is determined by comparison of gel filtration/ultracentrifuge data with SDS-electrophoresis subunit
molecular masses [48,49].
Depending on the post-electrophoresis staining procedure nanogram to microgram quantities
are sufficient. This is a special merit of the technique when compared with sedimentation equilibrium
centrifugation and gel filtration. The combination of sensitivity and resolution makes SDS-
electrophoresis one of the most common methods for molecular mass estimation. It also gives additional
information on the purity of the protein preparation.
Fig. 7.: Determination of the molecular mass of proteins with SDS-PAGE.
3.3. Ultracentrifugation
The distribution of protein in a rotating sector-shaped cell is analyzed. As the partial specific
volume of proteins is typically 0.73 ml/g [87] protein molecules will sediment in aqueous solution.
Although it is possible to obtain a molecular mass from sedimentation velocity and the diffusion
coefficient [31], generally sedimentation equilibrium techniques are used. The technique of Yphantis
[32] is routinely used to evaluate the molecular mass. Calculation of the molecular mass requires
attainment of equilibrium (5-50 hour), a reliable partial specific volume, monodisperse behaviour of the
protein and integrity of scanning optics. The equilibration time may cause problems with unstable
proteins. Aggregation, oxygen lability (see [33]), and low molecular mass contaminants can render the
technique unsuitable. The partial specific volume can be calculated from the amino acid composition
[34], or be measured [35,36]. The presence of cofactors will introduce deviations, so experimental
determination of the partial specific volume is suggested. Measurement of the partial specific volume
however requires quite large quantities of protein. A sophisticated technique, which supplies the partial
specific volume together with equilibrium data, makes use of H2O and D2O mixtures [35]. Like for the
usual sedimentation equilibrium experiments 0.02-0.5 mg of protein is sufficient. The presence of
cofactors, which absorb in the visual range, introduces selectivity: the wavelength can be tuned to get
rid of UV absorbing contaminants or stray light. High extinction coefficients of for instance haem
prosthetic groups increase the sensitivity.
3.4. Gel Filtration
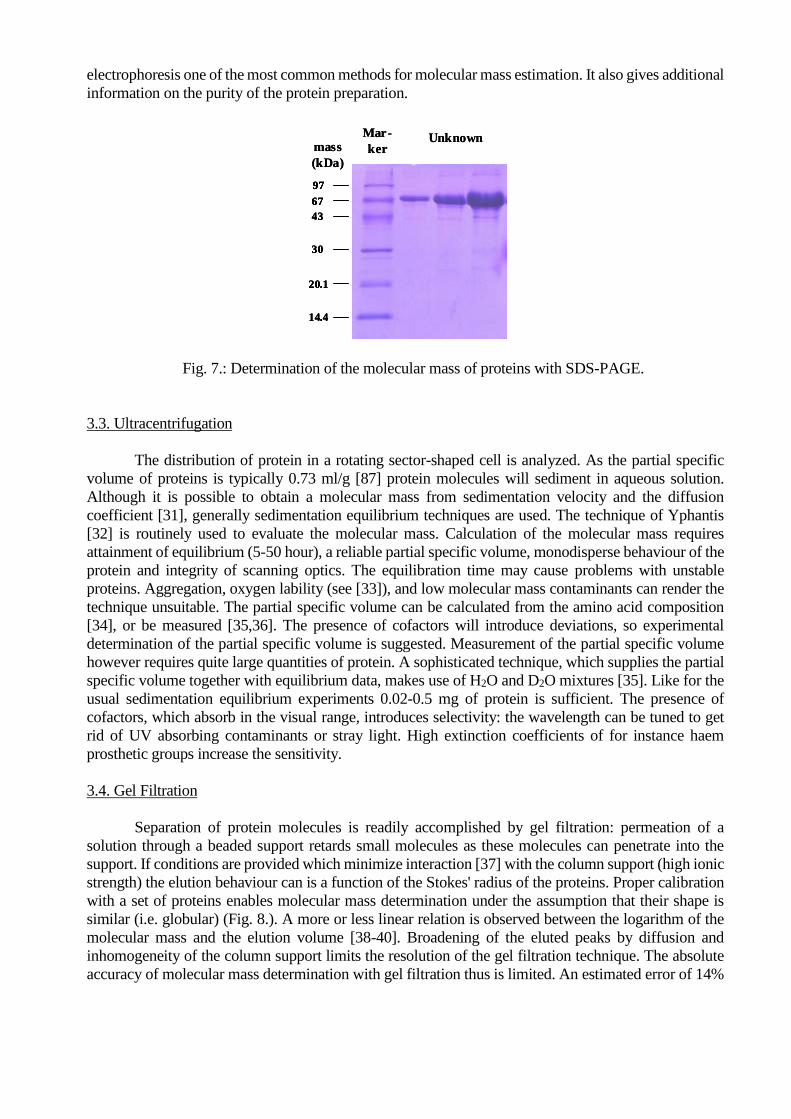
Separation of protein molecules is readily accomplished by gel filtration: permeation of a
solution through a beaded support retards small molecules as these molecules can penetrate into the
support. If conditions are provided which minimize interaction [37] with the column support (high ionic
strength) the elution behaviour can is a function of the Stokes' radius of the proteins. Proper calibration
with a set of proteins enables molecular mass determination under the assumption that their shape is
similar (i.e. globular) (Fig. 8.). A more or less linear relation is observed between the logarithm of the
molecular mass and the elution volume [38-40]. Broadening of the eluted peaks by diffusion and
inhomogeneity of the column support limits the resolution of the gel filtration technique. The absolute
accuracy of molecular mass determination with gel filtration thus is limited. An estimated error of 14%
14.4
20.1
30
43
67
97
mass
(kDa)
Mar-
kerUnknown
14.414.4
20.120.1
3030
4343
6767
9797
mass
(kDa)
Mar-
kerUnknown
in the molecular mass was calculated from the calibration curve of a number of native proteins [41]. The
limited availability of ultracentrifuge facilities and the comparative ease and speed explain the
popularity of the gel filtration technique for the determination of the native molecular mass.
Fig. 8.: Separation of seven proteins with gel filtration, molecular
masses for peak 1-7 are 669, 440, 158, 67, 43, 25 and 13.7 kDa.
Molecular mass determination with gel filtration can be done with very small amounts of
protein, compared with ultracentrifugation techniques. Especially dedicated HPLC systems for protein
chromatography provide results with <0.01 mg protein.
3.5. Other methods
The molecular mass of a protein must be one of n-integral multiples of value obtained by
summing the molecular masses of the amino acids. A molecular mass estimate should be available. In
practice this method can only be applied to small proteins ( < 200 residues) [50,51] or proteins
containing only a few residues of a certain amino acid.
4. Metal Analysis
Most analytical techniques for metal determination suffer more or less from the presence of
polypeptides, and buffers/salts. Viscosity of the sample, background signals, turbidity, and response are
influenced. Therefore one should take great care of interference, and continuously try to monitor the
effect of compounds which are present in protein preparates. The safest approach is removal of
contaminant buffer/salts by dialysis or gel filtration and total destruction of the organic matter. A number
of dry and wet ashing techniques can be used to destruct the protein [55,56].
A second important issue is the removal of 'contaminant' non-specifically bound metal ions.
Proteins tend to bind metal ions derived from contaminated chromatographic supports/buffers, glass
containers and so on. Metal analysis thus starts with the purification: use of nanopure water, pro analysis
chemicals, and inclusion of EDTA in buffers. A final treatment with specific chelators of contaminants
(by gel filtration or extensive dialysis) or elution through Chelex 100 should be considered if the stability
of the metal centres allows such treatments.
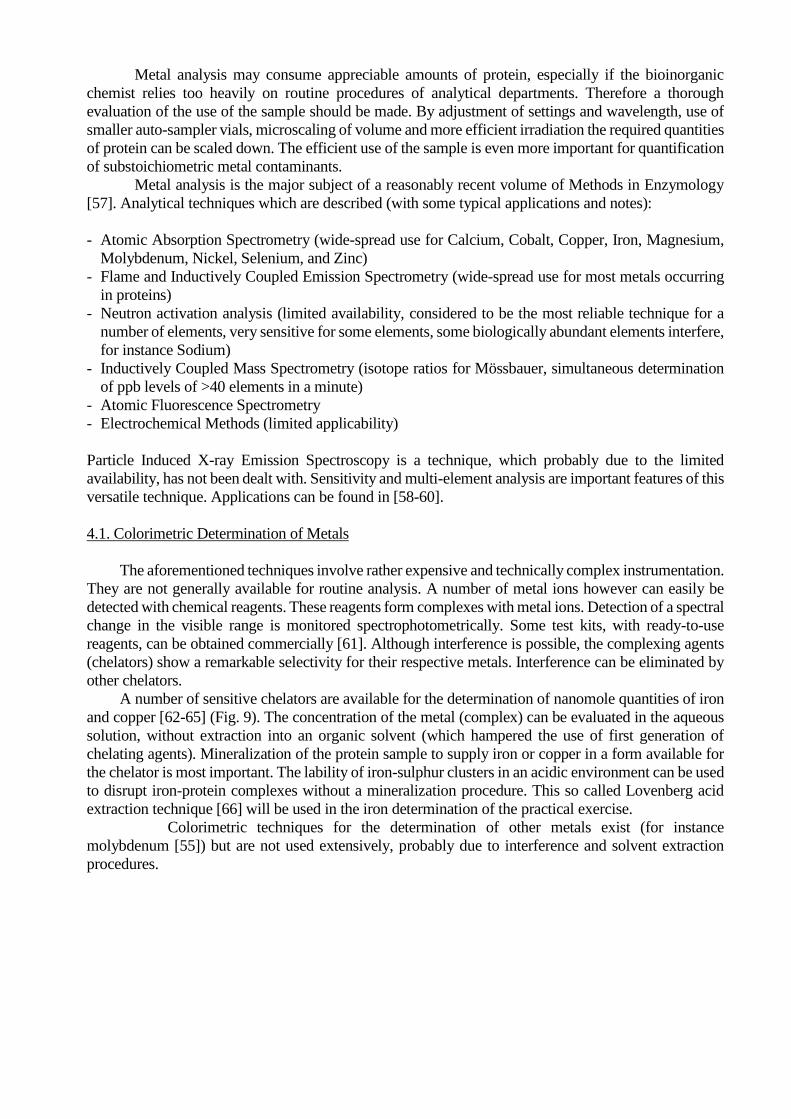
Metal analysis may consume appreciable amounts of protein, especially if the bioinorganic
chemist relies too heavily on routine procedures of analytical departments. Therefore a thorough
evaluation of the use of the sample should be made. By adjustment of settings and wavelength, use of
smaller auto-sampler vials, microscaling of volume and more efficient irradiation the required quantities
of protein can be scaled down. The efficient use of the sample is even more important for quantification
of substoichiometric metal contaminants.
Metal analysis is the major subject of a reasonably recent volume of Methods in Enzymology
[57]. Analytical techniques which are described (with some typical applications and notes):
- Atomic Absorption Spectrometry (wide-spread use for Calcium, Cobalt, Copper, Iron, Magnesium,
Molybdenum, Nickel, Selenium, and Zinc)
- Flame and Inductively Coupled Emission Spectrometry (wide-spread use for most metals occurring
in proteins)
- Neutron activation analysis (limited availability, considered to be the most reliable technique for a
number of elements, very sensitive for some elements, some biologically abundant elements interfere,
for instance Sodium)
- Inductively Coupled Mass Spectrometry (isotope ratios for Mössbauer, simultaneous determination
of ppb levels of >40 elements in a minute)
- Atomic Fluorescence Spectrometry
- Electrochemical Methods (limited applicability)
Particle Induced X-ray Emission Spectroscopy is a technique, which probably due to the limited
availability, has not been dealt with. Sensitivity and multi-element analysis are important features of this
versatile technique. Applications can be found in [58-60].
4.1. Colorimetric Determination of Metals
The aforementioned techniques involve rather expensive and technically complex instrumentation.
They are not generally available for routine analysis. A number of metal ions however can easily be
detected with chemical reagents. These reagents form complexes with metal ions. Detection of a spectral
change in the visible range is monitored spectrophotometrically. Some test kits, with ready-to-use
reagents, can be obtained commercially [61]. Although interference is possible, the complexing agents
(chelators) show a remarkable selectivity for their respective metals. Interference can be eliminated by
other chelators.
A number of sensitive chelators are available for the determination of nanomole quantities of iron
and copper [62-65] (Fig. 9). The concentration of the metal (complex) can be evaluated in the aqueous
solution, without extraction into an organic solvent (which hampered the use of first generation of
chelating agents). Mineralization of the protein sample to supply iron or copper in a form available for
the chelator is most important. The lability of iron-sulphur clusters in an acidic environment can be used
to disrupt iron-protein complexes without a mineralization procedure. This so called Lovenberg acid
extraction technique [66] will be used in the iron determination of the practical exercise.
Colorimetric techniques for the determination of other metals exist (for instance
molybdenum [55]) but are not used extensively, probably due to interference and solvent extraction
procedures.
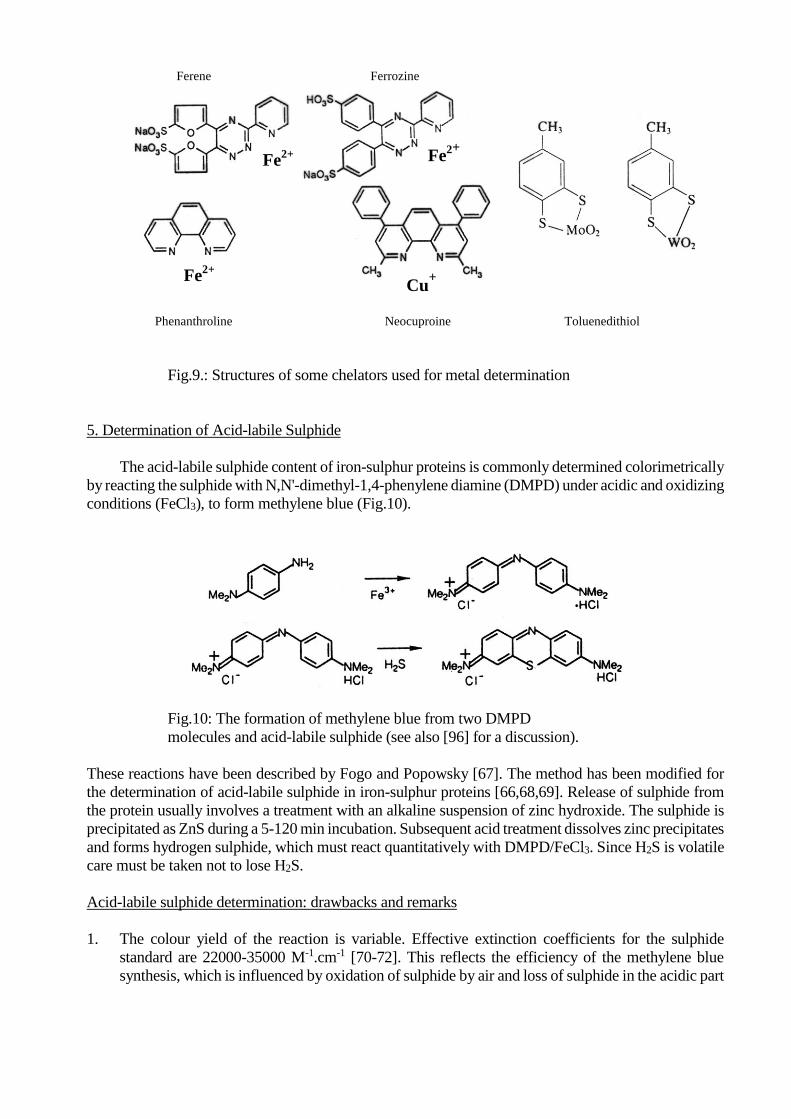
Fig.9.: Structures of some chelators used for metal determination
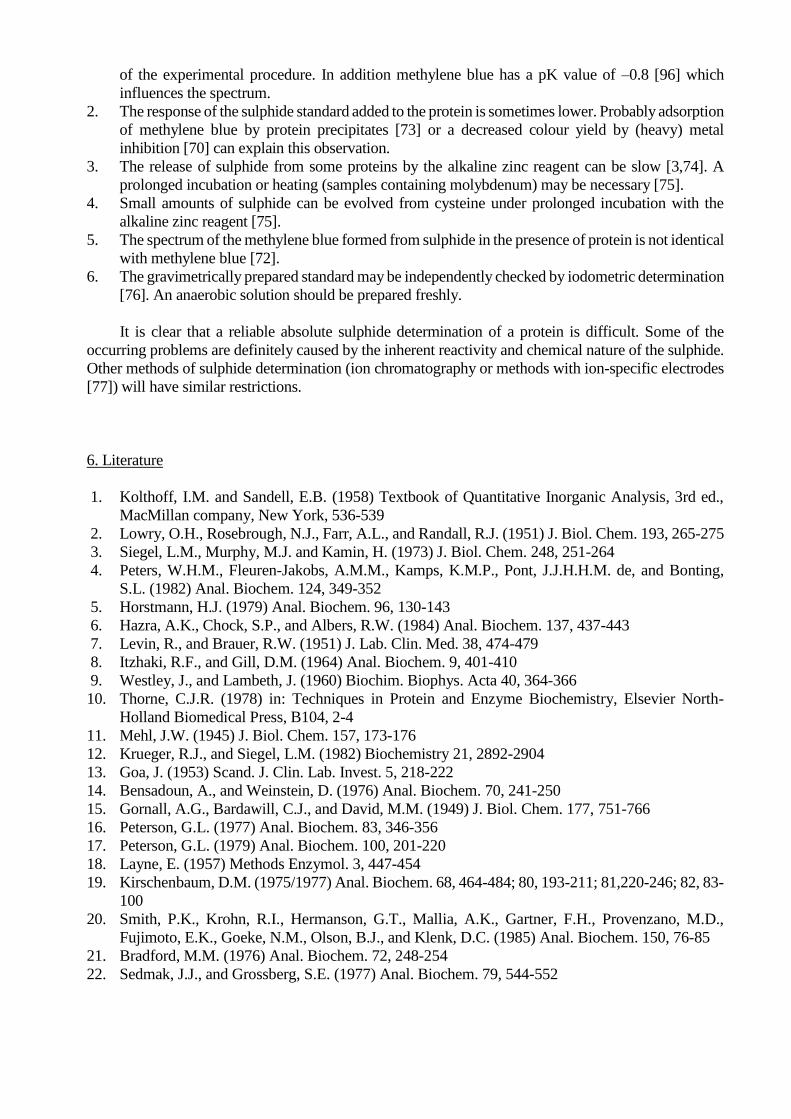
5. Determination of Acid-labile Sulphide
The acid-labile sulphide content of iron-sulphur proteins is commonly determined colorimetrically
by reacting the sulphide with N,N'-dimethyl-1,4-phenylene diamine (DMPD) under acidic and oxidizing
conditions (FeCl3), to form methylene blue (Fig.10).
Fig.10: The formation of methylene blue from two DMPD
molecules and acid-labile sulphide (see also [96] for a discussion).
These reactions have been described by Fogo and Popowsky [67]. The method has been modified for
the determination of acid-labile sulphide in iron-sulphur proteins [66,68,69]. Release of sulphide from
the protein usually involves a treatment with an alkaline suspension of zinc hydroxide. The sulphide is
precipitated as ZnS during a 5-120 min incubation. Subsequent acid treatment dissolves zinc precipitates
and forms hydrogen sulphide, which must react quantitatively with DMPD/FeCl3. Since H2S is volatile
care must be taken not to lose H2S.
Acid-labile sulphide determination: drawbacks and remarks
1. The colour yield of the reaction is variable. Effective extinction coefficients for the sulphide
standard are 22000-35000 M-1.cm-1 [70-72]. This reflects the efficiency of the methylene blue
synthesis, which is influenced by oxidation of sulphide by air and loss of sulphide in the acidic part
Fe2+
Fe2+
Fe2+
Cu+
Ferrozine Ferene
Phenanthroline Neocuproine Toluenedithiol
of the experimental procedure. In addition methylene blue has a pK value of –0.8 [96] which
influences the spectrum.
2. The response of the sulphide standard added to the protein is sometimes lower. Probably adsorption
of methylene blue by protein precipitates [73] or a decreased colour yield by (heavy) metal
inhibition [70] can explain this observation.
3. The release of sulphide from some proteins by the alkaline zinc reagent can be slow [3,74]. A
prolonged incubation or heating (samples containing molybdenum) may be necessary [75].
4. Small amounts of sulphide can be evolved from cysteine under prolonged incubation with the
alkaline zinc reagent [75].
5. The spectrum of the methylene blue formed from sulphide in the presence of protein is not identical
with methylene blue [72].
6. The gravimetrically prepared standard may be independently checked by iodometric determination
[76]. An anaerobic solution should be prepared freshly.
It is clear that a reliable absolute sulphide determination of a protein is difficult. Some of the
occurring problems are definitely caused by the inherent reactivity and chemical nature of the sulphide.
Other methods of sulphide determination (ion chromatography or methods with ion-specific electrodes
[77]) will have similar restrictions.
6. Literature
1. Kolthoff, I.M. and Sandell, E.B. (1958) Textbook of Quantitative Inorganic Analysis, 3rd ed.,
MacMillan company, New York, 536-539
2. Lowry, O.H., Rosebrough, N.J., Farr, A.L., and Randall, R.J. (1951) J. Biol. Chem. 193, 265-275
3. Siegel, L.M., Murphy, M.J. and Kamin, H. (1973) J. Biol. Chem. 248, 251-264
4. Peters, W.H.M., Fleuren-Jakobs, A.M.M., Kamps, K.M.P., Pont, J.J.H.H.M. de, and Bonting,
S.L. (1982) Anal. Biochem. 124, 349-352
5. Horstmann, H.J. (1979) Anal. Biochem. 96, 130-143
6. Hazra, A.K., Chock, S.P., and Albers, R.W. (1984) Anal. Biochem. 137, 437-443
7. Levin, R., and Brauer, R.W. (1951) J. Lab. Clin. Med. 38, 474-479
8. Itzhaki, R.F., and Gill, D.M. (1964) Anal. Biochem. 9, 401-410
9. Westley, J., and Lambeth, J. (1960) Biochim. Biophys. Acta 40, 364-366
10. Thorne, C.J.R. (1978) in: Techniques in Protein and Enzyme Biochemistry, Elsevier North-
Holland Biomedical Press, B104, 2-4
11. Mehl, J.W. (1945) J. Biol. Chem. 157, 173-176
12. Krueger, R.J., and Siegel, L.M. (1982) Biochemistry 21, 2892-2904
13. Goa, J. (1953) Scand. J. Clin. Lab. Invest. 5, 218-222
14. Bensadoun, A., and Weinstein, D. (1976) Anal. Biochem. 70, 241-250
15. Gornall, A.G., Bardawill, C.J., and David, M.M. (1949) J. Biol. Chem. 177, 751-766
16. Peterson, G.L. (1977) Anal. Biochem. 83, 346-356
17. Peterson, G.L. (1979) Anal. Biochem. 100, 201-220
18. Layne, E. (1957) Methods Enzymol. 3, 447-454
19. Kirschenbaum, D.M. (1975/1977) Anal. Biochem. 68, 464-484; 80, 193-211; 81,220-246; 82, 83-
100
20. Smith, P.K., Krohn, R.I., Hermanson, G.T., Mallia, A.K., Gartner, F.H., Provenzano, M.D.,
Fujimoto, E.K., Goeke, N.M., Olson, B.J., and Klenk, D.C. (1985) Anal. Biochem. 150, 76-85
21. Bradford, M.M. (1976) Anal. Biochem. 72, 248-254
22. Sedmak, J.J., and Grossberg, S.E. (1977) Anal. Biochem. 79, 544-552
23. Kley, H. van, and Hale, S.M. (1977) Anal. Biochem. 81, 485-487
24. Spector, T. (1978) Anal. Biochem. 86, 142-146
25. Bearden, J.C. (1978) Biochim. Biophys. Acta 533, 525-529
26. Splittgerber, A.G., and Sohl, J. (1989) Anal. Biochem. 179, 198-201
27. Fazekas de St. Groth, S., Webster, R.G., and Datyner, A. (1963) Biochim. Biophys. Acta 71, 377
28. Pierce, J., and Suelter S.H. (1977) Anal. Biochem. 81, 478-480
29. Bio-Rad (1979), Bulletin 1069 E6 (Bio-Rad Protein Assay), 1-6
30. Adams, M.W.W., Eccleston, E., and Howard, J.B. (1989) Proc. Natl. Acad. Sci. USA 86, 4932-
4936
31. Schachmann, H.K. (1959) Ultracentrifugation in Biochemistry, Academic Press, New York
32. Yphantis, D.A. (1964) Biochemistry 3, 297-317
33. Filipiak, M., Hagen, W.R., and Veeger, C. (1989) Eur. J. Biochem. 185, 547-553
34. Cohn, E.J., and Edsall, J.T. (1943) Proteins, Amino Acids, and Peptides, p. 374, Reinhold Book
Corp., New York
35. Edelstein, S.J., and Schachmann, H.K. (1973) Methods Enzymol. 27, 82-98
36. Kratky, O., Leopold, H., and Stabinger, H. (1973) Methods Enzymol. 27, 98-110
37. Williams, K.W. (1972) Lab. Practice 21, 667-670
38. Whitaker, J.R. (1963) Anal. Chem. 35, 1950-1953
39. Determann, H., and Michel, W. (1966) J. Chromatogr. 25, 303-313
40. Andrews, P. (1970) in: Methods of Biochemical Analysis vol. 18 (Glick, D. ed.), pp. 1-53,
Interscience Publishers, New York
41. Unger, K. (1984) Methods Enzymol. 104, 154-169
42. Laemmli, U.K. (1970) Nature 227, 680-685
43. Blackshear, P.J. (1984) Methods Enzymol. 104, 237-255
44. Wyckoff, M., Rodbard, D., and Chrambach, A. (1977) Anal. Biochem. 78, 459-482
45. Schaegger, H. and Jagow, G. von (1987) Anal. Biochem. 166, 368-379
46. Weber, K., and Osborn, M. (1969) J. Biol. Chem. 244, 4406-4412
47. Krystal, G., Macdonald, C., Munt, B., and Ashwell, S. (1985) Anal. Biochem. 148, 451-460
48. Lee, J.-P., LeGall, J., and Peck, H.D. (1973) J. Bact. 115, 529-542
49. Hagen, W.R., Berkel-Arts, A. van, Kruese-Wolters, K.M., Voordouw, G., and Veeger, C. (1986)
FEBS Lett. 203, 59-63
50. Irie, K., Kobayashi, K., Kobayashi, M., and Ishimoto, M. (1973) J. Biochem. 73, 353-366 (1973)
51. Fauque, G.D., Moura, I., Moura, J.J.G., Xavier, A.V., Galliano, N., and LeGall, J. (1987) FEBS
Lett. 215, 63-67
52. Voordouw, G., Strang, J.D., and Wilson, F.R. (1989) J. Bact. 171, 3881-3889
53. Karas, M., and Hillenkamp, F. (1988) Anal. Chem. 60, 2299-2301
54. Li, W., Hendrickson, C.L., Emmett, M.R., and Marshall, A.G. (1999) Anal. Chem. 71, 4397-
4402.
55. Hart, L.I., McGartoll, M.A., Chapman, H.R., and Bray, R.C. (1970) Biochem. J. 116, 851-864
56. Fish, W.W. (1988) Methods Enzymol. 158, 357-364.
57. Methods in Enzymology volume 158, Metallobiochemistry Part A (1988) & Czupryn, M, and
Falchuk, K.H. (1991) Methods Enzymol. 205, 415-419.
58. Lochmueller, C.H., Galbraith, J., Walter, R.L., and Willis, R.E. (1974) Anal. Biochem. 57, 618-
622
59. Grande, H.J., Dunham, W.R., Averill, B., Dijk, C. van, and Sands, R.H. (1983) Eur. J. Biochem.
136, 201-207
60. Bagyinka, C., Szokefalvi-Nagy, Z., Demeter, I., and Kovacs, K.L. (1989) Biochem. Biophys. Res.
Comm. 162, 422-426
61. Merck, Schnelltest Handbuch, Darmstadt (F.R.G.)
62. Schilt, A.A. (1969) Analytical applications of 1,10-phenantroline and related compounds,
Pergamon Press, Oxford
63. Blair, D., and Diehl, H. (1961) Talanta 7, 163-174
64. Hennessy, D.J., Reid, G.R., Smith, F.E., and Thompson, S.L. (1984) Can. J. Chem. 62, 721-724
65. Beinert, H. (1978) Methods Enzymol. 54, 435-445
66. Lovenberg, W., Buchanan, B.B., and Rabinowitz, J.C. (1963) J. Biol. Chem. 238, 3899-3913
67. Fogo, J.K., and Popowsky, M. (1949) Anal. Chem. 21, 732-734
68. Buchanan, B.B., Lovenberg, W., and Rabinowitz, J.C. (1963) Proc. Natl. Acad. Sci. USA 49,
345-356
69. Brumby, P.E., Miller, R.W., and Massey, V. (1965) J. Biol. Chem. 240, 2222-2228
70. King, T.E., and Morris, R.O. (1967) Methods Enzymol. 10, 634-637
71. Timcenko, L., and Kimura, T. (1979) Anal. Biochem. 95, 452-457
72. Beinert, H. (1983) Anal. Biochem. 131, 373-378
73. Rabinowitz, J.C. (1978) Methods Enzymol. 53, 275-277
74. Suhara, K., Takemori, S., Katagiri, M., Wada, K., Kobayashi, H., and Matsubara, H. (1975) Anal.
Biochem. 68, 632-636
75. Tonsager, S.R., and Averill, B.A. (1980) Anal. Biochem. 102, 13-15
76. Vogel, A.I. (1961) Quantitative Inorganic Analysis, pp. 343-371, 3rd ed., Longmans, London
77. Adler, H., and Westley, J. (1987) Methods in Enzymology 143, 38-44
78. Lang, C.A. (1958) Anal. Chem. 30, 1692-1694
79. Rouwenhorst, R.J., Frank, J., Scheffers, W.A., and Van Dijken, J.P. (1991) J. Biochem. Biophys.
Methods 22, 119-128
80. Peterson, G.L. (1983) Methods in Enzymology 91, 95-119
81. Righetti, P.G., and Chillemi, F. (1978) J. Chromatography 157, 243-251
82. Rubin, R.W., and Warren, R.W. (1977) Anal. Biochem. 83, 773-777
83. O'Keefe, D.P., Gibson, K.J., Emptage, M.H., Lenstra, R., Romesser, J.A., Litle, P.J., and Omer,
C.A. (1991) Biochemistry 30, 447-455
84. Gill, S.C., and Von Hippel, P.H. (1989) Anal. Biochem. 182, 319-326
85. Mach, H., Middaugh, C.R., and Lewis, R.V. (1992) Anal. Biochem. 200, 74-80
86. Foster, J.F., and Sterman, M.D. (1956) J. Am. Chem. Soc. 78, 3656-3660
87. Smith, M.H. (1963) Biochem. J. 89, 45P
88. Matagne, A., Joris, B., and Frere, J.-M. (1991) Biochem. J. 280, 553-556
89. Hedderich, R., Albracht, S.P.J., Linder, D., Koch, J., and Thauer, R.K. (1992) FEBS Lett. 298,
65-68
90. Congdon, R.W., Muth, G.W., and Splittgerber, A.G. (1993) Anal. Biochem. 213, 407-413
91. Hans, M., Sievers, J., Muller, U., Bill, E., Vorholt, J.A., Linder, D., and Buckel, W. (1999) Eur.
J. Biochem. 265, 404-414.
92. http://www.ncbi.nlm.nih.gov/htbin-post/Entrez/query?db=p
93. http://npsa-pbil.ibcp.fr/cgi-bin/npsa_automat.pl?page=npsa_compo.html
94. http://www.tigr.org/tdb/
95. Moore, W.T. (1997) Methods Enzymol. 289, 520-542.
96. Kuban, V., Dasgupta, P.K., and Marx, J.N. (1992) Anal. Chem. 64, 36-43.
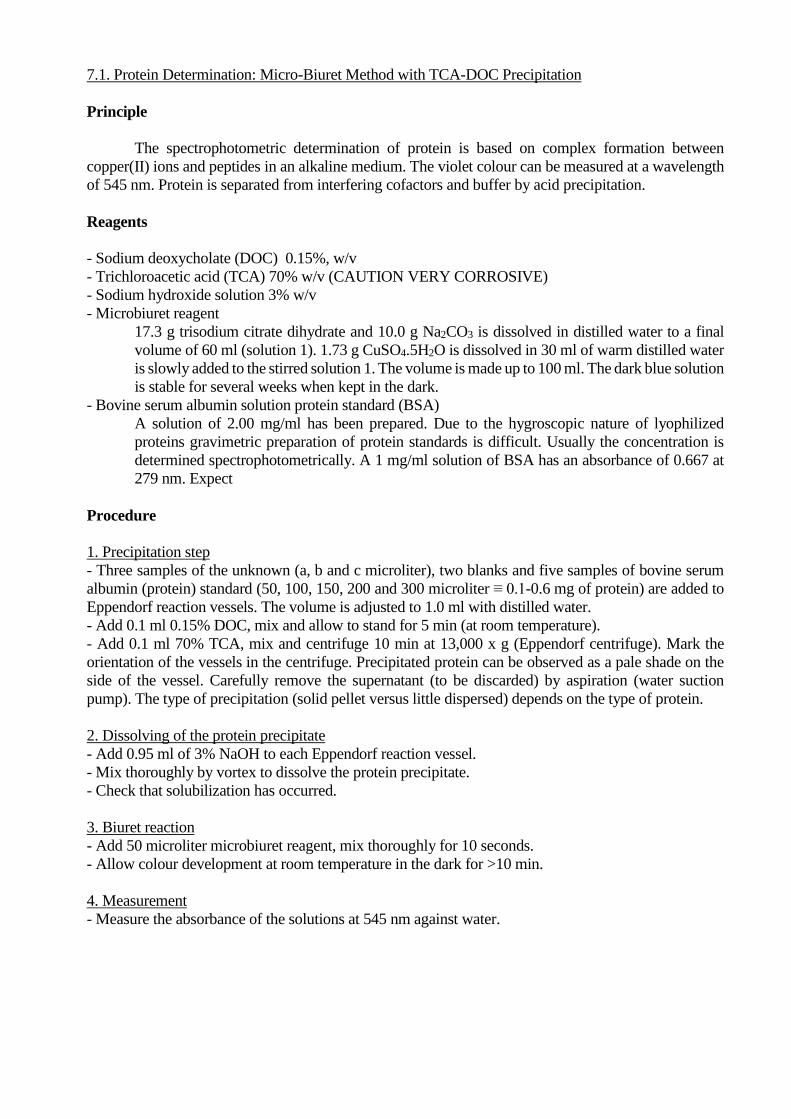
7.1. Protein Determination: Micro-Biuret Method with TCA-DOC Precipitation
Principle
The spectrophotometric determination of protein is based on complex formation between
copper(II) ions and peptides in an alkaline medium. The violet colour can be measured at a wavelength
of 545 nm. Protein is separated from interfering cofactors and buffer by acid precipitation.
Reagents
- Sodium deoxycholate (DOC) 0.15%, w/v
- Trichloroacetic acid (TCA) 70% w/v (CAUTION VERY CORROSIVE)
- Sodium hydroxide solution 3% w/v
- Microbiuret reagent
17.3 g trisodium citrate dihydrate and 10.0 g Na2CO3 is dissolved in distilled water to a final
volume of 60 ml (solution 1). 1.73 g CuSO4.5H2O is dissolved in 30 ml of warm distilled water
is slowly added to the stirred solution 1. The volume is made up to 100 ml. The dark blue solution
is stable for several weeks when kept in the dark.
- Bovine serum albumin solution protein standard (BSA)
A solution of 2.00 mg/ml has been prepared. Due to the hygroscopic nature of lyophilized
proteins gravimetric preparation of protein standards is difficult. Usually the concentration is
determined spectrophotometrically. A 1 mg/ml solution of BSA has an absorbance of 0.667 at
279 nm. Expect
Procedure
1. Precipitation step
- Three samples of the unknown (a, b and c microliter), two blanks and five samples of bovine serum
albumin (protein) standard (50, 100, 150, 200 and 300 microliter ≡ 0.1-0.6 mg of protein) are added to
Eppendorf reaction vessels. The volume is adjusted to 1.0 ml with distilled water.
- Add 0.1 ml 0.15% DOC, mix and allow to stand for 5 min (at room temperature).
- Add 0.1 ml 70% TCA, mix and centrifuge 10 min at 13,000 x g (Eppendorf centrifuge). Mark the
orientation of the vessels in the centrifuge. Precipitated protein can be observed as a pale shade on the
side of the vessel. Carefully remove the supernatant (to be discarded) by aspiration (water suction
pump). The type of precipitation (solid pellet versus little dispersed) depends on the type of protein.
2. Dissolving of the protein precipitate
- Add 0.95 ml of 3% NaOH to each Eppendorf reaction vessel.
- Mix thoroughly by vortex to dissolve the protein precipitate.
- Check that solubilization has occurred.
3. Biuret reaction
- Add 50 microliter microbiuret reagent, mix thoroughly for 10 seconds.
- Allow colour development at room temperature in the dark for >10 min.
4. Measurement
- Measure the absorbance of the solutions at 545 nm against water.
Validation
Calibration curve normally very linear. If the absorbance at 545 nm per mg in the assay deviates from
0.30 ± 0.01 one should omit the TCA precipitation to confirm that everything went well. The typical
absorbance at 545 nm of 3 % NaOH versus air is 0.042.
Abs 545 nm = 0.3067*mg BSA + 0.0696
R2 = 0.9995
0.06
0.09
0.12
0.15
0.0 0.1 0.2 0.3
mg BSA
Ab
s. 5
45
nm
vs
3%
Na
OH
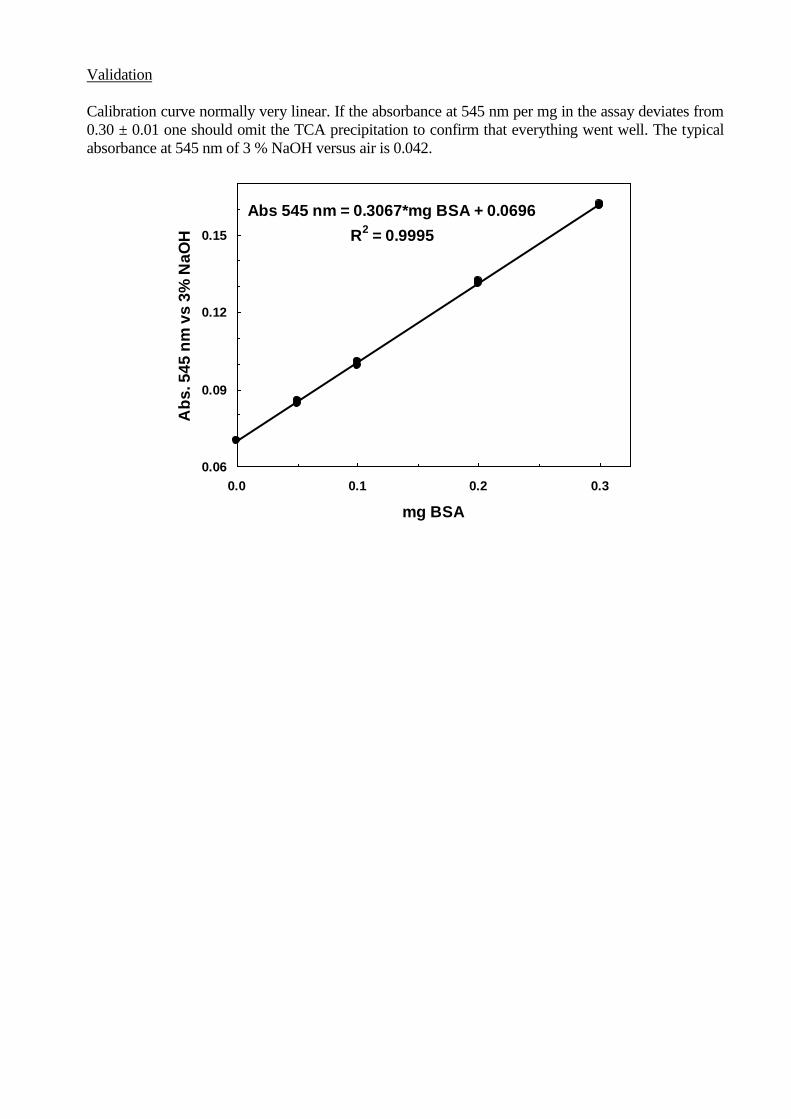
7.2. Iron determination with Ferene
Principle
The iron complexed by the protein is liberated by treatment with hydrochloric acid. Excess acid
is neutralized with ammonium acetate, Fe3+ is converted to Fe2+ by reduction with ascorbic acid.
Precipitated protein is complexed with sodium dodecylsulphate. Finally iron chelator is added to form
a blue complex.
Reagents
- Dilute hydrochloric acid, 1% w/v
- Ammonium acetate solution, 7.5% w/v
- Sodium dodecylsulphate (SDS), 2.5% w/v
- Ascorbic acid, 4% w/v (freshly prepared)
- Iron chelator: 3-(2-pyridyl)-5,6-bis(5-sulfo-2-furyl)-1,2,4-triazine, disodium salt
trihydrate (Ferene), 1.5% w/v
- Iron standard: 0.2 mM (NH4)2Fe(SO4)2.6H2O (Mohr's Salt, 78 mg/liter, molecular mass is 392.14,
freshly prepared)
Procedure
1. Treatment with acid
- Three samples of the unknown (0-100 microliter), two blanks and several samples of iron standard (1
to 100 microliter, i.e. 0.2-20 nmol Fe) are diluted to 100 microliter with demineralized water in
Eppendorf reaction vessels. Subsequently add 100 microliter 1% hydrochloric acid. The samples are
mixed by gentle shaking.
2. Incubation at 80 oC
- The reaction vessels are closed and incubated at 80 oC for 10 min.
- Allow the vessels to cool down after the 80 oC treatment (keep closed).
3. Chelation
- Add sequentially, with vortexing after each addition:
- 500 microliter 7.5% ammonium acetate
- 100 microliter 4% ascorbic acid
- 100 microliter 2.5% sodium dodecylsulphate
- 100 microliter iron chelator
4. Centrifugation
- Centrifuge 10 min, 13000 x g.
5. Measurement
- Carefully transfer the supernatant of the solutions to a plastic cuvette and measure the absorbance at
593 nm against water.
Validation
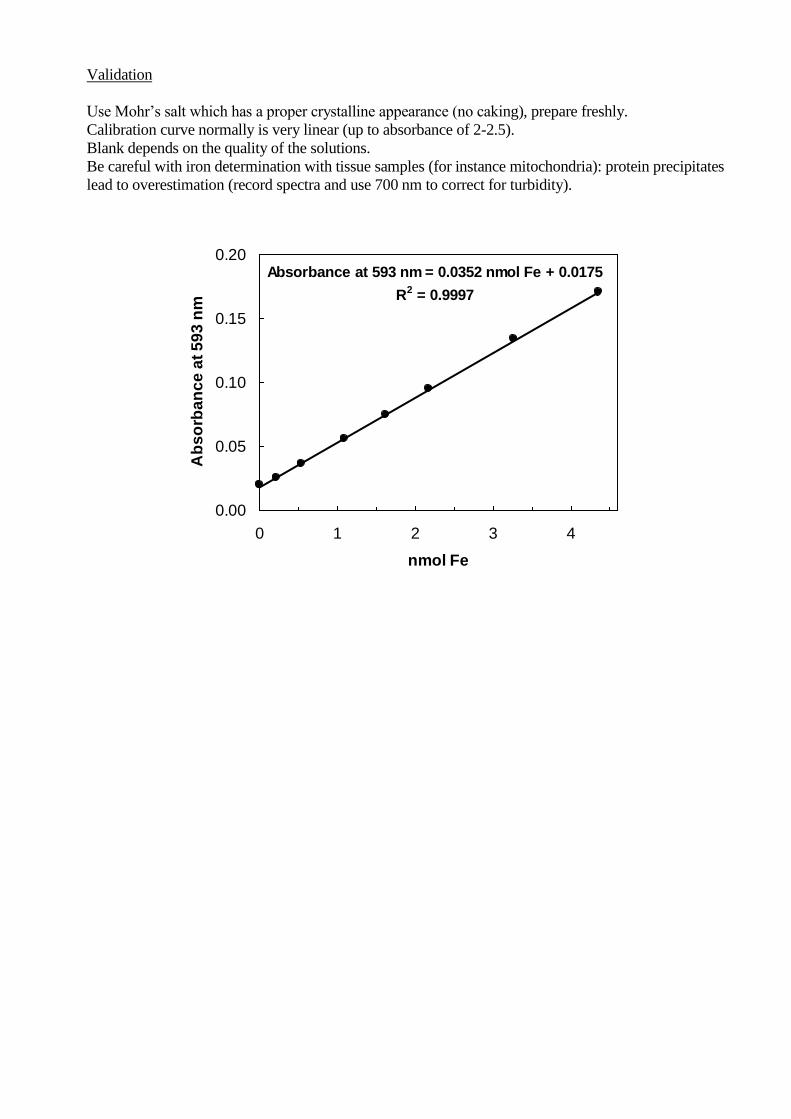
Use Mohr’s salt which has a proper crystalline appearance (no caking), prepare freshly.
Calibration curve normally is very linear (up to absorbance of 2-2.5).
Blank depends on the quality of the solutions.
Be careful with iron determination with tissue samples (for instance mitochondria): protein precipitates
lead to overestimation (record spectra and use 700 nm to correct for turbidity).
Absorbance at 593 nm = 0.0352 nmol Fe + 0.0175
R2 = 0.9997
0.00
0.05
0.10
0.15
0.20
0 1 2 3 4
nmol Fe
Ab
so
rba
nc
e a
t 5
93
nm
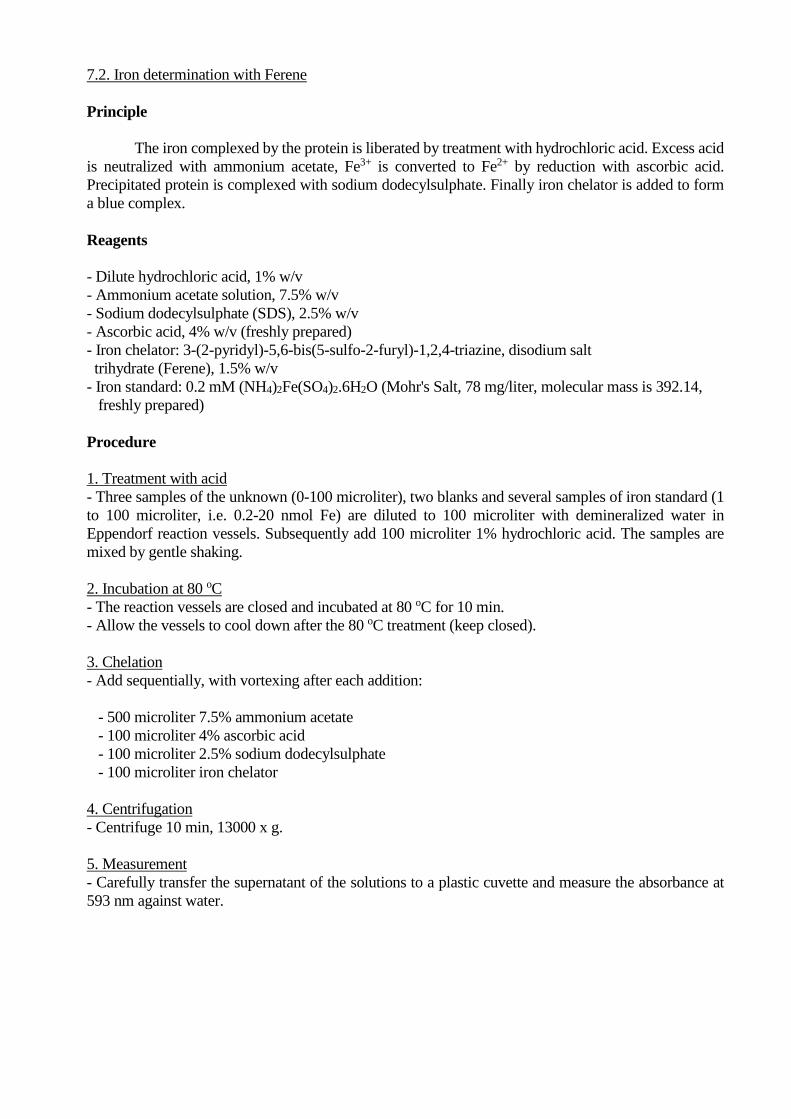
7.3. Determination of Acid-labile Sulfide
Principle
The iron-sulfur protein is denatured in an alkaline medium containing zinc hydroxide. Released sulfide
is coprecipitated with Zn(OH)2 as ZnS. After acidification, H2S condenses with two molecules of N,N'-
dimethyl-p-phenylenediamine to form methylene blue.
Reagents
- Zinc acetate, 1% w/v (freshly prepared from 10 % w/v)
- Sodium hydroxide, 7% w/v
- N,N'-dimethyl-p-phenylene-diamine (DMPD), 0.1% w/v in 5 M HCl (TOXIC)
- 10 mM FeCl3 in 1 M HCl.
- Sulfide standard ( 2 mM). Portions of approx. 46 mg of lithium sulfide (mol. mass 45.95, store at -20
°C) are accurately weighed and stored at -20 °C in 1.5 ml Eppendorf vials. Dissolve in the appropriate
amount of 10 mM NaOH (ca. 46 ml) to get a 20 mM Li2S solution. Mix 100 µl of this solution with 900
µl 10 mM NaOH. One can also use Na2S.9H2O (mol. mass is 240.18). A crystal of appropriate size (
0.5 g) is blotted on filter paper, rapidly weighed and added to a 1 liter volumetric flask containing 10
mM NaOH which has been purged of air with argon. The flask is closed immediately and the solution
is stirred magnetically. This solution is stable for at least 10 h. Solution may be independently
standardized iodometrically.
Remarks
Sulfide is oxidized by oxygen and can be partially lost after acidification. Anaerobiosis would add to
the reproducibility. The procedure outlined below is a compromise. The presence of protein can effect
the yield of methylene blue from sulfide. It is suggested to test this effect by standard addition of sulfide
to protein in the experiment.
Procedure
- Three protein samples (x, y and z microliter), two blanks and five sulfide standards (5, 10, 15, 20, and
25 microliter i.e. 10-50 nmol S2-) and two protein samples (x microliter each) with sulfide
(standard)additions of 10 and 20 microliter are put in Eppendorf reaction vials and made up to a volume
of 200 µl with distilled water.
- Add 600 µl of 1% zinc acetate.
- Add 50 µl of 7% NaOH, close the vials, put upside down once to mix. Incubate the vials for 15 min at
room temperature.
- Centrifuge a few seconds at low speed
The next step of the procedure should be performed on the vials ONE BY ONE to minimize loss of
sulfide.
- Pipette 150 µl DMPD solution: put the end of the yellow tip at the bottom of the vial, gently release
the liquid and mix by slowly rotating the pipette (keep the piston depressed). The zinc hydroxide and
sulfide precipitates will dissolve. Carefully remove the yellow pipette-tip from the liquid, (quickly) put
on a new tip and dispense 150 µl FeCl3 solution. Close the vial immediately and vortex vigorously for
30 sec.
- After all vials have been treated with DMPD/FeCl3, centrifuge (10 min, 13000 x g). Carefully transfer
the supernatant of the solutions to a plastic cuvette and measure the absorbance at 670 nm against water
after 20 min.
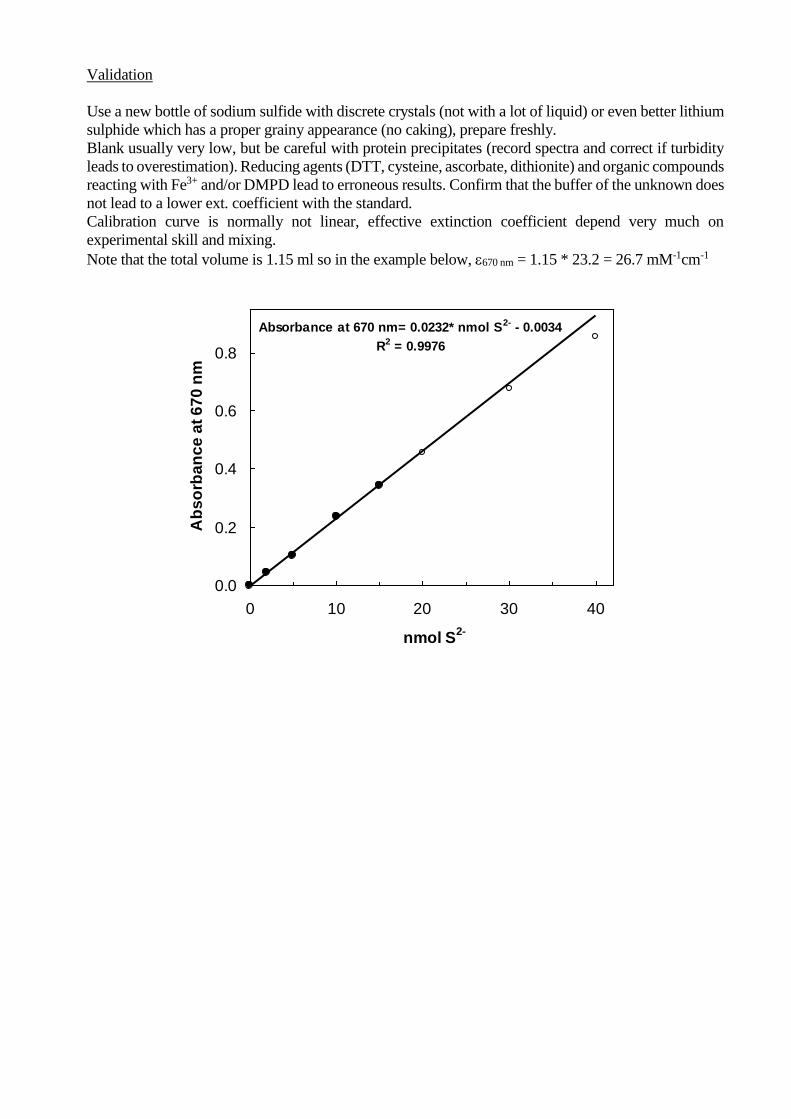
Validation
Use a new bottle of sodium sulfide with discrete crystals (not with a lot of liquid) or even better lithium
sulphide which has a proper grainy appearance (no caking), prepare freshly.
Blank usually very low, but be careful with protein precipitates (record spectra and correct if turbidity
leads to overestimation). Reducing agents (DTT, cysteine, ascorbate, dithionite) and organic compounds
reacting with Fe3+ and/or DMPD lead to erroneous results. Confirm that the buffer of the unknown does
not lead to a lower ext. coefficient with the standard.
Calibration curve is normally not linear, effective extinction coefficient depend very much on
experimental skill and mixing.
Note that the total volume is 1.15 ml so in the example below, 670 nm = 1.15 * 23.2 = 26.7 mM-1cm-1
Absorbance at 670 nm= 0.0232* nmol S2- - 0.0034
R2 = 0.9976
0.0
0.2
0.4
0.6
0.8
0 10 20 30 40
nmol S2-
Ab
so
rba
nc
e a
t 6
70
nm