Embed Size (px)
Citation preview
Progress In Electromagnetics Research, Vol. 148, 1–14, 2014
Analysis of Moving Human Micro-Doppler Signaturein Forest Environments
Jose M. Garcia-Rubia*, Ozlem Kilic, Vinh Dang, Quang Nguyen, and Nghia Tran
Abstract—Automatic detection of human motion is important for security and surveillanceapplications. Compared to other sensors, radar sensors present advantages for human motion detectionand identification because of their all-weather and day-and-night capabilities, as well as the fact thatthey detect targets at a long range. This is particularly advantageous in the case of remote and highlycluttered radar scenes. The objective of this paper is to investigate human motion in highly clutteredforest medium to observe the characteristics of the received Doppler signature from the scene. For thispurpose we attempt to develop an accurate model accounting for the key contributions to the Dopplersignature for the human motion in a forest environment. Analytical techniques are combined with fullwave numerical methods such as Method of Moments (MoM) enhanced with Fast Multipole Method(FMM) to achieve a realistic representation of the signature from the scene. Mutual interactions betweenthe forest and the human as well as the attenuation due to the vegetation are accounted for. Due tothe large problem size, parallel programming techniques that utilize a Graphics Processing Unit (GPU)based cluster are used.
1. INTRODUCTION
A capability to detect, track and monitor human motion in highly cluttered environments, suchas forests, is important for security and surveillance operations. Particularly for border controlapplications, it is essential to track and classify humans moving in remote locations over a long periodof time, at a low cost, and with low maintenance. Several different radio-frequency devices have beendeveloped for this purpose; in particular Doppler radars are widely used for human discriminationapplications [1, 2].
Human movement can be classified by using micro-Doppler radar systems that are capable ofdetecting small variations in the carrier frequency caused by motion. Studies have shown that the humanmicro-Doppler signature is a unique signature, differentiable from all other micro-Doppler signatures,including those caused by four-legged animals [3, 4]. The micro-Doppler frequency shift depends onthe transmitted frequency and the velocity of the different body parts over time [5–8]. This hasbeen exploited for identification and classification of different human activities [9]. To analyze themicro-Doppler signatures, a joint time-frequency transform such as the Short-Time Fourier Transform(STFT) is performed. Different types of motions can be identified and classified from micro-Dopplerspectrograms [9, 10].
Most of the recent research in this field have focused on using continuous wave (CW) radar forDoppler detection due to their simpler system design and implementation, and lower development cost.For example, a CW microwave Doppler radar operating at 2.4GHz was developed for multiple-moversensing [11]. CW microwave Doppler radars have been widely used for vital sign detection and life
Received 23 January 2014, Accepted 21 May 2014, Scheduled 15 June 2014* Corresponding author: Jose Miguel Garcia-Rubia ([email protected]).The authors are with the Department of Electrical Engineering and Computer Science, The Catholic University of America, 620Michigan Ave., N.E., DC 20064, USA.

2 Garcia-Rubia et al.
detection [12–15], and for extracting the Doppler signatures for biometric characterization [16]. Signalprocessing and Doppler extraction method for CW Doppler radar were also discussed in [4, 17–22].
The objective of this paper is to investigate human motion in a highly cluttered forest medium toobserve the characteristics of the received Doppler signature from the scene. We present the resultsof an accurate model which accounts for the key contributions to the Doppler signature of the humanmotion in a forest environment.
A CW radar is assumed to generate a plane wave that is incident on the scene. The incidentwave is attenuated as it propagates through the forest based on reported specific attenuation valuesfor wooded areas [23]. Human motion is created within the scene to analyze the received signaturecharacteristics. The backscattered fields at the radar are calculated from the contributions of the forestand the human in motion accounting for the first-order mutual coupling effects between the forest andthe human. The forest scattering model represents the trees as PEC cylinders distributed randomlyover a flat ground, and employs a first-order approximation where the contributions from each treeare summed independently. A full wave technique, namely Method of Moments enhanced with FastMultipole Method (MoM-FMM), is employed to accurately model the scattered fields from the humanin motion since this is the main term which contributes to the Doppler signature. The mutual couplingbetween human and the forest can also contribute to the information about the human in motion, andis included in the model.
The rest of the paper is organized as follows. In Section 2, the human walking model based onempirical data is presented. The scattering models for the human and forest are explained in Section 3.The micro-Doppler radar spectrograms are presented in Section 4. The simulation results for varioustest case scenarios are presented in Section 5. Finally, the conclusions are summarized in Section 6.
2. HUMAN WALKING MODEL
Realistic human motion models have been investigated by many authors. Some of these models areobtained from real motion capture data [24]. However such data is limited to specific parameters fromthe captured scene such as the particular direction, speed, and human characteristics. In order to studydifferent human motion effects, we opt to use a standard analytical model extracted from empiricaldata, such as the well-known Boulic model [25–28].
According to the Boulic model, the human body can be described by 16 joints, which are identifiedby the small circles as shown in Figure 1. The body parts are defined by two joints at each end; e.g., footis defined by the toe and the ankle. The 17 body parts are depicted by the head and the lines betweenthe joints as depicted in Figure 1. Each body part is modeled using ellipsoids with different semi-axeslengths appropriate for the corresponding body part. The motion is described using the Boulic walkingmodel based on time-dependent translations and rotations of each joint [25]. The input variables forthis model are the velocity and the height of the human. Given these two inputs, the human is created,and motion characteristics are defined, as shown in Figure 1.
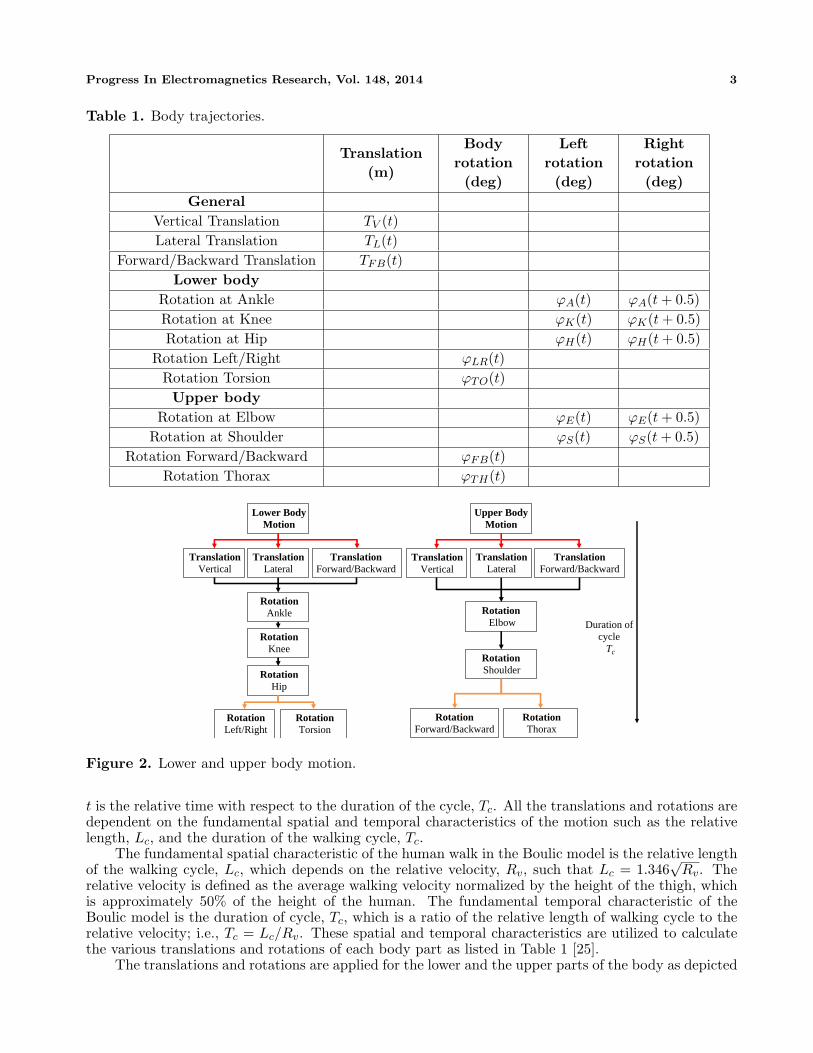
The motion is characterized by cycles that repeat for a constant velocity. Each cycle carries featuresdue to the relative motion of the various joints and body parts. The next position and orientation of abody part in the cycle is calculated using 3 translations and 14 rotation trajectories, five of which areduplicated for both sides of the body. The details of the motion parameters are listed in Table 1 where
Input: Velocity v, Height ofhuman H
Spatial and TemporalCharacteristics L , Tc c
Update a position of every joint atevery time t
Translations and rotations of joints
16 joints
H
Figure 1. Human motion model with 17 body parts, 3 translation trajectories and 14 rotationtrajectories.
Progress In Electromagnetics Research, Vol. 148, 2014 3
Table 1. Body trajectories.
Translation(m)
Bodyrotation(deg)
Leftrotation(deg)
Rightrotation(deg)
GeneralVertical Translation TV (t)Lateral Translation TL(t)
Forward/Backward Translation TFB(t)Lower body
Rotation at Ankle ϕA(t) ϕA(t + 0.5)Rotation at Knee ϕK(t) ϕK(t + 0.5)Rotation at Hip ϕH(t) ϕH(t + 0.5)
Rotation Left/Right ϕLR(t)Rotation Torsion ϕTO(t)Upper body
Rotation at Elbow ϕE(t) ϕE(t + 0.5)Rotation at Shoulder ϕS(t) ϕS(t + 0.5)
Rotation Forward/Backward ϕFB(t)Rotation Thorax ϕTH(t)
Lower BodyMotion
TranslationVertical
TranslationLateral
TranslationForward/Backward
RotationAnkle
RotationKnee
RotationHip
RotationLeft/Right
RotationTorsion
Upper BodyMotion
TranslationVertical
TranslationLateral
TranslationForward/Backward
RotationElbow
RotationShoulder
RotationForward/Backward
RotationThorax
Duration ofcycle
Tc
Figure 2. Lower and upper body motion.
t is the relative time with respect to the duration of the cycle, Tc. All the translations and rotations aredependent on the fundamental spatial and temporal characteristics of the motion such as the relativelength, Lc, and the duration of the walking cycle, Tc.
The fundamental spatial characteristic of the human walk in the Boulic model is the relative lengthof the walking cycle, Lc, which depends on the relative velocity, Rv, such that Lc = 1.346
√Rv. The
relative velocity is defined as the average walking velocity normalized by the height of the thigh, whichis approximately 50% of the height of the human. The fundamental temporal characteristic of theBoulic model is the duration of cycle, Tc, which is a ratio of the relative length of walking cycle to therelative velocity; i.e., Tc = Lc/Rv. These spatial and temporal characteristics are utilized to calculatethe various translations and rotations of each body part as listed in Table 1 [25].
The translations and rotations are applied for the lower and the upper parts of the body as depicted

4 Garcia-Rubia et al.
0 0.2 0.4 0.6 0.8 1 1.2Time (s)
torsoleft handright handleft kneeright kneeleft ankleright ankleleft toeright toe
-1
0
1
2
3
4
5
Spe
ed (
m/s
)
Figure 3. Radial velocities for different body joints in one cycle.
in Figure 2. For example, to define the trajectory of one part of the lower body, 3 translations (vertical,lateral, and forward/backward) are applied to all joints. Then three rotation motions are applied insequence, starting with the ankle, continuing with the knee and finishing with the hip. Finally thetwo rotations left/right and torsion are applied to all lower body joints. The joints’ trajectories for theupper part of the body are calculated in an analogous way.
According to this model, a human with a height of 1.8m, moving at 0.9 m/s has a walking cycleperiod, Tc = 1.346 s. The radial velocities for different body joints are shown for a single walking cycleperiod in Figure 3. The lower part of the legs presents the maximum velocity over the cycle, while thetorso depicts a velocity with very low oscillations around the velocity of the translational movement ofthe human.
3. RADAR SCATTERING MODEL
A continuous wave (CW) microwave radar is assumed to generate a plane wave, E0, that is incident onthe scene. The forest is modeled with PEC cylinders representing the trunks over a flat PEC ground, asshown in Figure 4. The incident wave attenuates as it propagates through the forest. The attenuationinside the medium is assumed constant for all directions based on the reported specific attenuation valuesfor wooded areas at frequencies above 1 GHz [23]. Three contributions from the scene, as depicted inFigure 4 by Ef -r, Eh-r and Ef -h-r, are considered for the calculation of the total backscattered fieldsfrom the scene.
The first term, Ef -r, is the direct contribution from the forest to the radar, which involves a first-order analytical approach accounting for the reflections from the ground. The second term, Eh-r, isthe contribution from the human, which employs the MoM-FMM full wave method. Ground reflectionsand mutual coupling effects between the different body parts are accounted for in this term. Thethird contribution, Ef -h-r, accounts for the first-order interactions between the forest and human bycalculating the incident fields on the human as a result of radiated fields from all trees in the forest. The
RADAR
HUMAN
FOREST
radarE f−rE h−rE
f−h−rE f−hE0E
Figure 4. Contributions to radar signature from the scene.
Progress In Electromagnetics Research, Vol. 148, 2014 5
other mutual coupling term, i.e., the illumination of the forest due to radiated fields from the human isconsidered negligible compared to Ef -h-r. As in the calculation of Ef -r and Eh-r, the reflection from theground and attenuation effects are included in Ef -h-r. The fields at the radar, Eradar , are calculated asthe sum of these three terms, as in (1).
Eradar = Ef -r + Eh-r + Ef -h-r (1)
A description of the modeling approach for these three terms is provided below.
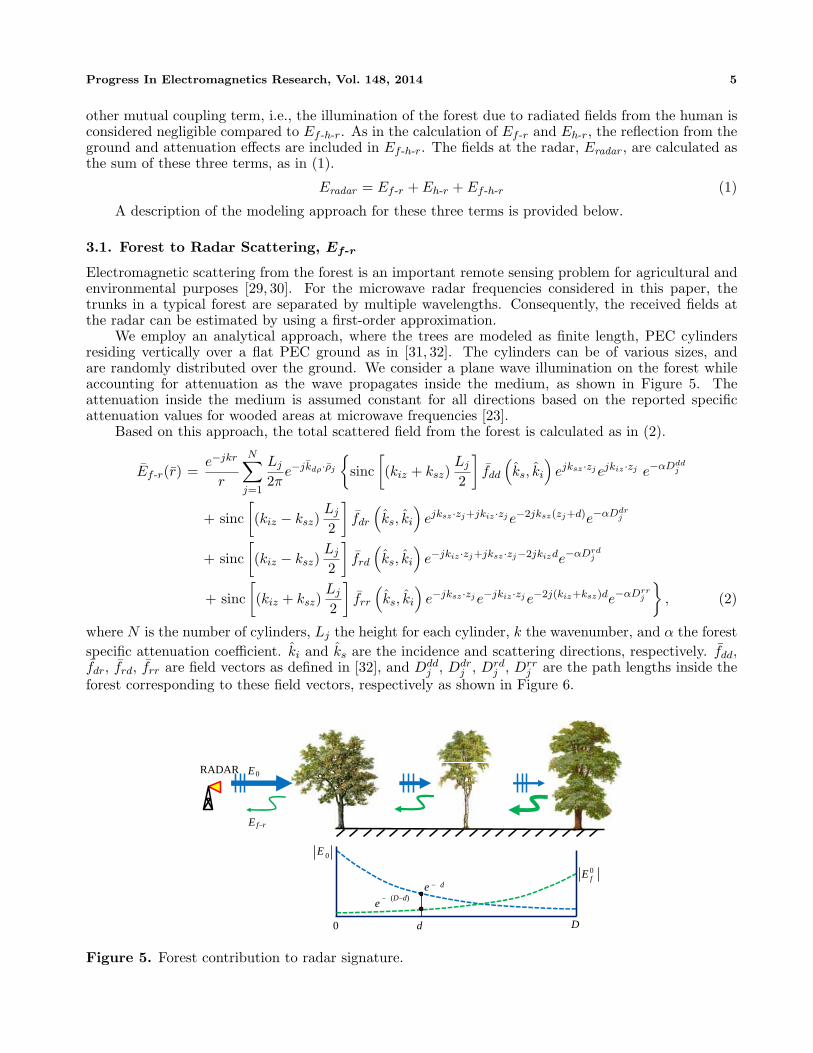
3.1. Forest to Radar Scattering, Ef-r
Electromagnetic scattering from the forest is an important remote sensing problem for agricultural andenvironmental purposes [29, 30]. For the microwave radar frequencies considered in this paper, thetrunks in a typical forest are separated by multiple wavelengths. Consequently, the received fields atthe radar can be estimated by using a first-order approximation.
We employ an analytical approach, where the trees are modeled as finite length, PEC cylindersresiding vertically over a flat PEC ground as in [31, 32]. The cylinders can be of various sizes, andare randomly distributed over the ground. We consider a plane wave illumination on the forest whileaccounting for attenuation as the wave propagates inside the medium, as shown in Figure 5. Theattenuation inside the medium is assumed constant for all directions based on the reported specificattenuation values for wooded areas at microwave frequencies [23].
Based on this approach, the total scattered field from the forest is calculated as in (2).
Ef -r(r) =e−jkr
r
N∑
j=1
Lj
2πe−jkdρ·ρj
{sinc
[(kiz + ksz)
Lj
2
]fdd
(ks, ki
)ejksz ·zjejkiz ·zj e−αDdd
j
+ sinc[(kiz − ksz)
Lj
2
]fdr
(ks, ki
)ejksz ·zj+jkiz ·zje−2jksz(zj+d)e−αDdr
j
+ sinc[(kiz − ksz)
Lj
2
]frd
(ks, ki
)e−jkiz ·zj+jksz ·zj−2jkizde−αDrd
j
+ sinc[(kiz + ksz)
Lj
2
]frr
(ks, ki
)e−jksz ·zje−jkiz ·zje−2j(kiz+ksz)de−αDrr
j
}, (2)
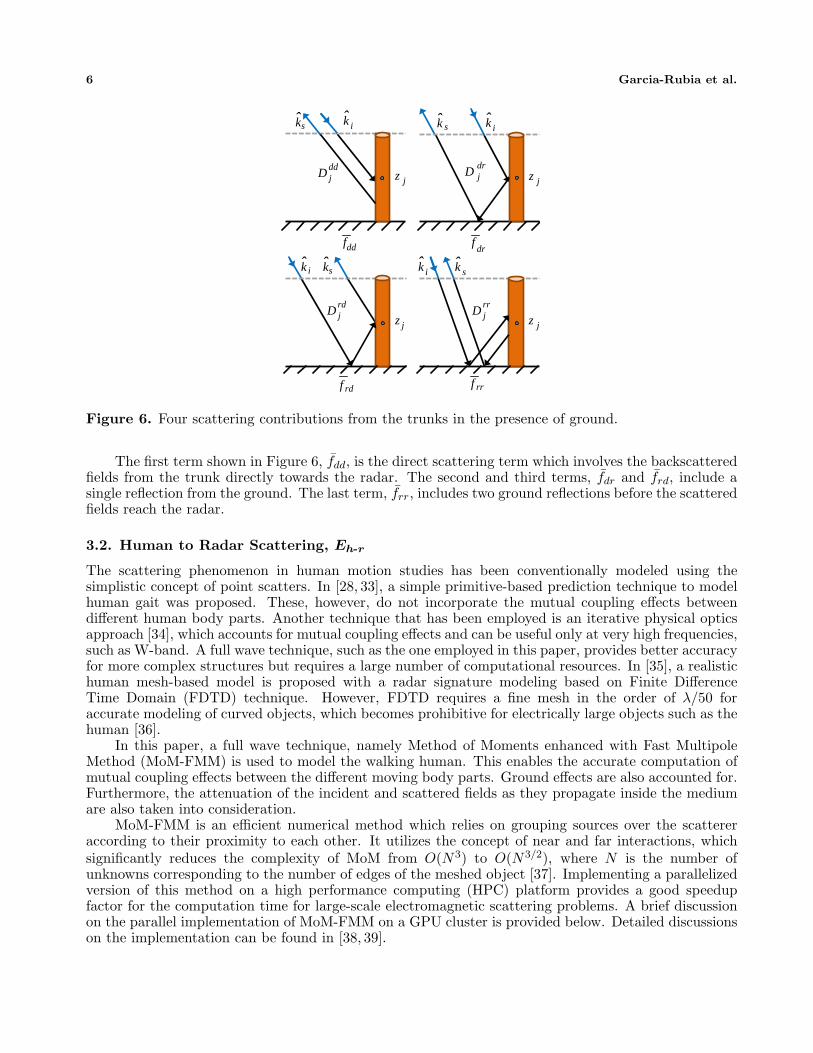
where N is the number of cylinders, Lj the height for each cylinder, k the wavenumber, and α the forestspecific attenuation coefficient. ki and ks are the incidence and scattering directions, respectively. fdd,fdr, frd, frr are field vectors as defined in [32], and Ddd
j , Ddrj , Drd
j , Drrj are the path lengths inside the
forest corresponding to these field vectors, respectively as shown in Figure 6.
0 D
f−rE
RADAR 0E
0E
0fE
d
−α de−α (D−d)
e
Figure 5. Forest contribution to radar signature.
6 Garcia-Rubia et al.
ˆikˆ
sk
ddjD
jz
ˆikˆ
sk
drjD
jz
drfddf
ˆik ˆ
sk
rdjD
jz
rdf
ˆik ˆ
sk
rrjD
jz
rrf
Figure 6. Four scattering contributions from the trunks in the presence of ground.
The first term shown in Figure 6, fdd, is the direct scattering term which involves the backscatteredfields from the trunk directly towards the radar. The second and third terms, fdr and frd, include asingle reflection from the ground. The last term, frr, includes two ground reflections before the scatteredfields reach the radar.
3.2. Human to Radar Scattering, Eh-r
The scattering phenomenon in human motion studies has been conventionally modeled using thesimplistic concept of point scatters. In [28, 33], a simple primitive-based prediction technique to modelhuman gait was proposed. These, however, do not incorporate the mutual coupling effects betweendifferent human body parts. Another technique that has been employed is an iterative physical opticsapproach [34], which accounts for mutual coupling effects and can be useful only at very high frequencies,such as W-band. A full wave technique, such as the one employed in this paper, provides better accuracyfor more complex structures but requires a large number of computational resources. In [35], a realistichuman mesh-based model is proposed with a radar signature modeling based on Finite DifferenceTime Domain (FDTD) technique. However, FDTD requires a fine mesh in the order of λ/50 foraccurate modeling of curved objects, which becomes prohibitive for electrically large objects such as thehuman [36].
In this paper, a full wave technique, namely Method of Moments enhanced with Fast MultipoleMethod (MoM-FMM) is used to model the walking human. This enables the accurate computation ofmutual coupling effects between the different moving body parts. Ground effects are also accounted for.Furthermore, the attenuation of the incident and scattered fields as they propagate inside the mediumare also taken into consideration.
MoM-FMM is an efficient numerical method which relies on grouping sources over the scattereraccording to their proximity to each other. It utilizes the concept of near and far interactions, whichsignificantly reduces the complexity of MoM from O(N3) to O(N3/2), where N is the number ofunknowns corresponding to the number of edges of the meshed object [37]. Implementing a parallelizedversion of this method on a high performance computing (HPC) platform provides a good speedupfactor for the computation time for large-scale electromagnetic scattering problems. A brief discussionon the parallel implementation of MoM-FMM on a GPU cluster is provided below. Detailed discussionson the implementation can be found in [38, 39].

Progress In Electromagnetics Research, Vol. 148, 2014 7
3.2.1. Parallel Implementation
The GPU cluster platform used in the implementation of this model consists of 13 computing nodes.Each node has a dual 6-core 2.66 GHz Intel Xeon processor X5650, 48 GB memory along with one NvidiaTesla M2090 GPU running at 1.3 GHz with 6 GB of GPU memory. The nodes are interconnected throughthe Infiniband interconnection. The cluster populates CUDA v4.2, and MVAPICH2 v1.8.1.
The MoM-FMM algorithm consists of three main steps: pre-processing, processing, and post-processing, as shown in Figure 7. The main purpose of the pre-processing step is to read in the meshgeometry, to set up the data structure, and to divide the edges into groups. The processing step includestwo phases; namely setup and linear system solution. The matrix components for near interactions,the radiation/receive functions and the translation matrix are calculated and stored in the setup phase.Iterative methods are employed for solving the linear system, and each iteration involves matrix-vectormultiplications (MVM), which dominate most of the computation time. The MVM for the Zfar matrixcomprises aggregation, translation, and disaggregation steps as depicted in Figure 7, while the MVM forthe Znear matrix is only an ordinary sparse matrix-vector multiplication. Finally, the post-processingstep involves calculations of electromagnetics quantities of interest.
The entire processing step is implemented on GPU using the CUDA environment. To give aninsight into the problem size, the scattered field calculations from a human of height 1.8 m at 5 GHzusing MoM-FMM, would require 99,422 triangles for a mesh size of λ/8. This corresponds to 149,133unknowns to be solved for using MoM-FMM. A detailed discussion on the parallel implementation ofMoM-FMM on GPU clusters for larger problem sizes can be found in [39].
3.3. Forest-to-Human-to-Radar Scattering, Ef-h-r
The third contribution in the calculation of the total backscattered field at the radar, Ef -h-r, accountsfor the first order interactions between the forest and human. The indirect incident fields on the humanare calculated from the radiated fields from all trees in the forest towards the human. Similar to thecalculation of the Eh-r term, MoM-FMM is utilized to compute the scattered fields from the human
Calculatenear
matrix
Calculateradiation/receive
functions
Calculatetranslation
matrixAggregation
Processing(GPU)
Setup
Znear Z far
Post-processing(CPU)
Pre-processing(CPU)
Solve linear equation
Translation Disaggregation
Far MVM
Figure 7. MoM-FMM processing step flowchart.
i
if−hE
ie
E if−hE
id
0E
f−h−r
−α d
Figure 8. Forest-to-human-to-radar scattering.

8 Garcia-Rubia et al.
based on these incident fields received from the forest. As before, ground reflections and attenuationeffects are accounted for as the fields propagate inside the medium. The concept for the calculation ofthe Ef -h-r term is depicted in Figure 8.
The scattered fields from each tree towards the human, Eif -h, is calculated by meshing each trunk
into triangles and employing MoM-FMM. The induced currents on the trunk due to the incident fieldfrom the radar are computed by treating the trunk as the only scatterer in the medium. Groundreflections and attenuation effects are included as before. The induced currents on each trunk are thenreradiated towards the human. The field incident on the human from each trunk, i.e., Ei
f -h, is calculatedusing the equivalent dipole model as reported in [40–42]. The total fields on the human are calculatedby summing Ei
f−h for all trunks, and MoM-FMM is used to calculate Ef -h-r, i.e., the scattered fieldfrom the human due to the forest coupling.
In order to understand the mutual coupling effects between a trunk and the human, we run a fewtest cases as depicted in Figure 9. The three scenarios in Figure 9 correspond to the different positions ofthe human relative to a trunk located at the origin. In each case, the separation between the trunk andhuman is kept constant at 3λ, and the trunk is illuminated by a vertically polarized plane wave incidentfrom the direction of the radar. The induced fields on the human due to the indirect radiation from thetrunk are shown with a color map in each plot where the color red indicates the highest intensity. Itshould be noted that the fields on the human do not include the direct illumination by the plane wave,i.e., only the coupled fields from the trunk are shown in this figure. The relative positions of the radar,trunk and human are depicted on the right hand side for each case. Figure 9(a) corresponds to the casewhere the radar, trunk and human lie on the same axis, and the human is in the forward scattering
(a)
(c)
E0E
E
0E
E0E
E
E
E
f−h
f−h
f−hf−h
f−h
f−h
y
y
z
z
z
y xy
y
y
x
x
x
x
z
z
z
x(b)
Figure 9. Induced fields on the human due to trunk for three different human positions.
Progress In Electromagnetics Research, Vol. 148, 2014 9
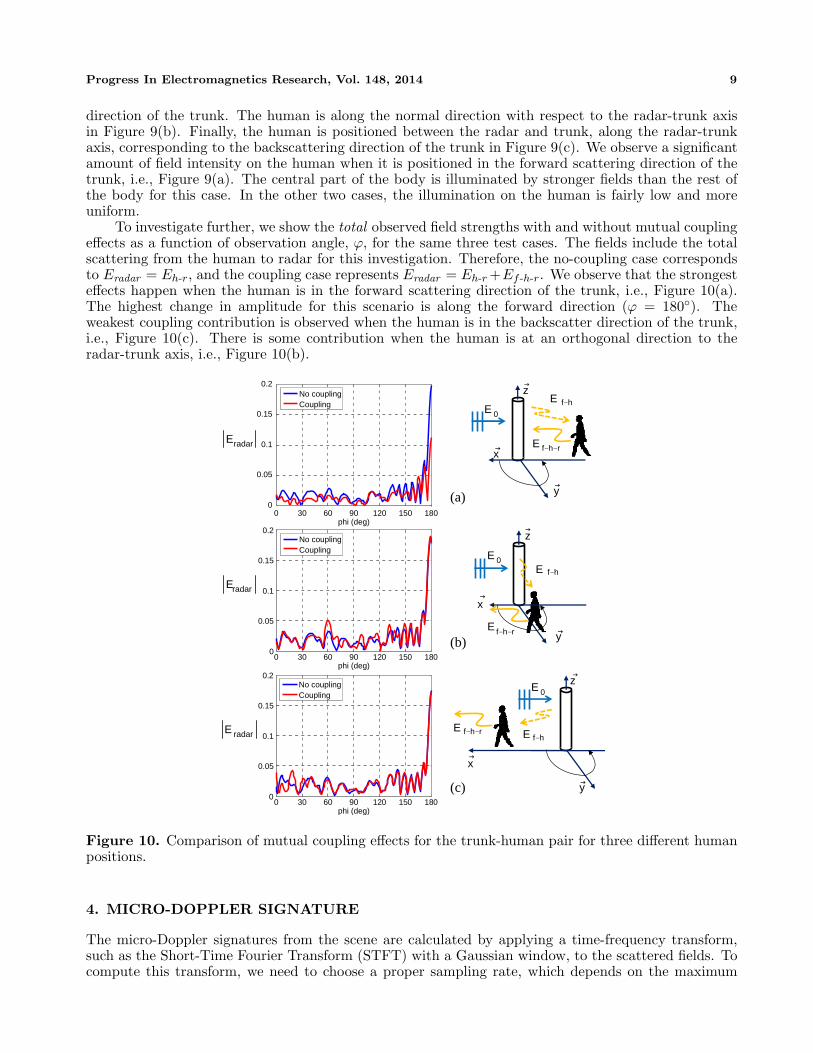
direction of the trunk. The human is along the normal direction with respect to the radar-trunk axisin Figure 9(b). Finally, the human is positioned between the radar and trunk, along the radar-trunkaxis, corresponding to the backscattering direction of the trunk in Figure 9(c). We observe a significantamount of field intensity on the human when it is positioned in the forward scattering direction of thetrunk, i.e., Figure 9(a). The central part of the body is illuminated by stronger fields than the rest ofthe body for this case. In the other two cases, the illumination on the human is fairly low and moreuniform.
To investigate further, we show the total observed field strengths with and without mutual couplingeffects as a function of observation angle, ϕ, for the same three test cases. The fields include the totalscattering from the human to radar for this investigation. Therefore, the no-coupling case correspondsto Eradar = Eh-r, and the coupling case represents Eradar = Eh-r +Ef -h-r. We observe that the strongesteffects happen when the human is in the forward scattering direction of the trunk, i.e., Figure 10(a).The highest change in amplitude for this scenario is along the forward direction (ϕ = 180◦). Theweakest coupling contribution is observed when the human is in the backscatter direction of the trunk,i.e., Figure 10(c). There is some contribution when the human is at an orthogonal direction to theradar-trunk axis, i.e., Figure 10(b).
0 30 60 90 120 150 1800
0.05
0.1
0.15
0.2
phi (deg)
Mag
nitu
de
No couplingCoupling
0 30 60 90 120 150 1800
0.05
0.1
0.15
0.2
phi (deg)
Mag
nitu
de
No couplingCoupling
0 30 60 90 120 150 1800
0.05
0.1
0.15
0.2
phi (deg)
Mag
nitu
de
No couplingCoupling
(a)
(b)
(c)
E0E
E
E0E
E
E
0E
E
radarE
radarE
radarE
f−h
y
x
z
f−h−r
f−h
y
x
z
f−h−r
f−hf−h−r
y
x
z
ϕ
ϕ
ϕ
Figure 10. Comparison of mutual coupling effects for the trunk-human pair for three different humanpositions.
4. MICRO-DOPPLER SIGNATURE
The micro-Doppler signatures from the scene are calculated by applying a time-frequency transform,such as the Short-Time Fourier Transform (STFT) with a Gaussian window, to the scattered fields. Tocompute this transform, we need to choose a proper sampling rate, which depends on the maximum
10 Garcia-Rubia et al.
Time (s)0 0.5 1
-80
-75
-70
-65
-60
-55
-50
-45
-40
Time (s)
Dop
pler
(H
z)
0 0.5 1
-150
-100
-50
0
50
100
150
-80
-70
-60
-50
-40
Left tibia Right tibia
Right footLeft foot
(a) (b)
Dop
pler
(H
z)
-30
-20
-10
0
10
20
30
Figure 11. Spectrogram of walking human at 1 and 5GHz.
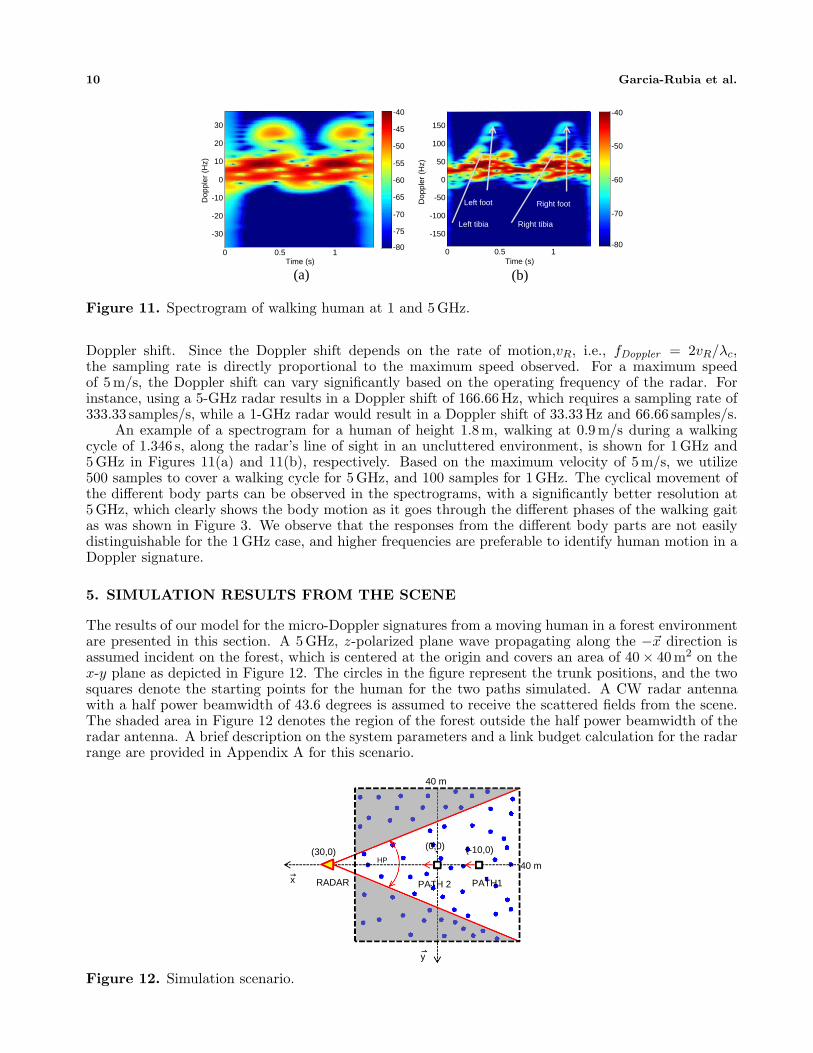
Doppler shift. Since the Doppler shift depends on the rate of motion,vR, i.e., fDoppler = 2vR/λc,the sampling rate is directly proportional to the maximum speed observed. For a maximum speedof 5 m/s, the Doppler shift can vary significantly based on the operating frequency of the radar. Forinstance, using a 5-GHz radar results in a Doppler shift of 166.66 Hz, which requires a sampling rate of333.33 samples/s, while a 1-GHz radar would result in a Doppler shift of 33.33 Hz and 66.66 samples/s.
An example of a spectrogram for a human of height 1.8m, walking at 0.9 m/s during a walkingcycle of 1.346 s, along the radar’s line of sight in an uncluttered environment, is shown for 1 GHz and5GHz in Figures 11(a) and 11(b), respectively. Based on the maximum velocity of 5m/s, we utilize500 samples to cover a walking cycle for 5GHz, and 100 samples for 1 GHz. The cyclical movement ofthe different body parts can be observed in the spectrograms, with a significantly better resolution at5GHz, which clearly shows the body motion as it goes through the different phases of the walking gaitas was shown in Figure 3. We observe that the responses from the different body parts are not easilydistinguishable for the 1GHz case, and higher frequencies are preferable to identify human motion in aDoppler signature.
5. SIMULATION RESULTS FROM THE SCENE
The results of our model for the micro-Doppler signatures from a moving human in a forest environmentare presented in this section. A 5 GHz, z-polarized plane wave propagating along the −~x direction isassumed incident on the forest, which is centered at the origin and covers an area of 40× 40m2 on thex-y plane as depicted in Figure 12. The circles in the figure represent the trunk positions, and the twosquares denote the starting points for the human for the two paths simulated. A CW radar antennawith a half power beamwidth of 43.6 degrees is assumed to receive the scattered fields from the scene.The shaded area in Figure 12 denotes the region of the forest outside the half power beamwidth of theradar antenna. A brief description on the system parameters and a link budget calculation for the radarrange are provided in Appendix A for this scenario.
RADAR
40 m
40 m
(30,0)
PATH 2 PATH1
(0,0) (-10,0)θ HP
y
x
Figure 12. Simulation scenario.

Progress In Electromagnetics Research, Vol. 148, 2014 11
A human of height 1.8m moves with a constant speed of 0.9m/s along the specified direct pathsto radar inside the forest. The human is modeled using PEC ellipsoids, created based on the Boulicmodel as described in Section 2. The forest is modeled using identical trunks of 3 meters height and11 cm radius which are distributed uniformly inside the 40×40m2 region. PEC is assumed for the trunkmaterial properties as well as the ground. A trunk density of 3.8% (#/m2) is assumed, which amountsto 35 trunks within the half power beamwidth of the antenna, with average closest neighbor distanceof 5m. These forest parameters are chosen to reflect the structure and spatial patterns of the trees ina typical old-growth forest [43].
The Doppler spectrogram from the scene is dependent on the path of motion with respect to theradar. To illustrate this effect, we consider two direct walking paths in the forest with different startingpoints as depicted in Figure 12. Path 1 starts farther away from the radar, and should be exposed tomore attenuation than Path 2. Also, as a consequence of being in the back of the forest, the humanfollowing Path 1 will be in the forward scattering zone of more trees than the human in Path 2. This isexpected to result in more coupling effects from the trunks. We investigate the different spectrogramsfor these paths in Figure 13. The same human starts with the same position and moves at the samespeed for the two cases. The first step is taken with the left foot.
We observe that the motion can be detected for both scenarios, although the spectrograms differin nature as seen in the different intensity levels for the left and right feet in Figure 13(a), while theyare similar for Path 2 in Figure 13(b). The weaker signals for the left foot compared to the right foot inFigure 13(a) are due to the coupling effects experienced by the human in Path 1. We also observe thatthe expected attenuation effects are visible, as the signature from the path closer to the radar (Path 2)is 20 dB higher than that of Path 1. This 20 dB difference corresponds to the round trip path loss for the10 meter separation between the two paths, based on the 1 dB/m specific attenuation assumed for theforest at 5 GHz. Another feature we notice is that, despite the attenuation, the micro-Doppler signaturestill reveals the human motion 30m into the forest. Finally as expected, the static contribution fromthe scene is strong across the 0 Hz band for both cases, masking the lower speed motions due to thetorso.
We demonstrate in Figure 14, the spectrogram from the same scene for both paths without
Time (s)
Dop
pler
(H
z)
0 0.5 1-50
0
50
100
150
-140
-130
-120
-110
-100
-90
Time (s)
Dop
pler
(H
z)
0 0.5 1-50
0
50
100
150
-120
-110
-100
-90
-80
-70
(a) (b)
Figure 13. Spectrogram for Eradar = Ef -r + Eh-r + Ef -h-r, for (a) Path 1 and (b) Path 2.
Time (s)
Dop
pler
(H
z)
0 0.5 1-50
0
50
100
150
-140
-130
-120
-110
-100
-90
Time (s)
Dop
pler
(H
z)
0 0.5 1-50
0
50
100
150
-120
-110
-100
-90
-80
-70
(a) (b)
Figure 14. Spectrogram for Eradar = Ef -r +Eh-r, i.e., no mutual coupling, for (a) Path 1 and (b) Path2.

12 Garcia-Rubia et al.
accounting for any coupling effects; i.e., neglecting the Ef -h-r term in the total received fields at theradar. Without the mutual coupling effects, the spectrograms are now similar for the right and theleft feet in both paths. We also observe that the spectrogram for Path 2 without the mutual coupling(Figure 14(b)) is very similar to the spectrogram with the coupling effects (Figure 13(b)), indicatingthat for this path the Ef -h-r term was negligible. This can be explained by the fact that the human wasnot in the forward direction of the any of the trees closest to his path for Path 2, unlike Path 1 wherethe closest few trees were in the direct forward direction.
6. CONCLUSIONS
A capability to detect, track and monitor different human motions in highly cluttered environments,such as forests, is important for security and surveillance operations. In this paper we develop a modelwhich utilizes an enhanced full wave computational technique (MoM-FMM) in combination with a first-order analytical forest model, including specific attenuation inside the forest and mutual coupling effectsbetween the forest and the human. The solution of this large-scale electromagnetic scattering problemhas been made feasible through a parallel implementation on a 13-node GPU cluster. We demonstratethat human bipedal movement is discriminable in spectrograms for a walking human in the forest.
We observe that the contribution from the forest masks the Doppler effect of the low radial velocities,which could happen depending on the path with respect to the radar or due to slow motion. Basedon the specific attenuation values reported in literature for wooded areas, a CW radar at 5 GHz candiscriminate the human motion as far as 30 m into the forest as observed in the spectrogram generatedby our model. Also we note that the contribution from the coupling effects between human and forestis only significant if the human path is in the forward direction of the closest trees in the forest.
APPENDIX A. RADAR RANGE ESTIMATION
A brief summary of the range estimate of the system based on the radar equation, including the forestspecific attenuation α as shown in Recommendation ITU-R P.833-9 [23] is presented in this Appendix.The radar equation is used to estimate the maximum operating range of our radar:
Rmax =(
PT GT GRλ2cσ
(4π)3 SNF (S/Nmin)
)1/4
(A1)
wherePT = transmitter output power = 60 dBm,GT = transmitter antenna (horn) gain = 13.3 dBi, (BW3 dB = 43.6 deg E-plane and H-plane),GR = receiver antenna (horn) gain = 13.3 dBi,λc = carrier frequency wavelength = 0.06m,σ = human body radar cross-section = 0 dBm2,SNF = system noise floor = −130 dBm,S/Nmin = minimum signal-to-noise ratio = 10 dB.Using (A1) with the parameters above, we estimate the maximum operating range of our CW radar
operating at 5GHz for human detection in free-space to be 5,406 m. For forest attenuation of 80 dB(typical specific attenuation of 1 dB/m for vertical polarization as shown in Recommendation ITU-RP.833-9 [23], along a woodland path of 40 m), the estimated maximum operating range becomes 54.3 m.
REFERENCES
1. Mencia-Oliva, B., J. Grajal, O. A. Yeste-Ojeda, G. Rubio-Cidre, and A. Badolato, “Low-cost CW-LFM radar sensor at 100 GHz,” IEEE Transactions on Microwave Theory and Techniques, Vol. 61,No. 2, 986–998, 2013.
2. Sume, A., M. Gustafsson, M. Herberthson, A. Janis, S. Nilsson, J. Rahm, and A. Orbom,“Radar detection of moving targets behind corners,” IEEE Transactions on Geoscience and RemoteSensing, Vol. 49, No. 6, 2259–2267, 2011.

Progress In Electromagnetics Research, Vol. 148, 2014 13
3. Tahmoush, D. and J. Silvious, “Remote detection of humans and animals,” 2009 IEEE AppliedImagery Pattern Recognition Workshop (AIPRW), 1–8, 2009.
4. Otero, M., “Application of a continuous wave radar for human gait recognition,” Signal Processing,Sensor Fusion, and Target Recognition XIV, Vol. 5809, 538, Orlando, Florida, USA, Mar. 28, 2005.
5. Chen, V. C., F. Li, S.-S. Ho, and H. Wechsler, “Micro-Doppler effect in radar: Phenomenon, model,and simulation study,” IEEE Transactions on Aerospace and Electronic Systems, Vol. 42, No. 1,2–21, 2006.
6. Jung, J. H., U. Lee, S. H. Kim, and S. H. Park, “Micro-Doppler analysis of Korean offshore windturbine on the L-band radar,” Progress In Electromagnetics Research, Vol. 143, 87–104, 2013.
7. Park, J. H. and N. H. Myung, “Effective reconstruction of the rotation-induced micro-doppler froma noise-corrupted signature,” Progress In Electromagnetics Research, Vol. 138, 499–518, 2013.
8. Pan, X., W. Wang, J. Liu, D. J. Feng, Y. Liu, and G. Wang, “Features extraction of rotationallysymmetric ballistic targets based on micro-doppler,” Progress In Electromagnetics Research,Vol. 137, 727–740, 2013.
9. Kim, Y. and H. Ling, “Human activity classification based on micro-Doppler signatures using asupport vector machine,” IEEE Transactions on Geoscience and Remote Sensing, Vol. 47, No. 5,1328–1337, 2009.
10. Fairchild, D. P. and R. M. Narayanan, “Classification and modeling of human activities usingempirical mode decomposition with S-band and millimeter-wave micro-Doppler radars,” RadarSensor Technology XVI, Vol. 8361, Jun. 2012.
11. Lin, A. and H. Ling, “Doppler and direction-of-arrival (DDOA) radar for multiple-mover sensing,”IEEE Transactions on Aerospace and Electronic Systems, Vol. 43, No. 4, 1496–1509, 2007.
12. Li, C., J. Ling, J. Li, and J. Lin, “Accurate Doppler radar noncontact vital sign detection usingthe RELAX algorithm,” IEEE Transactions on Instrumentation and Measurement, Vol. 59, No. 3,687–695, 2010.
13. Zhou, Q., J. Liu, A. Host-Madsen, O. Boric-Lubecke, and V. Lubecke, “Detection of multipleheartbeats using Doppler radar,” 2006 IEEE International Conference on Acoustics, Speech andSignal Processing, ICASSP 2006 Proceedings, Vol. 2, II, 2006.
14. Chen, Y. F., D. Misra, H. Wang, H.-R. Chuang, and E. Postow, “An X-band microwave life-detection system,” IEEE Transactions on Biomedical Engineering, Vol. 33, No. 7, 697–701, 1986.
15. Chen, Y. F., Y. Huang, J. Zhang, and A. Norman, “Microwave life-detection systems for searchinghuman subjects under earthquake rubble or behind barrier,” IEEE Transactions on BiomedicalEngineering, Vol. 47, No. 1, 105–114, 2000.
16. Silvious, J., J. Clark, T. Pizzillo, and D. Tahmoush, “Micro-Doppler phenomenology of humans atUHF and Ku-band for biometric characterization,” SPIE Defense, Security, and Sensing, 73080X–73080X-9, 2009.
17. Chen, V. C., “Detection and analysis of human motion by radar,” IEEE Radar Conference,RADAR’ 08, 1–4, 2008.
18. Li, J., X. Zhu, P. Stoica, and M. Rangaswamy, “High resolution angle-doppler imaging for MTIradar,” IEEE Transactions on Aerospace and Electronic Systems, Vol. 46, No. 3, 1544–1556, 2010.
19. Armstrong, B. and B. S. Holeman, “Target tracking with a network of Doppler radars,” IEEETransactions on Aerospace and Electronic Systems, Vol. 34, No. 1, 33–48, 1998.
20. Thayaparan, T., L. Stankovi, and I. Djurovi, “Micro-Doppler-based target detection and featureextraction in indoor and outdoor environments,” Journal of the Franklin Institute, Vol. 345, No. 6,700–722, 2008.
21. Geisheimer, J. L., W. S. Marshall, and E. Greneker, “A continuous-wave (CW) radar for gaitanalysis,” Conference Record of the Thirty-Fifth Asilomar Conference on Signals, Systems andComputers, Vol. 1, 834–838, 2001.
22. Mobasseri, B. G. and M. G. Amin, “A time-frequency classifier for human gait recognition,” Proc.of SPIE, Vol. 7306, 730628, 2009.
23. ITU-R, “Attenuation in vegetation,” Recommendation ITU-R, 833-8, ITU Radiocommunication

14 Garcia-Rubia et al.
Bureau, Geneva, Switzerland, 2013.24. Muller, M., T. Roder, M. Clausen, B. Eberhardt, B. Kruger, and A. Weber, “Documentation mocap
database HDM05,” Technical Report No. CG-2007-2, ISSN 1610-8892, Universitat Bonn, 2007.25. Boulic, R., N. Thalmann, and D. Thalmann, “A global human walking model with real-time
kinematic personification,” The Visual Computer, Vol. 6, No. 6, 344–358, 1990.26. Chen, V. C., “Doppler signatures of radar backscattering from objects with micro-motions,” IET
Signal Processing, Vol. 2, No. 3, 291–300, 2008.27. Ram, S. S. and H. Ling, “Analysis of microDopplers from human gait using reassigned joint time-
frequency transform,” Electronics Letters, Vol. 43, No. 23, 2007.28. Van Dorp, P. and F. C. A. Groen, “Human walking estimation with radar,” IEE Proceedings —
Radar, Sonar and Navigation, Vol. 150, No. 5, 356–365, 2003.29. Picard, G. and T. L. Toan, “A multiple scattering model for C-band backscatter of wheat canopies,”
Journal of Electromagnetic Waves and Applications, Vol. 16, No. 10, 1447–1466, 2002.30. Lang, R. H. and J. S. Sighu, “Electromagnetic backscattering from a layer of vegetation: A discrete
approach,” IEEE Transactions on Geoscience and Remote Sensing, Vol. 21, No. 1, 62–71, 1983.31. Tsang, L., K. Ding, G. Zhang, C. C. Hsu, and J. Kong, “Backscattering enhancement and clustering
effects of randomly distributed dielectric cylinders overlying a dielectric half space based on Monte-Carlo simulations,” IEEE Transactions on Antennas and Propagation, Vol. 43, No. 5, 488–499,1995.
32. Tsang, L., J. A. Kong, K. Ding, and C. O. Ao, Scattering of Electromagnetic Waves, NumericalSimulations, John Wiley & Sons, 2004.
33. Ram, S. S., C. Christianson, Y. Kim, and H. Ling, “Simulation and analysis of human micro-Dopplers in through-wall environments,” IEEE Transactions on Geoscience and Remote Sensing,Vol. 48, No. 4, 2015–2023, 2010.
34. Vahidpour, M. and K. Sarabandi, “Millimeter-wave Doppler spectrum and polarimetric response ofwalking bodies,” IEEE Transactions on Geoscience and Remote Sensing, Vol. 50, No. 7, 2866–2879,2012.
35. Dogaru, T. and C. Le, “Time-frequency analysis of a moving human doppler signature,” ARL-TR-4728, US Army Research Laboratory, Adelphi, MD, 2009.
36. Tavlove, A. and S. C. Hagness, Computational Electrodynamics: The Finite-difference Time-domain Method, 3rd Edition, Artech House, 2005.
37. Coifman, R., V. Rokhlin, and S. Wandzura, “The fast multipole method for the wave equation: Apedestrian prescription,” IEEE Antennas and Propagation Magazine, Vol. 35, No. 3, 7–12, 1993.
38. Nguyen, Q., V. Dang, and O. Kilic, “Graphics processing unit accelerated fast multipole method— Fast Fourier transform,” IEEE Antennas and Propagation Society International Symposium(APSURSI 2013), 1882–1883, Lake Buena Vista, FL, USA, Jul. 7–12, 2013.
39. Nguyen, Q. M., V. Dang, O. Kilic, and E. El-Araby, “Parallelizing fast multipole method for large-scale electromagnetic problems using GPU clusters,” IEEE Antennas and Wireless PropagationLetters, Vol. 12, 868–871, 2013.
40. Rao, S. M., D. Wilton, and A. W. Glisson, “Electromagnetic scattering by surfaces of arbitraryshape,” IEEE Transactions on Antennas and Propagation, Vol. 30, No. 3, 409–418, 1982.
41. Leat, C. J., N. V. Shuley, and G. F. Stickley, “Triangular-patch model of bowtie antennas:Validation against Brown and Woodward,” IEE Proceedings — Microwaves, Antennas andPropagation, Vol. 145, No. 6, 465–470, 1998.
42. Makarov, S., Antenna and EM Modeling with MATLAB, Princeton University Press, 2002.43. Chokkalingam, U. and A. White, “Structure and spatial patterns of trees in old-growth northern
hardwood and mixed forests of northern Maine,” Plant Ecology, Vol. 156, No. 2, 139–160, 2001.