Embed Size (px)
Citation preview
ANALYSIS OF NEW YORK LAGUARDIA AIRPORT GATE-WAITING DELAYS Jianfeng Wang Center for Air Transportation Systems Research Department of Systems Engineering and Operations Research George Mason University Telephone: 1-703-965-1097 [email protected] John F. Shortle Center for Air Transportation Systems Research Department of Systems Engineering and Operations Research George Mason University http://mason.gmu.edu/~jshortle/ Lance Sherry Center for Air Transportation Systems Research Department of Systems Engineering and Operations Research George Mason University DATE – August 1, 2009 Text: 5302 words 8 figures: 250 * 8 = 2000 words Total: 7302 words (limit: 7500 words)
ABSTRACT Airport gates are one of the congestion points of the air transportation system. When an arriving flight lands on a runway, it is possible that it cannot pull into its gate due to gate unavailability. We define this phenomenon as gate-waiting delay. This paper gives a functional analysis of gate-waiting delays at New York Laguardia airport (LGA) for 92 days in the summer of 2007. We find that daily delays are typically not problematic (less than 600 minutes in 80 days). However, in the worst days, delays can be extremely large (1200 to 2400 minutes in the worst 4 days when worst 6 delayed flights are delayed for almost 3 hours in average). In the 12 worst days, there are 9 days in which delays can be attributed to a higher gate demand than the number of existing gates. On 8 of these days, this is due to compressed arrivals. On one day, this is due to increased gate-occupancy times. Delay mitigation strategies are also discussed.
Wang, Shortle and Sherry Page 2
ANALYSIS OF NEW YORK LAGUARDIA AIRPORT GATE-WAITING DELAYS
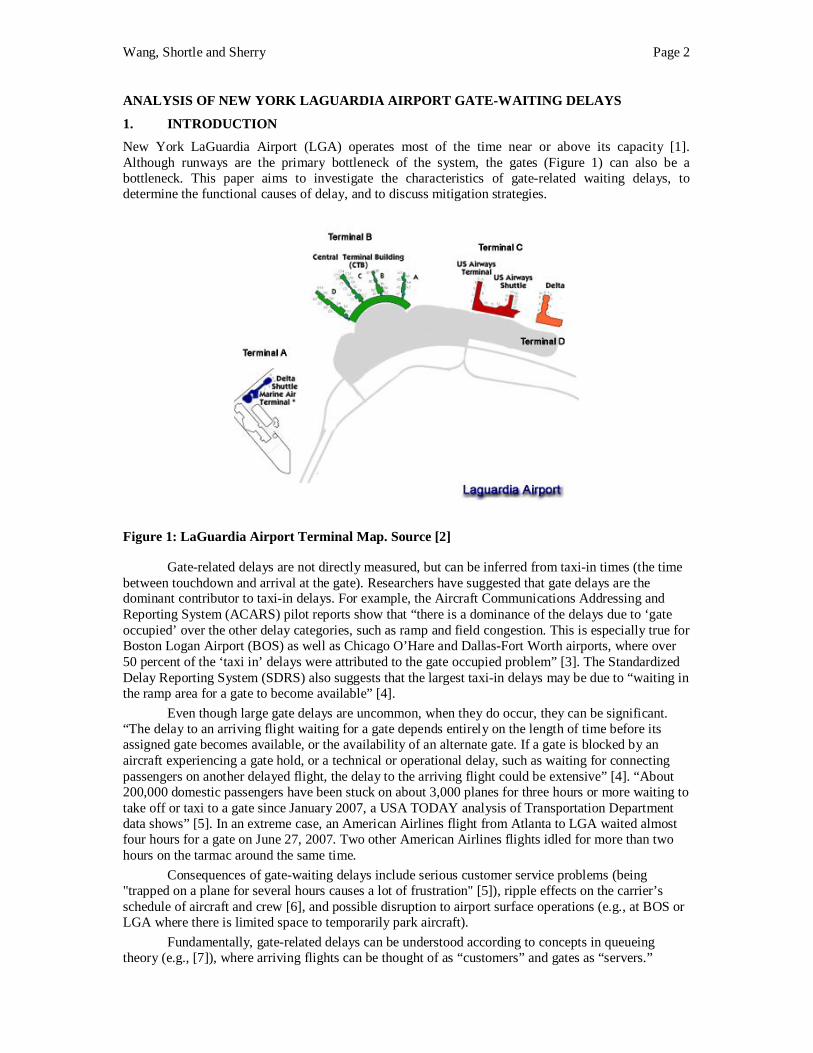
1. INTRODUCTION New York LaGuardia Airport (LGA) operates most of the time near or above its capacity [1]. Although runways are the primary bottleneck of the system, the gates (Figure 1) can also be a bottleneck. This paper aims to investigate the characteristics of gate-related waiting delays, to determine the functional causes of delay, and to discuss mitigation strategies.
Figure 1: LaGuardia Airport Terminal Map. Source [2]
Gate-related delays are not directly measured, but can be inferred from taxi-in times (the time between touchdown and arrival at the gate). Researchers have suggested that gate delays are the dominant contributor to taxi-in delays. For example, the Aircraft Communications Addressing and Reporting System (ACARS) pilot reports show that “there is a dominance of the delays due to ‘gate occupied’ over the other delay categories, such as ramp and field congestion. This is especially true for Boston Logan Airport (BOS) as well as Chicago O’Hare and Dallas-Fort Worth airports, where over 50 percent of the ‘taxi in’ delays were attributed to the gate occupied problem” [3]. The Standardized Delay Reporting System (SDRS) also suggests that the largest taxi-in delays may be due to “waiting in the ramp area for a gate to become available” [4].
Even though large gate delays are uncommon, when they do occur, they can be significant. “The delay to an arriving flight waiting for a gate depends entirely on the length of time before its assigned gate becomes available, or the availability of an alternate gate. If a gate is blocked by an aircraft experiencing a gate hold, or a technical or operational delay, such as waiting for connecting passengers on another delayed flight, the delay to the arriving flight could be extensive” [4]. “About 200,000 domestic passengers have been stuck on about 3,000 planes for three hours or more waiting to take off or taxi to a gate since January 2007, a USA TODAY analysis of Transportation Department data shows” [5]. In an extreme case, an American Airlines flight from Atlanta to LGA waited almost four hours for a gate on June 27, 2007. Two other American Airlines flights idled for more than two hours on the tarmac around the same time.
Consequences of gate-waiting delays include serious customer service problems (being "trapped on a plane for several hours causes a lot of frustration" [5]), ripple effects on the carrier’s schedule of aircraft and crew [6], and possible disruption to airport surface operations (e.g., at BOS or LGA where there is limited space to temporarily park aircraft).
Fundamentally, gate-related delays can be understood according to concepts in queueing theory (e.g., [7]), where arriving flights can be thought of as “customers” and gates as “servers.”
Wang, Shortle and Sherry Page 3
According to queueing theory, waiting time is a function of arrival (runway landing) patterns, service (gate occupancy) patterns, number of available servers (gates), and the queueing discipline (first-come-first served, priority, etc.). The objective of this paper is to identify which of these functions contributes most to the worst gate delays at LGA.
This paper is organized as follows. Section 2 reviews the existing literature on gate-waiting delay. Section 3 describes existing data sources used in this research. Section 4 explains several data inference methods to construct the above queueing system elements. Section 5 presents the results of gate-waiting delay analysis.
2. LITERATURE REVIEW
2.1 Gate-waiting Delay Reasons There can be two reasons for gate-waiting delay, gate over-scheduling and deviation of operation from schedule. True, certain carriers may overschedule gate capacity at certain airports at certain times. “Airlines overschedule flights at hub airports, which creates a situation in which there are too many planes and not enough gates, says Barbara Beyer, CEO of Avmark, an airline consulting company” [5]. “Observations at Logan Airport showed that despite the limited gate capacity, some airlines overschedule their gates and consequently have simultaneously more aircraft on the ground than the number of available gates” [8]. However, gate over-scheduling is usually not the reason because “airline normally schedule gates for only up to 80% occupancy, knowing that they will need extra facilities to cope with random occurrences” [9]. Authors’ earlier research shows that schedules across different days are similar and gate-waiting delay is not a problem for most of days [10]. So deviation of operation from schedule is the major cause of gate-waiting delay.
As mentioned before, according to queueing theory [7], gate-waiting delay can be due to higher arrival rate, lower service rate, reduced number of available gates and a queueing discipline not to minimize gate-waiting delay. “A ‘gate occupied’ delay may occur because an arrival aircraft is early; however, it is often caused by departure delays from leaving the gate on schedule, due to gate operations or due to other constraints such as absorbing ground delays” [8]. Another reason is reduced number of available gates in inclement weather or when ramp staff is unavailable [11]. Queueing discipline can also be a reason. It is possible that an aircraft doesn’t go to a gate even if the gate is open to this aircraft (carrier and aircraft type match). For example, based on communication with a gate manager of United Airlines at O’Hare airport, United Airlines usually let an arrival aircraft wait for its original assigned gate even if there is an open alternative gate when the gate conflict is detected late. The reason is that they don’t want to redirect crew and passengers on the ground to another gate with short lead time unless the expected gate-waiting delay is too long, say, more than 10 minutes.
The above functional causes are usually obtained either anecdotally or based on experience. And authors have not found any statistics on these gate-waiting delay reasons yet.
2.2 Gate-waiting Delay Mitigation Surely, reducing gate demand and increasing gate capacity is most effective to reduce gate-waiting delay. However, it doesn’t justify the cost based on the fact that gate-waiting delay is not a problem in most of the days. So the key is to find a better way to deal with schedule disruption. In addition, airports like LGA don’t have the land space for terminal expansion.
One effective approach to mitigate gate-waiting delay is using shared use or common use gates by airports. At Boston Logan Airport (BOS), the Mass-Port Authority (MPA), which maintains Logan Airport, can force gate exchange when an airline is underutilizing a gate, especially for International flights which have a limited number of gates in Terminal E [8]. Two primary drivers that motivate the use of shared gate are peaking of traffic at different times and uncertainty in the level or type of traffic [12]. [13] used queueing theory to estimate the fraction of gate capacity that should be reserved for unscheduled extra needs due to delays and other random events. And the key finding is that the fraction decreases when the number of scheduled gates is larger (basically, this is because random effects tends to cancel out more when G is larger) [12]. So ideally, airport should probably reserve a certain fraction of gates as common use to account for uncertainty and individual carriers’ peak traffic only. And then individual carriers can schedule their gates to full capacity. However, authors have not found any quantitative research on this important aspect of airport gate capacity
Wang, Shortle and Sherry Page 4
allocation. This fraction should probably be a function of time of day since uncertainties later in the day is usually higher. The fraction could also be a function of weather forecast which projects uncertainty level on a day to day basis.
Another approach to mitigate gate-waiting delay is the gate reassignments by airlines, which should already been a common practice in today’s airline industry. Updated estimated arrival time and departure time are used for future gate conflict detection and proactive resolution. Many gate reassignment heuristics were developed to mitigate gate-waiting delay due to operation disruption. [14] describes a genetic algorithm to reassign gates in response of disruptions. [15] [16] [17] even evaluate the robustness of the initial gate assignment plan and the real-time gate changes necessary to meet the stochastic flight delays in real operations. However, the research above has typically considered small stochastic delay in the schedule and not major disruptions including cancellations and high delays. Results of this paper would be helpful for the construction of major disruption scenarios for the design of gate reassignment algorithms.
If gate-waiting is inevitable, it’s preferred to park the gate-waiting aircraft in non movement area to minimize disruption to taxiway and ramp operations. For example, BOS uses hangar positions to store aircraft that do not have a gate readily available [8]. Chicago O’Hare airport use penalty box to park gate-waiting aircraft temporarily [18]. And New York John F. Kennedy International Airport (JFK) uses inactive taxiways based on Sensis Taxiview video.
3. DATA SOURCES This paper uses the following data sources for LGA analysis in summer (June-August) 2007.
3.1 Airline On-Time Performance Database This database is maintained by the Bureau of Transportation Statistics (BTS), part of the United States Department of Transportation (DOT). This database has only one table, On-Time Performance. This table contains on-time arrival data for non-stop domestic flights by major air carriers, and provides such additional items as departure and arrival delays, origin and destination airports, flight numbers, scheduled and actual departure and arrival times, cancelled or diverted flights, taxi-out and taxi-in times, air times, and non-stop distances [19]. Key fields in this table are “wheels-on” time (the time that an aircraft lands on runway, see [20] for a precise definition), “gate-in” time (the time that an aircraft pulls into a gate), “gate-out” time (the time that an aircraft pushes back from a gate), and “taxi-in” time (the difference between “wheels-on” time and “gate-in” time).
3.2 Aviation System Performance Metrics (ASPM) Database The ASPM Database is one of several databases maintained by the Federal Aviation Administration (FAA). We use the taxi-times table from this database. Key fields in this table are airport, carrier code, season, and unimpeded taxi-in time. The unimpeded taxi-in time is an estimate of taxi-in time under optimal operating conditions (when congestion, weather, and other delay factors are not significant). This number is estimated by calendar year for each carrier and airport reporting in the ASQP and ARINC data [21]. The estimation method is based on a regression model for taxi-in times and taxi queue lengths [22].
3.3 Other Data Sources and Assumptions The website panynj.gov provides a list of gates and gate users (carriers) at LGA. We also use Google Maps as a secondary source to get contact gate and remote gate (hard stand) information that is not on panynj.gov. For example, Google Maps shows five remote gates of Delta Air Lines on the east side of LGA, not given in panynj.gov. The website www.flightstats.com provides the actual gate assignments for most flights. Finally, we use a Sensis Aerobahn TaxiView surface movement video of JFK as a validation check of the algorithms.
In this paper, we ignore issues associated A gate also has aircraft type property and adjacency property, means that a gate is compatible with only a certain type of aircraft, and an aircraft occupying a gate may block its adjacent gates from being used.
Wang, Shortle and Sherry Page 5
4. DATA DERIVATION AND ESTIMATION METHODS This section describes methods to estimate gate-waiting delay, actual gate demand, gate-occupancy time, and so forth. These elements are not directly given in any database.
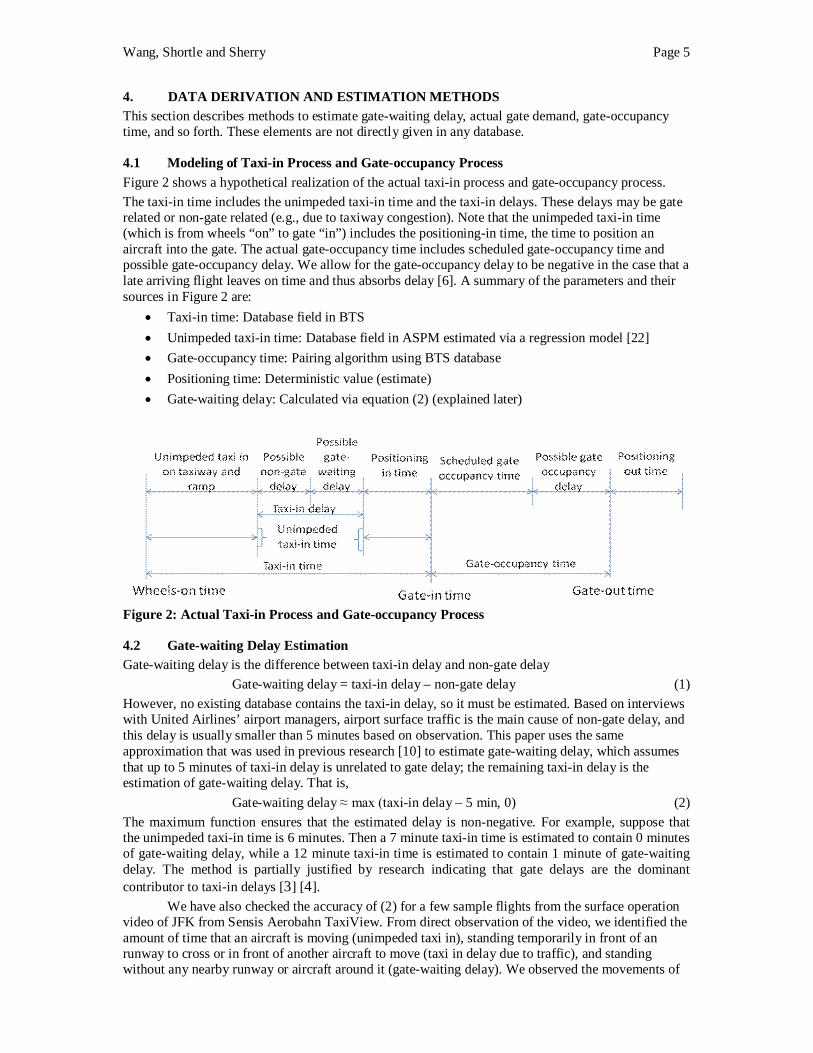
4.1 Modeling of Taxi-in Process and Gate-occupancy Process Figure 2 shows a hypothetical realization of the actual taxi-in process and gate-occupancy process. The taxi-in time includes the unimpeded taxi-in time and the taxi-in delays. These delays may be gate related or non-gate related (e.g., due to taxiway congestion). Note that the unimpeded taxi-in time (which is from wheels “on” to gate “in”) includes the positioning-in time, the time to position an aircraft into the gate. The actual gate-occupancy time includes scheduled gate-occupancy time and possible gate-occupancy delay. We allow for the gate-occupancy delay to be negative in the case that a late arriving flight leaves on time and thus absorbs delay [6]. A summary of the parameters and their sources in Figure 2 are:
Taxi-in time: Database field in BTS Unimpeded taxi-in time: Database field in ASPM estimated via a regression model [22] Gate-occupancy time: Pairing algorithm using BTS database Positioning time: Deterministic value (estimate) Gate-waiting delay: Calculated via equation (2) (explained later)
Figure 2: Actual Taxi-in Process and Gate-occupancy Process
4.2 Gate-waiting Delay Estimation Gate-waiting delay is the difference between taxi-in delay and non-gate delay
Gate-waiting delay = taxi-in delay – non-gate delay (1) However, no existing database contains the taxi-in delay, so it must be estimated. Based on interviews with United Airlines’ airport managers, airport surface traffic is the main cause of non-gate delay, and this delay is usually smaller than 5 minutes based on observation. This paper uses the same approximation that was used in previous research [10] to estimate gate-waiting delay, which assumes that up to 5 minutes of taxi-in delay is unrelated to gate delay; the remaining taxi-in delay is the estimation of gate-waiting delay. That is,
Gate-waiting delay ≈ max (taxi-in delay – 5 min, 0) (2) The maximum function ensures that the estimated delay is non-negative. For example, suppose that the unimpeded taxi-in time is 6 minutes. Then a 7 minute taxi-in time is estimated to contain 0 minutes of gate-waiting delay, while a 12 minute taxi-in time is estimated to contain 1 minute of gate-waiting delay. The method is partially justified by research indicating that gate delays are the dominant contributor to taxi-in delays [3] [4].
We have also checked the accuracy of (2) for a few sample flights from the surface operation video of JFK from Sensis Aerobahn TaxiView. From direct observation of the video, we identified the amount of time that an aircraft is moving (unimpeded taxi in), standing temporarily in front of an runway to cross or in front of another aircraft to move (taxi in delay due to traffic), and standing without any nearby runway or aircraft around it (gate-waiting delay). We observed the movements of
Wang, Shortle and Sherry Page 6
two long taxi-in delayed flights and the estimation error was no more than 3 minutes. (Delta 99 on 9/28/2008 was observed to have 32 minutes of gate-waiting delay compared with the original estimate of 34.4 minutes; Comair 6453 on 10/10/2008 was observed to have 15 minutes gate-waiting delay compared with the original estimate of 16.4 minutes.)
Of course, equation (2) is still an approximation, based on the 5-minute estimate. this is an approximation and will introduce errors, for example, fixed 5 minute non-gate
related taxi-in delay pushes all the variation in the data to the gate related delays. And this causes relatively big error for small gate-waiting delay, for example, 4 minutes gate-waiting delay with 3 minutes error is not very meaningful.
However, in this paper, we are concerned with large gate delays. Thus, the results of the analysis in this paper show that major pattern of gate-waiting delay is high and dense, that is, many flights experience high gate-waiting delay in a short time window in a specific day, for example, the 14 Comair arrival flights on August 8, 2007 landing before noon experience 73 minutes delay in average. And in this case, 3 minutes error of gate-waiting delay estimation doesn’t affect the results very much.
4.3 Gate-occupancy Time Derivation Gate occupancy time is determined by pairing an aircraft arrival with its departure using its tail number as described in [10]. One limitation of this method is that there are arrivals that cannot be paired with any departure. This may be due to a loss of data or because the aircraft goes to maintenance. Second, it is possible that an aircraft is towed out of the gate after arrival and then towed into the gate before departure, especially at night. For example, based on this pairing algorithm and the declared gate capacity, American Airlines tows about 6 aircraft at night.
4.4 Gate Positioning Time Estimation Typical values for positioning time are 2-4 minutes for remote stands to as much as 10 minutes or more for contact stands (due primarily to the time-consuming pushback maneuver) [23]. As a rough estimate, we use a constant value of 5 minutes for positing time, including 1 minute for positioning in and 4 minutes for positioning out. Sensitivity analysis has shown that this estimation does not affect the main results of this paper.
We define “gate demand” to be the number of aircraft that are occupying a gate or that could occupy a gate if one were available. For a given aircraft, this demand starts at the earliest time that it could use the gate – or more specifically, could block other aircraft from using the gate, including the positioning-in time. This is given by the following formula:
Gate demand start time = gate-in time – positioning-in time – gate-waiting delay ≈ gate-in time – 1 min – max (taxi-in delay – 5 min, 0) = min (wheels-on time + unimpeded taxi-in time + 4 min, gate-in time – 1 min).
This demand ends when the aircraft leaves the gate making it available to the next aircraft, including the positioning-out time. So
Gate demand end time ≈ actual gate-out time + 4 minutes.
5. RESULTS To understand functional causes of high gate-waiting delays, we investigate queueing parameters in the LGA system, including gate utilization, arrival rate, and gate occupancy time.
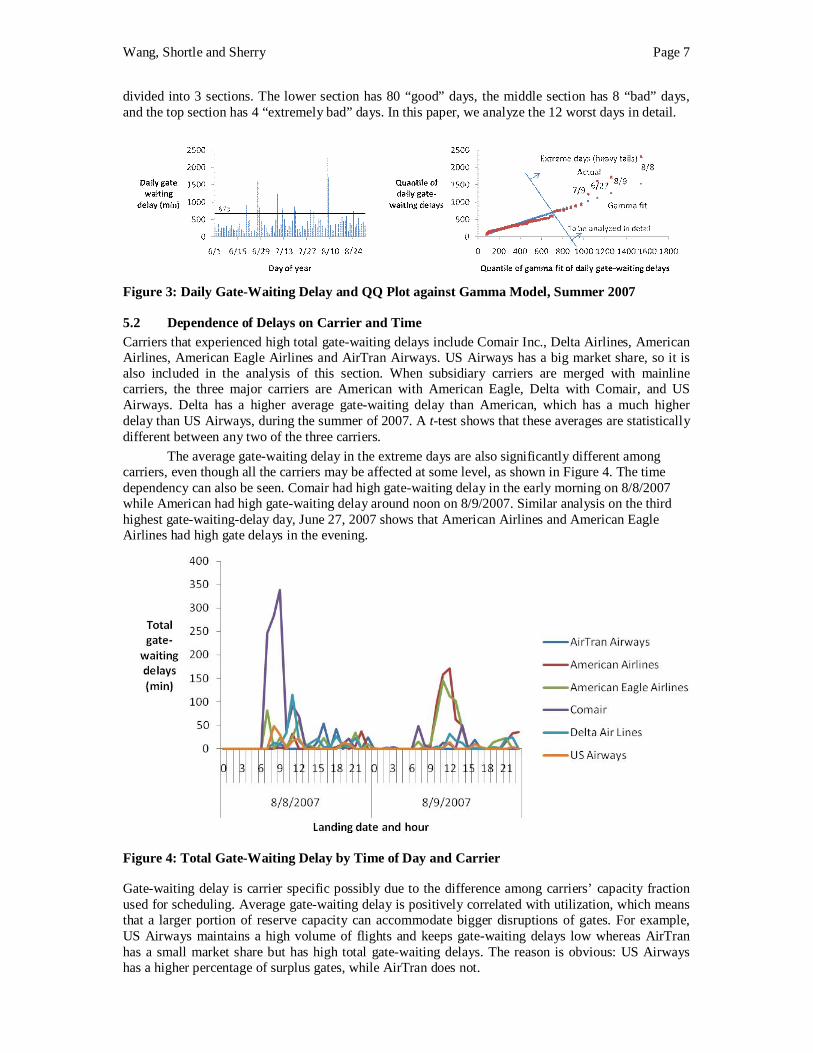
5.1 High Gate-waiting Delay Days The left side of Figure 3 shows the total gate-waiting delay at LGA for each day of the summer of 2007. On most days, the delay is not very high. But on a few days, the delay is very high. The right figure is a quantile-quantile (QQ) plot of the daily total gate delay against the best distributional fit of the data (a gamma distribution, 77 + GAMM (239, 1.4), obtained using the Arena input analyzer). For a perfect fit, the data would fall on a straight line. The four worst days are significantly above the straight line. This indicates that on the worst days, the delays are “really bad” – worse than what might be predicted using a model based on the best statistical fit. Roughly speaking, the 92 days can be
Wang, Shortle and Sherry Page 7
divided into 3 sections. The lower section has 80 “good” days, the middle section has 8 “bad” days, and the top section has 4 “extremely bad” days. In this paper, we analyze the 12 worst days in detail.
Figure 3: Daily Gate-Waiting Delay and QQ Plot against Gamma Model, Summer 2007
5.2 Dependence of Delays on Carrier and Time Carriers that experienced high total gate-waiting delays include Comair Inc., Delta Airlines, American Airlines, American Eagle Airlines and AirTran Airways. US Airways has a big market share, so it is also included in the analysis of this section. When subsidiary carriers are merged with mainline carriers, the three major carriers are American with American Eagle, Delta with Comair, and US Airways. Delta has a higher average gate-waiting delay than American, which has a much higher delay than US Airways, during the summer of 2007. A t-test shows that these averages are statistically different between any two of the three carriers.
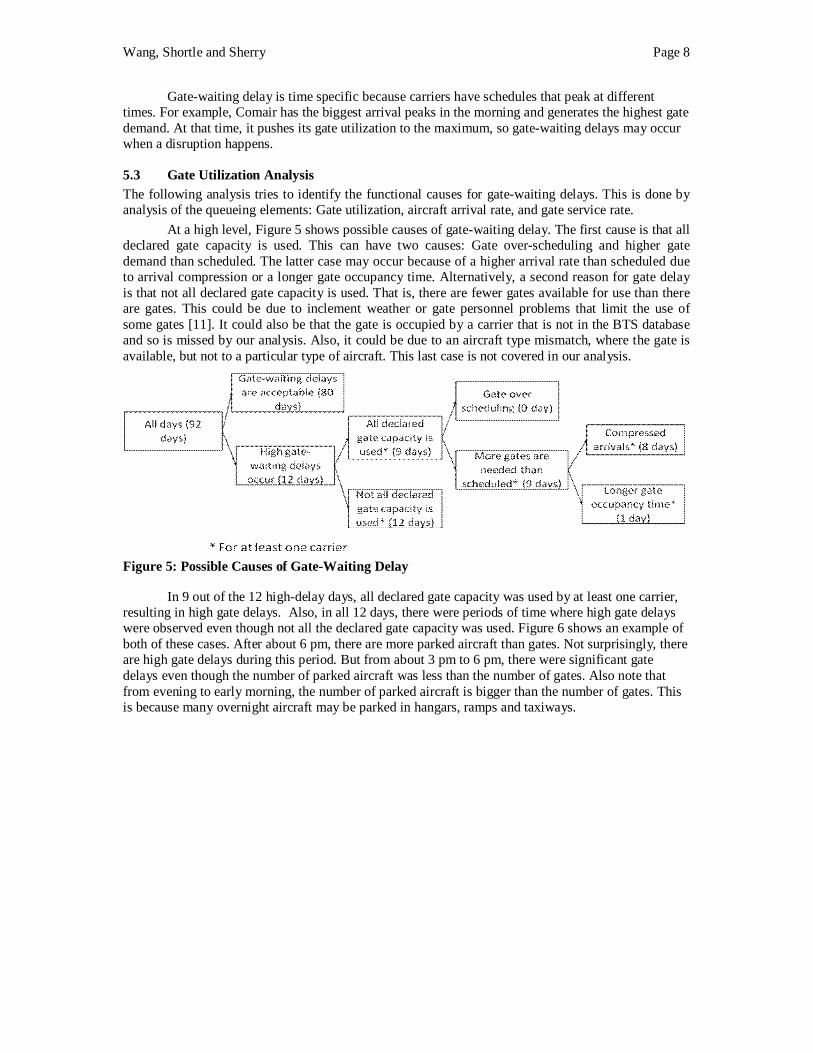
The average gate-waiting delay in the extreme days are also significantly different among carriers, even though all the carriers may be affected at some level, as shown in Figure 4. The time dependency can also be seen. Comair had high gate-waiting delay in the early morning on 8/8/2007 while American had high gate-waiting delay around noon on 8/9/2007. Similar analysis on the third highest gate-waiting-delay day, June 27, 2007 shows that American Airlines and American Eagle Airlines had high gate delays in the evening.
Figure 4: Total Gate-Waiting Delay by Time of Day and Carrier
Gate-waiting delay is carrier specific possibly due to the difference among carriers’ capacity fraction used for scheduling. Average gate-waiting delay is positively correlated with utilization, which means that a larger portion of reserve capacity can accommodate bigger disruptions of gates. For example, US Airways maintains a high volume of flights and keeps gate-waiting delays low whereas AirTran has a small market share but has high total gate-waiting delays. The reason is obvious: US Airways has a higher percentage of surplus gates, while AirTran does not.
Wang, Shortle and Sherry Page 8
Gate-waiting delay is time specific because carriers have schedules that peak at different times. For example, Comair has the biggest arrival peaks in the morning and generates the highest gate demand. At that time, it pushes its gate utilization to the maximum, so gate-waiting delays may occur when a disruption happens.
5.3 Gate Utilization Analysis The following analysis tries to identify the functional causes for gate-waiting delays. This is done by analysis of the queueing elements: Gate utilization, aircraft arrival rate, and gate service rate.
At a high level, Figure 5 shows possible causes of gate-waiting delay. The first cause is that all declared gate capacity is used. This can have two causes: Gate over-scheduling and higher gate demand than scheduled. The latter case may occur because of a higher arrival rate than scheduled due to arrival compression or a longer gate occupancy time. Alternatively, a second reason for gate delay is that not all declared gate capacity is used. That is, there are fewer gates available for use than there are gates. This could be due to inclement weather or gate personnel problems that limit the use of some gates [11]. It could also be that the gate is occupied by a carrier that is not in the BTS database and so is missed by our analysis. Also, it could be due to an aircraft type mismatch, where the gate is available, but not to a particular type of aircraft. This last case is not covered in our analysis.
Figure 5: Possible Causes of Gate-Waiting Delay
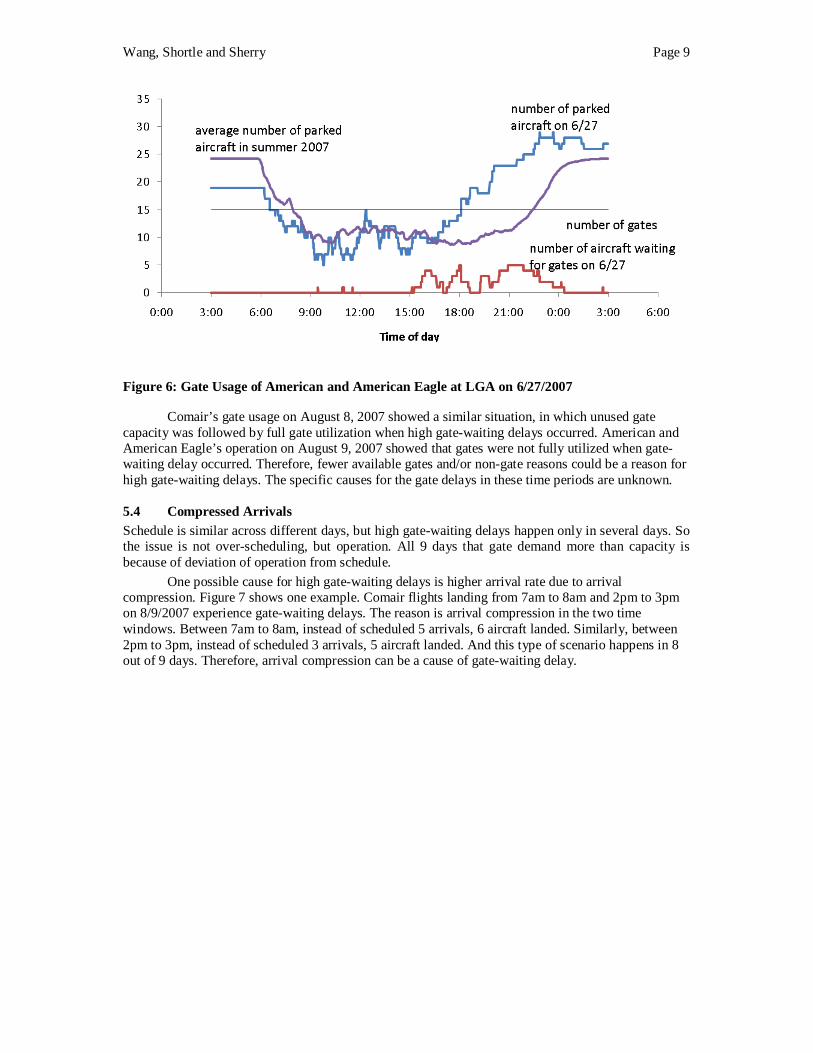
In 9 out of the 12 high-delay days, all declared gate capacity was used by at least one carrier, resulting in high gate delays. Also, in all 12 days, there were periods of time where high gate delays were observed even though not all the declared gate capacity was used. Figure 6 shows an example of both of these cases. After about 6 pm, there are more parked aircraft than gates. Not surprisingly, there are high gate delays during this period. But from about 3 pm to 6 pm, there were significant gate delays even though the number of parked aircraft was less than the number of gates. Also note that from evening to early morning, the number of parked aircraft is bigger than the number of gates. This is because many overnight aircraft may be parked in hangars, ramps and taxiways.
Wang, Shortle and Sherry Page 9
Figure 6: Gate Usage of American and American Eagle at LGA on 6/27/2007
Comair’s gate usage on August 8, 2007 showed a similar situation, in which unused gate capacity was followed by full gate utilization when high gate-waiting delays occurred. American and American Eagle’s operation on August 9, 2007 showed that gates were not fully utilized when gate-waiting delay occurred. Therefore, fewer available gates and/or non-gate reasons could be a reason for high gate-waiting delays. The specific causes for the gate delays in these time periods are unknown.
5.4 Compressed Arrivals Schedule is similar across different days, but high gate-waiting delays happen only in several days. So the issue is not over-scheduling, but operation. All 9 days that gate demand more than capacity is because of deviation of operation from schedule.
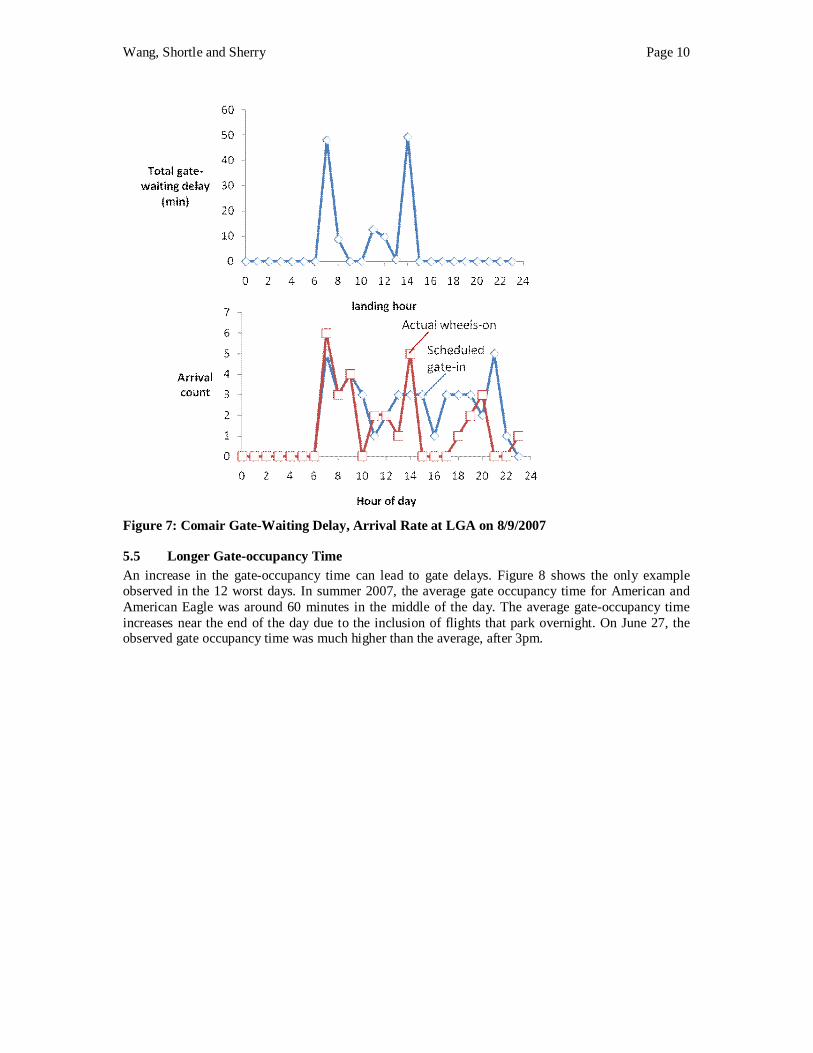
One possible cause for high gate-waiting delays is higher arrival rate due to arrival compression. Figure 7 shows one example. Comair flights landing from 7am to 8am and 2pm to 3pm on 8/9/2007 experience gate-waiting delays. The reason is arrival compression in the two time windows. Between 7am to 8am, instead of scheduled 5 arrivals, 6 aircraft landed. Similarly, between 2pm to 3pm, instead of scheduled 3 arrivals, 5 aircraft landed. And this type of scenario happens in 8 out of 9 days. Therefore, arrival compression can be a cause of gate-waiting delay.
Wang, Shortle and Sherry Page 10
Figure 7: Comair Gate-Waiting Delay, Arrival Rate at LGA on 8/9/2007
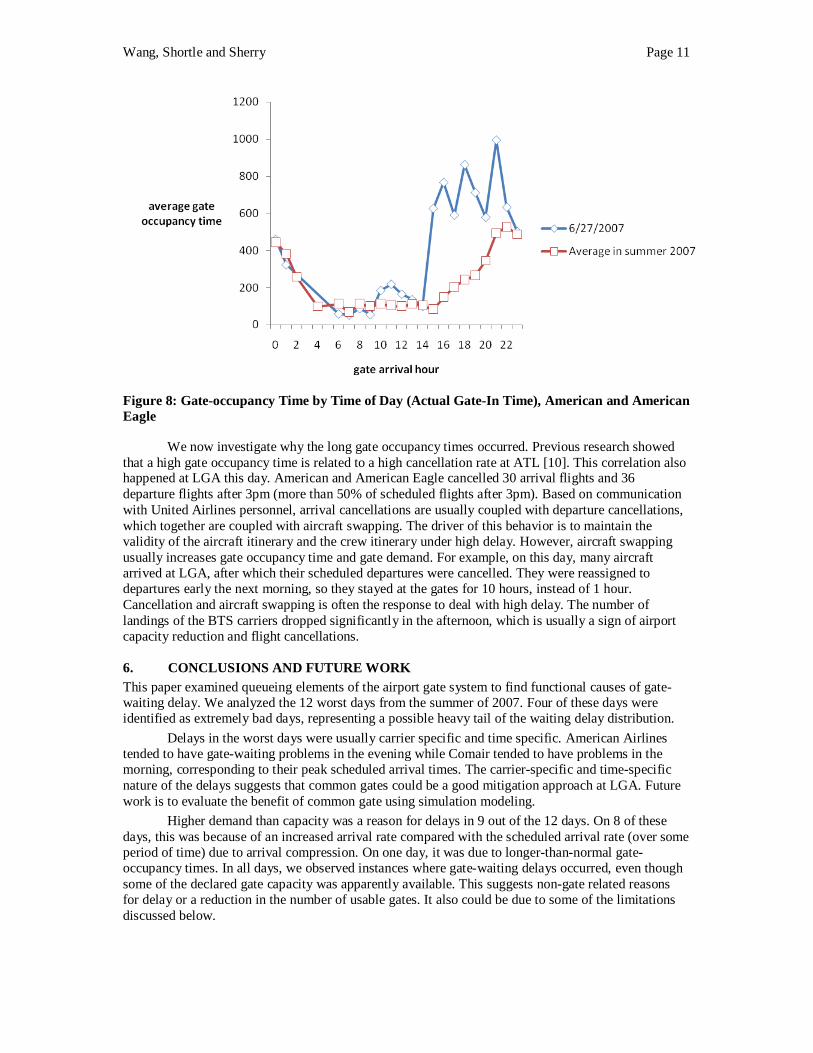
5.5 Longer Gate-occupancy Time An increase in the gate-occupancy time can lead to gate delays. Figure 8 shows the only example observed in the 12 worst days. In summer 2007, the average gate occupancy time for American and American Eagle was around 60 minutes in the middle of the day. The average gate-occupancy time increases near the end of the day due to the inclusion of flights that park overnight. On June 27, the observed gate occupancy time was much higher than the average, after 3pm.
Wang, Shortle and Sherry Page 11
Figure 8: Gate-occupancy Time by Time of Day (Actual Gate-In Time), American and American Eagle
We now investigate why the long gate occupancy times occurred. Previous research showed that a high gate occupancy time is related to a high cancellation rate at ATL [10]. This correlation also happened at LGA this day. American and American Eagle cancelled 30 arrival flights and 36 departure flights after 3pm (more than 50% of scheduled flights after 3pm). Based on communication with United Airlines personnel, arrival cancellations are usually coupled with departure cancellations, which together are coupled with aircraft swapping. The driver of this behavior is to maintain the validity of the aircraft itinerary and the crew itinerary under high delay. However, aircraft swapping usually increases gate occupancy time and gate demand. For example, on this day, many aircraft arrived at LGA, after which their scheduled departures were cancelled. They were reassigned to departures early the next morning, so they stayed at the gates for 10 hours, instead of 1 hour. Cancellation and aircraft swapping is often the response to deal with high delay. The number of landings of the BTS carriers dropped significantly in the afternoon, which is usually a sign of airport capacity reduction and flight cancellations.
6. CONCLUSIONS AND FUTURE WORK This paper examined queueing elements of the airport gate system to find functional causes of gate-waiting delay. We analyzed the 12 worst days from the summer of 2007. Four of these days were identified as extremely bad days, representing a possible heavy tail of the waiting delay distribution.
Delays in the worst days were usually carrier specific and time specific. American Airlines tended to have gate-waiting problems in the evening while Comair tended to have problems in the morning, corresponding to their peak scheduled arrival times. The carrier-specific and time-specific nature of the delays suggests that common gates could be a good mitigation approach at LGA. Future work is to evaluate the benefit of common gate using simulation modeling.
Higher demand than capacity was a reason for delays in 9 out of the 12 days. On 8 of these days, this was because of an increased arrival rate compared with the scheduled arrival rate (over some period of time) due to arrival compression. On one day, it was due to longer-than-normal gate-occupancy times. In all days, we observed instances where gate-waiting delays occurred, even though some of the declared gate capacity was apparently available. This suggests non-gate related reasons for delay or a reduction in the number of usable gates. It also could be due to some of the limitations discussed below.
Wang, Shortle and Sherry Page 12
The analysis is based on the BTS database, which includes domestic operations of the top 19 carriers. International flights and small carriers are not considered. Thus, gates occupied by flights not in the BTS database are considered unused by the algorithms in this paper. Also, the aircraft type is not considered. For example, when an aircraft does not go to an open gate, it may simply be because the gate size is not compatible. Both limitations lead to an overestimation of the non-gate reasons for delay.
REFERENCES [1] ACI/ATAG/IATA. Airport Capacity / Demand Profiles; 1998. CD-ROM. [2] airport-new-york com. Laguardia airport map; 2009. http://www.airport-new-york.com/laguardia-airport-map.htm accessed on July 29, 2009. [3] Idris HR, Anagnostakis I, Delcaire B, Hansman RJ, Clarke JP, Feron E, et al. Observations of Departure Processes At Logan Airport to Support the Development of Departure Planning Tools. Air Traffic Control Quarterly. 1999;7:229–257. Available from: http://ntrs.nasa.gov/. [4] Gosling GD. Development of a framework for assessing the benefits of airportsurface traffic automation. Control Systems Technology, IEEE Transactions on. 1993;1:155–167. [5] Stoller G. Fliers trapped on tarmac push for rules on release; 2009. http://www.usatoday.com/travel/flights/2009-07-27-travel-runway-delays_N.htm. [6] Xu N. Method for Deriving Multi-Factor Models for Predicting Airport Delays. George Mason University; 2007. [7] Gross D, Shortle JF, Thompson JM, Harris CM. Fundamentals of Queueing Theory. 4th ed. John Wiley & Sons, Inc; 2008. Available from: http://mason.gmu.edu/ jshortle/fqt4th.html. [8] Idris HR. Observation and analysis of departure operations at Boston Logan International Airport. Massachusetts Institute of Technology; 2001. [9] Horonjeff R, McKelvey F. Planning and Design of Airports. 4, editor. McGraw-Hill Professional; 1993. [10] Shortle JF, Wang J, Wang J, Sherry L. Analysis of Gate-Hold Delays \At the OEP-35 Airports. In: Submitted to The eighth USA/Europe Seminar on Air Traffic Management Research & Development; 2009. . [11] Richards J. Self-Docking Saves Millions, Reduces Gate Delays at DFW; 2008. http://www.airportimprovement.com/content/story.php?article=00009. [12] de Neufville R, Belin SC. Airport Passenger Buildings: Efficiency through Shared Use of Facilities. Journal of Transportation Engineering. 2002;128:201–210. Available from: http://cedb.asce.org/cgi/WWWdisplay.cgi?0202090. [13] Steuart GN. Gate Position Requirements at Metropolitan Airports. Transportation Science. 1974;8:169–189. [14] Gu Y, Chung CA. Genetic Algorithm Approach to Aircraft Gate Reassignment Problem. Journal of Transportation Engineering. 1999;125:384–389. [15] Yan S, Tang CH. A heuristic approach for airport gate assignments for stochastic flight delays. European Journal of Operational Research. 2007;180:547–567. [16] Yan S, Shieh CY, Chen M. A simulation framework for evaluating airport gate assignments. Transportation Research Part A: Policy and Practice. 2002;36:885–898. [17] Dorndorf U, Jaehn F, Lin C, Ma H, Pesch E. Disruption management in flight gate scheduling. Statistica Neerlandica. 2007;61(1):92–114. Available from: http://ideas.repec.org/a/bla/stanee/v61y2007i1p92-114.html. [18] Matt. Trip report: YUL-YYZ-YUL-ORD-DFW On AC And AA; 2005. http://www.airliners.net/aviation-forums/trip_reports/read.main/120717/. [19] BTS. Airline On-Time Performance and Causes of Flight Delays; 2003. Available from: http://www.bts.gov/help/aviation/index.html. [20] USpatent. System and method of providing OOOI times of an aircraft; 2000. United States Patent 6154636. Available from: http://www.freepatentsonline.com/6308044.html.
Wang, Shortle and Sherry Page 13
[21] ASPM F. data reference guide; 2008. Available from: http://aspm.faa.gov. [22] Kondo A. The Derivation of the Unimpeded Taxi-out and Taxi-in Times in the Estimation of the Taxi Time Delays; 2009. [23] de Neufville R, Odoni A. Airport Systems: Planning, Design, and Management. 1st ed. McGraw-Hill Professional; 2003.