Embed Size (px)
Citation preview

ANALYSIS OF NOVEL TRANSïïiON METALS AS CATALYSTS FOR
OXYGEN DELIGNIFICATION
Vishai Ahuja
A thesis submitted in conformity with the requirements for the degree of Master of Applied Science
Graduate Depariment of Chemicai Engineering and Applied Chemistry University of Toronto
Q Copyright by Vishal Ahuja, 2001

Acquisitions and Acquisitions et BiMiographic SeMces services ùibibgraphiques
The author has grantexi a non- exclusive licence aliowing the National Library of Canada to reproduce, loan, distri'bute or seli copies of this thesis in microform, paper or electronic formats.
L'auteur a accordé une iicence non exchisive pennettaut à la Bibliothèque nationaie du Canada de reproduire, prêter, distribuer ou vendre des copies de cette thése sous Ia forme de microfiche/fh, de reproduction sur papier ou sur format électronique.
The auîhor retains orner&@ of the copyright in this thesis. Neither the thesis nor substantial extracts îrom it m y be pnnted or othemk reproduçed without the author's lNxmkion.
L'auteur conserve la propriété du droit d'auteur qui protège cette thèse. Ni la îhèse ni des -ts substantiels de celle-ci ne doivent être imprimés ou autrement reprodints sans son
s - autorisation.

Analysis of Novel Transition Metals as Cataiysts for Osygen DeMgnification
Vishal Ahuja, M.A.Sc Thesis, 2001 Graduate Department of Chemicai Engineering and Applied Chemistry University of Toronto
ïhree cataiysts, vanadyl surate hydrate (VS), c e r i c o sulfate (CS), and molybdenyl
acetylacetonate (MA) were studied for their effectiveness in enhancing oxygen
delignification. Bleacbg experiments on a dl-produced hardwood laaft puIp under
acidic conditions showed that, under acidic conditions, catatytic oxygen deiignification is
superior in reducing kappa number as compared to an aikaline oxygen delignification
stage.
Cyclic voltammetq was used to study the redox behaviour of the catalysts. The
effectiveness of catalysts in del ignieg pulp was correhted with their ability to oxidize
iignin model compounds. The voltammograrn of VS showed the oxidation of vanadium
to be an irreversiile one-eIectron transfer process. VS was found to be effective in
cataiyzhg the oxidation of vanilly1 alcohol (a phenoiic lignin mode1 cornpouna). CS was
found to be the most efficient of the three catalysts with a high reduction potential and
reversible eIectrochemica1 behaviour.
Gas Chromatography analysis of the reaction products between CS and veratryl
alcohol (a non-phenolic lignin model compound), carried out in a mini-reactor, cIearIy
illustrateci the effectiveness of CS in çatalyzing the oxidation of veratryl alcohol.


1 would like to express my sincere thanks to Professor Doug Reeve and Dr. Zheng Tan
for their fnendly encouragement and excellent supervision. Theù guidance and constant
support were criticai in the successflll completion of the project. In particular, 1 am
gratefd to Professor Reeve for his outstanding counsel, motivation, and patience
throughout the course of this work. To have been able to work with him was tnly a
privikge.
Professor D.W. Kirk is gratefily acknowledged for laboratory support and for his
valuable advice and comments. 1 am thanfil to Dr. J.W. Graydon and Rami Abouatallah
for theu time and efforts, and for the helpfiil discussions and usefiil suggestions. 1 also
thank Professor Bruce McKague, Professor David Goring and Dr. Krishan Goel for
sharing their knowledge and expertise, and for the numemus suggestions pertaining to
this work.
Kathy Weishar's help with the project and otherwise is sincerely appreciatd
Many thanks are due to Cindy Tam and to my colleagues at the Pulp & Paper Centre for
their help and support. Special thanks to Bhuwan Prasad for his help in editing my thesis.
Domtar Inc. is gratefbiiy acknowledged for hancial support for this research and
for supplying the pulp for experiments.
Above dl, 1 thank my parents for their %couragement and endless love for me.
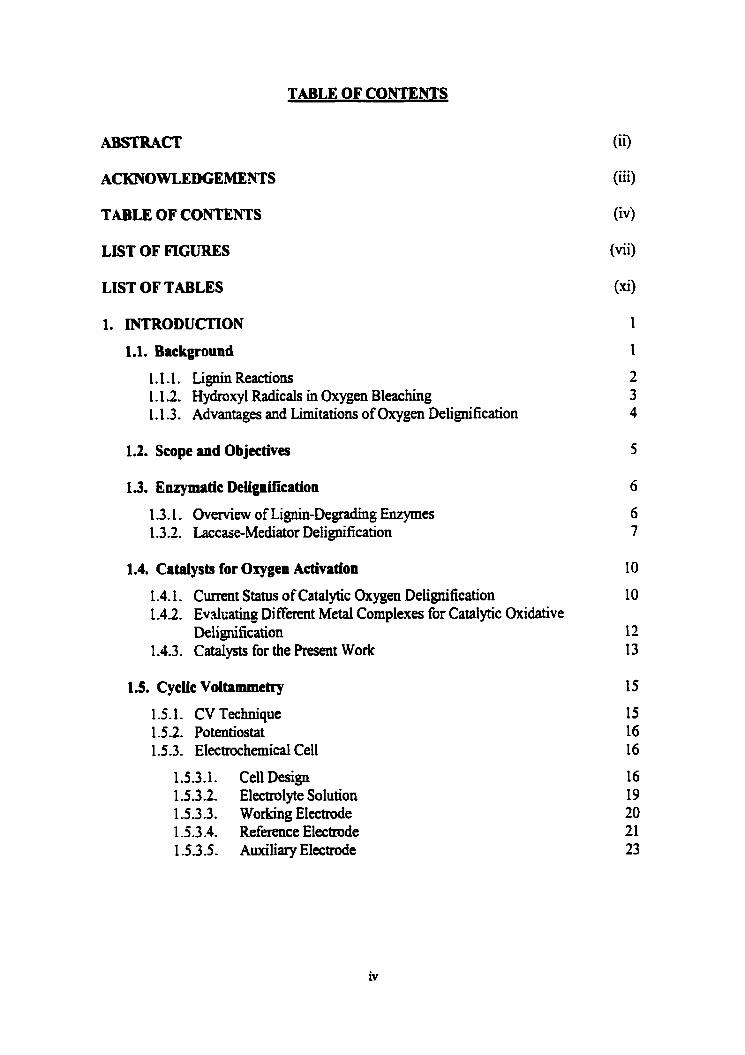
TABLE OF CONTENTS
(ii)
TABLE OF CONTENTS
LIST OF FIGURES
LIST OF TABLES
1.1.1. Li@ Reactions 1.1 3. Hydroxyl Radicais in Oxygen Bleaching 1.1 -3. Advantages and Limitations of Oxygen Delignification
1.2. Scope and Objectives
1.3.1. ûvemiew of Lignin-Degrading Enzymes 1.3.2. Laccase-Mediator Delignification
1.4. Catalysts for Oxygen Activation
1.4.1. Current Status of Cataiytic Oxygen Delignification 1-41. Evdçating Different Metal Complexes for Catalytic Oxidative
Deiignification 1 A.3. Catalysîs for the Present Work
15. Cycüc Voltammetry
1.5.1. CV Technique 1.5.2. Potentiostat 1.5.3. Electrochemical Ce11
1 . 5 3 1 CellDesign 1.53.2. Electrolyte Solution 1.5.3.3. Working Electrode 1 -53 -4. Reference Electmde 153.5- Auxiliary Electrode
(iii)
(xi)

1.5.4. The Output Device 1 S.S. Cyclic Voltammogram
1.6. Electrochemicd Properties a ~ d Parameters
1.6.1. Vanadium Sulfate Hydrate 1.6.2. Cerium 0 Sulfate 1.6.3. Molybdenyl Acetylacetonate
2.1. Oxygen Blerching Experhnts
2.1.1. Equipment 2.1.2. Materiais 2.1.3. Methodobgy
2.2. Cyclic Voltammetry
2.2.1. The Electrochemical Ce1 2.2.2. Working EIectrode 2.2.3. Others
23. Sirnuldion of Bleaching Reactioas nsing Lignin Model Compounds
2.3.1. Methodology 2.3.2. Gas Chromatography 2.3.3. Materiais
3. RESULTS AND DISCUSSION
3.1. Oaygen Deiignificatîon Experiments
3.1.1. Preliminary Experiments 3.1.2. Final Experiments
3.2. Establishing the System for Cyclic VoltPmmetry
3.2.1. Testing the Mercury and Platinum Electrodes 3.2.2. Testing the System using Potassium Ferricyanide 3.2.3. Testing the Graphite Electrode 32.4. Testing the Giassy Carbon Eiecîmde
33. CV Resuits with Vanadium difate Hydrate
3.3.1. VS in Suifuric Acid Solution 3.32. VS and Lignin Model Compounds in Sulfuric Acid Solution 3.3.3. VS in Citrate Buf!fer Solution 3.3.4. VS and Vaniiiyl Alcohol in Citrate Buffer Solution 3.3.5. VS and Veratryi Alcahol in Citrate Buffer Solution

3.4. CV Resulîs with Cerium 0 Sulfate
3.4.1. Cerium in Sulfirric Acid Solution 3.4.2. CS and Lignin Model Compounds in S&c Acid Solution 3.4.3. CV S M i e s on ûther Cerium Compounds
3.5. CV Results with Molybdenumo Acetylacetonate
3.5.1. MA in DMF solution 3.52. MA in a 10:90 (vlv) DMF-Water mkture 3.5.3. MA and Lignin Model Compounds in a 10:90 (vlv)
DMF-Water mixture
3.6. Simulation of Bleaching Reactions using Lignin Model Compounds
3.6.1. GC Results - Controls 3.6.2. GC Resuits - Veratryl Alcohol and Catalysts 3.6.3. GC Results - Vanillyl Alcohol and Catalysts
4. CONCLUSIONS
5. RECOMMENIDATIONS FOR FUTURE WORK
6. REFERENCES
7. APPENDICES
APPENDIX 0: Kappa Number of Mp APPENDDC (JI): Cupriethylenediamine Viscosity of Pulp GLOSSARY

LIST OF FIGURES
CHAPTER 1
Figure Title
1.1 Mesomeric foms of phenoxyl radical
1.2 Oxidation of lignin by laccase and mediaior, and chernicd structures of ABTS and HBT
1.3 Reaction mode1 for the enzymatic bleaching using laccase and mediator
1 -4 Typicai potential sweep programs employed in cyclic voltammetry
1.5 Experimental setup for cyclic voltammeûy
1.6 A lu& capillary for reference electrode
1.7 A typical cyclic voltammograrn
1.8 Molybdenum(VI) acetylacetonate
CHAPTER 2
Figure Title
2.1 The electrochernicai ce11
2 2 (a) Schematic figure, and (b) photograph of a glassy carbon working electrode; (c) mercury electrode; (d) AdAgCl reference electrode; (e) photograph of a standard-six pre-filied calomel reference electrodes (SCE)
Fiire Title

Cyciïc voItammogram (scan rate of 50 mV/s) on a mercury eIecmde of (a) v d u m suihte hydrate (0.3 mM) in 150 mM sulfiiric acid; and (b) 250 mM sulfuric acid and (a) superimposed on each oiher
Cyclic vo~tammograms (scan rate of 50 mV/s) on a mercury dectrode of cer iumo suIfate (0.45 mM) in 250 mM suifhic acid and th& of background (electrolytesnly) superimposed on each other
Cyciic voItammograms (scan rate of 50 mVls) on a plaîinum WE of (a) vanadium &te hydrate (0.3 mM) in 125 mM sulfuric acid and the background voltamnogram superimposed on eacti other; and (b) ceriurn(lV) sulfate (0.45 mM) in 250 mM 6 c acid and thc: background voltammograrn superimposed on each other
Cyclic voltammograms (%an rate of 50 mV/s) on a pIatinum WE of potassium ferricyanide (12 mM) in 75 mM sulfuric acid and the background voitammogram superimposeci on each other
Cyclic voltarnmograms (scan rate of 20 mV/s) of 2 M V(V) in 4 M sulfiuic acid solution (a) on a graphite di& WE; (b) on a graphite rod
Cyclic voitammograms (scan rate of 20 mV/s) of 0.2 mM ABTS in 50 mM, pH 4 citrate buffer on a glasy carbon WE (a) h m literature; and (b) present m d t s
Cyclic voltamnogram (scan rate of 20 mV/s) on a glassy carbon WE of vanadium &ate hydrate (2mM) in 50 m M sulfinic acid
Anodic peak c m t (s) vs. sqrt (scan rate) for 2 mM VS in 10 mM sulfuric acid solution; and (b) vs. VOSOI concentration at various sulfitric acid concenûaiioas (scan rate of 20 rnV/s)
Structures of veratryi and v d y l akohol
Cyclic voitammograms (scan rate of 20 mV/s) in 50 mM sulfirric acid of (a) vanadium sulfate hydrate (2mM), veratryi aIcohoI (5mM), and a mixture of two; and (b) vanadium suifate hydrate (20mM), veratq1 alcoh0l(5OmM)~ and a mixture of two
Cyclic voItammograms (scau rate of 20 mV/s) in 50 mM sulfuric acid of vanadium sulfate hydrate (2mM), vaniilyi aIcohol(5mM), and a mixture of two

3.13 pH vs. anodic peak potential for 2 and 20 mM VS (scan rate = 20 70 mV/s)
Cyclic voltammograms (scan rate of 20 mV/s) of vanadium sulfate hydrate (2mM) in (a) 50 mM citrate buffer (pH 3); and (b) citrate buffkr (gH 3) and sulfunc acid @H 1.52)
Cyclic voltammograms (scan rate of 20 mV/s) in 50 mM citrate buffér (pH 3) of vanadium sulfate hydrate (2mM), vanillyl alcohoI (SEM), and a mixture of two
Redox cataiysis of vanadium sulfate hydrate and vanillyl alcohol
Cyclic voltammograms (scan rate of 20 mV/s) in 50 mM citrate b a é r @H 3) of vanadium sulfate hydrate (2mM), veratryt alcohol (SmM), and a mixture of two
Cyclic voltammograms (scan rate of 50 mV/s) in 50 mM sulfunc acid of (a) c e r i u m o sulfate (2m.M) and the background current; and (b) cerium(1V) sulfate (2mM) in a shorter scan range
Cyclic voltammograms (scan rate of 50 mV/s) of (a) c e r i m o sulfate (2mM) in 100 mM sulfuric acid; and @) cenum(m) sulfate (2mM) in 100 mM sulfuric acid and c e r i u m o sulfate (2mM) in 50 mM sulfuric acid together
Anodic peak current (a) vs. sqrt (scan rate) for 2 mM CS in 100 mM s u h i c acid solution; and (b) vs. Ce(m) sulfate concentration in 100 mM sulfuric acid solution at scan rates of 10 and 50 mV/s
Cathodic peak current vs. sqrt (scan rate) for 2 rnM c e r i m m sulfate in 100 mM suifuric acid solution
Cyclic voltammograms of (a) c&um(rv) sulfate (2mM), veratzyI alcohol (SmM), and a mixture of two in 50 m M sulfuric acid (scan rate of 50 mV/s); and (b) cerium(IV) suifate (2mM), vanillyl alcohol (SmM), and a mixture of two in 200 mM sutfinic acid (scan rate of 20 mV/s)
Cyclic voltammograms in 50 mM suifûric acid of cerium (IV) sulfate (2mM), scan rate of 50 mV/s and cerium (m) chloride (5mM), scan rate of 5 mV/s
Cyciic voltammograms (scan rate of 20 mVls) in 100 mM sulfüric acid of c e r i u m o d a t e (5mM) and a mixture of cerium(m) sulfate (5mM) and sodium sulfate (100 mM)

3.25 Cyclic voltammograms (scan rate of 20 mV/s) of 1 mM M o 0 88 acetylacetonate and the electrolyte solution in DMF solution (supporthg electrolyte, 0.1 M TEATFB)
3.26 Cathodic peak current vs. sqrt. (scan rate) for 1 mM Mo(V1) 88 acetylacetonate in DMF solution (supporthg electrolyte, 0.1 M TEATFB)
3.27 Cyclic voltammogram (scan rate of 50 mV/s) of 1 mM M o 0 89 acetylacetonate in DMF-water solution (10:90 (v/v) mixture; supporting electrolyte, 0.1 M TEA'ïFB)
3.28 Cyclic voitammograms (scan rate of 50 mV1s) in 10:90 (v/v) 9 1 9MF-water mixture; supporting electrolyte, 0.1 M TEATFB) of (a) Mo(VI) acetylacetonate (1 mm, veratryl alcohol(l0 mM), and a mixture of two; and (b) Mao acetylacetonate (1 mM), vanillyl alcohol(10 mM), and a mixture of two
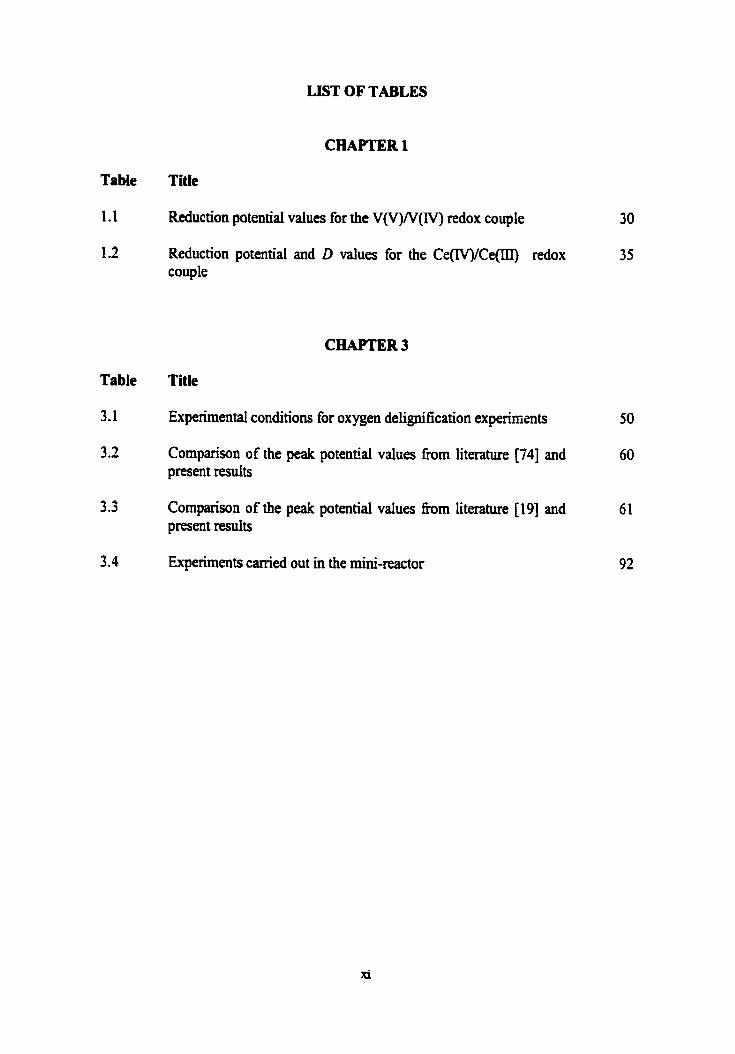
LIST OF TABLES
CHAPTER 1
Table Tiffe
1.1 Reduction potentiai values for the V(V)N(IV) redox couple 30
1.2 Reduction potential and D values for the C e o l C e o redox 3 5 couple
CHAPTER 3
Table Title
3.1 Experimental conditions for oxygen delignification experhmts 50
3.2 Cornparison of the peak potentiai values h m literature [74] and 60 present resuIts
3.3 Cornparison of the peak potential values h m literature 1191 and 6 1 present results
3.4 Experiments carried out in the mini-reactor 92

1.1. BACKGROUND
Environmentai concems and reguiations have led the pulp and papa industry to adopt
more environmentaiiy fiiendly technologies. One such move has been in the area of pdp
bleaching where oxygen is now increasingiy used in conjunction with chlorine and
chlorine dioxide in the bleaching process. ûxygen is a readily available low-cost gas. It
also produces a higtier yield of pulp per ton of wood consurnption than the cunent
extended pulping practice. The term "delignification" is used synonymously with
"bIeaching" when refening to oxygen bleaching.
The oxygen delignification process removes as much as 50% of the lignin in
unbleached kraft puIp in the presence of aqueous sodium hydroxide at temperatures h m
100 to 130°C, and pressures h m 0.6 to 1.0 MFk The dissolved organic matter, arising
mainly h m the degradation and subsequent dissolution of lignin, cari be concentrated
and then bmed in the kraft chernical-recovery boiler to produce stem d o r electricd
energy.
The technoIogy of oxygen delignification has been extensively studied [1,2].
Selectivity, mas transfer and kinetics are the main factors goveming the use of'oxygen in
the deiignrfication process. Selectivity, defined as the ratio of the detignifïcation rate to
the carbohydtate degradation rate, is the most important factor in oxygen bleaching: it
determines how fw the delignification can proceed without undue loss in pulp strength.
The process variables that govern oxygen delignikation are reaction time, alkali
concentration, oxygen partial pressure, and temperature. Kinetic studies, such as those
canied out by O h and Teder [3], provide a usefui framework for evaiuating the effects
of these process variables. The kinetics of oxygen bleaching is also usefiil in ptoviding an
insight into the reaction rates of two competing reactions, deiignification and
catbohydrate degradation.
The reactions of lignin with oxygen and oxygen containing species are critical to
the overail mechanism of bleaching. The foiiowing discussion describes the reactions of
pdp with oxygen and oxygen containing species [2,4].

1.1.1. Lignia Reactions
During oxygen delignification, the principal reactive sites in residual lignin are believed
to be fk phenolics, aryl-etbers, and ring conjugaîed double bonds. Cjgain degradation is
initiateci primariiy at frm phenotic sites. As phenoiic p u p s are d d l y acidic, the k e
phenolic p u p s in residd lignin dissociate to give phenoxide anions under the highly
alkaline conditions of oxygen delignification. Mulecular oxygen, a &radical itself, then
abstracts an ekctron h m phenoxide anions to produce phenoxyl and superoxide (Oz7)
radicds. Landucci [5 ] has suggested that the ratedetermining step in lignin oxygenation
is the formation of the phenoxyl radical. The foxmation of this radicai is cataiyzed by
transition m d cations, such as CU'+ and ~ e ~ * [5]. Phenoxyl radicals are resonance
stabilizeâ, existing in c i i f f i t mesomeric forms (Figure I .l)
Fiire 1.1: Mesornerie forms of phenoxyl radicaI [4]

MoIecular oxygen can combine directiy with the unpaïred electron Iocated at the
Ci-, C3-, or B-carbon atoms to give the corresponding peroxy radicais. The peroxy
radicals can react with phenoxide anions to fom hydroperoxy anions and an additional
phenoxyl radical (radicd chain propagation) or, in the case of peroxy radicals with an a-
hydroxyl group, undergo side chain elimination to produce a paraquinonoidai fragment.
The hydroperoxy anions fomied during radical chain propagation undergo
intemal rearrangements (via dioxetane intermediates) that resuIt in ring openings or
cleavage of the a-B carbon to carbon bond.
ûther signincant initiation reactions include the electrophiiic attack by oxygen on:
(i) the B-carbon in ring conjugated double bond structures, (ii) the CI carbon in a-aryl
ethers. The reactive intermediates formed during initiation reactions will themselves
initiate subsequent degradation reactions [4]: both the superoxide radical and hydro-
peroxy anions are nucleophilic reagents which attack electron deficient carbons in
residual Iignin. Furthemore, superoxide tadicals can react with peroxide radicals to form
hydropemxides. in the presence of transition metai catalysts, these hydropemxides
decompose to give hydroxyl radicals (OH.) [4].
1.1.2. Hydroryl Radicals in Oxygen Bleaching
Hydroxyl radicals that are generated by the stepwise reduction of oxygen arr extremely
reactive oxidants. They are indiscriminate in nature and are primarily responsible for
attacking cellulose chahs, thus reducing the viscosity (strength) of pulp [2]. Hydroxyl
radicals degrade carbohydrates by attacking at any point dong the chaidike molecule
(random chain cleavage). Since random chah cleavage leads to the viscosity los, these
types of reactions are more criticai to the puIp strength.
The role and generation of hydroxyl radicals in oxygen bleaching have been
studied extensively by employing methods that include the use of lignin and carbohydrate
mode1 compounds [5,6], chemilrmiinescwce [6,71, carorate delignification [SI and
colorimetric detection [9j. A scheme demonstrating the pathway of the genesis of
hydroxyl radicals and the role of hydroxyl radicals in the degradation of non-phenolic
l i g e units has aIso been proposesi [q.

1.13. Advantages and Limitations of Orygen Detignificatioa
The major benefit derived h m oxygen delignificaîion is environmental, since it
decreases the organic contents of discharged bkach effluent. In addition to energy
recovery and poliution abatement, oxygen delignification also results in chernical swings
in the subsequent stages of bleaching.
However, the curent oxygen delignification technology at high degrees of
delignification is not selective and produces pdps with lower strength properties, thus
severely restricting the extent to which oxygen delignification can be applied. This
substantially limits the role of oxygen in the pulping and bleaching pmcess. in practice,
conventional oxygen deiignification processes remove approximately 50% of the residual
lignin in pulp (as comparai to 7590% delignification for a CE sequence). This limitai
extent of oxygen delignification also makes it difficult to justrfL the capital investment
associated with its implementation.
This work focuses on improving the selectivity of oxygen delignification and the
development of a cata!yzed oxygen delignification stage using transition metais as
cataiysts. An overail reaction scheme for the catdytic process has also been proposeci.

1.2. SCOPE AND OBJECTIVES
The ultimate aim of this study was to deveIop a commerciaiiy viable and effective
cataiytic oxygen delignification stage with low cost, enhanced puip yield and high
selectivity, anci to do this by developing novel biomimetic catalysts (Le. catalysts
mimicking the tiinctions of natural enzymes) that accelerate and extend oxygen
deiignitïcation. In this work, the focus has been narrowed d o m to three cataiysts and
their evaluation for oxidative delignification.
The first objective is to study the effet of catalysts on the delignification
efficiency of a mill-produced hardwood kraft pulp in an oxygen delignification stage.
This will be accomplished by carrying out bleaching experiments on a hardwood kraft
puip under acidic conditions using a high intensity laboratory mixer. Acidic conditions
for delignification experiments are chosen because the current technology of alkaline
deiignification is not selective and produces pu!p iviih lower strength properties. It is
hoped that by choosing acidic conditions, cellulose degree of polymerization @P) and
the pulp yield could be maintainecl. Another reason is that under acidic conditions, active
oxidative species of certain metais, such as va', dominate the species mixture. As
shown iater, these active species are responsible for accelerating oxygen delignification.
The second objective is to cary out mechanistic studies of the chosen catalysts.
Efforts will be focussed on studying the electmchemical behaviour of the catalysts using
cyciic voltamrnetry (CV), and evaluating their catalytic behaviour h m electrochemical
behaviour. The technique will also be used to study the ability of these metai compounds
îo oxidize phenolic and non-phenolic lignin model compounds.
Finaily, oxygen bleaching reactions wüi be simulated in a glass bomb reactor
usùlg cataiysts and Iignin model compounds, and the products will be analyzed by gas
chromatography. The resuits h m dEerent techniques wiii then be compiled to assess
the effectiveness of the catalysts in promoting oxygen deiignification.

13.1. Overview of Lignin-ïhqpding Enzymes
Delignification by redox enzymes has gaineci increasing attention over the past few years.
Several enzymes, including oxidative enzymes, such as laccase, rnanganese peroxidase
(MnP), and tignin peroxidase (LP); and hydrolytic enzymes, such as xylanase and
mannase have been extensively studied for the bleaching of wood puips [ 10,111.
The most notable of the hydrolytic enzymes is xylanase. The current technology
of xylanase enzyme prebleaching produces chernicd savings, although the savings are
iimited to around 20%; however, the technobgy is not widely succesful [IO]. Regarding
the enzymes originating h m white-rot fimgi, narnely Iaccase, M e , and LP, studies
suggest that they could prove usefid in the bkacbg of kmfl pulps, although the results
with MnP and LP have not yet been persuasive [l O]. The key obstacle in implementing
bteachg with oxidative enzymes is the high cost of obtaining the required chemicals,
such as the mediators in the case of Iaccase.
Lignin peroxidases are glycosylated, heme-containing enzymes that activate
h y b g e n peroxide causing one-electron oxidation of lignin. Lignin peroxidase oxidizw
bo t - the phenolic and the non-phenolic Iignin mode1 wmpounds. Manganese peroxidase
(MnP), an iron-heme enzyme, catalyzes hydrogen peroxide and oxidises the Mn @) ion
into complexed Mn 0 species, which M e r oxidize and degrade lignin. However, the
appiicatiün of hese enzymatic technologies is not yet industriaiiy significant [12,13].
Laccase is a glycoprotein within a ctass of bhe-copper enzymes. It usually
contains four copper (TI) ions, which are coordinated to histidine residues of three types.
Type 1 copper is a singie atom sequestered deep in the enzyme, Type IT copper is Iocated
near the sirrface of the enzyme, and Type lïi consists of two strongiy coupIed copper
atoms. The three copper Spes have different d e s in Iaccase redox cylces. The redox
potential of these atoms dso S e r s in laccase of various ongins wiîh higher redox
potentid correlating with higher activity [14]. The clifference m potentials is mainiy due
to stnichirai difference in t&e substrate activation site [14]. It is therefore possiile to
modify laccase sûwtm and adjust the redox potentiai for desired purposes.

1.33. Laccase-Mediator Deiignification
Functionally, laccase catalyzes one-electron Srpe oxidation reducing oxygen to water
while oxidising the aromatic substrates into oxygencentered radicals or cation radicaIs. It
has been found that laccase can degrade lignin modek with phenoiic structures [IS].
However, because of its specificity for phenolic subunits and its Limited access to the
lignin in fibre wali (due to its large size), laccase alone has a very limited effect on pulp
bIeaching [16,17]. The breakthrough in the field of laccase-mediator bleaching came
when Bourbonnias and Paice [18] demonstrated that the addition of the substrate (tenned
mediator) 2,2'-azinobis-(3-ethylbeazfhiazoline-6-sulphonate) (ABTS) to laccase ( h m
the white-rot fungus Trametes versicolor) rrenrlted in a substantial delignification of kraft
pulps d e r an alkaline extraction stage. Figure 1.2 shows the overail reaction scheme for
the mechanisrn of the oxidation of lignin using Iaccase and a mediator, and the chernical
structures of the two mediators.
ügnin
oxidiied
ABTS HBT
Figure 1.2: Oxidation of iigain by Iaccase and mediator [19\, and chernical structures of ABTS and KBT

Further, Bourbonnais and Paice [17] found that the laccase-ABTS treatment with
extraction resulted in over 55% kappa reduction in a singIe-stage treatment of
delïgnifyhg sui6te pdp. However, the cost of ABTS tleatment is too high for it to be
commercialized. It has also b m found that the delignification, as measured by kappa
number, is dependent on the concentration of ABTS [18]. This dependence on
concentration is also supported by methanol release which is another indicator of
detignification. The efféctiveness of ABTS as a mediator and its rote in catalyzing the
oxidation of non-phenolic l i g e mode1 compomds have been show11 using cydic
voltammetry [19,20].
in addition to ABTS, another mediator that has been found to be effective in the
deiignification of puIp is N-hydroxybenzotriazole (HBT). The breakthrough was made by
Cd1 et ai. [l6,2 11, when they demonsttated that the direct removal of li@ using laccase
and mediator (HBT) can be achieved to a substantiaI extent (over 50%) under mitd
conditions. Figure 1.3 shows a reaction mode1 as proposed by Cd1 et d. [16]. Laccase
contains four atoms of copper per m o l d e and requires oxygen as a co-substrate for
action. While oxidising the chernical mediator, laccase generates a strongiy oxidising co-
mediator in the presence of oxygen, which is a c W y the reai bleaching agent.
Other studies [22,23] with laccase/HBT report similar d t s , aithough the rate
and extent of deIignification varies. Sedey and Ragauskas [23] found that HBT is
unstable and is rapidly converteci to benzotriazoIe in the presence of pdp. They argue
that since benzotriazole has been fomd to be inactive as a mediator for laccase catalyzed
deIignification of Iaaft pdps, the conversion of HBT to an inactive fom is detrimental to
the delignification of kraft pulps. Ni-Paavoia et al- [24] used oxygen consumption to
compare the reactivities of various mediators toward laccase and found ABTS and HBT
to be the most reactive.
Baseci on the eIectrochemicai studies on the interaction among laccase, mediator
and iignin, Bourbonnais et al. [25,26] propose that the effective mediators must behave
like true catalysts and M e r , proposed to use transition metal compIexes in combination
with laccase to mediate the catdytic deiigniscation and bleaching of kraft pulps.

Laccase
copper type 1 Cu1+
coPPer type 3 cal1+
copper type 3 cm1*
copper type 2 '"" \ 4 e (from substrate
e.g. mediator)
Mediator
Laccase-Mediator Complex
inner site
Mediato r / Pko2 I Laccnse
outer site of the fibre
ffigures 13: Reaction model for the ellzy~~~~tic bleaching nsing laccase and mediator [13]

1.4. CATALYSTS FOR OXYCEN ACTIVATION
The work done by Paice and Bourbonnais [13,10,19,24], and Call et al. [16,21] strongly
suggests that a realistic and effective cataiytic oxygen delignification system can be
found based on optimisation of reaction chemistry. The catalysts could either function as
mediators, or as biomimetic catdysts, instead of enzymes per se. Tbis opens up the
possibility of low cost cataiysts with suitable chemisûy to achieve the same purpose of
activated deiignification as with the real laccase enzymes. The current understanding of
the catalysis mechanisms, however, is d l 1 at a nascent stage.
Conventionai oxygen delignification is achieved with alkaii and under "rirastic
conditions" of elevated temperature and pressure. in this case, lignin reactions are
triggered by ionized phenoxyl radical groups reacting with oxygen, forming phenoxyl
radical and superoxide anion radical (41, phenoxyl radical formation being the rate-
determining step [SI. Oxygen reaction with non-ionized organics is also possible, forming
hydroperoxy radical.
Under "mild conditions", Mother Nature devised many ways of tapping the
oxidation power of oxygen. One such way is by living organisms that intercept oxygen
by transition metd complexes (active site of redox enzymes, some being multi-nuclear
metal compIexes), forming various intemiediate oxygen adducts, which decompose and
direct the oxygen reactions. This is referred to as dioxygen activation.
Oxygen can potentially be reduced by four electrons to yield water. Catalytic
oxygen delignification cm be achieved through one (most cornmon), two, or four-
ekctron processes. Laccase enzyme deiignification is believed to be realized through four
steps of single-electron processes teading to a reduction of oxygen to yield water.
1.4.1 Current Status of Cataiytic Oxygen Delignitication
C m t l y , there are no commercial cataiysts availabIe for oxygen delignification, despite
increasing research efforts mer the years - the most signifïcant of which are mentioned
here. Cobait complexes were investigated as catalysts for oxygen pulping and Saicomine
or Co-Salen was found to enhance the def gnification of hardwood puIp under certain
co~ditioits [27. in another study [BI , cyctic voltammetry was used to screen the
potentiai cobalt complexes for their use in oxygen deiignüïcation and, again, Co-SaIen

was found to be the most effective. A similar appmach: employing cyciic voltammetry as
an analytical tool to screen the potential cataiysts, has been used in this w o k
Various vanadium(+S)-based and non-vanadium-based polyoxometallates
(POMs) have aiso been used stoichiometrically as oxidants for delignincation with
impresive resuits [29,30,31], in which POMs were found to be more selective than
molecular oxygen. Evtuguin et ai. [32] have reported the use of various
polyoxometallates as oxygen catalysts. In particuiar, heptapeutavanadophosphate anion
(HPA-5) has been fond to selectively oxidise residuai l i e in the puip. The active
species here is V(V) (in the form of HPA or va' produced via dissociation of HPA),
which oxidises the organic substrates by accepting electrons h m them, and gets oxidised
back to V(IV) via reaction with molecular oxygen. Thermodynamic conditions for
setective oxidation of organic substrates with HPA under aerobic conditions are
formulated as follows:
E0 substnlc < E0 HPA < E0 Oz [32]
Due to the lower lignin redox potential as compared to polysaccharides, selective lignin
oxidation in iignocelluiosics in the presence of HPA under aerobic conditions is possible
WI* in other studies pertaining to catalytic oxygen deiignification, dirnethyldioxirane
(designateci as 'T3 has been tested as a source of "activated oxygen" in an inter-stage
treatmeat between two oxygen stages [33], and a manganese 0 complex,
MnoCyDTA has been used for in siru electrochemicaiiy mediated oxygen
delignification of wood puip [34]. Hail et ai. have evaluated metal complexes of cobdt,
~theni~m, manganse, hn, nickel, hmgsten and vanadium as potential cataiysts for
oxygen deiignification under highiy alkaline conditions, and found that the nickel 0 sulfate resuited in the most significant i n m e in delignification selectivity (measured as
AkappalAviscosity).
It has been estabfished that vanadium (+4,+5), tungstate, and molybdate can
activate peroxide spaies for delignification [3q. Activation of oxygen gas by vanadyl
(IV) complexes in lignin reactions, under acidic to neutrd conditions, is a novel
application discovered by Tan et al, [37l that resuited in over 50% energy saving for

mechicai pulping. It alsr, caused 30% delignification when applied to sofhvood krafl
puIps, but had a detrimental effect on pulp viscosity.
ûther studies have reported the use of transition metal complexes as catalysts for
peroxide bIeachiug of krat't pdps [38,39,#,41]. These include the use of Unilever multi-
nuclear maaganese catalysts [38], a binuclear manganese complex [39], and îhe ment
attempts by Collins et al. [4û] with speciaily synthesized novel iron 0 complexes. In
one study [41], a vanadium (V) peroxo complex (ATPV) was reported to improve the
deiignification efficiency and brightness of the pu@ for alkaline iiydrogen peroxide
delignification. However, no commercially significant results were reporteci in any of
these studies.
1.4.2. Evaluating Different Metal Complexes for Cataiytk Oxidative Delgniücation
The effectiveness of metal complexes in catal-g oxygen deIignification can be studied
in several ways using a variety of techniques. In most of the studies reported above,
cesearchers have used direct experimental techi;iques, Le., by canying out oxygen
delignification on a lab sa le or on a pilot-plant scale to study the efficiency of the chosen
catdysts. This is also the most straightforward way of estimating the cataiyst's
commercial viabiiity as weII. The efficiency (and selectivity) of a certain cataIyst is
deterniined by observing parameters, such as kappa number, brightness gain, viscosity
los, etc.
However, there are several other ways to study the effectiveness of the catalysts
for oxidative deligaifïcation. One of them invoIves the use of phenoiic and mu-phenolic
lignin model compoimds. The effectiveness of a cataiyst in oxidising these mode1
compounds is indicative of its eEectiveness in cataIysing the residual lignin oxygen
delignification. For example, Kang et ai. [42] have studied the oxidation of iignin model
compounds (creosol, vanillin, veraûyi aicohol etc.) using POMs and Bourbonnais et ai.
[19] have studied IaccasedABTS mediated eiectrochernical oxidation of non-phenoiic
(veratryi aicohol) and pheriolic ( v d y l aIcohol) Iignùi model compoimds by cyciic
voltammetty-
Cyclic voltammetry [CV) has increasingiy ken used for analyskg cataiysts for
oxidaîive delignincation, One of the earlier works, where CV was employai to evaiuate

the catalytic behaviour of metals in phenoxyl radical formation and in oxidative
delïgnification, was c d out by Landucci [53. CV was used to determine the
electrochemical behaviour of the metals, which was then correlated with their cataiytic
behaviour. Ions of metal complexes - copper, manganese, and iron were evaluated, and it
was found that only those redox couples whose f o d potentials lie in the region of -0.3
V to +0.3 V vs. satmated calomel electrode (SCE) exhibited any catalytic activity [5]. in
this region, both oxidation and reduction are relatively low-energy processes [SI.
Delignification of pub using oxygen involves a number of redox reactions [4],
and h m a thermodynamic point of view, the electmchemical reduction potential plays
an important rote in redox reactions [43]. Cyclic voltarnmetry can be used to measure the
reduction potentiais of metai-ions and hence the cataiytic effect of the complexes of these
metals for oxygen delignification. Based on the cyclic voltammograms, together with the
results h m the eIectrochemically mediated oxygen bleachhg of wood pulp, Pemg et ai.
[43] concluded that a required feature for a transition-metal complex to promote oxygen
delignification in alkali near room conditions is that the reduction potential of the redox
couple of the metal ion shouid be at or above that of the fdferrocyanide couple.
Bourbonnais et al. [26] evaluated various metal complexes for their use as
mediators in laccase-mediator delignification of bleach kraft pulp. They proposed that for
a complex to be an effective mediator, it should behave like a true catalyst and have the
following elecîmchemicai properties: a highly redox reversible cycle, and a redox
potentiai in the range of lignin (0.5-1.2 V vs. standard hydrogen electrode (SHE)). Based
on the CV studies, potassium octacyanomolybdate (&hf~(o(CN)~) was found to be an
effective mediator.
Other works where the technique has b e n employed include screenhg potential
cobalt complexes for oxygen delignification [28], and the evaluation of mediators for
laccase/mediator puip bleaching [19]. The experfmental setup and the analysis method for
CV are expiained in detail in the foiiowing sections.
1.4.3. Cataiysts for the Present Work
Reüminary experimmts in this study identihi two noveI classes of transitionai metai
catalysîs that were found to be effective in oxygen delignification of hardwood lrraft pulp
with good selectivity. The effectiveness and selectivity were very impressive as it is well
known that hardwood kraft puIp is difficult to d e l i e by conventional oxygen
delignification. Based on these preliminary resuits, together with an understanding of
biomimetic catalysis and the information available h m previous studies, such as the
relative success of polyoxometallâtes [29,30,3 l,32 3, three novel cataiysts, nameiy
vanadyl sulfate hydrate (VS), ceric (IV) sulfate (CS), and molybdenyl acetylacetonate
(MA), were chosen for this study. Tan and Solinas' [37] recent success with vanadyl
complexes for mechanical pulping supportai the choice of these catdysts. The foilowing
sections describe the techniques that have been used to evaluate these cataiysts.

1.5. CYCLJC VOLTAMMETRY
1.5.1. CV Technique
Cyclic voltammetry (CV) is a potential-controlied eledrochemical technique. In this
technique, an electrode immersed in a quiescent solution is subjected to a voltage sweep
or voltage scan and the resulting c m t is rnonitod The voltage is variecl linearly h m
an initial to a final potentiai and then, immediately, swept back to the initial potential
without changing the rate. This is referred to as trianguiariy varying potentid sweep, or a
cyclic linear potential sweep. The initial and finai potentials are chosen in such a way that
they encompass the formai potential, EO, for the analyte. A singie sweep (cycle) is
employed in most of the cases, but sometimes multiple potentiai sweeps are used to
obtain additionai idormatioa CV is a usefid tml to characterize the nature and reactivity
of the products fonned in an electrochernicai miction. In addition to themodynamic
parameters, such as redox potential, CV provides direct insights into the kinetics of
electrode reactions, incl~Uing both heterogeneous and homogeneous electron transfer
steps and coupled chemical reactions EU]. Figure 1.4 shows the typical potential sweep
programs employed in CV [45].
Single Sweep Multiple Sweeps
Figare 1.4: Typicai potentiai sweep prognai9 employed in cyeüc voltammetry [4q
CV apparatus consists of an electrochemical ceil with three electrodes - the
working electtode (WE), the awcîliary or "corniter" electrode (AE), and the reference
electrode (RE), immersed in an electrolyte soiution. The elecfmchemicd ceIl is

connected to a potentiostat, which sets the contcol parameters for the experiment. The
output h m the potentiostat is connected to a data acquisition system, which records and
displays the signal Lines reflectiag the current and potential of the wotkhg electrode. The
output, which is in the form of a current-poteutial graph, is caiied a cyclic
voltammogram. Figure 1.5. shows the experimentai setup for CV.
1.5.2. Potentiostat
The hct ion of a potentiostat is to controI potential and measure current. The potentiostat
is connected to the conventional three-electrode cell. It contnls the potential of the
working electrode with respect to the teference etectrode while simdtaneously measining
the current flowing between the working and the auxiliary electrode.
A function gwerator in the potentiostat provides the potential sweep or pulse
sequence to be applied to the working electde. The function generator applies a
systematically varying potential, as shown in Figure 1.4, to the working electrode through
the potentiostat at a desired rate. The sweep ( a h referred to as 'scan') rates can Vary
h m a few mVIs to as high as 20,000 voltds 1451. The potentiostat should have the
capacity to provide the required ce1 voltage for this circuit (f 15 V capacity wiii serve
the purpose) [46]. It shodd also have a sufn.cient current measuring capability so as to
measue large currents. The potentiostat's intemal feedback circuits prevent aii but a very
smail curent h m flowing between the w o h g and reference electrodes [47].
153.1. CeU Design
The electrochemicai celi consists of a glas or pIastic container having the electrolyte
solution with three immersed electrodes (WE, AE, RE) connected to a potentiostat,
Custom glasmare designs that include convetLient fittings for mounting electrodes, gas
inlets and outlets for purgïng oxygen, andior separate chambers for each of the three
electrcdes are often used in research, but common laboraîory gIassware cm also be
adapted to serve the desired putpose.

Time 1 4 Potential
Auxiliary Electrode rking Electrode
Reference Electrode
Electrochemical ce11
Figure 1.5: Experimentai setup for cyclic voltammetry

The ceU can be a singIe component or a rnufti-component type. Ia a single
component ceii, al1 the elecirûdes are houseci in the same compartment (Figure 1.5).
However, if the reaction products at AE interfere with the reactants at WE, working and
awciliary eiectrode compartments may be separated by mass tramfer tesistant makiais,
such as glas fits [48]; and the RE is electrolyticaiiy cunnected to the WE through a
luggin capiliary as show in Figure 1.6. Sometimes, a three-cornpartment ce11 is alsa used
where the third cornpartment houses the referme electrode.
Figure 1.6: A Iuggin capillary for mference electrode
aefore the experiment, it is often necessary to remove the dissolveci oxygen h m
the solution especiaiiy when modetate to large negative potentiaIs are king applied to
the WE. m e n has a cathodic signai that cm interfere with the observeci current
response. Dissolved oxygen is removed by purging the solution with an inert gas, such as
Nt or Ar, The inert gas can then be used to blanket the air space above the solution during
the course of the experiment

133.2. Electrotyte Solution
The electrolyte solution consists of a supporting electrolyte dissolved in a solvent.
However, sometimes the elecûolyte can ais0 be the analyte.
Solvent: A number of physiochemical properties must be considered while choosing a
solvent, such as conductance, solubility of the electrolyte and the analyte, and reactivity
with eIectrolytic products [49,50]. The solvent must have a wide potential range for the
study of the redox pmess of interest, Le., the solvent must not itselfundergo oxidation or
reduction in this potentid region [49].
For most aqueous electrolyte solutions, water is used since it is cheap and
possesses the desired physiochemical properties; its acid-base pmperties are well
understood. However, since water easily gets reduced or oxidized to Hz and Oz
respectively [49], there is a limited potential region in which electroactive species can be
studied without interikence h m water decomposition currents.
For non-aqueous electrochemistry, commonIy used solvents include acetonitrile,
dimethyl formamide (DMF), dimethyl sulfoxide, and methylene chloride. DMF is one of
the aprotic solvents which has a veq good dissolving power for ionic species. It also bas
a bmad limit h m -3.0 V in the cathodic range to +1.0 V in the anodic range (vs. SCE),
and is a solvent of choice for anion radicds [SI]. Alcoholic mixed solvents and DMF-
water mixture are used for organic compounds with m c i e n t solubiiïty in water.
Tt is important for the solvents to be pure since CV is sensitive even to trace
amounts of elecûoactive contaminants. In the case of water, this c m be achieved by using
deionised or distiiied water. For non-aqueous solvents, the main impurity is water, which
can be removed by refluxing and distdhg.
Suppotting electrolyte: The purpose of the supporting electrolyte is to impart
conductivity to the solvent, which enables the continuous current flow in solution, The
concentration of the supporting eIectrolyte shouid be substantiaily greater (100 times
[52]) than that of the analyte so as to minimixe the influence of space charge (migration
current) on the charge tramfer kinetics. Also, it must be soluble in the solvent being used
and must remain electmchemicaily inert in the potential region of interest.

HCiO4, H~s0.4, or HCI are n o d y employed for studies in acidic aqumus
solutions; and NaOH or KOH for dkahe queous solutions. Since bu@érîng is important
in the neutral region, citrate, acetate and phosphate buffers are employed to achieve this
[53]. Non-aqueous eIectroIytes, like the tetraakylammonium (TAA) salts, are comm~nly
used 6th DMF. Two such exampIes are tetraethyylammonium perchiorate (TEAP) and
teüaethyyiarnmonium tetraüourohrate (TEATFB).
1.5.33. Working Electrode
Al1 the reactions of interest takë piwe at thc m ï b g cktmde m). Workùig electrodes
for the study of solution phase reactions should be chosen so that they do not react either
chemicaiiy or electrochemically in the potential region of interest. The WE should aIso
have a fxiIe elecîron transfer with the electroactive species.
Mercury is oflen used as WE for electrochemical studies because of the absence
of surface defects, easier cleaning propdes, and bigh cathodic overvoltage for hydrogen
evolution from water decomposition. However, rnercury reacts anodically, and hence is
not suitabIe in the anodic regions [54].
Despite its high cost, platinum is used widely for fabrication of WE. In aqueous
solvent systems, platinum is a good choice when working with anodic potentials, but at
cathodic potentials, interference h m the reduction of hydronium ion (resulting in H2
evotution) mates a problem [SI. in non-aqueous solvents, however, plathum provides a
wide potential range in both the positive and the negative directions.
Gold woricing electrodes are designed dong the same lines as platinum ones.
Although gold is usuaiiy less expensive and provides a wider potential region as
compareci to platinum, it is not as electrochemicaily inert.
Carbon electrodes are usefui over a fairly wide potentiai range in both anodic and
cathodic directions and in aqueous as weU as non-aqueous solutions. Cornpared to
platinum, tfiey work at Iarger cathodic ptentials. Solid carbon electrodes are usually
made h m "glassy carbon" or "pyrolytic graphiten, the former introduced recentIy into
e lwhemis t ry and is the most widely used carbon material today [Sa. Its hi&
mechicai stabiiity, iow porosity, merines over a wide potentiaI region and good
conductivity and reproducbility make it suitable for its wide appIicatiom. Frirther, it is

isotropie in nature and insensitive to changes in pH 151. However, in acidic medium, it is
suitable for use over the potentiai range h m about 4 . 8 V to +1.2 V vs. $CE [Sv.
The surface of a carbon electrode needs to be polished £iquently to remove the
impurities depoçited on its surface. Mechanical poiishing is generally carried out for this
purpose. For h e r polishing, as in the case of glassy carbon electrode, alunha or
diamond powder of 0.05 p size can be used. This aiso helps in'activating the electrode
surface. This kind of pretreatment is useN for some other electrodes too.
Depending on the potentiais used, other materiais, such as Ag, Cu, and Pb can
aiso be used as inert working electrodes for CV studies [56].
As the electrode radius is made smaller, deleterious effects, such as the potentiai
drop due to resistance and capacitive charghg tirne, are greatly reduced since they are
directIy proportional to the electrode surface area [58]. Microelectrodes and
uttramimelectrodes, which have small radii, can achieve this and have attracted interest
recently. The glassy carbon electrode h m Bioanaiytical Systems @diana, USA) is one
such example.
The voltaumetric response of the electrode is a function of the size and shape of
the electrode surface. Since the overall current at an electrode surface is diredy
proportional to its surface area, only a known surface area mut be exposed to the
electrolyte. The purity of the elecîrode material must be maintained at a level of 99.999%
or more. It is, therefore, preferable to buy the electrode in the shape in which it is
intended to be use& since recasting or machinhg may contaminate the electrode material
[591-
153.4. Reference Electrode
The potentiai of a working electrode in a voltarnmetry experiment is measureâ against the
reference electmde (RE). The potential of a reference electrode should not vary whm the
extenial potentiai is appiied m the WE-RE system of the ceii and it shouid be chemicaüy
siable. The electrode potentials of half-reactions on a thermodynamic scde are m e a d
agauist the standard hydrogen elecûode (SHE), also caiied the normal hydmgen
eiecûode, whose standard reduction potentiai (EO) is quai to zero by convention.
However, it is tao curnbersome to use. Instead a nimiber of other ceference electrodes are
use& The measured potentiais are then "corrected" by simple addition or subtraction and
reported against the SHE. Two most common reference electrode systerns used in
aqueous solutions are the saturated calomel e1ect.de (SCE) and AglAgC1 electrode.
SCE is the most widely used RE, in which mercury is in contact with a HflgzClt
paste, which in turn is in contact with a saturated KCI solution. The shorthand notation
for the SCE haif-cell is
Pt(s) 1 Hg (4 1 Hg2C12 (s) 1 KCl (aq, sat'd) II;
and the half-reaction occurring inside a SCE is given as:
HgzC12 (s) + 2 e- CS 2 Hg (4 + 2 Cl- (aq)
At 2S°C, the formal potentiai for the SCE haif-reaction lies 0.2415 V more positive than
the SHE [60], and a potentiai rneasured against SCE can be reported versus the SHE,
simply by adding 0.241 5 V to it.
For work in aqueous systerns, the "silver-silver chloride" or AuAgCl reference
electrode is quite popular. The half-reaction for this reference electrode is given as:
AgCl (s) + ë o Ag (s) + Cl- (aq)
The potential assumed by an AgIAgC1 reference electrode depends only on the activity of
the chloride anion. The Ag/AgCI reference elecîmde (obtained h m Biodyticai
Systems) used in the present work consists of a silver wire coated with a layer of silver
chioride and immersed in a 3 M NaCl solution. The potential of this electrode is -35 mV
relative to the SCE.
One of the important requirements for a reference electrode system is that it m u t
not contaminate the electrolytic solvent. Sait bridges are employed to minimize ionic
contamination of the electrolyte. in the case of one-compartment ceii, a "luggin
capillarf', as shown in Figure 1.6, can be used to isolate the reference solution h m the
ceii solution.
If aqueous-based references are used in non-aqueous solutions, a large liquid
junction is produceci; and often serious, aqueous contamination of the non-aqueous cell
occurs. To avoid large junction potentiais, the RE potentiai should be as close as poss1'ble
to the ceil solvent systern in nature.

15.3.5. Anriliary Electrode
in voltammetric studies, the current flows between the working and awiliary electrode
(AE). On account of its high impedance, almost no current flows through the re fmce
electrode. Although the main interest is on the working electrode, AE should not dissolve
in the medium and the reaction product at the AE must not reach or react at the WE.
Platinum meets most of these requirements and hence is the most wideiy used material
for AE in aqueous and non-aqueous solutioas, as weli as in molten media.
The auxiliary electrode area must be sufiiciently larger than the working electrode
to easure that it is not the one controlling the limiting cumt . The AE is driven by the
potentiostatic circuit to balance the Faradic process at the WE with an electron hansfer in
the opposite direction; for example, if oxidation takes place at the WE, reduction takes
place at the AE, and vice-versa if the reaction products at the AE interfere with those at
the WE, the AE can be placed in a separate compartment containing an electroIyte
solution that is in ionic contact with the main test solution via a glas Et. In most cases,
the AE can be placed right in the electrolyte solution dong with the WE and the RE.
1.5.4. The Output Device
The output device receives the output h m the potentiostat and plots a curreat-potentid
graph, commonly referred to as 'cyclic voltammogram'. if the potentiostat is interfaceci to
a computer, these signais are read directly by the controlling software, and the
experimental data is processed, displayed, and stored using a data acquisition system.
1.5.5. Cyclic Voltanunogram
A cyclic voltammogram is usefiil for quantitative 2s well as qualitative determinations,
and in the determination of thermodynamic and kinetic data. Figare 1.7 shows a typicaI
cyclic voltamnogram. The potentiai is plotted on the X-axis and c m t on the Y-axis. In
the European voItammograrn convention, positive potentials are plotted to the right and
negative potentials to the le& anodic current is plotted "up'' in the positive direction, and
the cathodic curtent is plotted "down" m the negative direction [61]. The directions for
potential and cuuent are reverseci if the North American voltammogram convention is
used. In this study, the Empean voItamrnogram convention is foliowed.

Oxidation. M "' : Ep.8
Figure 1.7: A typical cyciic voltammogrnm
The Nemst equation, which descriies the relationship between electrode potential
and solution concentration for a reversiile redox system, applies under strict equilibrium
conditions, Le., when the concentrations do not change either with tirne or distance.
However, CV is a transient technique where the concentrations change with distance as
well as with tirne, as the diffiision layer inmases with the. Therefore, the effect of mas
transport ne& to be included as well Th. is doue by incoiponthg Fick's 2" law of
d i f i o n , and by assuming that at any given moment, the surface concentrations of the
electrochemical species in the reaction
O x + n C e R
at the electrode surface may be predicted by the Nernst equation given as
E, = EO' + (RT'nF) Ln [ C a (0,t)/C~ (0,t)l ..Equation 1.5 (a) [62]
where E, refas to the equilibrium (reversiile) potentiai ofthe half-ceii, E'' refers to the
formal potential of the half-ceii, Cu, refers to the concentration of the oxidized species of
the electrochemical reaction, and CR refm to the concentration of the reduced species of
the electrochemical reaction. F is the Faraday's constant and n the number of electrons
involved in the half-reaction.
Cyclic voltarnmeüy experiments are performed under the conditions of semi-
infinite linear diffusion. This means that the electrode dimensions are larger than the
thickness of the dimision Iayer and that there is a bulk solution far enough h m the
electrode so that the concentrations of ail species remah unchanged tbroughout the
experiment. The symmetry of the diffusion under these conditions implies that only the
diffusion perpendicuiar to the eIectmde needs to be considered.
Each peak in the voltammograrn corresponds to either the oxidized or the reduced
species in the solution, and the height of a peak is usually proportionai to the
concentration of the analyte. In a voltammogram, as shown in Figure 1.7, a substance that
is oxidized during the anodic scan (a scan aiong the positive potentiai) appears as an
anodic peak. As the potentiai is scanned aiong the positive direction, the oxidation
process sets in and the concentration of the oxidizable species decreases on the electrode
surface to adjust to the positive shift of the potential. This leads to the depletion of the
oxidizable species on the electrode sinface and the diffusion process sets in, whereby the
oxidizable species move h m the bulk to the electrode surface. At short tirne intervals,
there is a sharp concentration gradient and the current is bigh, but as the tirne increases,
the dif i ion layer expands and the concentration gradient decreases slowly. Thus, there
are two opposite influences. At short t h e intervals, the influence of potentid
predominates and the current increases with the, as represented by the rising portion of
the anodic peak. At longer time intervais, the mass transfer effect predominates and the
cment decreases with t h e and reaches a limiting value, as represented by the falling
portion of the anodic peak. At some intermediate point of time, a peak in the cunent
potential curve d i s .
ii the direction of scan is reversed, the oxidized species, which are stiI1 at the
d a c e of the electrode, get reduced and a cathodic peak appears. The current value at the
peak is called the peak cunent (ip) and the potential corresponding to the peak is caiied
the peak potential&).
An assutuption made m the above analysis is that the oxidized species is
completely regenerated at the end of the anodic scan, and the rates of m o n of

oxidized and reduced species are equaI. in pmtice, this condition may not apply, and
there couid be a deviation h m the ideal curve pattem.
It should be noted that only diffiision has ken considered while desmiing the
effect of mass transfer. The other two modes of mass transfer, migration and convection,
have been negiected since they can be minimized experimenîaily. The migration effect
can be minimized by using excessive supporting electrolyte as mentioned before, and the
m a s ûansfier due to convection is already eliminated, as the solution remains quiescent
during the CV expriment.
A great deal of quantitative information can be obtained h m a cyclic
vo1tarnmogt;un. First and foremost, it is a test to see if a redox couple is indeed
reversible. Some important characteristics of a reversiile system are:
1. The peak potential for the auodic mieep, 5, and the peak potential for the
cathodic peak, $,,, can be read directly h m the voltammogram, and the
ciifference between them, e, can be calcuiated. For an electrochemically redox
system fitting the Nernst equation, a symmetricd CV is obtained with a constant
peak separation (&) independent of scan rate, and the following relationship at
25*c
EPP - &,, = 4 = (59.2h) mV . Equation 1.5 (b) [63]
holds hue, whme 'n' is ihe number delextrons invrilveii in the reriox couple.
2. The difference between the initial sweep peak and 5df-peak potentials at 2 5 * ~ is
given as:
(E, - b) = (56.5Jn) mV ..Equation 1.5 (c) [63]
3. The ratio of the anodic to cathodic peak current is unity, Le., ip,Jip,c=l. It is
important to note here that the cattiodic peak cunent is measured h m a baseline
which is established by the decaying portion of the cathodic peak (Figure 1.7).
The basehe is assumed to be the current that wouid be obtained if the forward
sweep were continueci for the same amount of time that it takes to reach to the
reverse peak. The peak cunent is measured fiom the peak to the extrapoIated
baseline; the mamement is doue in this way so as to deduct the background
current. The background current is always present irrespective of whether the

electroactive species is present or not and is due to the charging of the double
layer, which bebaves iike a capacitor.
4. The fonnal potdal, E", for a reversiile redox couple can be estimated as the
average of the two peak potentids:
E~ = 6, + Ew) / 2 ..Equation 1.5 (d) [63]
The analyte concentration can be obtained h m the voltammogram using the
Randies-Sevcik equation, which specifies the peak current, i, (A), in tenns of
concentration, scan ratc and diffusion coefficient, as follows:
i, = 0.4663 n F A C ( n ~ r n ' " VI" DI" ..Equation 1.5 (e) [63]
In this equatioa v is the scan rate (V/s), F is the Faraday's constant (96485
Chol), A is the electrode surface area (cm2), C is the anaiyte conceatration (moles/cm3)
R is the universal gas constant (8.314 J/mol.K), T is the absolute temperature (K), and D
is the analyte's diffusion coefficient (cm2/s). At Z'C, the quation becomes:
312 IR IR ip =(2.687x10³ n v D A C ..&ution 1.5 (f) [63]
From the above equation, it can be seen tbat i, is directly proportional to the
anaiyte concentration (C) and the square mot of the scan rate (v'"). ïherefore iddn at
constant C and idC at constant v must be constant, and i, vs. C at constant v must be a
straight line and pass ttirough the origin. Also, h m Equation 1.5(c) CE, - k) (dBerence between the initiai sweep peak and half-peak potentids) m u t a h give a
constaut value of (563n) mV at 2 5 ' ~ . if al1 these criteria are obeyed, then the process,
which is a reversiile diffusion-controlted, may be confirmeci.
The interfaCid phenornena descriiing the tevmble e l ~ h e m i d processes are
the charge transfer reaction and the m a s transfér in solution. The Nernst equation is
applicable only for a revem'ble electrochemical redox couple, where the electmn transfer
to the electrode d a c e (charge tramfier) is hst enough to maintain the laws of
thermodynamics [52]. However, in redox systems, in which the electmn transfer is slow
compared to the time period m which the CV is determined, the laws of kinetics
determine the electrode &e concentrations and the behaviom is said to be "non-

Nernstian" (not fitting the Nernst quaiion). The peak separation (4) is, then, p a t e r
than the Nemtian values of 592 mV for one-eIectron transfer, and the fomal potentid
can no longer be appmximated by îhe mid-point between anodic and cathodic peaks. In
addition to a wide peak separation, the asymmetry in voltammograms depicting non-
Nernstian behaviour is indicative of overlapping single-electron transfers or adsorption
phenomena on the electrode surface. Electrodes that operate under kinetic control are,
therefore, said to be electrochemicaliy 'ïrreversible" or bbquasi-reversible" [52].
Sweep rate is a factor affiting the reversibility. As the sweep rate is increased,
the peaks drift apart and the redox system tends to become irreversiile. ûther factors,
such as the decay of the oxidized or the reduced species also result in irreversibiIity.
Modified equations have to be used to cdculate peak currents, rate constants, and other
kinetic parameters.
1.6. ELECTROCEIEMICAL PROPERTIES AND PARAMETERS
For a given substance to be an effective caîalyst, it must be able to oxidize lignin in the
pulp. Also, it should be able to regenerate itself; i.e., it should be elecûochemicaliy
reversiile. This implies that the Nernst equation is applicable, and the electrode reaction
is said to be thermodynamically reversiile.
For a thermodynamically feasible reaction, Gibb's free energy (AG) is negative
for the forward reaction. Since
AG = - nFE, = - nFEO, (at unit activities),
the electrode potentiai for the reaction should be positive. For a reaction involving two
redox couples, the ciifference between the reduction potentials of the individual redox
reactions (or = Ew - b) should be positive.
In the mechanism for electrochemical delignification using oxygen, proposed by
Pemg et al. [43, Figure 31, the metai cataiyst oxidizes the lignin in the pulp. For this
reaction to be f m i l e , Eod should be positive, or the reduction potentid (EO') of lignin
ion should be less than that of the metai cation. The cataiyst is regenerated
electrochemically at the anode. However, in d oxygen delignification, oxygen provides
the required potwtial for the oxidation (regeneration) of the catdyst, oxidizing the metai
cation and in the process getting reduced to water. Therefore, ody those metai ions
whose reduction potentials are less than that of oxygen would be able to act as catalysts.
For example, the heptapentavanadophosphate anion @PA-5) was found [32] to
selectively oxidize the residuai liguin in lignocelIulosics under aerobic conditions since
HPA satisfis the thermodynamic conditions for the seiective oxidation of organic
substrates with HPA under aerobic conditions, which are formulateci as follows:
A h , as proposeci by Bourbonnais et ai. [2q, an effective mediator for the laccase-
mediator delignincation should have a hiwy redox reversiile cycle and a redox potentiai
in the range of lignin (0.5-1.2 V vs. MIE).
Below, the electrochemicai behaviour of the three chosen catalysts has been
reviewed. Various materials to be used as WE for the cataiysts, and the parameters that

efféct the shape of cyclic voltammogram, and hence the determination of potentials in
cyclic voltarnmetry, have been examined.
1.6.1. Vanadium Suifate Hydrate
Standard and Fonnal Potentiak
The electronic configuration of vanadium (3d2 4s2) is responsible for the commody
hown oxidation States of Q Iü, IV, and V, and for its relatively complex chemistry. The
coordination number of vanadium (represaited as 'V3 in most of its compounds and
ions is six. V(IV) is the most stable oxidation state under various conditions; V o is
easily air-oxidized and is the le& stable oxidation state of vanadium in solution; and
V(V) is a rnild oxidizing agent under maxy conditions [64].
Several researchers have camed out the eIectrochemica1 investigations for
obtaining the electromotive force (emf) data of vanadium in aqueous solution. In one of
the earlier works, Carpenter [65] fotmd the reduction potential of V O N 0 redox
couple in various concentrations of hydrochloric acid and then extrapolated to obtain the
standard reduction potential value of 0.9996 V vs. SHE, and conhned the haif ceil
reaction to be
V O ~ + 2H' + e- o VO" + H ~ O
Table 1.1 compares the vaiues of reduction potential for the V(V)N(IV) redox couple
obtained h m literature
Table 1.1: Reduction ~otentirl vaiues for the VîVlNIIV) redox cou~le
I 1.001 1 Standard Reduction Pot.(E") 1 [67] I
Reduction Potential
(vs. SHE), V
Conditions Source

Thecefore, the electrochemical beahviour of the V(V)N(IV) couple in strongly acidic
solutions is best explainai by the assumption that the species exia as VS and v@; and in acidic solutions V w exists predominantly as vanadyl ion, vo2+ (aq) [69].
From the haifceii reaction, it can be seen that the potential depends upon the pH
of the solution. Pourbaix [70] reported the relationship between the standard reductiou
potentiai and the pH of the solution for the V@+NO~+ couple as follows:
E, = 1 .O04 - 0.1 182 pH + 0.0591 log (vo~+No~') .Equation 1.6 (a) [70]
The pH-potential equihbrium diagrams for vanadium species, indicating the existence
and fonnation of various vanadium species have also been plotted [70].
Voltamrnetric Characzeristics:
The voltammeûic and chronopotentiometric characteristics of vanadium have been
studied using several techniques and by employhg mercury and various solid working
electrodes, such as platinum, gold, and carbon electrodes. At a mercury electrode, the
characteristics of V(V) could not be studied in acidic media, because V(V) is chemically
reduced by mercury, while the oxidation of V(N) in such media does not occur within
the attainabIe range of potential [?Il. The use of solid electrodes makes it possible to
study the V(V)N(iV) couple in acidic solutions.
The nature and surfice of the platinum electmde has proved to be of primary
importance in determining its voltammetric response to the V O and V(V). Ushg
voltammetty, the V ( v ) N o couple was found to behave irreversibly in 1.8 M
perchloric acid on a platinum electrode: the anodic wave was poorly defined [72].
However, on a platinized platinum electrode, the couple behaves reversiily and both the
cathodic and anodic waves were shown to be difïusion controiied, V(V) was found to
reduce to V(IV) at platinum and gold electrodes in another vo1t;mimetric study. ûxïdation
of platinum etectrodes is a problem in this case. Pretreatment, such as chemicaliy
stripping the oxide by treating the electrode with hot concentrated HCI, therefore,
becornes necessary.
The reduction of V(V) in 1M d h i c and 1M phosphoric acid on a graphite di&
WE, and a graphite rod couter electrode was found to be irreversible [73]. In a study
pertaining to the thermal precipitation of V(V) ions to V20S in sulfbric acid solutions
[74], cyclic voltammetry was carrieci out with 2 and 5.4 M VOr) solutions in concentrated
(24 M) solutions of suIfhic acid. The cyciic voItammograrn [74, Figure 11 for the 2 M
V(V) shows two cathodic peaks represenihg the reduction of V O to V o and
subsequent reduction to V O . Upon reversing the scan, two anodic peaks result,
representing the oxidation to V o and V O . However, for the 5.4 M V O , the peak
potential separation is wider in the positive range, suggesting the poorer electrochemical
reversibility for the VO/V(lV) redox couple in the solution. Also, a new anodic peak is
observed, suggesting the formation of a different intennediate species.
in other stuclies, polarography has been done using a dropping mercury
electrode @ME) and the reduction of V(W) has been found to be totally irreversible and
proceeds to V(II) [75]. Acidic solutions of V(V), however, m u t not be ailowed to come
in contact with mercury as they oxidize it in HCI and H2SO4 media [76]. in the
determination of vanadium by controlled-potential coulometry, Rigdon and Harrar [77]
found the V(IV)NO redox system to be tataily irreversiile in phosphoric acid media
with a preueated platinun WE, Use of DME, Hg, Pt., and gold as working electrodes has
aiso been repoaed for the V(V)N(rv) redox couple 1781.
Choice of For the present work, mercury and platinum elecaodes will initially be
tested for their use as working eIectrodes for carrying out CV studies with the vanadium
catalysts, although, as discussed above, there are limitations in the usage of these
electrodes. L'se of carbon electrudes has been suggested as weU [74]. Hwce, graphite anci
dassy carbon electrodes wiii also be tested as WE.

1.6.2. Cerium (IY) Suffate
Cerium (Ce) belongs to the lanthanides series of elements with oxidation states of iJï and
IV in most inorganic compounds, the oxiâation states of ïü and N being the most stable
as weii. The oxidation state of Ce in ceric sulfate (CS) or Ces04 is W . The ce4"/ce*
couple is highiy oxidizing in strong acid media and has found ready application in
analytical chemistry [79]. From the earlier investigations of the reduction reaction of
C e 0 in sulfunc acid [79], the mechanism of reduction involves the gain of an electron
by to fom C e 0 with no coupled bond breaking or adsorption steps, Le,
Because of the simple elecûochernical mechanism of Ce reduction, it has been used as a
mode1 reaction in the study of various other electrochemical phenornena [79], and
ce4'/ce3+ redox system is employed for characterizing new techniques [80].
Volrammehic Characteristics:
The voltammetric behaviour of Ceo/Ce(iiI) couple has been extensively studied using
various electrodes and electrolytic solutions.
The electrochemicd behaviour of the couple has been widely investigated in
sulfuric acid and perchloric acid solutions [8 11, with sulfuric acid being used often.
P l h u m and glassy carbon electrodes are the most widely used working
electrades for studying the electrochemical behaviour of the ~ e ~ ~ i c e ~ ' redox couple in
aqueous solutions. Other electrodes that have been used to study the Ce couple include
borondoped conductive diamond (BDD) electrode [82], vitreous carbon disc [81],
catbon paste electrode [83], goId [84], and indium disk eIectrode [84].
Standard and Formai Potentials:
The formai potentid @') of the Ce(IV)/Ceo system viuies considerabty with the
concentration andfor nature of the acid medium [79,85), with the value in HtS04 being
the least positive [82]. This is atûibuted to the f a t thaî the ce4' species is readily
hydrolyzed or complexed in aqueous electrolytes [79,86].

As can be seen above, the reduction of to C e 0 in suifùric acid solutions
is independent of pH, as it does not involve or OH- ions. The reduction potential of
Ce is, thus, only slightly dependent on the electrolyte concentration.
The standard reduction potential(E7 for the reduction of ce''+ to ce3' is 1.72 V
[671. The reduction potential for the same teaction in 1 M HtS04 is 1.44 V vs. SHE [673.
In one of the earlier works, Smith and Getz [871 found the reduction potential to be 1.44
V vs. SHE for the reduction of ce4' in 0.5 M HzS04 solutions on a platinum electrode.
Maeda et al. [82] investigated electrochemically the oxidation of ce3+ (as Ce~(S04)~) in
aqueous H2SO4 (0.1 hl) using CV on platinum, giassy carbon and BDD electrodes, and
found the oxidation of ceH to be quasiteversible with the value of formai potential (E'")
equal to 1.19 V vs. SCE, which is approximately the same as for the reduction of ce4'.
The EO' value obtained h m a cyciic voltammagram for an equimolar mixture of
ce4+1ce3' in 0.1 M H2S04 was found to be very similar to the one obtained fmm a
voltamrnogram for ce3+ aione [82]. This indicates that E'" is independmit of ~e"1ce~'
ratio, and that ionic species ce4* and ce3' behave similarly. in perchlorate solutions, the
potentiais were found to be only slightiy dependent on the ceJ'/Ce3' ratio [85].
Di%ion CoMcients:
In a midy by Maeda et al. [82], the relatioarhip between i, and & was observed to be
proportional, and the diffusion coefficient (D) for ce3' in 0.1 M H2S04 solution was
found to be quai to 1.05 x 10~' cdls. in an earlier papa [84], the value of D for ce4' in
HtSQ solution wing a glassy carbon electrode was found to be 0.37 x IO-' c d s . A
large value of D ( c ~ ~ + / H ~ s o ~ ) may be attriiuted to the dBefeflce in the degree of
complexation ability of S O ~ - ions with the cew and ce3+ ions in HzS04 solutions, since
ce4+ complexa with ~ 0 4 ' - more readily than d o a ce3+ [82]. The D values h m the
literature wiii be used to validate the results of the presmt CV work with cerium suifate.
Wadsworth et al. [85] mentioaed that, m H2SOo solutions, most ce4+ ions are in
complexed f o q as c~(so~)", and c~(so&'-. In the case of ces,
approximately haü of the ions are in complexed form [BI, with ce3+ being the
predominant C e 0 species in &te soIutions having ionic strengths in the range of O2
to 2 mol kg-' [88]. This indicates a stronger interaction of the sulfate anion with Ce (IV)

as compared to 0, and has been confïmed in a later study [BI]. Further, the D d u e
for cd' in HzS& solution was found to be greater than in HNG or HCQ solutions
[82], which again reflects the ciifference in the state of complexation and hydration of the
ceH ioop in each solution. The complexation and hyyQdtn ceactions involving ce4' in
H2S04 solutions is given as foiiaws:
Table 1.2 cornparcs the values of reduction potential and diffusion coefficients (D) for the
Ceo/Ce(IQ redox couple obtained h m literature.
Table 1.2: Reduction wteatial and D values for tbe CeCNUCe(Lm redox couple
Reduetian Potential
I (vs. SHE), V
1.72
1.44
1.44
Choice of The Iiterature [81,82,83] suggests the use of carbon electrodes, and in
particufar the glassy carbon electrode, as WE for studying the C e O / C e o redox
coupIe using CV. Aithough the use of glassy carbon electrode is limited in the anodic
potda1 range [SA, it is the preferred choice as WE for carrying out CV studies in the
pte~etlt work with cerium d i e .
D, cmZls
1.19 vs. S E
Standard Reduction Pot. (EO)
1 M HzS04
0.5 M HzS04, Pt. etectrode
Conditions
[67]
(671
Cg71
1.05 x [O"
c m 0.37 x 10⁵
cm')
7
Source
O. i M H ~ S O ~ ,
Glassy carbon electmde
1 M HzSOs,
Glassy carbon electrode
ES21
P I

1.6.3. Molybdenum (VI) Acetylacetonate
Molybdenum is a vexsatiIe transition element possessing a range of stable and accessible
oxidation states, and has coordination numbers that can Vary h m four to eight. The
bigher oxidatioa &tes of molybdenum are dominated by complexes containing the
mo1yMenumsxo p u p . Monooxo- or cis-dioxornolybdenum species also exist [89].
Most simple coordination complexes contain the cisdioxo MOO? cation.
MoIybdenum 0 acetylacetonate (MA), also referred to as molybdenyl
acetylacetonate or bi~acetylacetonato)dioxomol~em (VI) or Mo02(acach is a
dioxomolybdenum complex having molybdenum as its centrai metal atom, chelated to
the monoanioaic acetylacetonate ( a m ) ligand. Like the other cis-dioxornolybdenum (VI)
complexes, the oxidation state of molybdenwn in Mo@(aca+ is +6 and exists as
MO@'+ cation in solution. MA, a mononuclear complex, has a nearsctahedrai structure
with cis dioxo groups 1901. The structure of MA, an organometallic, is shown in Figure
1.8.
CH \' C-O
Figure 1.8: Molybdenumo acetylacetonate
Since Mo@(acach is a convenient source of the MO@'+ ion, it is used in the
preparation of M o 0 dioxo complexes by a partiai or total exchange of acac groups by
other ligands, such as sdicyhidehyde (SAE) [9l].
Volrammerric Characrerisrics:
The electrochemicai behaviour of the dioxomolybâenum~ compIexes has been
invesîigated using severai electrodes and in severai organic so1utions.
CV of 0.1 mM MA using a hanging mercurydrop eIectrode (HMDE) in
chlomfonn showed unly one caihodic peak 6, z -500 mv), with no discemiMe mudic

peak [92], indicating an irreversiile redox pmess. The plot of i, vs.& was found to be
ünear, confirming the ciifhional character of the cyclic voltammograms.
Electrochemicai studies on other cisaioxomolybdenum~ complexes, such as MoG(5-
H-SAP) in DMF with a glassy carbon eIectrode [89], [crk-Mo@(L)(solv)] (L =
salicylidene salicyloyl hydrazine) in DMF with a plaîinum working electrode [93], and
wo&(SAE)(lm)] (Im = i m i d i d e ) in CH3CN with a glassy carbon electrode [91] have
generally shown irreversible behaviour.
By comparhg the cathodic peak current with those of authentic one-electron
revecsiile reactions measured under the same experimental conditions, Chaudhury [94]
found that the reduction of (L = bidentate ligand), a dioxomolybdenum(W)
complex, in DMF using a platinun e1ectrode involves a metal-centered one-electron
transfer involving the M o 0 and Mo(V) oxidation States. Based on the electrochemical
results, the following reaction was proposed:
The Iack of anodic response, even at high scan rates, was attniuied to the decomposition
of the reduced species M O ~ O ~ ( L ) ~ [94]. The ligands were electrochemically inactive in
the potentiai range studied.
Topisch et ai. [89] found that the cathodic reduction potentials of cis-
dioxomolybdenurn(VT) complexes can be altered through ligand modification. They
studied the effect of ligand substituents on the MoOrl) cathodic reduction potentiai and
found that the electran withdrawing substituent sh ih the potential in the anodic
direction, which means that the Mo(V1) complexes become easier to reduce. On the 0 t h
hanci, an electron-donating substituent makes the M o 0 complex difficult to reduce. For
example, the introduction of a s u k atom in place of an oxygen donor atom on the
ligand makes the molybdenum reduction more facile since sulfur donor atoms Iower the
binding energy and the effective charge on the mofybdenum 1891.
ûxygen Transfer Properties:
Some of the dioxonolybdenum complexes have been shown to passes oxygen atom
transfer properties as they have been found to oxidize thiols, hydrazine, polyketones and

tertiary phosphine 1931. Rao et al. 1931 studied the oxidation of triphenylphosphine (l'Ph3)
using [cis-Moû&Xsolv)] and found the oxidation to be catalytic.
In general, the ability of çuitably ligated MOO~"+ to undergo a reversible oxo-
transfer is given by:
where X and Y0 are substrates. and MOO? and MOO" are the MoD?) and Mo(N)
species, respectively involved in the reaction. The ceactant (MO&"+) and product
(MOO~') of this reaction, however, can combine with compqortionation to give the
dinuclear MO" core as follows:
The cataiytic oxidation of alcohols to carbonyl C O ~ Q O U ~ ~ S by an oxygen atorn
transfer reaction h m dimethyl suifoxide (DMSO) using Mo&(a~ac)~ as cataiyst has
aiso been reporteci [go].
Choice of R E From the Literature it is found that HMDE [92], platinum [93], and glassy
carbon electrode [89,91] bave been used as the WE for carrying out the CV studies with
Mo(VI) compounds. Since glassy carbon has been the material of choice for VS and CS,
and has been used in the literature for MA, it wilI be the p r e f d choice as WE for
canyhg out CV studies in the present work with MA as well.
In summary, the three chosen catalysts, namely vanadyl sulfate hydrate (VS), ceric
sulfate (CS), and molyMenyI acetylacetonate (MA) possess properties required for a
catalyst to be effective in oxygen delignification. VS and CS have high reduction
potentials that afso satisfy one of the criteria laid out by Bourbonnais et al. [2q. Dioxomolybdenum complexes (MA being one such cornplex) possess oxygen transfer
properties. However, based on voltammograms, only CS was foimd to behave revefslltly
and, thus, mis@ the other criteria laid out by Bourbo-s et ai. 1263. Chapter 3 descn'bes
the resnIts obtained h m the CV experïments Camed out with these three catalysts.

Catalysîs were evaluated using three different techniques: oxygen bleaching experiments,
cyclic voltammeûy (CV), and simulated oxygen bleaching experiments using catalysîs
and lignin mode1 compounds.
2.1. OXYGEN BLEACHING EXPERIMENTS
Oxygen bleaching experimentq using catalysts were canied out in a high intensity
laboratory mixer at the University of Toronto. Unbleached hardwood Iaaft pulp obtained
h m a mil1 was used in the experiments, and the effectiveness of the catalysts was judged
h m the kappa number and viscosity values.
2.1.1. Equipment
The main equipment is a high intensity laboratory mixer [971 consisting of a mixer body
mowlted on a vertical-shaft, variable-speed, 3-HP motor. The mixer is covered by a
rnovable Iid, which is attached to a pneumatic piston that can be used to control and
adjust the volume and pressure inside the mixer.
The mixer body and the lid are now made of titanium to aiIow operation at higher
temperarure and pressure. A heat exchanger is built into the base of the chamber to
maintain temperatures up to 100aC. There are special openings in the mixer body to
injeet the bleaching solutions and to add the gases in precise arnomts.
The mixer rotor is designeci to provide fluidization of the pulp and efficient
mhhg of the chemicals. A IO0 pitch on the rotor blades provides axial as weil as radiai
rnixing. This rotor, together with the movable lid, aiiows large volumes of gas necessary
for medium consistency oxygen delignification.
2.13. Materiais
A h h miil-produced hardwood kraft puip was obtained h m Domtar. The puIp was
thoroughiy washed with water and then dewatered to about 35% consistency using a
centrifige. The washed puip was fluffed, double bagged in polyethene bags, and storeci at

5°C. The kappa number and viscosity of the pulp were determined to be 12.7 and 61.9
respectiveIy.
Vanadyl sulfate hydrate (VS) and ceric sulfate (CS) were obtained h m AIdrich
Chernical Company Ltd., while rnolybdenyl acetylacetonate (MA) was obtained h m
Caledon Laboratories. The hydratai sample of VS used in ai i the experiments containeci
5.53 moles of water. The chemicais used in the bleaching experiments, nameIy, sulfiuic
acid and sodium hydroxide, were prepared using analyticai grade reagents and distilled
water.
2J.3. Methodology
The catalysts were used in an oxygen delignification stage at acidic to neutrai pH
(designatecl in this study as OA) to determine their effectiveness with respect to
deriguification efficiency and selectivity. The cataiytic oxygen delignification stage was
carried out at 90°C, 90 psig (413 kPa Oz), and 10% consistency for 120 minutes.
Prior to each oxygen delignification experiment, the mixer was cleaned
thoroughly to remove any trace transition rnetals, by filling the mixer with distiiled water,
adjusted to pH 2, and then the mixer was heated to 90°C for 30 minutes. The acidic
solution was then drained and the mixer was Nlçed with distillai water. The mixer was
filled with distilled water and heated to 90°C for 30 minutes. The water was then
removed h m the mixer and an oxygen delignification stage was carried out.
For the oxygen delignification treatment, 70 g of pulp on an oven-dry (o.&) basis
was useci, The required volume of distilled water was added to the pdp to obtain IO0?
consistency and the pH was adjusted to the desired starting pH. The pdp slurry was then
put into the mixer and the mixer lid was then closed. The pulp was mixed for 10 seconds
and then heated to 90°C. The required amount of catalyst was then added through the lid
and mixed for another 10 seconds. Dunng the fht few seconds, the oxygen gas was also
turned on and mixed in with the pulp. The oxygen was aiiowed to react with the pulp for
120 minutes at 90°C and 90 psig 02. The pulp was mixeci every 15 a u t e s for 10
seconds to ensure proper oxygen/pulp mixing. Upon completion of the d o n , oxygen
gas was turaed off and the remaining oxygen was purged h m the reactor. The pressure
was teleased before opening the lid The pdp was removed to a Buchner funne1 and

filtered- The filûate was refiltered h u g h the puip mat, coiiected, and the pulp
thomughly washed.
The oxygen delignincation stage was then foiiowed by an alkaline extraction
stage. N i e grams of oxygen delignifiecl pulp was weighed into a Mason jar and the
required amount of water added to bring the consistency to 10%. The puip was then
preheated in a waterbath to a temperature of 70°C. The required amount of NaOH, 1%
on 0.6 pulp, was mixed into the pulp and aiIowed to react with the pulp for 60 minutes at
70°C. The pulp was then removed to a Bucher fiuinel and filtered. The filtrate was
refiitered through the pulp mat, collected, and the pu@ thoroughly washed. The pulp pad
was ailowed to dry overnight and the kappa number of the pulp was then deterrnined.
The control oxygen delignification experiments were perfonned at acidic to
neutral pH without the addition of the catalyst, followed by an alkaiine extraction stage as
described above.
A standard alkaiine oxygen delignification stage was also carried out on the puip
as a cornparison (signified in this study as OE); the experiment was carried out as above
excqt that NaOH was added to the puIp instead of acid. Mer the oxygen delignification
stage, the pulp was removed firom the mixer and filtered. The filtrate was refiltered
through the puip mat, collected, and the pdp thoroughiy washed. The puip pad was
allowed to dry ovemight and the kappa number of the pulp was then determined.
Analytical Procedures: Kappa numbers were determined as per CPPA Standard G.18
while viscosities were determined as per CPPA Standard G.24P - the methods have been
descriied in detail in Appendices 1 and II respectively.

2.2.1. The Electrochemicd Ceii
For tbe present study, a one-cornpartmat ce11 consisting of tbree electrwdes was used.
Two different types of cells were prepared. One was a 500 ml plastic jar, made of higb
density polyethylene (HDPE), with holes dnlled in the plastic lid for the insertion of the
three electrodes. A separate hoIe was drilied for purghg inert gas through the system. Ali
the cyclic voItammetry (CV) experiments, except the ones with molybdenum
acetylacetonate (MA), were petfonned in this cell. For MA, a 50 ml glass via1 was used,
A teflon top with a ring was designed to seal the cell. As with the plastic cell, hoks were
drilled in the tefion top for the three electrodes and also to admit the inert gas. Special
rubber rings were provided to seal the electrode holes in the teflon top. A schematic
diagram of the glas electrochemicai ce11 (Figure 2.1) depictç the arrangement of the three
eIecûodes and the inert gas opening.
Al1 the CV experiments were carrkd out at m m temperature. For the CV
experiments with MA, nitmgen gas was bubbled through the electralyte sohtion prior to
carrying out the experiment so as to remove dissolved oxygen. in the cathodic potentid
range, the presence of oxygen can impair the qu;tlity of cyciic voltatnmograms [q, and
since !he reduction potential of MA lies in cathodic range, it a?= necessary to remove the
dissolveci the oxygen content of the electrolyte dution and to seal the cell. During the
course of the experhents, the solution was blanketed wirh nitmgen.
2.23. Working Electrode
The choice of the working electrode is very important as a11 the reactions of interest take
place at its surface. Severai electrodes were iested induding a mercury electrade, a
platinum wire, a graphite rd, and a glassy carbon electrode.
The mercury electrode is a plastic J-tube filied with mercury such that a smaU
area of mercury is exposed to the solution. A pIatinum wire, dipped in mercrrry at one
end, serves as a connecter. The reactions t a k piace at the exposed surface of the mercury
c1ectrode, the am of whkh was appmxhmely 1.4 x 10' mm2. In initial experiments
done to establish the most suitabie working elecErode for the system, not much attention

Working EIectrode Reference Electrode Auxiüary Eleetrode
Gas in
Figure 2.1: The eleetroehemkai ceU [Ml

was paid to the repraducibility of the exposed d a c e area, even though it is an important
parameter af3iting reaction rates and peak currents.
A 0.762 mm dkmeter platinum wire, 99.95 % pure (metai basis), and a graphite
rod, 3.05 mm in diameter and 305 mm in length, and 99.9995 % pure (metal basis) were
obtained h m Alfa Aesar Chemicai Co. and were tested as working electrodes.
A glassy carbon electrode with a diameter of 3.0 mm (surface area = 70.69 x lo5
d), was obtained h m Bioanalytical Systems (Indiana, USA). A schematic diagram
and a photograph of the glassy carbon electrode, dong with schematic diagrams of some
other electrodes useci in the present work are shown in Figure 2.2. The giassy carbon
woricing electrode had to be polished at regular intervals. For this purpose, a polishing
doth cailed Ledothm and a 1 pm a-dumina slurry, both obtained h m Leco Co., were
employed for polishing the electrode. The glassy carbon electrode was ultimately used as
the working electrode for al1 the three catalyst systerns.
2.2.3. Others
Rfletence Electrode: For experiments using the plastic jar, a saturateci caIome1 electrode
(SCE) obtained h m Fisher Scientific Co. was use& and because the ce11 was very srnaIl
for experiments using giass viai, the compact AdAgCl reference elecwde obtained h m
Bioanaiyticai Systems was used. Al1 the potential measurements, unless otherwise stated,
are reporteci aga& the SCE.
Auxiliary Electrode: A 1 mm diameter annealeci nickel wire, 99.5 % pure (metal basis)
and a 0.762 mm diameter platinum wire, 99.95 % pure (metai basis), both obtained h m
Alfa Aesar Co., were useci. Platinum wire was the preferred choice for the auxiliary
electrode for most of the experiments. The platinum wire was cleaned at reguiar intervds
by keeping it over a £lame for a few seconds so as to burn away any organic
contaminants.
Potentios~ur: Ail the cyclic voltammetric determinations were c d e d out using the Pine
potentiostaî (Pine instruments, Pennsylvania, USA), and the software Pinechem version

-\ Carbon Core (3 mm. Diameter)
Wire
- PIastic Tube
E'iire 23: (a) Schematic figure, and (b) photogrriph of a glassy eubon working electrode [981; (c) mercury eiecnmle; (d) Ag/AgCI reference electrode 1981; (e) photogmph of a standarbsize pre-tined calomel reference electrodes (SCE) (991

2.7.5. For the initial experiments, however, a potentiostat h m Radiometer Copenhagen,
Mode1 PGZ 301, and the program 'Voltamaster 4', was used to obtain the
voltammograms.
Reagents and Chernical.: The nature and the composition of the solvent and eIectroIyte
varied with the catalyst used. A pH 3 citrate butlier was prepared using citric acid and
sodium citrate as d e s c n i in General Preparative Procedures [100]. Dimethyl
fornamide @MF), used as a solvent for molybdenum cataiyst, and vanillyl alcohol were
obtained h m Aldrich Chernical Co. ABTS, HBT, laccase, and veratryl alcohol were aiI
obtained h m Sigma TetraethyIammonium tetdiuoroborate (TEATFB), used as a
supporting electrolyte for caryhg out the CV of ~t molybdenurn catalyst was obtained
h m Sigma as well. Potassium ferricyanide &Fe(CN)b), used for testing the CV setup,
was obtained h m Fisher Scienhfic.

23. SIMULATION OF BLEACHING REACTIONS USING LIGNIN MODEL
COMPOUNDS
To simuiate oxygen bleachiug reactions, a stirred, pressurized 210 ml glass bomb reactor
was employed. The mini-reactor, made of pyrex giass, was fitted with a pressure gauge
(maximum 20 psig). This technique was used to study the effectiveness of vanadium
sulfate hydrate and cerium 0 sulfate in catalyzing the reaction of lignin mode1
compounds with oxygen
23.1. Methodology
For each of the experiments, 125 ml of an aqueous solution of sulfuric acid (pH 2-3) was
put into the reactor and the reactants were added. The reactor was pressurized to about 15
psig with oxygen and heated to about 75-80°C in a water bath.
&action: M e r the end of reaction, the solution was allowed to cool and then extracted
using diethyl ether. The extract was then concentrateci and d,zed using gas
chromatography.
23.2. Cas Chromatography
A HewIett Packard 5890 series II gas chromatograph with flame ioni~ation detector
(FID), fitted with an HP 5 column (30 m x 025 mm i.d., film thickness 0.25 pm), was
used to analyze the extracted sampIes. SarnpIes were injected manuaily into the injection
port at 250°C. The initiai oven temperature was 50°C and was held for 1 minute, then
raiseci at a rate of 10"C/miaute to 250°C and held for 5 minutes. Signais were detecteti by
a flame ionization detector (FID) at a temperature of 250°C. GC mas spectroscopy
(GCMS) analysis was carried out with NP 580 gas chromatograph coupled to a VG Trio
1000 mass spectrometer with the same type of the column under the same conditions.
Sarnple solutions of pure solvent (der), veraûyl aicohoi, and vanillyl aIcohoI
were injected to establish the retention times for each of the compounds. Retention times
of the expected oxidation products veratraidehyde, vanillin, and vanillic acid, were also
estabiished for the ptrrpose of compatison.

233. Materials
Diethyi ether and magnesiun suifate used in the extraction were obtained h m Caledon
Laboratories and Sigma Chernical Co. Ltd. Veratraldehyde was obtained h m Matheson
Coleman & Co., and vaniIlin and vanillic acid were obtained h m commercial sources as
well. The sources of other matends and reagents used in the simuiated oxygen bleaching
experiments have been listed earlier.

3. RESULTS AND DISCUSSION
3.1. OXYGEN DELIGNIFICATION EXPERlMENTS
3.1 .l. Preliminary Experiments
Preliminary experiments were carried out on the catalysts to identifi the cataiysts that
wodd be effective in oxygen delignincation. On a miii-produced hardwood kraft puip,
304% cataiytic deiignification was achieved with puip viscosity maintained at up to
24.5 cp. The novel catalytic oxygen Oelignification, men before optimization, was found
to be as effective as the commercial process of conventional oxygen deiignification of
hardwood kraft puip. The combination of a cataiytic oxygen stage and a subsequent
conventional oxygen stage produced a puip of kappa number 6 at a viscosity of 21.7 cp.
Resuits h m these experiments were used to narrow down the choice to three cataiysts,
narnely, vanadyl sulfate hydrate, ceric sulfate, and molybdenyl acetylacetonate.
3.1.2. Final Experiments
A standard alkaline oxygen detignification stage was carried out on the sample pulp as a
basis for cornparison. Four different sets of experiments were perfonned. The amount of
sodium hydroxide added to the puip was 1,2, and 3 % bas& on 0.d. pulp in the h s t three
experiments. In the fourth experiment, 0.2 % MgSOs was added dong with 2 % sodium
hydroxide. The resuits show that 21-24% deiignifkation was obtained, as measured by
kappa number decrease.
The aext set of experirnents was carrieci out to determine the optimum pH
required in a cataiytic-oxygen delignincation stage, For cataiytic oxygen detignification
experiments, 02 % (by weight) of each of the cataîyst was added to 70 g of o.& pdp. For
each of the cataiysts, the experiments wwe perfomed at pH 5 4,6, and 8 to observe the
pH-response of the cataiysts. A contro1 oxygen delignincation experiment was also
performed without the addition of cataiyst at pH 2,4,6, and 8. The experiment at pH 2
was performed several times to establish reproducibiiity. TabIe 3.1 iists the experiments
and gives the expeximental conditions.

Table 3.1: ExDerimentai condidoos for orvnen deünnificstion emeriments
Alkaline Oxygen Deligniiication
Alkaline oxygen stage (&) controls: 9WC, 90 psig a, 60 minutes, 10% consistency
a) NaOH charge: 1% on o.& puip b) NaOH charge: 2% on 0.d. puip c) NaOH charge: 3% on 0.d. pulp d) NaOH charge: 2% on 0.d. puip, 0.2% MgS04
Measure initial and final values of pH, kappa number, and viscosity.
pH-Response Curves for Caîaiysts and Controls
Oxygen delignification stage (OA): 9û"C, 90 psig Oz, 120 minutes, 7 O g o.& pulp, 10% consistency; followed by Extraction stage (E): 70°C, 1% NaOH, 60 minutes, 9 g o.& pulp, 10% consistency:
a) Control O*: no catalyst, initial pH 2,4,6,8 b) OA: 0.2% ceric suifate by W. (0.14g) on o.& pulp, initial pH 2,4,6,8 c) ClA: 0.2% vanadyl sulfate by W. (0.14g) on 0.d. pulp, initial pH 2,4,6,8 d) OA: 0.2% molybdenyl acetylacetonate by wt. (0.14g) on 0.d. pulp, initial pH
2,4968
Measure initial and final values of pH, kappa number, and viscosity after Oh and E stages.
Reproducibüity of Control Experiment at pH 2
Repeat OA Wifh no catalyst and initiai pH 2 s e v d times to get reproducibiIity teSuIts. Measure initiai and 6nal values of pH, kappa number, and viscosity a b Oa and E stage.

Figure 3.1 shows the pH response curve fot the acidic oxygen deiignification with
and without catalysts, and a cornparison with the alkaline cont.1 [lOl]. Resuits indicate
that approximately 40% deliguifïcation codd be achieved for this puIp d e r acidic
oxygen delignification at pH 2-3.5 (optimum vaiue) with any one of the three catalysts
present. WhiIe this is a considerable impmvement compared to the standard alkaline
oxygen delignification stage remilf these results a p p r to be only slightly stl~erior to that
obtained with the wniml experiments without any catdyst a d d d
It was later found that the improved delignification efficiency with acidic oxygen
debgnification was not due to iignin removai but mauily due ta the removai of
hexenemnic acid p u p s [IO11 as also describeci by Vuorinen et ai. [IO21 and Jiang et al.
[103].
Figure 3.1: pH-Response cames of novel cataiysts in Oz delignincation (02% catrrlyst by wt.)

3.2. ESTABLISHINC THE: SYSTEM FOR CYCLIC VOLTAMREi"i'
Several experiments were carrieci out to estabiish the materials and parameters for cyclic
voltammetry before the technique was applied to anaiyze the effectiveness of the
cataiysts. The technique was later fine-tuned for individual catalysts as weU. This section
describes the experiments and the d t s thus obtained, which were helpfiil in
customizing the technique for the experimmts carrieci out with the individual catalyst,
and in particuiar, the experiments that were helpful in estabiishiag the working electrode
for a given cataiyst systern.
3.2.1. Testing the Mercury and PlatIaum Electrodes
Since eariier work by Tan et al. [371 had shown that vanadium sulfate hydrate (VS) was
an effective catalyst for the softwwd pdp, it was decided to perform experiments on VS
fïrst. Mercury, platinun and graphite rods were tested as W.
Mermty Electrode: The experimental setup consistecl of a plastic electrochemical cell, a
mercury electrode, as shown in Figure 2.1 (c), a nickel wire as the auxiliary electrode,
and a sahuated calomel electrode (SCE). The soIvent was aqueous sulfiin'c acid at pH
1.5-3.0, the same pH used in the bIeaching expehents. The exposed surface of the
mercury was approximately 1.4 cm2 in area.
Figure 3.2 (a) shows the voltammogram of 0.3 mM VS in 150 mM sulfuric acid
(pH 1.20) at a scan rate of 50 mV/s. The figure shows two distinct peaks, with peak
potentials of 1020 mV and 170 mV representing b, and E,,, respectively. With a peak
separation of 850 mV, and ip,JipJ ratio of 1.94, the voltammogram represents a quasi-
revem'ble system. The mid-point of the peaks lies at 595 mV, which is far away h m the
reduction potentiai for vanadium (1000 mV). The Iinearity of the peak, however, is very
mical of a resistive film deposit/precipitate (film behaves like a resistor, V=R) [104].
When the background CV was performed, Le., in the absence of VS (the
electroactive species), the resuits show a completely different picture. Figure 3.2 (b)
shows the voltammogram of 250 mM snlfiuic acid (pH 2.05) at a scan rate of 50 mV/s,
Supernnposed on the one obtained for VS (Figure 3.2). The figure again shows two
distinct peaks, with peak potentials of 1010 mV (EPJ and 269 mV (EP,). The peak

Potential (mV)
Figure 33: Cyclic voitammograms (scan rate of 50 mV/s) on a mercury electrode of (a) vanadium sulfate hydrate (O3 mM) in 150 mM saltiiric icid; and @) 250 mM sulfiiric acid and (a) superimposed on each other
sepzration is 741 mV, and i,&, ratio is >l. Shce the electrolytic solution did not
contai. analyte, the voltammogram in Figure 3.2 (a) does not represent the analyte
couple. Since Hg oxidizes in the anodic rang? [54], and V(V) is known to oxidize Hg in
acidic solutions [76], it was concluded that the peaks actuaily represent the redox reaction
for mercury. From the data available for the Iimits of domains of relative predominance
of the dissolved substances in aqueous solutions for mercury [105], it was found that
mercury exists as ~ g * in acidic solutions of pHC3.04. Hence the voltammogram for
rnercury as shown in Figure 3 2 represents the ~g( f j /Hg* redox couple, and the reduction
potential is given by the equation:
& in V (VS. SHE) = 0.926 - 0.0591 pH ..Equation 3.1 (a) [105],
which under the given conditions is 623 mV (vs. SCE), and is close to the value of 640
mV, obtained as the mid-point between the two peaks. The standard reduction potential
for the reaction
is 61 1 mV (vs. SCE) [67l. That the peaks are due to the reaction of rnercury was later
codhmed when some precipitates, grayish-brown in coIour, were seen to fïrst appear and
then disappear during the redox cycle. This aiso explains the linearity in the
voltammograms. When the redox cycie was canied out on a wider potentiai range, the
precipitates were seen to appear at around 1Oûû mV d&g the oxidation cycle and then
dissolve at around 50 mV duting the reduction cycle. This c o h e d the formation of the
mercurous ion @ossibly as HgS04) during the oxidation cycle, which is consistent with
the fact that Hg oxidizes in the anodic range.
SimiIar experiments carried out with cerium(Iv) sulfate (CS) also show that it is
the mercury which is the primary electroactive species involved in this system. Figure 3.3
shows the voltammogram of 0.45 mM CS in 250 m . sulfitric acid (pH 1.1), at a scan
rate of 25 mV/s, superimposed on the backgrotmd (Hg) voltammogram obtained as
descn'bed above. It was, therefore, decided not to use a mercury electrode as the working
electrode (WEJ for fiiaber experïments as it is reactive m the region of interest.

Potential (mV)
Figure 3.3: Cyciic voltammogr~ms (scan rate of 50 mV/s) on a mercury electrode of c e r i u m o sulfate (0.45 mM) in 250 mM sulfuric acid and that of background (electrolyte-only) superimposed on each other
PIatinum Electrode: The electrochemical setup was the same as in the above case, except
that the platinum wire was used as the WE instead of rnercury. The exposed surface area
of the platinum was approximately 1.1 c d . A volatrnmogram of sulfinic acid showed no
distinct peaks, establishing the inert character of the platinum WE.
The voltammogram of 0.3 mM VS in 125 mM sulfrnic acid @H=1.22) is also a
flat curve with no distinct peaks. The faIlhg and the rishg portions of the voItammogram
curve on the negative and positive potentials ( r e f d to as "knee potentials") represent
Hz and O2 evolution respectivdy, a remit of water decomposition. Figure 3.4 (a) shows
the background voitamnogram with the VS voItammogram superirnposed on it. It is,
therefore, clear that the platinum WE is not usefui for the study of VS.
Experiments were carried out with CS as weii, and the resuits were similar as that
with VS, Le., a flat portion with no distinct peaks and a falling and a rising portion of the
curve representing Hz and evoIuiioa respectively. Figure 3.4 (b) shows the

-Vanadium
- Ekctrolyte Solution
- Cerium
- Electrolyte Solvent
Potentiel (mV)
Figure 3.4: Cyclic voltammograms (scan rate of 50 mV/s) on a platinum W E of (a) vanadium sulfate hydrate (03 mM) in 125 mM sulfuric acid and the background voltammog~am superimposed on each other; and (b) cerium(tV) sulfate (0.45 mM) in 250 mM sulfuric acid and the background volîammogram superimposed on each other

voltammogram of CS superimposed on the background one. It was therefore decided to
discard platinum wire for any M e r use as WE in the experiments.
3.2.2. Testing the System asing Potassium Ferricyanide
Since the resuits obtained h m using men:ury and platinum as WE could not provide
information on the redox behaviour of the catalysts, it was decided to test some other
materiais as WE for CV. However, before proceeding further, it was decided to test the
CV system per se, including the equipment, with a "Weil-behaved" simple redox system
whose electrochemicai behaviour is weii-documented in the literahue. This was doue ta
ensure that there were no problems with ihe equrPment or the experimentai setup. One
such redox system, which is regulady employai for characterizing new techniques is the
ferricyaniddferrocyanide couple [80]. It was, thus, decided to employ this couple to
veri@ the system.
Figure 3.5 shows a voItammogram of 12 mM potassium fenicyanide in 75 mM
sulfiiric acid @H=1.5), at a scan rate of 50 mV/s. Plathum wire was used as the WE, and
nickel wire as AE; SCE was used as RE. The exposed surface area of platinun wire in
this case was approximately 0.6 cm2. Two distinct p& at 445 mV (E,,,J and 244 mV
&,) were observed that represent the ferricyanide/femx:yanide (F~(cN)~~%~(cN)~L)
couple. The peak separation poteutid of 201 mV suggests quasi-reversiiility for the
system mder the given conditions. The mid-point of the two peaks, which can roughly be
taken as the forma1 potential (EO'), is 345 mV (or 586 mV vs. SHE). This is close to the
literature value of 560 mV for the F ~ ( C N ) ~ % ~ ( C N ) ~ ~ couple in 100 mM HCI [106]. The
figure also shows a fiat h e , which represents the electrolyte-only voltamrnogram. The
fact that distinct peaks are not observed in the absence of the anaiyte (potassium
ferricyanide) verifies out system. Therefore, the ficus of our work was shifted to h d a
"suitable" WE so that the redox behaviour of the chosen catalysts could be stuclied.

Potenüal (mV)
Figure 3.5: Cyclic voltammograms (scan rate of 50 mV/s) on a platinum WE of potassium femcyanide (12 mM) in 75 mM sulfuric acid and îhe background voItammogram superimposed on each other
3.23. Testing the Graphite Electrode
Since the systern had been verified using potassium ferricyanide, it was decided to test
other materiais for theu use as WE. The electrochemical behaviour of vanadium in
concentrated acidic solutions has been previously studied [74] using CV on a graphite
disk WE - the resuits have been summarized in section 1.6.1. It was decided to replicate
this shidy using a graphite rod as WE, the specifications of which have been descriied in
section 2.2.2; platinum wire was used as the AE. Besides testing the graphite electrode,
this would aIso r e c o n b the validity of our system. Figure 3.6 (a) shows two
voltammograms obtained for 2.0 M and 5.4 M V(V) solutions at a scan rate of 20 mV/s,
represented by cuve 1 and curve 2 respectively 1741. Experiments were perfomed for
the replication of curve 1 only. Figure 3.6 (b) shows the voltammogram obtained under
the same conditions on a graphite rod WE. The scan rate, potentiai range and aii the other
parameters were the same as in the cited study. The peak potentials obtained h m the

Cuwe 1 only
0.03
Figure 3.6: Cyclic voltrunmogruas (scut rate of 20 mV/s) of 2 M V(V) in 4 M s u M e acid solution (a) on a graphite disk W E 1741 (Reproduced by permission of The Electnrchemicrrl Society Inc.); fi) on a graphite rod

voltammogram in the study [74, Figure 11 are compared with the results h m the present
work in Table 3.2.
Table 3.2: Com~arison of the ~ e a k wtential values
from üterature 1741 and ~resent resulb
1 (vs. SCE) I 1 I
V O I V O 1 v o / v o 1 v(m)/v(V) 1 V O l V ( m ) 1 1 I 1
As can be seen h m the figure and the table, the peak potentiai values h m the
present work are close to the corresponding values h m the literature. The mall
discrepancies are within experimental error and may be attributed to the ciifferences in
electrode surface conditions and the ciifferences in elecîmde geomeûy. The results show
that the system is "satisfactorf' and graphite can be used as WE for Mher experiments
with the chosen catalysts, and in particular for the vanadium catalyst.
1 I I I
3.2.4. Testing the Classy Carbon Electrode
Glassy carbon electrode (GCE), another variant of the carbon electrode, is increasiagly
being used as WE for electmhernical experiments, and in particular for CV studies. As
with the graphite md, it was decided to test this electrode for its use as WE by replicating
a work in the iiterature where GCE has been used as WE. One such study has been done
by Bourbonnais et al. [19], who carried out CV studies on mediators and lignin mode1
compounds. They chose a one-cornpartment ceil of Sml, a 3mm diameter giassy carbon
WE, a platinum wire AE, and an AdAgCl RE obtained h m Bioanaiytical Systems
(Indiana, USA). The electrolyte sdution was a 0.05 M, pH 4 citrate buffer. Figure 3.7 (a)
shows the voltammogram of 0.2 M ABTS (W-azinobis-(3-ethyIb&azoLined-
sulphonate)) at a sccui rate of 20 mV/s [19]. The figure shows two anodic @,,J peaks
with potentials of 515 and 915 mV (vs. AdAgCl), conesponding to the oxidation of
ABTS to its cation radical @BTS") and subsequently to its dication (ABTS~"). The
From [74] 1 .O2
Rpimt Results 1 0.75
0.84 -0.43
-0.85 1.17
-0.74
-0.44
figure also shows two corresponding cathodic peaks 6,) at 856 and 429 mV for the
reduction of the dication and the cation radical respeciively.
For replicating thpse resuits, di the materials and parameters were kept the same
except that the volume of the ceU was farger (250 ml) and SCE was used instead of
AgiAgCl as the refmce elecûode. These two changes do not affect the shape of the
fesultbg voltammogram. Figure 3.7 (b) shows the cotresponding voltammograms
replicated in the present study. The peak potentiais obtained h m the voltammogram in
the cited study [19, Figure 2(A)] are compared with the resuits h m the present work in
Table 3.3.
Table 33: Com~rrislln of the wak wtential values
from üterature 1191 and Dresent results
Present Results 535 935 864 450
It cm be inferred h m Figure 3.7 and Table 3.3 chat the replication of the work
done in 1\91 was successful, both in tenns of the shape of the voltammogram and the
value of the peak poiemtials R, and &,$. Further, the voltammogram did mot suffer
b m the large currents obtained as a result of Hz and evolution in the given potentiai
range, as was the case with platinm.
It shodd be noted that h e we used SCE instead of AdAgCl as used in, 35 mV
(difference between the E values of SCE and AgIAgC1 reference elecûde) was
added to the values obtained h m our d t s . FIrrttier, the authors have taken anodic
current to be negative as opposed to the convention followed in this work, which explains
the discrepancy between the different signs of the y-axis in and our d t s .
From the d t s obtained in îhe above experiments to establish the system, it was
concIuded that the glassy carbon e!ectrode is the most "suitable" working electrode for
our system, since it gives the most tepduc1ible d î s , In addition it does not react in the

Figiire 3.7: C y c k v o l t n m m ~ m s (scan rate of 20 mVfs) of 0.2 mM ABTS in 50 mM, pH 4 citrate bdfer on a glrssy carbon WE (a) h m literahire [f 91 (Reprinted with permission from Eisevier Science); and @) present resdîs

potentiai region of interest and has a smooth surface and, therefore, minimum d a c e
defects. It was, thus, decided to use GCE as the WE for CV experiments with the three
chasen catalysts.

33. CV RESULTS WITa VANADIUM SULFATE HYDRATE
For al1 the CV experiments with vanadium sulfate hydrate (VS), a 500 ml plastic jar was
used as an electrochemical cell, with glassy carbon electrode as the WE, platinum wire as
the auxiliary electrode, and SCE as the reference electrode. The experiments were cmied
out at room temperature, and the potentiais were fecorded against the SCE. The potential
was scanneci in the anodic range as the reduction potentiai of vanadium lies in tbis range.
33.1. VS in Sulfuric Acid Solution
Figure 3.8 shows the cyclic voltammogram of 2 mM VS in 50 mM suifuric acid (pH =
1.52, conductivity = 27.5 mS/cm) at a scan rate of 20 mVIs. The voltammogram shows a
large anodic peak &) at 1340 mV and a very small cathodic peak &,,J at 195 mV.
Another small cathodic peak is seen at -162 mV. The presence of cathodic peaks was
con6nned by taking the derivative ptot of the current-potentiai curve. The peak at 1340
represents an aimost irreversible one-eiectron oxidation of V(IV) (as V a 3 to V(V) (as
~ m , since in strongly acidic solutions, the vanadium species exist as V G and VO*'
[69]. The large difference between the anodic and the cathodic peaks (AE,, = 1 145 mV),
Figure 3.8: Cyclic voltnmmognm (scm rate of 20 mVIs) on r glnssy carbon WE of vanadiam saIfah hydrate (2mM) in 50 mM m c acid

and a very high ratio of the peak c~rre~lts (iPJipg > 20) indicates that the product(s) of
electrochemicai oxidation of VS is not stable and decays to a non-reducible compound.
This is expected since a slow scan rate was employed and the fact that V(IV) is more
stable compareci to V(V) [Ml. By using a higher concenûation of VS and by employing
higher scan rates, the system is expected to become Iess irreversible.
This type of condition resembles an ECi process (Electmchemicai reaction
followed by an irreversible chemical reaction) which can be d m ' b e d as follows:
Electnichemical Rxn: Ox +ne-= R
irreversible Chernical Rxn: R + Products (in solution) [IO71
Under this situation, the meamremeut time (scan rates) and, to a lesser extent, the
concentration of the electroactive species determine whether voltammetric response is
diffusion controlled, kinetic controlled or intermediate. By employing higher scan rates
(decreasing the measurement the), the intluence of the chernical kinetics is minimized,
and the electrochemicd parameters can be evaluated.
The plot of ipa vs. & (square mot of %art rate) for 2 mM VS in 10 mM sulfuric
acid solution (Figure 3.9 (a)) is linear, indicating that the oxi&tion of VO" is diaision-
controlled. Further, as shown in Figure 3.9 (b), the plot of i,,, vs. C (VS concentrations) at
20 mVIs is a straight Iine passing through the origin, which further confirms the
diffiisiona.1 character of the oxidation pmess. The ladc of reversibility, therefore,
suggests that parameters, such as the decay of the oxidized vanadium cation and lower
scan rates contniute towards the irreversible nature of the voltarnmograms.
3.3.2. VS and Lignin Mode1 Compounds in SuUuric Acid Solution
Veratryl alcohol (ver-A) and vanillyl alcoho1 (van-A), whose structures are shown m
Figure 3.10, were employed as non-phenolic and phenolic lignin model compounds
respectively to study the mechanism of catalytic electruchemical oxidation of lignin by
VS. The efféctivness of the catalyst is studied by obsenring the increase in the peak
c m t of the catalyst (in the voltammogram) npon addition of the lignin model
compound,

. pH 2.02 0 A
pH 1.5 0 0 - A pH 1.2 0
0 - Linear 0 0
0 0
rn 0 0
0 0
0 œ
0 p0
0 0
1 1 I
O 25 50 75 100
Conc. of VOS04 (mM)
Figure 3.9: Anodic peak current (a) vs. sqrt (sean rate) for 2 mM VS in 10 mM sulfirric icid solution; and (b) vs. VOSO, concentration at various saitaric acid concentrations (scan rate = 20 mV/s)

Veratryl Alcohol Vanüiyl Alcohol
OCH,
Figure 3.10: Structures of veratryl and vanüiyl rikohol
For CV studies with VS and lignin mode1 compouuds, the electrolyte solution was
a 50 mM sulfuric acid solution, and the scan rate employed was 20 mV/s. Figure 3.1 1 (a)
shows the voltammograms of 2 mM VS, 5 mM ver-& and the two compounds mixed
together. A very large anodic peak for ver-A is observai 6, = 1190 mV) as compared
to vanadium E, = 1340 mV), and the anodic peak current (i,,) is approximately 7 times
that of VS. This anodic peak is ascnied to a two-electron oxidation of veratryl alcohol to
veraûaldehyde [19]. However, when the two compounds are rnixed together, there
is only a slight M e r i n m e in the peak current, implying that upon addition of ver-&
the increase in the catdyst peak current is minimal. The peak potentiai for the mixture is
appmximatety the s m e as that of ver-A. Since ver-A was chosen in excess of vanadium,
so ail of ver-A is available for oxidation.
The large difference between the anodic and the cathodic peaks (& = 1204 mV)
for ver-A (Figure 3.1 1 (a)), and a high ratio of the peak cunents indicate that the
eIectnichemicai oxidation of ver-A is irreversi'ble and the oxidized species is unstabIe and
oxidizes to other compounds. Further? below 1000 mV, where ver-A does not show any
peak, the increase m the oxidation current of VS upou addition of ver-A is negligile.
CV experimmts on higher concentrations of VS and va-A and at different scan
rates were aIso carieci out with similar results. Figure 3.1 1 (b) shows the voltammograms
of 20 mM VS, 50 mM ver-& and the two compounds mixed together. As can be seen

9
(b) VS + Veratryl Aicohol - Veratryl Alcohol
m
œ
vs 1 B m 1 I
100
3 75 Y = 50 C
2 5 ~
O
-25
Figure 3.11: Cycïic volaimmognms (scan rate of 20 mVls) in 50 mM sulfiiric rcid of (a) vraadium sulfate hydrate (ZmM), verrûyl dcohol (SmM), rnd r mixture of two; and (b) vanadium suliate hydrate (ZOmM), vetitryl rlcohol (SOmM), and a mixture of two
VS + Verrtryl Alcohol
Veratryl A i c o h o ~
VS . a L a # I
400 4 0 O 400 800 1200 1600

h m the figure, the voltammogram of the mixture overlaps that of ver-A aione and the
effect of the catalyst appears negligiile.
Similar d t s were aiso obtained when CV experiments were carrieci out with
vanillyl aicohol. Figure 3.12 shows the voltammograms of 2 mM VS, 5 mM van-& and
the two compouuds mixed together. As was the case with ver-& a large anodic peak was
observed for van-A 6, = 864 mV) as well, compared to VS, and the voltammogram for
the mixture overlaps that of the van-A. The lower oxidation potential of van-A compared
to ver-A indicates that it is easily oxidized and degraded compared to ver-A. The easy
oxidizability of van-A compared to ver-A is attniuted to the phenolic group, which can
easi1y oxidize to give the phenoxyl radical that leads to its degradation.
3.33. VS in Citrate Buffer Solution
The major obstacle in studying the effect of VS in catalyzing the oxidation of the mode1
compounds under given conditions was that the peaks of the lignin model compounds
were very large as compared to VS, and it was difficuIt to determine the e&ct of the
catalyst. As seen in the Figure 3.1 1 (a), ver-A does not show any anodic peak below 1OOO
mV. Therefore, if the anodic peak representing the oxidation of VS could be stiifted to
below 1000 mV, the effectiveness of vanadium in catalyzing the oxidatiou of lignin
model compounds could be better studied.
The reversible reduction potentiai of vanadium is dependent on the pH of the
solution 1701, and increasing the pH shifts the potential to more negative vaIues (refer
Equation 1,6(a)). As a resuit, the peak potentiai is aIso expected to shift negatively with
pH. This was confbed by a plot of peak potentiai (EPB) vs. pH for two différent VS
concentrations in suifiuic acid, as shown in Figure 3.13. It was, therefore, decided to
perfonn CV experiments in a solution of higher pH. A pH 3, 50 mM citrate b u f k
solution (conductivity=2.1 mS1cm) was chosen for this purpose and the muge of potential
scan was limiteci to 1ûûû mV. As with s u k i c acid, aU the experiments wiîh citrate
bWer were performed at a scan rate of 20 mVIs as weii.
Figure 3.14 (a) shows the voltammogram of 2mM VS in a pH 3 citrate bdfier
solution at a scan rate of 20 mV/s. Again, the voltamrnogram shows thaî the oxidation of
VS is an irreversiile one-electron trmisfer process, h m V O to V O , with an anodic

-20 1 I 1 I 1 I I
400 -400 O 400 800 1200 1600
Potential (mV)
Figure 3.12: Cyclic voltammograms (scan rate of 20 mV/s) in 50 mM suifuric acid of vanadium sulfate hydrate (2mM), vanüiyl alcohol (SmM), and a mixture of two
Figure 3.13: pH vs. anodic peak potentiril for 2 and 20 mM VS (scan rate = 20 mV/s)

peak at 854 mV. The size and the shape of the voltammogram are the same as in the case
with suifhic acid. Also, as in the case of suifuric acid, the system becornes slightiy more
reversible upon incfeasing the scan rate. Figure 3.14 (b) shows the effect of changing the
pH of the solution - the oxidation potential of VS in a pH 1.52 sulfllric acid soIution is
486 mV positive to that in a pH 3 citrate b a e r solution. This larger than expected shift
(486 mV) in potential when a pH 3 citrate b d e r was employed, as compared to when
using two different pH values in d f k i c acid (Figure 3.13), may be due to the possible
formation of a compiex between the vanadium and the citrate anion [86]. The figure also
shows that the oxidation c m t of VS in the citrate buffer solution is slightly diminished
as compared to the sulfiuic acid solution.
The hi& peak potential of VS &,, = 854 mV) observed h m its voltammogram
(Figure 3.11 (a)) satisfies one of the criteria laid out by Bourbomais et al. [26] that a
good catalyst for the oxidation of lignin has a redox potential in the range of lignin.
However, the absence of a substantial cathodic peak, and hence a redox cycle, suggests
irreversibility, making it unsuitable as a cataiyst for oxygen bleaching.
33.4. VS and Vanüiyl Aicohol in Citrate Baffer Solution
Fig. 3.15 shows the voltammograms of 2mM VS, 5mM van-& and the two compounds
mixed together. The voItammogram for the mixture of VS and van-A shows an anodic
peak at 842 mV with a peak current of 47.83 pA. The conesponding oxidation current for
VS and van-A at this potentiai is 8.91 CiA, and 6.92 pi respectively. The ratio of the
oxidation current of the mixture to the sum of oxidation c m t s of VS aione and van-A
alone is 3.02. This means that the addition of van-A increases the anodic current of
v@+/Vo2+ couple three-fold.
This effect of vanillyl alcohol on the anodic peak of the VW&+ loose1y f d s
into the homogeneous redox catalysis (HRC) class of electrochemical reactions,
described by Andrieux and Savéant [IOSI. The half-peak potential for phenols shih to
more negative values with increasing pH and addition of the electron-donating
substituents [LW]. In the present case, the oxidation potentiai of van-A is close to that of
VS under given conditions. The cataiyst oxidizes to ~ O z f at the electrode surface, which
then diffuses into the solution and oxidizes van-& as üiustrated in the scheme shown in

Figure 3.14: Cyclic voltammogra~~~ (scui rate of 20 mV/s) of vanadium M a t e hydrate (2mM) in (a) 50 mM citrate bairer (pH 3); and @) citrate b a e r @H 3) and srilfiiric acid @H 1.52)

Figure 3.16. The oxidation of van-A regenerates the cation vo2+ at the electrode,
resuiting in an increase in the current comparai to the oxidation of v&+ or van-A alone.
The regeneration of the catalyst, wkch is othenivise irreversible under the given
conditions, is manifested in a small increase of the catbodic peak in the voltarnmogram of
the mixture (E,,, = O mV, Figure 3.15). Because ~ 0 2 f cation produced at the electrode is
not stable, the rate of its decay (kd,) wili have a direct impact on the rate of regeneration
(kt) of its reduced form ( ~ 0 ' 3 at the electrode cataiyzed by van-A oxidation, and
consequently on the resulting cataiytic current.
From Figures 3.12 and 3.15, it can be seen that the ratio of peak currents (ipJiP,J
is very large which indicates that the oxidation products of vanillyl alcohol are unstable
and hence degrade. Since vanillyl aicohol is a substituted phenol, the oxidation pmducts
are difficult to characterize. For example, the anodic oxidation of p-methoxyphenol in
aqueous media can either result in a dimer through the generation of a phenoxyl radical
followed by the coupling reaction or a quinone through the generation of a phenoxonium
ion [110]. Sundhoh and Sundholm [l 1 1] studied the anodic behaviour of guaiacol and
Cpmpyl guaiacol in acetoniûile using CV and found that the k t electron transfer is
followed by very fast reactions leading mainly to polymers. Several monornetic and
dirneric products were identified dong with the detection of some short-iived radicals.
The oxidation of vanillyl aicohol by VS can, therefore, yield several oxidation
products Uicluding vanillin, vanillic acid, and several monometic, dimeric, and even
polymeric compounds. The occurrence of several oxidation products of van-A is later
c o h e d by the GC analysis of the reaction products obtained h m the reactions
between VS and van-A.
CV results with VS and van-A show that VS enhances the oxidation of van-A as
sew by a three-foId increase in the anodic peak current (Figure 3.15). This, however,
happens at the expense of the catalyst which decays upon oxidation.
335. VS and Veratryl Alcohol in Citrate BPffer Solution
Figure 3.17 shows the voltammograms of 2mM VS, 5 m . ver-& and the two
compounds mked together. The voltammogram of the mixture of VS and ver-A has an

Potential (mV)
5 0 -
40
30
20
10
O
-10
Figure 3.15: Cycllc voltammograms (SC- rate of 20 mV/s) in 50 mM citrate buffer (pH 3) of vanadium sulfate hydrate (tmM), vanillyl alcohol (SmM), and a mixture of two.
- VS + Vanillyl Alcohol
VS
- -
Vanülyl Alcohol -. B I m I I
in Solution
400 4 0 O 400 800 1200
Electrode Surface
Oxidation Products
vanillin, vanillic acid, dimers, polymers, and other
Vanillyl alcohol
OH
Figue 3.16: Redox cataiysis of vanadium sulfate hydrate and vanülyl abho1

oxidation peak at 749 mV and an inmaseci oxidation p& curent. Due to a shift in the
oxidation potential of the mixture as compared to VS, the efféct of the addition of ver-A
to a solution contauiing VS cannot be M y analyzed. Even if the peak current value of
the mixture of VS and ver-A is compared to the sum of the current values of VS and ver-
A abne (background) at the oxidation potential value of the mixture (749 mV), the
iacrease in the current is not substantial (< 1.4). Fuaher, no visibIe increase in tbe
caîhodic peak is observe& as was the case with van-A.
The resuits with ver-A indicate that the vanadium catalyst is oniy slightiy
effective in cataiyzing the oxidatioa of ver-A under given conditions.
VS + Veratryl AIcobol
Veratryl Aicohol
Figure 3.17: Cyclic voltammograms (seau rate of 20 mVfs) in 50 mM citrate briffer (pH 3) of vanadium suifate hydrate (2mM), veratryl olcohol (Sm, and a mixture of twa

3.4. CV RESULTS WITH CERiUM(n? SULFATE
For ai i the CV experiments with cerium(TV) sulfate (CS) or ceric sulfate or Ce(SO&, a
500 ml plastic jar was used as an electrochemid ce& with glassy carbon working
electrode, platinum wire as an auxiliary eIecirode, and SCE as the reference electrode.
The experiments were carrieci out at room temperature, and the potentials were recordeci
againçt the SCE. The potentiai was scanned in the anodic range as the reduction potentiai
of cerium Lies in this range.
3.4.1. Cerium in Sulfuric Acid Solution
Since the electrochemical behaviour of the Ceo/Ceo redox couple has been widely
investigated in sulfuric acid solutions [81], it was decided to use suiiüric acid as the
electrolyte for CS. Figures 3.18 (a) and (b) show the cyclic voltammograms of 2 mM CS
in 50 mM sulfùric acid at a scan rate of 50 mV/s. In Figure 3.18 (b), the range of potential
scan is decreased since cerium peaks occur in a mai1 potential range. The voltammogram
of CS shows two distinct peaks: an anodic peak 6,) at 1260 mV and a cathodic peak
(%,J at 1120 mV. The large increase in the current afler the modic peak in Figure 3.18
(a) represents oxygen evolution (Eam=1230 mV [67J). With a peak potential difference
(s) of 140 mV and the ratio of the peak curtents (ipJip,c) close to 1, the voltammogram
of CS clearly shows an alrnost revetsible one-electran reduction of ce4+ to ce3' and the
subsequent oxidation of ce3' back to ce4'. Figure 3-18 (a) also shows the background
voltammogram of the electrolyte.
The mid-point of the peak potentiais, which can be taken as formai potential (E?)
in this case, is equaI to 1190 mV vs. SCE or 1431 mV vs. SHE. This is very close to the
reduction potential (E) of 1440 mV for the ce*/Ck3+ redox couple in 1 M sulfuric acid
solution, suggesting good reversibility for the cerium couple.
A large positive reduction potentiai and revmiIe redox cycle makes CS a very
good candidate for a catalyst m oxygen deligniscation. With a high reduction potentiai,
CS can also degrade the non-phenolic compouuds present in wwd, which are otherwise
dficult to oxidize using conventionai bkaching methods. CS, therefore, presents an
excellent choice as a catalyst for oxygen delignifiaion.

Potential (mV)
Figure 3.18: Cyclic voltammograms (scrin rate of 50 mV/s) in 50 mM sulfuric acid of (a) e e r i u m o d a t e (2mM) and the backgroaud current; and (b) cerium(1V) sulfate (2mM) in a shorter scm range

Certertm(m) Surfate in Sulficnc Acid:
Since ce3' is howu to behave in a similar fashion as ce4+, it was decided to cauy out the
CV of cerium(m) suifate (or cerous sulfate) in sulfunc acid [82]. Figure 3.19 (a) shows
the cyclic voltammogram of 2 mM c e r i u n 0 sulfate (or cerous sulfate) in 100 m M
sulfuric acid at a scan rate of 20 mV/s. The voltammogram again shows distinct anodic
and cathodic peaks at 1240 mV and 1135 mV respectively, with a slight decrease in & (105 mV) for the ce3+ as compared to ce4+. However, ipJipr ratio was increased to about
1.75. Nonetheless, it still represents a quasireversiile redox ceaction involving the
oxidatioa of ce3+ to ce4+ and the nibsequent reduction of ce4+ back to ce3'. It should be
noted that the peak currents are enhanced when C e o sulfate is used instead of
sulfate, which may be attniuted to the fact that the degree of complexation with the
sulfate ions ( S O ~ is higher for ce4+ as compared to ce3+, as d e s c r i i in section 1-61
The E'' h m Figure 3.19 (a), as the mid-point of the peak potentids, is qual to
1187.5 mV, which is very close to the Eo' value of 1190 mV obtained h m the
vottammogram of CS. Figure 3.19 (b) shows the cornparison of the voltammograms of
cmus and ceric sulfate.
The plot of i, vs. 6 (Figure 3.20 (a)) for 2 mM cerium(m) sulfate in 100 mM
H2S04 solution is linear, indicating that the oxidation of ce3+ is diainon-controlled
Further, as shown in Figure 3.20 (b), the plot of ip, vs. C (cerium(III) sulfate
concentrations) in 100 rnM HzSO4 solution is a sûaigùt line passing through the ongin,
which f i e r confirms the diffiisiond character of the oxidation pmess. From the dope
of the hear plot in Figure 3.20 (a), the value of the ciiffusion coefficient (D) for ce* was
calcdated to be 2.19 x IO-' m2/s using Equation 1.5 (f) (Randles-Sevick equation),
which is close to the value calcuiated by Maeda et al. (1.05 x IO" cxn2/s) on a BDD
elecûode [82]. Kiekens et al. [84] calcuiated the value of D (ce4') using a giassy carbon
etecûode to be 0.37 x IO-' cdls, which is lower than D (ce3')* iikely due to the
difference in complexation abilities with the d a t e ion (as descriied in section 1-62).
The plot of i,, v s . 6 (Figure 3.21) for 2 mM CS in 100 mM H2S04 solution,
however, is not completely linear as shown by the scattering of data points dong the he.
This mdicates that the reduction of Ce(J.V) is not completely diffusion-controiied-

Potential (mV)
Figure 3.19: Cyclic voltammogranw (scan rate of 50 mVls) of (a) cerinm(m) suifate (2- in 100 mM sulfuric acid; and (b) cerium(iIl) siilfrite (2mM) in 100 mM snifuric acid and c e r i u m o suiGate (2mM) in 50 mM splfpric acid together

u - O 2 4
Conc. of Ce(lll) Sulfate (mM)
Figure 3.20: Anodic peak curreat (a) vs. sqrt (scan rate) for 2 mM CS in 100 m M siilfarie acid solution; and (b) vs- spliate concentration in 100 mM sulfiiric acid solution at scan rates of 10 and 50 mV/s

Figure 3.21: Cathodic peak current vs. sqrt (scan rate) for 2 mM cerium (0) suüate in 100 mM salhric acid solution

CV d t s show that has similar characteristics as C e 0 sulfate except
the diffmce in complexation with (so:] is higher for ce4+ as compami to ce3*, as
explained before. This alsu resuits in a higber peak current when employing Ce(SO&
d f h e , thus, provides even a better choice as a catdyst.
3.4.2. CS and Lignin Model Compoands in Suhr ie Acid Solution
Wtth VeratryI Alcohol:
As has been discussed in section 3.3, the oxidation of veratryl aicobol (ver-A) to
veraîraidehyde in sulfuric acid was found to take pIace at a p o t d a i IEpJ of t 190 mV,
and the oxidaiion peak was hund to be very large as compared to vanadium. This made it
difficuk to determine the effect of the cataîyst.
A similar problem was encountered while studying the cerium catdyst- Figure
3.22 (a) shows the voItarnmograms of 2 rnM CS, 5 m M ver-& and the two compounds
rnixed together in 50 mM sulfiiric acid at a scan rate of 50 mVIs. The voltammogram of
ver-A shows two large anodic peaks for ver-A = 1155 mV, = 1470 mV) as
compared to CS (EPO = 1260 mV), and the anodic peak current for the 6rst oxidation peak
(ipa-I) is appmximately 15 times that of CS anodic peak current. The first oxidation peak
represents a two-electron oxidation of veratryt aIcohoI to veratraldehyde (Vld) [19]. The
second peak possiily represents the subsequent two-eiecmn oxidation of veratraldehyde
to veratric acid. However, the peak rnight also be due to the reaction of the glassy carbon
in the presence of cerium, since giassy carbon has been recommended for use only up to
about 1200-1400 mV in the modic range [Sq. Nevertheles, the voltammogram shows
that the eIectrochemicai oxidation of ver-A is irrevecsl'ble and the oxidized species is
unstabIe and decays to a non-reducible compoimd.
When the two compounds, namely CS and ver-& are mixed together, the shape of
voltammogram remaius the same and rhe peak currents actuaily decrease. A possiiIe
reason for this decrease may be due to the oxidation of ver-A by at the start of the
reaction. This wilI reduce the concentration and, therefore, the peak cunent. The
vaIues of peak p o t d a i s are appmximately the same for the mixture and ver-A done. As

œ CS + Veratryl Alcobol
I
œ
Vanülyl Alcohol CS + Vanülyl Alcobol
Figure 3.22: Cyclic voltammqpms of (a) cerium(IV) sulfate (2mM), veratryl alcohol (SmM), and a mixture of two in 50 mM suifurie acid (scan rate of 50 mV/s); and (b) cerinm(n? sulfate (2mM), vrniüyi plcohoi (SmM), and a mixture of two in 200 mM sPlfiinc acid (scan rate of 20 mVls)

with the experiments with VS, ver-A was chosen in excess of cerium so that
concentration is not a iimiting factor in the oxidation of ver-A.
With Vanillyl Alcohol:
Figure 322 (b) shows the voltammograms of 2 mM VS, 5 m . van-& and the two
compounds mixed together in 200 mM sulfunc acid and a scan rate of 20 mVIs. A Iarge
amdic peak is observeci (E,,, = 793 mV) for van-A as compared to CS. The lower
oxidation potential of van-A indicates its easy oxidizabiiity as compared to ver-A. The
voltammogram for the mixture shows that the cunent increases at around 700 mV and
then plateau to a constant level. This indicates that oxidation products of van-A are not
stable and, as the potential is continuously increased, some of the oxidation products of
van-A that have high oxidation potentials start oxidizing at the electrode surface as higher
potentiais are reached, The nature of the oxidation products of van-A has already been
discussed in section 3.3.4.
3.43. CV Studies on Other Cerium Compounds
The potentiai of cerium is independent of pH in sulfunc acid solution and, therefore,
cannot be lowered by changing the pK. Arnong the three commonly used electroIyte
solutions, narnely K2S04, HN03,and HCIO4 solutions, the fomal potential (E"j of the
Ce(lV)/Ce(iU) system has the lowest value in H2S04 solutions [82]. Since the potentiai of
Ce cannot be lowered any further, ver-A and van-A could not be used, using CV, to study
the effectiveness of CS in cataiyzing the oxidation of iignin mode1 compounds.
CV studies with other C e 0 compounds, such as cerium(m) chloride produced
simfiar results as with CS. Figure 3.23 shows the voltammogram of 5 mM C e 0
chioride in 50 mM sulfiinc acid at a scan rate of 5 mV/s. As a cornparison, the figure aIso
shows the voltammogram of 2 mM CS m 50 mM suUÙric acid at a scan rate of 50 mVIs.
The voltammogram shows an anodic peak at 1260 mV, which is qua1 to the l+, value of
sutfate and is close to the value of CS. This is consistent with the earlier
d i s obtained for Ce(m) sulfate. Howwer, a major différence is the lack of a distinct
cathodic peak in the voltammogram of C e 0 chloride. This might be due to the fact that
upon oxidation ce3' gets conveaed to ce4+ which then complexes strongiy with the

Potential (mV)
Figure 3.23: Cyciic voltammograms in 50 m M sulîuric acid of cerium (IV) sulfate (2mW scan rate of 50 mVls and cerium (III) cbloride (SmM), scan rate of 5 mV/s
- 5 mM Sulfate + 100 rnM Na2S04
i.
Figure 324: Cyciic vol- (scan rate of 20 mV/s) in 100 mM sullaric acid of c e r i a m 0 suifate (SmM) and a mixture of ceririm(TLI) d a t e (SmM) and sodium sulfite (100 m w

sulfate ions ( h m elecûulyte). In spite of the slow scan rate, the modic peak current for
C e 0 chioride is higher than tbt of CS, which is again otiributable to the diffm-ce in
the degree of complexation with the d a î e ions (sot') for ce4+ and ce3+.
The effect of suifite ion concentration was studied by adding sodium sulfate to
the electrolyte solution. Figure 3.24 shows the voLtamrnogram of a mixture of 5 mM
C e 0 d a t e and 100 m M sodium d e in 100 mM suiîüric acid at a scan rate of 20
mV1s. As a cornparison, the figure also shows the voltammogram of 2 mM C e 0 sulfate
under same conditions. The effect of adding sodium sulfate was that (i) the peak c m t s
decreased, and (ii) the formal potential shified to l e s positive values, but only slightly, In
the present case, the shift in the anodic peak potential is observed to be 60 mV. The
addition of sodium sulfate, thus, offered a usefiil way of decreasing the reduction
potential of CS to lower potential values. Further addition of sodium sulfate to the
electrolytic solution, however, d t e d in unexpected cyclic voltammograms where the
peaks are widely separated and the above mentioned effects could not be observed.
The effect of addition of sodium sulfate has been studied previously [8 11, and the
present results are consistent witû prwious resuits. Observai effects have been attributed
to the stronger interaction of sulfate ion with C e 0 than Ce(m). However, the range of
sulfate ion that c m be studied is very timited [81].
in summary, the voltammograms of sulfate and C e o compounéc, SE& as
C e 0 sulfate and C e 0 chloride show hi& peak potentiak and, except for Ce(m)
chioride, good reversibiIity, which makes CS a good catalyst for oxygen delignification.
However, the oxidation of lignin mode1 compounds by Ce(TV) sulfate could not be
studied using CV. The difference in complexation abilities of ceJC and ce3' ions, as
shown in Figure 3.19 (b) makes c e r i u m o sulfate a better choice as catalyst.

35. CV RESULTS WlTH MOLYBDENUMO ACETYLACETONATE
For CV experiments with rnolybdenum(V1) acetylacetonate (MA), a 50 ml gIass vial was
used as an electrochemical ceU, with a glassy carbon working electrode, platinum wire as
an auxiliary electrode, and AdAgCl reference electrode. The experiments were canied
out at room temperature. Experiments with MA were camed out in the dimethyl
fonnam.de @MF) solution since MA is insoIuble in aqueous solution. The supporthg
electrolyte was 0.1 M tetraethylammonium tetrafluoroborate (TEATFB). Prior to the
experiment, nitrogen gas was purged through the electrolyte solution to remove dissolved
oxygen, because the potential of molybdenum lies in the cathodic range, where the
reduction of dissolved may interfere. The solution was blanketed with nitrogen during
the course of the experiments.
3.5.1. MA in DMF solution
Figure 3.25 shows the cyclic voltammogram of 1 mM MA in DMF solution containhg
0.1 M TEATFB, at a scan rate of 20 mV/s. The voltammogram shows a cathodic peak
&,) at -751 mV with no discernable anodic peak &,). Based on titerature [94], it was
concluded that the peak represents an irreversible one-electron reduction of Mao, in
the fonn of MOOP, to Mo(V).
The difference between the cathodic reduction potential value obtained h m the
present remlts (E,,, = -751 mV) and that obtained fiom Pournaghi-Azar and NahaIparvar
[92] (Eps z -500 mV) may be attributed to the use of different solvents. Rao et ai. [II21
found the E,,, values to shifi to positive potentiais when acetone was replaced by DMF
during the CV experiments with bidentate schiff-base molybdenum complexes.
Figure 3.25 also shows the background voltarnmogram, Le.. the voltamrnogam of
0.1 M TEATFB in DMF solution, indicating thai the reduction peak is primariiy due to
molybdenum only with a very small contribution h m the TEATFB cathodic peak.
The plot of i,, v s . 6 , shom in Figure 3.26, for 2 mM MA h the range of 10 to
100 mVIs is hear but with the scatteting of data points dong the lke, which might be
due to experimental enor. The linear plot indicates that the reduction of M o 0 is
diffusion-controlled. The irreversÏbIe redox behaviour, however, mdicates that MA is not
a good cataIyst.

'O r Electrolyte Solution
-- -1 S00 -1000 -500 O
Potential (mV)
Figure 3.25: Cyclic voltammogram (scan rate of 20 mV/s) of 1 m M acetylacetonate and the electrolyte solution in DMF solution (supporting electrolyte, 0.1 M TEATFB)
Figure 3.26: Cathodic peak current vs. sqrt (scan rate) for 1 mM ocetylacttonate in DMF solution (supporthg electrolyte, 0.1 M TEATFB)

33.2. MA in a 10:90 (vlv) DMF-water mixture
Since pulp bleaching is conducted in aqueous solution, it was decided to perfom CV
studies of MA in DMF-water mixture as DMF is miscible with water. The ratio of DMF
to water was chosen as lO:90 by volume. Figure 3.27 shows the cyclic voltammogram of
1 mM MA in the DMF-water mixture containuig 0.1 M TEATFB, at a scan rate of 50
mV/s. The resulting voltammogram had similar characteristics as that in pure DMF
solution - an irreversible one-electron reduction of M o 0 to M o 0 with G,, = -742
mV. However, the reduction peak cunent (i',,) in the mixed solution was diminished
(even at a faster scan rate) as comparai to the one in pure DMF solution.
While carrying out the CV of MA, it was observed that if the number of cycles
(or scans) is increased, the peak cment increases and a distortion in the shape of the
voltammogram is seen. This is probably due to the observed deposition of the
molybdenum on surface of the electrode which interferes with the redox reaction of
molybdenum.
Potential (mW
Figure 323: Cyciic voltrmmogram (scm rate of 50 mV1s) of 1 m M M o 0 acetylacetonate m DMF-water solution (10:90 rnirtPre (vh); supporthg electrolyte, 0.1 M TEATFB)

3.5.3. MA and Lignin Mode1 Compouads in 10:90 (vlv) DMF-Water Mixîure
Since the redox behaviour of MA was acceptable in the DMF-water soIution, it was
decided to study the effect of MA on the iigni. mode1 compounds in DMF-water
solution.
With Veratryl Alcohol:
Figure 3.28 (a) shows the voltammograms of 1 mM MA, 10 mM ver-& and the two
compounds mixed together in DMF-water solution at a scan rate of 50 mV/s. As cm be
seen h m the voltammogram, the peak cment for the mixture of MA and ver-A is only
slightly more than that of MA alone.
With MA, the oxidaticn of ver-& which has a very high oxidation potential, cazi
take place only through the oxygen-transfer mechanism as described in section 1.6.3.
Figure 328 (a) suggests that MA is not a good catalyst for the oxidation of ver-A.
With Vanillyl Alcohol:
Similar results were obtained with vanillyl alcohol. Figure 3.28 (b) shows the
voItamrnograms of 1 mM MA, 10 mM van-& and the two compounds mixed together in
DMF-water solution at a scan rate of 50 mV/s, The voltammograms of MA and the
mixture of MA and van-A partially overlap each other, suggesting inabiiity of MA to
catalyze the oxidation of van-A.
In stimmary, CV results with MA show an irreversible one-electron reduction of M o 0
in the fonn of MO@, to Mo(V), which has been fomd to be diffusion-controtied. The
irreversiiility suggests the UllSWtabitity of MA as a catalyst for oxygen deIigiilfication.
The behaviour of MA was fond to be similar in 100% DMF and 10:90 DMF-water
mixture (by volume). The CV resuiîs with iignin mode1 compounds show ody slight
increase in peak current, which c o w the non-suitability of MA as a cataiyst for
oxygen delignincation process.

Veratryl Aicohol
MA + Veratryl AIcohol
Potenti al (mV)
Figure 3.28: Cycüc voitammograms (scan rate of 50 mVls) in 10:90 (vlv) DMF- water mixture; supporthg elecîmlyâe, 0.1 M TEATFB) of (a) M o 0 acetylacetonate (1 mM), veratryl aicohd (10 mM), and a mixture of two; and (b) MoCYI) acetylacetonate (1 mM), vamiüyï aicohol (IO mM), and a mixture of two

3.6. SIMULATION OF BLEACHING REACTIONS USING LIGNIN MODEL
COMPOUNDS
Table 3.4 the experiments that were carrieci out in a stirred, pressurized 210 mI glas
bomb reactor to simulate the oxygen bleaching reactions. The reactions were c k e d out
in acidic solutions (pH 2-3), since the earlier bleaching reactions were c d e d out in the
acidic medium. The amount of cataIyst (2 mM) and iignin mode1 compounds (5 m M each
of veraûyl and vanillyl alcohol) added were the same as in CV experiments. The pressure
in the reactor was kept low at approximately 15 psig. The reaction products were
analyzed using gas chromatography (GC) and gas chrornatography m a s spectroscDpy
(GCMS). Cerium sulfate (CS) and vanadium sulfate hydrate (VS) were the two catalysts
studied ushg this technique.
Table 3.4: Emeriments camed out in the mini-reactor
Exoeriment # 1: 125 mi of aqueous solution of sulfuric acid (pH 2-3); 75-8VC, 15-18 psig a, 60 minutes reaction time
Exneriment # 2: # 1 + 2mM catalyst (CS or VS)
Ex~eriment # 3: # 1 + 5mM veraûyl alcohol
ExDeriment # 4: # 3 + 2mM caialyst (CS or VS)
ExDeriment # 5: # 1 + 5mM vanillyl alcohol
Exueriment # 6: # 5 + 2mM catalyst (CS or VS)
3.6.1. GC Results - Controls
The chromatogram of the reaction products h m solution alone (Experiment # 1) showed
only one peak representing solvent (ether). This is expected since the starting soIution did

not contain any organic compounds. Similar d t s were obtained h m the GC anaiysis
of Experiment # 2 in which the catalyst was added to the solution. Again, the
chromatagram showed a singie peak repmenting the solvent, as there was no other
organic compound.
3.63. GC Results - Veratryl Alcoboi and Cataiysts
The GC analysis of the exîmcted products obtained h m the oxidation of veratxyl alcohol
(ver-A) (Experiment # 3) showed a large peak for soIvent, a large peak for ver-A, and
two small peaks, one of which is vertaraldehyde (Vld). The identity of the peaks was
confhmed by carrying out GC of individuai compounds, nameiy ver-A and Vld, and then
comparing it with the retention times of the peaks h m the sample. The conversion ratio,
as measured by the ratio of peak area percent of the product (Viâ, for exarnpIe) to that of
the reactant (ver-A), was < 1% for Vld, and 2.85% (average value) for the other
unidentifieci compound WC-1). This shows that ver-A does not get oxidized by itçelf
under the given conditions. The appearance of the compound UC-1 after a Iong tirne
(retention b e = 14.4 min. in the present case) as compared to ver-A (4.2 min) and Vld
(3.9 min) indicates that the UC-1 is either a dimer or a pdymer with a larger molecdar
weight than ver-A. The Md peak occurred just before the ver-A peak.
Efh Vanadium Sulfate Hyhate (YS) - Expmmment # 4:
The GC analysis of the extractecl products obtained h m ihe reaction of VS and ver-A
showed sMilar results as with ver-A alone, i.e., a Iarge peak for ver-& a srnail peak for
Vid, and the other smaii peak for UC-1, the unidentifiable compound, besides the large
soIvent peak. The conversion ratio was < 1% for Vid, and 2.8 % for UC-1. The resuits
show that îhe addition of VS to the solution containing ver-A does not enhance the
oxidation of ver-A. The resuits obtained h m GC are consistent with the earlier d t s
obtained h m cyclic voItammetry (CV) that VS is not effective m cataiyzing the
oxidation of ver-A.

With Cerim Suyate (CS) - Erprhent # 4:
The d i s h m GC d y s i s of the extracted products obtained h m the teaction of CS
and ver-A were, however, quite different. The chromatugram showed a large increase in
the peak representing Vld, with the conversion ratio being about 28.1 %. The peak for the
unidentifid compound, UC-1 was still smalI, with the conversion ratio remaining aimost
the same at 2.2%. The resuiîs, however, clearly show that the addition of CS substantidy
enhances the oxidation of ver-A to Vld. This was Iater confumeci by carrying out the
GCMS andysis of the extracted reaction products; the m a s spectrometer cleady
identified the product veratraldehyde (or 3,4dimethoxy benzaidehyde).
CS is a known to be a very good oxidant and our CV resuits with CS (refer
section 3.4.1) clearly show that. However, the effectiveness of CS in catdyzing the
oxidation of ver-A could not be studied because the potentid of CS fies above 1Oûû mV
and vw-A shows large peaks in that potentiai range (refer section 3.4.2). The GC
anaiysis, which does not suffer h m such constraints, conclusively proves that CS is a
good catalyst for the oxidation of ver-A.
3.6.3. GC Resalts - Vanülyl Alcobol aad Cataiysts
The GC analysis of the extracted products obtained h m the oxidation of vanillyl alcohoi
(van-A) done (Experiment # 5) showed a Iarge peak for solvent, a large peak for van-&
and h e other prominent peaks repfe~enting the îhee oxidation products of van-A. The
peaks did not represent vanillin or vaniiiic acid, which are the corresponding aldehyde
and acid of van-A respectiveIy. This was c o d h e d by carrying out GC of individual
compounds, namely vanillin and vanillic acid. As with UC-1, the retention times of these
peaks were greater than van-A This again indicates that peaks that represent the
oxidation products of vaa-A could be monorneric, dimeric, or even polymeric
compounds, having large rnolecuiar weights as compared to van-& Since these three
pmducts couid not be identifie& we name them as UC-2, UC-3, and UC-4 respectively,
in order of mcteasing retention time. The conversion ratios for UC-2, UC-3, and UC-4
were 5.6%, 1.796, and 8.5% respectiveIy.
Van-A is easily oxidizabfe as compared to ver-& and the possi'ble oxidation
products of van-A have been discussed in section 3.3.4. However, the small conversion

ratio of each of these products indicates otherwise. This discrepancy is possibly due to
the low solubility of van-A in aqueous sulfinic acid. This impiies that van-A available for
oxidation was l e s than what was added. The conversion ratios obtained from GC
analysis, therefore, do not reflect the true vaiues and are an underestimate.
With Catalysts (VS and CS) - Experiment # 6:
The GC analysis of the extrncted products obtained h m the reacîion of VS and van-A
showed a small increase in the conversion ratios for UC-2 and UC-4. However, due to the
low soiubility of van-A in the aqueous soIution, the ûue values for conversion ratio
should be much higher, since CV results (refer section 3.3.4) have previously shown that
VS substantialiy erîhances the oxidation of van-A.
CS should be able to substantiaily enhance the oxidiation of van-& since van-A is
easily oxidizable as compared to ver-A. However, the GC anaiysis of the exüacted
products obtained h m the reaction of CS and van-A showed a diminished peak for UC-
2. This could rnean that the oxidation of van-A with CS results in high molecular weight
polymric compounds that are not identifiai by GC. The fact that CS is a strong oxidant
as compared to VS, which CV studies and the GC results with ver-A, VS, and CS have
already shown, supports the hypothesis.
Therefore, GC anaiysis of van-A and catalysts is not a true measure of predicting
the effectiveness of the catalysts in enhancing the oxidation of van-A.

4. CONCLUSIONS
Preliminary experiments on vanadyl sulfate hydrate (VS), c e r i c o d a t e (CS), and
molybdenyl acetylacetonate (MA) showed them to be effective in oxygen delignification
of kraft puip with good selectivity. Bleaching experiments on a d-produceci hardwood
k d l puip under acidic conditions showed that, under acidic conditions, cataiytic oxygen
delignification is superior in reducing kappa number compared to an allraline oxygen
delignification stage. However, it was found that the improved delignification efficiency
with acidic oxygen delignification was not due to iignin removal but mainIy due to the
removal of hexeneuronic acid groups
Three electrodes - mercury, platinum, and glassy carbon, were tested for their
usage as the working electrode in cyclic voltammtery (CV) experiments. Glassy carbon
electrode was found to be the most suitable working electrode, which also gave the most
reproducible results.
CV results with VS showed that the oxidation of vanadium involves one-electron
tram fer h m of vN (~023 to vV (voL?. A high peak potentiai was observeci h m the
voltammogram of VS. However, the lack of reversibiiity indicated that it is not an
efficient catalyst for oxygen bleaching. On the other han& CV results with VS and tignin
mode1 compounds showed that VS effectively catalyzed the oxidation of vanillyl dcohol
(van-A) as the VS peak current was found to increase three-fold upon addition of vmA.
The voltammogram of CS in sulfunc acid showed high reduction potentiai and
reversible electrochemical behaviour for the ceJC/Ce3+ redox couple. This makes CS a
good catalyst for oxygen delignification. However, the oxidation of lignin model
compoimds by C e 0 sulfate could not be studied using CV, since the lignin model
compoimds possess high peak currents that lie in the same potentiai range as that of the
oxidation peak c m n t of CS. CV resuits showed Ce(III) sulfate to behave simiIariy as
&(IV) suifate but with higher peak cuffents. This is attriiuted to a diffefence in
complexation abilitia of ce4+ and ceY ions with the sulfate anion and maka cerium(m)
&te a better choice as catalyst
CV d t s with MA show a diffiisioncontrolled, ineversïble one-electron
duction of Mo(W), in the form of MOG~', to Mo(V). The irrevmiüity suggestr the

unsuitability of MA as a catalysî for oxygen delignification. The behaviour of MA was
found to be similar in 100% DMF and 1 0 DMF-water mixture (by volume). CV
resuits with MA and lignin mode1 compounds showed only slight increase in peak current
of MA, which fiirther suggests the UIlSUitabiiity of MA as a cataiyst.
GC analysis of the reaction products between CS and veratryl alcohol (non-
phenoiic lignin mode1 compound), c d e d out in a mini-reactor, iiiustrated the
effectiveness of CS in cataiyzing the oxidation of veratryl alcohol. The results were later
confhmed by GC mass spectroscopy (GCMS), which ctearly identified the expected
oxidation product, namely, veratraledhyde, However, the true analysis of the reaction
products of vaniiiyl alcohol (van-A) could not be &ed out due to the low solubility of
van-A in aqueous sulfunc acid.

5. RECOMMENDATIONS FOR Fü'TüRE WORK
The following recommendations are offered:
Other analytical techniques, such as X-ray photoelectron spectroscopy (XPS} rnay be
used to ver* the results h m CV. The results rnay be used in combination with the
results obtained h m CV and bleaching experiments to provide a complete andysk.
The bulk electrolysis of the entire soIution containhg the catalysts and the iignin
model compoimds rnay be carried out to identiQ and analyze the oxidation products
of Iignin model compounds, and to study the effectiveness of the catalysts.
ûther iignin model compounds, some of them with higher molecuIar weights, rnay be
used to study the efficiency of these cataiysts. Commerciaily available lignin, such as
indulin, rnay also be used for CV experiments.
Since C e 0 sulfate was showed to be a better choice, its use for the oxygen
bleaching experiments is recommended.
Potential cataiysts and other transition metal complexes for oxygen bkaching rnay be
analyted using CV. This wiii help in providhg a better understanding of the structure
and behaviour of the cataiyst CV rnay aiso be used to verifjr results h m other
analytical techniques

6. REFERENCES
McDonough, TJ., Bleach plant operaiions short course notes, TAPPI PRESS, Atlmta, p. 4-1-1 (1990).
McDonough, T.J., "Oxygen delignification", in MD bleachinn: urinci~les and practice, Dence, C.W. and Reeve, D.W. (eds.), TAPPI Press, Atlanta, p. 215 (1 996).
O h , H. and Teder A., "The kinetics of oxygen bleaching", Tappi J., 62(12): 43 (1979).
Gierer, J., 4'Mezhanism of bleaching with oxygen-containing species", 4' Int Symp. Wood & Puiping Chem. (Paris) 4th, Oral Presentations, Vol. 1: 279, April 27-30, 1987.
Landucci, L.L. "Electrochemical behaviour of catalysts for phenoxyl radical generation", Tappi J., 62(4): 71 (1979).
Gierer, J., Reitberger, T., and Yang, E., "Formation and involvement of hydroxyl radicals in oxygen bleaching", 9' Intemationai Symposium on Wood and Mping Chemisüy, June 12,1997, Montreal, Oral Presentations R2-1 (1997).
Niku-Paavola, M-L. "Measurement of free radicals by cherniluminescence", ", 8th Int, Symp. Wood & Pulping Chem,, lune 6-9, 1995, Helsinki, Finland, Poster Presentations, Vol. 3: 127 (1995).
Negri, a., Jirnenez, G., Hill, RT., and Francis, RC., "Carorate delignification: the generation and role of hydroxyl radicals", Tappi J. 81(5): 241(1998).
Singh, S. and Hider, RC., "Caiorimetric detection of the hydroxyl radical: cornparison of the hydroxyl-radical-generaiing ability of various iron complexes", Anal. Biochem., 171 : 47 (1988).
Paice, M.G, Bourbonnais, R, Reid, ID., Archibald, F.S., and Jurasek, L., "Oxidative bleaching enzymes: A review", J. Pulp and Paper Sci., 21(8): 5280 (1995).
Bourbonnais, R, and Paice, M.G., Reid, m., and Archibdd, F.S., '%if€ pulp bleachmg by redox enzymes", 9th int. Symp. Wood & PuIpmg Chem., June 12, 1997, Montreai, Oral Presentatiom, PLI-1 (1997).
Hameel, KE., Jensen, W., Mozuch, MD., Landucci, U., Tien, M., and Pease, E A , 'Zigninolysis by a purifiai Iignin perondasen, J. Biol. Chem., 268: 12274 (1993).

Paice, M.G., Reid, LD., Bourbonnais, R, Archiiaid, F.S., and Jurasek, L., 'Manganese peroxidase, produced by Trametes YeriScolor during puIp bleaching, demethylates and deligniaes kraft pulp", Appl. Eav. Microbiol., 59: 260 (1993).
"Xu, F., Shin, W., Brown, SH., Wahieithner, I.A., Sundaram, M., and SoIomon, E.L, "A study of seriw of recombinant h g a l laccases and bilirubin oxidase that exhiiit significant ciifferences in d o x patentid, &strate specificity, and stability", Biochim. Biophys. Acta, 1292: 303 (1996).
Higuchi, T., ''Mechanisms of lignin degradation by liguh paoxidase and laccase of white-rot îüngin, in 'Want ce11 wall polymers: bionenesis and biodemdation" (eds. Lewis, N.G. and Paice, M.G.), ACS Symp. Ser. 399: 482 (1989).
Cd, H.P., "Further improvements of laccase-mediator syçtem (LMS) for eazymatic delignification (bleaching) and resuits h m large-scale triais", Proceedings of Non-Chlotine Bleacbing Coaference, Ameiia Island, FL, USA (199s).
Bourbonnais, R. and Paice, MC., " E ~ a t i c deiignification of kraft puip using laccase and a mediator", Tappi J., 79(6): 199 (1996).
Bourbonnais, R and Paice, M.G., "Demethylation and delignification of kraft pulp by Trametes versiculor laccase in the presence of 22'-azinobk(3- ethylbenzthiazolined-dphonate)", AppI. Microbiol Biotechnoi, 36: 823 (1 992).
Bourbonnais, R., Le&, D., and Paice, M.G., L'EIectrochemicai azzalysis of the interactions of laccase mediators with lignh mode1 campounds", Biochim. Biophys. Acta., 1379: 381 (1998).
Bourbonnais, R, Paice., M.G., Leech, D., and Rochefort, D., "Laccase/mediator bleaching of k d t pulps: identification of mediator active species and theif mIe in oxidation of residuaI lignin subunits", Proceedings of the 7" International Conference on BiotechnoIogy in the Pulp and Paper Industry, Jun 16-19, 1998, Part 1: AI03 (1998).
Call, HI., b'Pracess for mod@ing, breakhg down or bleaching lignin, materials containhg lignin or like substances", PCT Patent Application, WO 94/29510 (1994).
Poppius-Levi& K., Wang, W., Tarnminen, T., HortIing, B., V i , L., and Niku- Paavala, M-L, "Effects of laccase/HBT matment on puIp and l i g e structures", 9th ht Symp. Wood & Puiping Chem., June 12, 1997, Montreai, Otal Presentations, M-l(1997).

Sealey, J. and Ragauskas, A.J., "investigation of IaccadN-hydroxybeuzoûiazole deligdkation of k d l pulp", Journal of Wood Chemistry and Technology, 18(4): 403 (1998).
Niku PaavoIa, ML, Wang, W., Poppius-Levlin, K., Anke, H., and V i M , L., "ûxygm consumption in laccasemediator reactions", 9th ht. Symp. Wood & Pulping Chem., June 12,1997, Montreal, Poster Presentations, 80-1: 1 (1997).
Bourbonnais, Rochefort, D., R., Paice, M.G., Renaud, S., and Leech, D., "Transition metal complexes: A new class of laccase mediators for pulp bleaching*', Tappi J., 83(10): 68 (2000).
Bourbonnais, Rochefort, D., R, Paice, M.G., Renaud, S., and Leech, D., 'Development of stable redox complexes to mediate delignification of kraft puip by laccase**, in "Oxidative delianification chemistrv: fundamentals and catalvsis", D.S. Argympoulos (ed.), ACS Symposium Series no. 785, American Chernical Society, p. 391 (2001).
"Fuilerton T.J. and Ahex-n, SIP., "Salcomine as a cataiyst for oxygen delignification", Tappi J., 61(12): 37 (1978).
Meguro, S. and hamura, H., "Factors affecthg oxygen-alkali pulping X. Method of estimating the catalytic activity of cobalt complexes in delignification", Mokuzai Gokkashi, 35(3): 261 (1989).
Weinstock, IA. and Hill, C.I., ' ~ i d a t i v e bleaching of wood pulp by vanadium- substituted polyoxometallates", PCT Patent Application, WO 9405848 (1994).
Weinstock, LA., Atalla, RH., and Hill, CL, "Polyoxometallate delignification and bleacbing", PCT Patent Application, WO 95126438 (1995).
Weinstock, I.A., Ataila, RH., Hill, CL, Reiner, RS, and Houtman, CJ., "Hiay selective oxidative deiignification of kraft pulp by water soluble polyoxometallates", 8" Int Symp. Wood & Pulping Chem., June 6-9, 1995, Helsinki, Finland, Vol. 1, p. 369.
Evtuguin, D.V., Neto, C.P., De Jesus, JDJ., "Bleaching of kraft pulp by oxygen in the pmence of polyoxometallates", J. PuIp and Paper Sci., 24(4): 133 (1998).
Lee, Ç-L and Hunt, K-, "'Dhnethyldioxirane ("Activateci ûxjxen"), A selective bleaching agent for chernical pulps. Part IL Dimethyidioxirane (T) mçri as tire interstage treatment in an OTO sequence", J. Pulp and Paper Sci., 21(8): J263 (1995).

34. Oloman, C.W. and Gyenge, E.L., '?a situ electmchemicaiiy mediaîed oxygen delignificaiion of wood pulp with a manganese (m) aminopolycarboxylate complex", Tappi J., 80(1): 194 (1997).
HalI, J.A., Suckling, I.D., and Wright, J.L., "Evaluation of metai complexes as potential catalysts for oxygen delignitication", 50" Appita h u a i Generd Conference, Australia, Vol. 1 : 179 (1996).
Eckert, RC., "Delignification and bleaching process solution for lignocellulosic puIp with oxide in the presence of metal additives", Canadian Patent 1,129,161 (1982).
Tan, 2. and Solinas, M., "Vanadyl catalyzed oxygen treatment of liguoceiiulosic materials", PCT Patent Application, WO 98120199 (1998).
Hage, R, Iburg, JE., Kerschner, J., Koek, J.H., Lempers, E.L.M., Martens, EU., Racherla, US., Russell, S.W., Swarthoff, T., Vanvliet, MM., Warnaar, J.B., Vanderwolf, L., and Krijnen, B., "Efficient manganese cataiysts for Iow temperature bleaching", Nature 369: 637 (1994).
Cui, Y., Puthson, P., Chen, C.-L., Gratzl, J.S., Kirkman, A.G., and Patt, R, "Hydrogen peroxide bleaching of pine pulp catalyzed by a binuclear manganese complex", 10' kt. Symp. Wood & Pulping Chem., Yokohoma, Japan, June 7-10, 1999, Vol. 1, p. 26.
Collins, T.J., Fattalch, N.L., Vuocolo, LD., Hoxwitz, C.P., "New efficient selective TCF wood pdp bleaching", 1998 Tappi Mping Conference, p. 129 1.
Suchy, M. and Argyropouious, D.S., "hproving alkdhe peroxide delignification using a vanadium activatof', 1998 Tappi Pulping Conference, p. 1277.
Kang, G., Ni, Y., and van Heiningen, A, ''Polyoxometallate delignification - study of lignin mode1 compouuds", 9th Int. Symp. Wood & Pulping Chem., June 12, 1997, Montreal, Poster Presentations, 45-1 (1997).
Pemg, Y.S., Oloman, C.W., and James, B K , "The eEect of metai complexes in the electrochemically mediated oxygen bleaching of wood pulp", Tappi J., 76(10): 139 (1993).
Heinze, J., "Cyclic voltammtery - "Electrochemicai spectroscopy", Angew. Chern. int- Ed. En& 23: 83 1 (1984)
Noel, M. and Vasu, Ki, "Cvclic voltammetrv and the fiontiers of electrochemistry", hpec t Publications Ltd (1990), p. 88

47. "Educator's reference guide for electnichemistj', Pine instrument Company, Grove City Pennsylvania, USA, Mand: LMPROFl (Feb. 2000), p. 9. @trp~/pineinstnunent.codechem/academia~guide.pdf)
Noel, M. and Vasu, KJ, "Cyclic voltammetw and the ibntiers of electrochemistrf, Aspect Publications Ltd. (1990), p. 82.
Gosser Jr., D K , "Cvclic voltammetrv. Simulation and Analmis of Reaction Mechanisms", VCH Publishers hc. (1993). p. 3 1.
Noel, M. and Vasu, K "Cvciic voltammetrv and the fiontiers of electrochemistrf, Aspect Publications Ltd. (1990), p. 73.
Maioy, J.T., "Factors afFécting the shape of cunent-poteutid curves", J. Chem. Educ., 60 (4): 285 (1983).
Noel, M. and Vasu, KI, "Cwiic voltamrneûv and the fiontiers of electrochemistrv", Aspect Publications Ltd. (1990), p. 75.
Ibid, p. 66.
"Educator's reference guide for electmchemisttf, Pine Instniment Company, Grove City Pennsylvania, USA, ManuaI: LMPROFI (Feb. 2000), p. 16.
Noel, M. and Vasu, KI, "Cvclic voltammeûv and the frontiers of electrochemistrf', Aspect Publications Ltd. (1990). p. 67.
Zittel, H.E. and Miller, FJ., 'A glassy-carbon electrode for voltammetry", And. Chem., 37 (2): 200 (1965).
Gosser Jr., D K , "Cvclic voltanunetrv. Simulation and Anaivsis of Reaction Mechanisms", VCH Publishers Inc. (1993), p- 34.
Noel, M. and Vasu, ICI, "Cvciic voltammetw and the ibntiers of electrochemiw, Aspect Publications Ltd. (1990), p. 69.
Harris, D.C., "Ouantitative chernical anaIvsis9', W. H. Freeman and Company, New York (1996), p. 38 1.
"Educator's reference guide for electrochemistry", Phe instrument Company, Grove City Pennsyhmia, USA, Manual: LMPROFl (Feb. 2000), p. 23.

62. Noel M. and Vasu, Ki, "Cvclic voitammetrv and the hntiers of electrochemistrv", Aspect Publications Ltd. (1990), p. 112.
63. Ibid., pp. 116-1 18.
64. Bard, M., (ed), 'bEnc~clopedia of electrachemisûy of elements. vol. Wl", Marcel Dekker hc., New York, 1976, p. 294.
65. Carpenter, LE., "The constitution of pentavalent vanadium ion in acidic solution", 1. Amer. Chem. Soc., 56: 1847 (1934).
66. Bard, A.J. (ed.), bbEncvclouedia of electrochemistrv of elements. vol. Vil", Marcel Dekker Inc. (1976), p. 305.
67. Harris, D.C., "Ouantitative chemical anaivsis", 4' d, WH. Freeman and Company, New York, 1996, Appendix H, p. AP32.
68. Banick W.M., Jr., Smith G.F., "The formal oxidaîion potentials of substituted 1: 10 - phenanthroline fmus complexes of low solubiiity", Talanta, 2: 348 (1 959).
69. Bard, A.J. (ed.), "Encvclo~edia of electrochernistrv of elements. vol. Wi", Marcel Dekker hc. (1976), p. 305,
70. Pourbaix, M., " Atlas of electrochemical eauilibria", National Association of Corrosion engineers, Houston (1974), Section 9.1, p. 234.
71. Bard, AJ. (ed.), b b h ~ ~ l ~ ~ e d i a of electrochemistrv of elements. vol. ViI", Marcel Dekker Inc. (1976), p. 347.
74. Skyilas-Kazacos, M., Menictas, C., and Kazacos, M., "Thermal stability of concentrateci V(V) electrolytes in the vanadium redox ceil", LElectrochem. Soc., 143(4): L86(1996).
75. Bard, M. (ed.), "Encvclouedia of electrochemistrv of elements. vol. VIT', Marcel Dekker Inc. (1976), p. 327.
76. Ibid, p.328.
77. Harrar, JE. and Rigdon, L.P., " Determination of vanadium by controlled-potential couiometry", 41: 1673 (1969).

78. Meites, L., Zuman, P., Rupp, ES., Fenner TL., and Namanan, A., ''m handbook series in i n o h c electmchemistw. vol- V I T , CRC Press Inc., Boca fiton, FI. (1988), pp. 118-156.
Randle., TH. and Kuhn, A.T., "Kinetics and mechanisin of cer im~/cer ium(I l I ) redox reaction ou a plathum electrode", J. Chern. Soc., Faraday Tram. I, 79: t 741 (1983).
Noel, M. and Vasu, Ki, "Cyciic voltammetry and the hntiers of electrochemistrv", Aspect Publications Ltd. (1990), p. 133.
Fletcher, D. and Vaides, E.M., "Studies of the &o/Ce(IV) couple in multiphase systm containing a phase transfer ragent-L Conditions for the extraction of
and electrode kinetics", Electrochim. Acta, 33(4): 499 (1988).
Maeda, Y., Sato, K., Ramaraj, R, Rao, T.N.., Tryk, DA., and Fujishima, A., 'The electrochemical response of highly boton-do@ conductive diamond eIecûudes to ce3+ ions in quaus solution", Electrcchirn. Acta, 44: 3441 (1999).
"Meites, L., Zuman P., Narayanan, A., Fenner, T.L., landik, and Shia, G.A., "'w handbook in inomanic electrochemistrv. volume i", CRC Press, Inc., Boca Raton, p. 236, Flonda (1978).
Kiekens, P., Steen, L., Donche, H., and Temmerman, E., "Kinetics of Ce(W) reduction at gotd, carbon and iridium electrodes", Electrochim. Acta, 26(7): 841 (1 98 1).
Wadsworth, E., Duke, FA., and Goetz, C.A., "'Present statu of cerium(IV)- cer iumo potentials", And. Chem., 29: 1924 (1957).
Noel, M. and Vasu, KJ, ''Cwiic voltammetry and the hntiers of elecûochemistry", Aspect Publications Ltd. (1990), p. 76.
Smith, G.F. and Getz, C.A., "Cerate oxidimetry: theoretid considerations and detennination of approximate electrode reference potentials", ind. Eng. Chem. Anal. Ed, Iû(4): 191 (1 938).
Nzikou, J.M.., Aucousseau, A., and Lapicque, F., "Electrochemicai investigations of the Ceo/Ce(zv) coupIe related to Ce(N)-assisted process for S&/NOX abatement", J. Appiied EIectcochemistry, 25: 967 (1995).
Topich, I. and Lyon, J.T., III, 'Synthesis and electrochemistry of ck- dioxornolybdenum(vr) compIexes with tridentate schiffbase Iigands containing O, N and S donor atoms", PoIyheâron, 3(1): 55 (1984).

Stiefel, E.I. in W i b n , G. (cd), ~0m~rehenSive coordination chemistrv", Vol. 3, Pergamon, New York, p. 1375 (1987).
Mohanty, RN., Chakravoaty, and Dash, KC., "Acceptor behaviour of a MO"O~(ONO) complex with imidazole ligands", Polyhedron, 10(1):33 (1991).
Poumaghi-Azar, M.H. and Nahalparvar, H., ''Extraction differentiai pulse polarographic determination of M o 0 in cereals", Electroanaiysis, 12(7): 527 (2000).
Rao, SN., Muashi, ICN,, Rao, N., Bhadbhade, MM., and Suresh, E., "Synthesis, specûai and X-ray structural characterization of [cis-Mo@(L)(solv)] (L = saiicylidene salicyloyl hydrazine) and its use as catalytic oxidant", Polyhedron, 18: 2491 (1999).
Chaudhury, M., "Chemistry of molybdenurn. Part 2. Complexes of molybdenum with 2-aminocyclopent-1-ene-l-carbodithiomte. Synthesis, characterization, and electrochemicai studies", J. Chem. Soc. Daiton Trans., 115 (1984).
Bhattacharjee, S. and Bhathcharyya, R, "Synthesis, characterization, electrochemistry and 0x0-üansfer kinetics of oxomolybdenum - (VI), - (V) and - (IV) complexes with ONS donors", J. Chem. Soc. Daiton Trans., 1357 (1992).
Moms, M.J., Coordination Chemistry Reviews, 172: 18 1 (1998).
Reeve, D.W., Earl, P.F., "Mixing gases, water, and pulp in bleaching", Tappi J., 69 (7): 84 (1986).
100. Citrate buffer prepared according io a method wcitten by Lillie, RD., "Histopathologic Technique," Blakiston, PhiIadelphia and Toronto, 1948, in Colowick, P.S. and Kaplan, N.O. (eds), 'Wethods in Ennmiolonv". Vol. 1, Academic uress Inc.. New York (1955).
101. Ahuja, V.. Tan, Z., Weishar, KM., and Reeve, D.W., "Oxygen delignification as afFécted by novel transition metai catalysts", Proceedings of the 2000 international Pulp Bleaching Conference, PAPTAC, Halifax, Nova Scotia, June 27-30, 2000, Poster Presentatioas, p. 37-
102. Vuorinin, T., Fagerstrom, P., Buchert, J., Tenkanen, M. and Teleman, A., "Selective hydrolysis of hexeneuronic acid groups and its application in ECF and TCF bleaching of kraft pulps", J. Puip Paper Sci. 25(5): 155 (1999).

103. Jiang, Z-H., van Lierop, B. and Berry, R, 'Wexeneuronic acid groups in pulping and bleaching chemistry", Tappi J. 83(1): 167 (2ûûO).
104. Noel, M. and Vasu, KJ, "Cvclic voltammetrv and the frontiers of electrochemistry", Aspect Publications Ltd. (1990), p. 391.
105. Pourbaix, M., "Adas of electrochemicai equiliiria", National Association of Corrosion enginers, Houston, Section 15.3, p. 421 (1 974).
106. Bard, A.J. and Faulkner, LA., ''Electrochemical methods, Fundameritals and auulications", 2nd edition, John Wiley & Sons, Inc., New York, p. 810 (2001).
107. Noel, M. and Vasu, Ki, "Cvclic voltammetrv and the hntiers of electrochemiw, Aspect Publications Ltd. (1990), p. 202.
108. Andrieux, C.P. and Savéant, J.-M., 'Womogeneous redox catalysis of electrochemical reactions. Electron transiers folIowed by a very fast chemical step", J. Electroanal. Chem., 205: 43 (1986).
109. Bard, A.J. and Lund, H. (eds.), "Encvclo~edia of electruchemistrv of the elements", Vol. XI, Marcel Dekker hc. (1978), p. 243.
111. Sundholrn, F. and Sundhoh, G., "Anodic oxidation as a tao1 for mechanistic studies. Guaiacol and 4-propyl-Guaiacol in apmtic media", Holzforschung, 36: 71 (1982).
112. Rao, N.S., laiswal, M.N., Mishra, DD., Maurya, RC., and Rao, N.N., "Synthesis and characterization of cisdioxomolybdnum~ schiff base complexes derived h m 1 -phenyl-3-methyl4benzoyl-5-pyraz01e~~, Polyhedron, 12(16): 2045 (1993).

APPENDLX O:
KAPPA NUMBER OF PüLP

STANDARD Q. 18 Rcwmmcnded hfctbod, Scptcmba. 1960
R w A& 1967 RniieQ May. 1984
KAPPA NUMBER OF PULP
'Ihe Kappa Number test is uscd for evaluauon of pulps with ngud to the degne of delignifïcation and blcacttabiuty.
The method can be appiied to puips produced in yields up to about 65 p u cent and giving Kappa Numben not hi@r than 100 on hardwood puips, and not h-r than 120 on softwood pulps (Note 1).
'Ilie Kappa Nimiber is îhc number of miüiiitns of 0.02 M potassium pemrPngPnate consumed by one gram of pulp corrected to an assumed 50% consumption using an empiricai cornction factor.
1. Bkder or an immersion-type apparatus as described in Tech. Sect., CPPA Standard (3.26 is suitable for disin- t egration.
2. Vuiibk speed Jtina, elcctric or magnetic.
3. Coosmt temperature w r t a bath, capable of main- taining a tempetatwe of 3 . 0 * 0.1'~.
3. Sdphurk Acid. H2S04, 2.0 M. Add cautiously, whilc stining, 112 m i of conc. HISOI to about 600 mL of water. Düutt to IO00 mL aftcr cooiiig.
4. Potrdilm ladide SoImion, KI, 1.0 M. Dissolve 166 g of potassium iodide in water and dilute to 1000 mL.
5. Sm& indiutor, pnpaccd in accordance with Tech. Sect.. CPPA Standard 1.9.
ObtPn a representotive sampie quivalent to apprax- imatciy IO g oven-dry puip. If the sunple is a pulp &et, t a it into smd picca of about 1 cm acroas. Siuh puIp s i d l be fiitmd, avaiding los of fines, then tom iato picca and air-dried ShiP.ts and knou fiom ummned pulps wtiich wouId normally be scrcencd befon bieachmg or other p-, shan be removed.
TEST SPECIMEN
Weigh to the nearest 1 mg that amount of pulp which will consume about 50 t 20 per cent, but not les than 30 per cent ana not more than 70 per cent, of the potassium permanganate during the test. Puips with Kappa numben in the range of 30 to 70 can be tested using one aram test specimem. Proportionaily larger or d e r test specirnens shaii be w d for other pulps.
Weigh a specimen for moisnue determination in ac- cordance with Tech. Sect, CPPA Standard G3.
Place the test specimen in the container of the d i i - tegration apparatus. Mcasuce 800 m i of water in a gradu- ated cylinder and add about 500 mL of it to the test spe- cimen. Dismtegrate the puip until f ~ e of fibn dots and bundies.
Tramfer the pulp suspension quantitatively to a 1500 mL or 1000 mL be&r. Rime the stirrer with all but 10 m i of the water from the cylinder and add it to the puip.
Place the beaker in a water bath maintoined at 25 * O.l°C md stir so that a vortex 2 to 3 cm deep is formai, but avoiding air from beiag drawn into the pulp sufpcn- sion.
Pipette 100.0 ml of 0.020 M potassium perman- ganate solution into a 250 mL bcaker and add Lûû ml of 2.0 M nilphunc acid. Add this mixture tapidly ta the puip nupension and bcgin timing simultnncouiy. Rime the 250 mL beakcr immediateiy with the nmoining 10 mL of water nom the cylinder and add to the pulp suspension.
Ten minutes + 10 s after the addition of the nagents, add tapidly 20 mL of 1.0 M potassium iodide soiution and stù for about 10 S. Titrate the pulp suspension with 0200 M sodium -. thïosuiphate solution to the starch end point. -------- - - -
Carry out a b l d determination using the s a m volume of wattr and reagents.
a) Calculate the volume (v) in mLof 0.020 M potassium permanganate codsumed by the test specimcn:
-d by the Testhg Mcthods Committce and Appmvcd by thc Phvacal and ChemïaI Standards Cornmittee. Technicd Section.

where a = volume of sodium thidphatc sdution w d in
titntion of the tut s p c p t ~ , ml. b = vo& of sodiG *osulphate solution ussd in
blank titration, mL M = exact mdrnty of the sodium thiosulphate sduàon.
b) Clloilote rhe Kappa Numbu (K) of thc puip: t
K =-x f. W
w h r t w = oven-dry weight of the rat speàmen, g f = fa~tar for correction to 50 pet cent of permanganate
connunption (se Table 1)
REWRT
Report the Kappa nurnbcr as the average of two deteminotions to the neasest 0.1.
The repeatability t r p d as a perccntagc of the
test level is close to 1% for pulps above 20 Kappa number. In the lower tmmngcs, the percent nputability gnduaüy incrraies to 5% as very low Kappa numben are rerched.
1. Eiigh-yidd pulps connuacr l#s pennrnganate for a @en peId and ügnïn content, and c m o t be evaiuated by tbir mehod- Another methad, Tech. Sect.,CPPA Stanàard G.32: Hypo Number of hip. :an be usd for e v h t i o n of the whole mg of pulps for dtügnifiution and blcach- a b W .
1. BERZINS, V. and TASMAN, JI., h4) Pape? W. Cm. 58. No. 10: 145-158 (1957); Tappi 40, No. 9: 691-704(1957).
T h Standad u eoentially the fame as ISO 302;
TABLE 1 CORRECRQN FACTORS T
p - pet cent of 0.020 M peminn&anrte conrumtd Since 100 mL of pmungPnate an urcd in the -at, p ir quivalent to the volume in m i consumed. is., p = v.

APPENDIX (II):
CUPRIETüYLENEDIAMINE VISCOSITY OF PULP

CUPRlETHYLENEDlAMlNE VISCOSITY OF PULP
This method describes a procedure for detenniaing the viscosity of a solution çontaining 0.5 W pulp âiisolved in 0.5 M cupriethylencdiaminc (CED). The viscosity determination is carricd out in a capillary viocorneter at 2S.0°C.
The solution viscosity of pu1p has gained acceptaricc as the most accessible and usefui technique for obtaining information about the polymoIecuIarity of the cellulose molccula in any padcuIar pulp. Poiymolccularity, which is also referrcd to as average degrse of polyrncrization or average molecular wcight, i s an essential spccification in the manufacture and mukaing of d i i l v i n g pulps, and is also widely uscd in audits on blcachcry optimization and papcr menph comlations.
For purporcs of technical specification this method is applicable to fuily-bleached and semi- bleached pulps, or in general to pulps having a Iignin content of las than about 0.5% (Note 1).
APPARATUS
Viscomcters, capiiiary pipette type, calibsatcd: Cannon-Ftnske Routine Viscorneters which meet the Ipccifications of ASTM D 446-74 art suitable, among othen. ASTM viscorneter sizc numbcn 200 and 300 are the most useful for puip solutions prcpucd accordiu to this methad. Pcdibratcd vhcometcrs with calibration cenificotes arc available from most laboratory supply houses, or uncalibratcd pipettes can be calibtated by the user with standard viscosity oils (sec Appcndix). At the complction of a test the viscorneter is made rcady for an cnsuing test by rinsing twicc with distirilleci watu and twicc with reagcnt arade acctone, and thcn dried by drawin~ air through it for 5 to 10 niin with gcnrIe suction.
Diuolvlq tube (Fig 1): giass, 2û r 2 mm ID by 12s i 5 mm, with fiattened bottom.
Siirring apparatus (Fig 1): consisting of a stirring motor operating at 400 I 25 rpm, and a copper airring rod which can conveniently be fashioncd from heavy gauge elcctrical wire of diameter 3.0 to 3.5 mm (Note 2).
Water bath capable of maintaining a temperame of 25.0 * O.I8C..It wiil be found convdtnt to quip this bath with a short-range, dbrated thmnomctcr which can be r a d dùectlyto O.I0C.
CupriahyIcnediamine solution. 1.00 i 0.02 M: thïs may be prcpared sr describeci in the literature (Ref 2.3 and 4). or purchased. Sealcd bottlcs arc storeci in a n f r igmor in the dark. Working qu~titiCS (a Uue or l e s ) are uansfcrred to a norage bottk which has b e n flushcd with nitrogen Bas. Opened bottlei of rcagent are flushed with niuogen and stored a1 reduccd ttmperaturc (3 to 8 O C ) .
Chpriethylcncdiamine solution, 0.167 M: rhis is prepand by the accurate dilution of one pan of the 1.00 M nigent to 8 final volume six-fold ùi#m(c.g. düutc 16.7 ml to 100 mL with dictilicd w e r ) . This solution is to bt prcpucd fresh each day - Niuogen gas: minimum purity 99.9% NI, as avoilabk from m a t suppliers of cornpresscd
CQPPER STIRRING ROD

SAMPLE AND TEST SPECIMEN
The sarnple shaü be airdry and reprcscntative of the entire lot of pulp being tcstcd. Do not CUL or mechanicaüy shrcd the pulp, nor dry it at tcmperntures highcr than 60°C.
II' the samplc is in the form of shcercd puip. split and tcar the shnt by band into picces about 1/2 cm across, avoiding cut edges. SIwh pulp are washed with dirtillcd wactr to rcmove witer-lolubles, and thickened on a Buchner funne1 wing a fast filter paper (e.g. a Whatman No 4) to rctain the fine fibre fraction. Form into a pad and air-dry. If dtsired, drying may be acceleratcd by dispiacing the water in the pad with acetonc or ethanol.
The rat spccimcn shail contain the equivaient of 0.1250 i 0.0005 g of ovendry pulp (Note 3). A separare test spccimen of about 5 g is rcquired for detmninrtion of moisturc content.
ïèst spccimens for moisture arc to bc conditioned and weighcd in au atmosphere controkd to within 12% relative humidity and *toc. The conditioning atmospherc dcscribed in Tech. Sect. C.P.P.A. Standard A4 (50 î 2% rh and 23 I 2°C) ïs convcnient if available.
Detmine the moistun content of the sample by drying a t m specimen of approximarely 5 g to consront wight at 105 * ZQC, as descri i in 'Rch. ScçL C.P.P.A. Standard G.3 "Moisture in Paper". Using this rcsult, wtigh out a tcst spccimen coataininp the cquivaient of 0.1250 i 0.0005 g of ovcn-dry pulp (Note 3).
Place the tcst specimm in a dissolving tube and add 15.00 mL of 0.167 M CED solution. Stir with the stirring apparatus for appmximately 10 min to ensun chat the fibres arc mmplctely dispcrxd. Then add 10.00 mL of 1.00 M CED and continue to stir at 400 * 25 rpm for an addicional 15 min (Note 4).
Select a viscorncter which will give an efflux time in the ranp 1W2W S. -fer r portion of the pulp solution into it by immening the capi1lu-y kg in the solution and applying gentle suction to the filIig lep unta the invertcd viscorneter has becn f i cd just to the second ctch mark (ir the etch mark which will be in the Iowa position whcn the viscorneter ù cestond to iu normal orientation); this can k bat accomplished by fiiling past the second uch mark, dirconnectinp the suction, and invenin8 the visconrctcr as the iiquid levtl falls back to the ach mark. Clunp or othemise nippon the viscorncter, in a venicai position, in the water bah ar 25.0 + O.l0C. Allow 2 or 3 min for temperature equilibration, thcn apply suction to the capillary leg to b r i q the liquid levci abow the first or uppcr etch mark.
Record the time, to 0.1 r, nquirtd for the maiucru to falt from the upper etch mark to the lowcr ctch mark. Rcpcai this p d u n twice, for a total of thm radings of cfFlux tirnc
Rcpliuu nidinpl dl àtba fonfirm the o r i w - nrding to witbin i O J % or ahibit 8 s n u l l but s t d y decrca~c in efflux the. In the former case, the rudi- arc to k averagca. howcver, the h t m a# iadicuci ihu viscosity dqmhtion (probably rtrributiblc m oniddan in the nroagiy dkrliae medium) u occurrinl, and hm the initial nrrdinf is to be as c o r n pending conftrmation on a second tert JpDcimcn h m the w p k (Rcf 6).
At the cornplaion of the m. cucfulIy decuit the nrnaining solution h m the dissolvirig tube uid aramint the tube Pot undholved fibres. If these ue prcscnc, discard rhe test result and reput the deraminuion using an atendcd $tirring timc in the 0.167 M CED.
Cl(culitc the wcority of the pulp roluuon:
1.052 = dtnsity Of 0.5% puip miution in 0.50 M CED at Bec, g/cmJ
C = viscorneter consunt (sec AppendiX) t = efflux rime, seconds
REPORT
Repon the CED W t y of the pdp, in miliipucrl.seconds, to one decimai place
Fbr my Iaw vkosity pulps (ir below about 10 m m ) npon the vkosity to two dccimrl p l m .
The rcpon is aiso to M u d e mention of any non- rundudconditioar,suchuaîendednfmiildmewhich may have been nquind to dfrsoln the m spedmcn. If the test specimen couid not be dIuoiHd cornplaeiy, the appropriate report of test ir "did not dissolve".
1. In the striaut rcnse viscosity tut procuiures arc applicable oaiy to the polyucchuidc fnction of the tat rpQmcn. This notwithswiding, the so- d e d "unblerched vircoaty t a D D an ururlly gin a rauit on pulps h a h g ügnin contents of up to 4%. because mon of these pulps u n be succcssfuiiy d i i lnd in CED soivent. Hamm, the simpIe Firct thu rn unbiached puIp cm k diuolvcd ia the CED sotvent daes not con- vilidity on the tcn nsuh- In suxunrry, viscosity test d u on pdps containhg more than 0.5%

1- on not ac~cproblc for purposes of technical speification.
Many unbluched and hi&-yield pulps can be successfully delignifiai with minimal effcct on viscosity by Tih. Sect. C.P.P.A. Useful Method GJOU "Chlorite Delignification of Cellulosic MatcriaIr''.
The "Copper Rod" technique dclcribed hm is the original procedure of Straus and Levy (Rcf 1) for h i v i n a test speçimens in the CED solvent. Many othcr shakers. stinen or rollen have k e n proposed. and most of thae arc acceptable for the purpose of this standard provided that the modified procedure can be shown to give mlts of accuracy quivalent to those obtained by the "Copper Rod" technique.
The Colwonh Stomacher Mode1 80 has been found by several workn to be panicularly w d suiteci for this test (Ref 6).
The tcst spacimen of 0.1250 g as specified herc is to k dissolveci in 2S.m mi, of 030 M CED ta yield a pulp solution of 0300% wcight/volume, If for any nason this test rpecimen is not of convenicnt size it is e n W y permùpibie to work with uiy other weight of pulp providcd that its quivalent oven- dry wcight is known. In such case the fina1 volume of 0.50 M CED solvent is caiculated as: rnL of 0.50 M CED = W x 200
w hem W = ovendry weight of test specimen, g m
Whcrc the recommended two-stage
mL of 0.167 M CED = W x 120 rnL of 1.00 M CED = W x 80
4. The two-stage dissolving proccdure ouilined hcre is k n m to be #plibk of dupcning and dissolving virnially ail grades of blcached and semi-blcachtd pulps. A sinde-stage procedure in which the test spccimca is immened dinctly in 0.50 M CED wilI f'rcqueatly producc g d u h k d nvfurs on portions of the test sp-en and camplete solution of the test specimen in the wlvent becornes impossible
Straus, EL. and Lmy, RM. Aiper Pude I. 114(3):31-34 (1942).
SCAN-C16:62, Pnpuation of Cupritthylenc- diamine (CED) Solution. SVCILP~ Arpcmrdn. 6S(22): 926-927 (lsa2).
TAPPI Standard T23O om-82.
Hardy, R.C. NBS Viscorneter Calibrating Liquids and Capiiluynibe Vùcametcrs. National Bureau of Standards Monograph 55, Wuhington, D.C., U.S.A. (1962).
Atkins, S.W. and Rivington, DE. 65th Annual Meeting, Rch. Sea. C.P% Pnprints Volume B: 79-86 (Jan 1979);
Callbmtion of Viwometen
Visoomcters a.re calibmted using standard oils giving solutions. Caicuiate the Vucomacr eoruwit C as cMux timcs betwctn about 2 and 5 min. Viscomercr follows: cdi'bmhg liquids obtainable from Cannon Iï~suumcnts V Ca,-PO. Box 16, Statc Chllege, PA 16804, U.SA, uc C - - rppIrcabIc as foilows: t x d
Viscornetu Sizc No OiI whcrc V = absolute vixosity of the standard oiî in miilipucal.scconds
200 Sb and S20 d + d d t y of the oa at 3.0 I O. lac, g/cm3 300 S20 and S60 t = cffiux tirne in seconds 350 SU) and S60 400 S60 and S2ûû Express the constant as an average abuûncd on
two oiIs to four significont figura. Sec Rcf 1 for Dctcrmine the effiux time of a'nandud oii at additionai information on nsc4maer calibtation.
2S.0°C a outlincd in Roccdurt, above, far puip
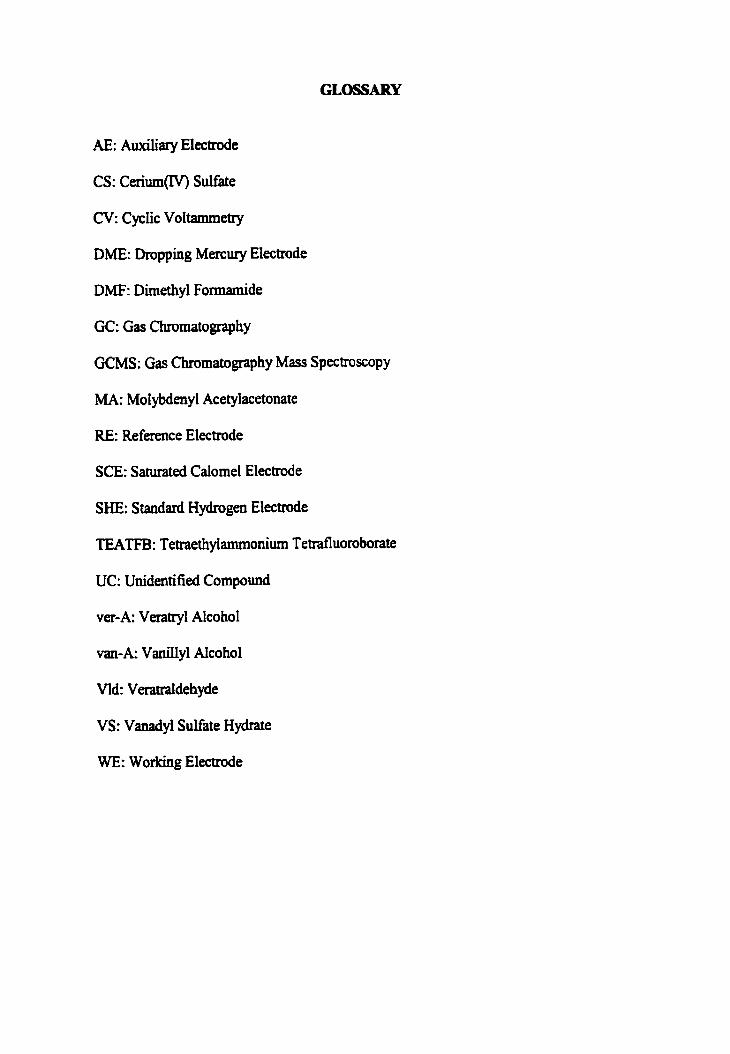
AE: Auxiliary Elect.de
CS: Cerium(W) Sulfate
CV: Cyclic Voltammetry
DME: Dropping Mercury Electrode
DMF: Dimethyl Formamide
GC: Gas Chtomatography
GCMS: Gas Cùrornatography Mas Spectroscopy
MA: Molybdenyl Acetylacetouate
RE: Reference Electrode
SCE: Saturated Calomel Electrode
SHE: Standard Hydrogen Electrode
TEATFB : Tetraethy1ammonium Tetrafiuoroborate
UC: Unidentified Compound
ver-A: Ventryl Aicohol
van-A: Vanillyl Aicohol
Vld: Veratraidehyde
VS: Vanadyl Sulfate Hydrate
WE: Working Electrode