Embed Size (px)
Citation preview

NBS
PUBLICATIONS
'^'^,]:L/NST OF STANDARDS 4 TECH R,
/NB<?n,A1 11 009898 14/NBS monograph ' ^
QC100.U556 V143;1975 C.1NBS.PUB.C1959
NBS MONOGRAPH 143
U.S. DEPARTMENT OF COMMERCE/ National Bureau of Standards
Analysis of Optically Excited
Mercury Molecules

NATIONAL BUREAU OF STANDARDS
The National Bureau of Standards' was established by an act of Congress March 3, 1901.
The Bureau's overall goal is to strengthen and advance the Nation's science and technology
and facilitate their effective application for public benefit. To this end, the Bureau conducts
research and provides: (1) a basis for the Nation's physical measurement system, (2) scientific
and technological services for industry and government, (3 ) a technical basis for equity in trade,
and (4) technical services to promote public safety. The Bureau consists of the Institute for
Basic Standards, the Institute for Materials Research, the Institute for Applied Technology,
the Institute for Computer Sciences and Technology, and the Office for Information Programs.
THE INSTITUTE FOR BASIC STANDARDS provides the central basis within the United
States of a complete and consistent system of physical measurement; coordinates that system
with measurement systems of other nations; and furnishes essential services leading to accurate
and uniform physical measurements throughout the Nation's scientific community, industry,
and commerce. The Institute consists of a Center for Radiation Research, an Office of Meas-
urement Services and the following divisions:
Applied Mathematics — Electricity — Mechanics — Heat — Optical Physics — Nuclear
Sciences' — Applied Radiation" — Quantum Electronics'' — Electromagnetics' — Timeand Frequency " — Laboratory Astrophysics " — Cryogenics
THE INSTITUTE FOR MATERIALS RESEARCH conducts materials research leading to
improved methods of measurement, standards, and data on the properties of well-characterized
materials needed by industry, commerce, educational institutions, and Government; provides
advisory and research services to other Government agencies; and develops, produces, and
distributes standard reference materials. The Institute consists of the Office of Standard
Reference Materials and the following divisions:
Analytical Chemistry — Polymers — Metallurgy — Inorganic Materials — Reactor
Radiation — Physical Chemistry.
THE INSTITUTE FOR APPLIED TECHNOLOGY provides technical services to promote
the use of available technology and to facilitate technological innovation in industry and
Government; cooperates with public and private organizations leading to the development of
technological standards (including mandatory safety standards), codes and methods of test;
and provides technical advice and services to Government agencies upon request. The Institute
consists of a Center for Building Technology and the following divisions and offices:
Engineering and Product Standards — Weights and Measures — Invention and Innova-
tion — Product Evaluation Technology — Electronic Technology — Technical Analysis
— Measurement Engineering — Structures, Materials, and Life Safety * — Building
Environment ' — Technical Evaluation and Application * — Fire Technology.
THE INSTITUTE FOR COMPUTER SCIENCES AND TECHNOLOGY conducts research
and provides technical services designed to aid Government agencies in improving cost effec-
tiveness in the conduct of their programs through the selection, acquisition, and effective
utilization of automatic data processing equipment; and serves as the principal focus within
the executive branch for the development of Federal standards for automatic data processing
equipment, techniques, and computer languages. The Institute consists of the following
divisions:
Computer Services — Systems and Software — Computer Systems Engineering — Informa-
tion Technology.
THE OFFICE FOR INFORMATION PROGRAMS promotes optimum dissemination and
accessibility of scientific information generated within NBS and other agencies of the Federal
Government; promotes the development of the National Standard Reference Data System and
a system of information analysis centers dealing with the broader aspects of the National
Measurement System; provides appropriate services to ensure that the NBS staff has optimumaccessibility to the scientific information of the world. The Office consists of the following
organizational units:
Office of Standard Reference Data — Office of Information Activities — Office of Technical
Publications — Library — Office of International Relations.
Headquarters and Laboratories at Gaithersburg,Washington, D.C. 20234.
^ Part of the Center for Radiation Research.> Located at Boulder, Colorado 80302.* Part of the Center for Building Technology.
Maryland, unless otherwise noted; mailing address

^fP 1 4 1975
1-^
Analysis of Optically Excited
Mercury Molecules
R. E. Drullinger, M. M. Hessel,
and E. W. Smith
Quantum Electronics Division
Institute for Basic Standards
l/l / S • National Bureau of Standards
Boulder, Colorado 80302
Supported by:
Los Alamos Scientific Laboratory under
AEC Order No. LS74-4 and the Advanced
Research Projects Agency under ARPAContract 981, Amendment No. 9.
U.S. DEPARTMENT OF COMMERCE, Frederick B. Dent, Secreiary
NATIONAL BUREAU OF STANDARDS, Richard W. Roberts, Director
Issued January 1975

Library of Congress Cataloging in Publication Data
Drullinger, R. E.
Analysis of Optically Excited Mercury Molecules.
(National Bureau of Standards Monograph; 143)Supt. of Docs. No.: C 13.44:1431. Laser Spectroscopy. 2. Mercury—Spectra. 3. Excited State
Chemistry. I. Hessel, Merrill M., 1933- joint author. 11. SmithEarl William, 1940- 111. Title. IV. Series: United States. Na-tional Bureau of Standards. Monograph; 143.QC100.U556 No. 143 [QD96.L3] 389'.08s t546'663'6| 74-31115
National Bureau of Standards Monograph 143
Nat. Bur. Stand. (U.S.), Monogr. 143, 51 pages (Jan. 1975)
CODEN: NBSMA6
U.S. GOVERNMENT PRINTING OFFICEWASHINGTON: 1975
For sale by the Superintendent of Documents, U.S. Government Printing Office, Washington, D.C. 20402
(Order by SD Catalog No. C13.44:143).
Price $1.10

CONTENTS
I. INTRODUCTION^
II. EXPERIMENTAL 3
A. Cell and Oven 3
B. Purity Problems and Cell Filling Procedures 4
C. Optical Pumping and Light Sources ^
D. Detection Systems y
III. STEADY STATE DATA g
A. Band Shapes g
B. Band Intensities g
C. Potential Curves
D. The Effective Transition Probability I5
IV. TIME DEPENDENCE
V. SUMMARY jg
VI. ACKNOWLEDGMENTS 19
VII. REFERENCES 20
LIST OF FIGURES
Figure 1.1 Potential curves of Bg^ molecules according to Mrozowski 23
Figure 2.1 Experimental setup 24
Figure 2.2 Mercury ampule preparation system 25
Figure 2.3 Mercury cell distillation system 26
Figure 2.4 Absorption coefficient and integrated band intensity
versus wavelength 2 7
Figure 2.5 Trasmission curve of tri-compartment filter 28
Figure 2.6 Transmission curve of 335 bandpass filter 2 9
Figure 2.7 Transmission curve of 485 bandpass filter 30
Figure 3.1 Spectral distribution of Ug^ fluorescence excited by
Xe Arc 31
Figure 3.2 Spectral distribution of Hg2 fluorescence excited by
257.2 nm laser line 32
Figure 3.3 Spectral distribution of 485 band at different temperatures .. 33
Figure 3.4 Spectral distribution of 335 band at different temperatures .. 34
Figure 3.5 Spectral distribution of 485 band at different vapor
densities 35
iii

Figure 3.6 Spectral distribution of 335 band at different vapor
densities 36
Figure 3.7 Ratio of 485/335 band intensities versus temperature ... 37
Figure 3.8 Ratio of 485/335 band intensities versus density 38
Figure 3.9 Normalized intensities versus temperature in the
485 band 3g
Figure 3.10 Potentials corresponding to the 485 band 40
Figure 3.11 Normalized intensities versus temperature in the
335 band 41
Figure 3.12 Ratio of 485/335 versus temperature 42
Figure 3.13 Potentials corresponding to the 335 band 43
Figure 4.1 Time history of the 485 fluorescence band. (a)lOysec/
division and (b) 2ysec/divlslon 44
Figure 4.2 Long time decay constant versus temperature and
density 45
Figure 4.3 Fluorescence spectrum at various temperatures for a
18 ~3fixed atomic density of 2 x 10 cm 46
iv

Analysis of Optically Excited Mercury Molecules
R. E. Drullinger, M. M. Hessel, and E. W. Smith
The molecule is representative of a class of molecules which have dissociative ground statesand bound excited states. It can therefore be used as a prototype of this class of molecules which areof interest as potential new laser candidates. Because of the non-bound ground state, standard absorp-tion spectroscopic techniques cannot be used to obtain the necessary information about the excitedstates. We have therefore developed new measurement techniques to obtain potential curves, f-values,and kinetic behavior for Hg2. These techniques are applicable to this whole class of dissociationmolecular systems.
Key words: Dissociation laser; excimers; excited state kinetics; f-values; mercury molecules; newspectroscopic techniques; optical excitation; potential curves.
I. INTRODUCTION
There is currently much interest in the development of high energy tunable lasers in the visible
and near UV. "Dissociation lasers" operating on electronic transitions in molecules having dissoci-
ative ground states give promise of achieving this goal. The molecules of interest as dissociation
laser candidates include pure metals such as Hg2, Zn^, Cd^-^ mixed metals such as HgZn; metal-noble
gas molecules such as HgXe, LiXe; and pure noble gas dimers. Research on this class of laser has
been impeded because most of the interesting systems include metals which are highly reactive at
the high pressures and temperatures of laser interest. Furthermore, the dissociative nature of the
electronic ground state severely inhibits conventional absorption spectroscopy hence, even for such
ubiquitous systems as Hg2, there exists very little basic data (eg. A values, potential energy
curves, energy transfer rates, etc.). At the present time, only pure rare gas systems have been
made to lase, and even these are poorly understood.
The mercury system is currently the most attractive of the metal vapors from the point of view
of developing the measurement techniques and gathering the basic data needed for understanding this
class of lasers. Some, albeit very little, information is available about molecular mercury from
research extending back more than 70 years. The mercury molecule, while somewhat reactive at high
temperatures, can still be studied in conventional glass or quartz cells and discharge excitation
is also relatively easy to obtain. Previous analyses of electronically excited mercury molecules can
be roughly divided into three categories according to the type of excitation employed:
(1) optical excitation via the atomic resonance line^''"'' (253.7)nm at mercury pressures less than 1
2 [2Jtorr (1 torr = 133 N/m ), (2) low pressure discharge excitation and, more recently, (3) high

[3]energy (Mev) electron beam excitation at pressures of several hundred torr or more . Each of these
techniques has provided useful information and each has its limitations. Discharge excitation can
produce a fairly high density of excimers (electronically excited molecules whose ground state is
dissociative) but the analysis of the states of interest is confused by the presence of charged
particles and highly excited molecular states which can act as metastable energy reservoirs or as
absorbers. Resonance line optical pumping avoids these difficulties (if the resonance lamp is
suitably filtered) , but this technique is restricted to mercury pressures well below the range of
laser interest because, at pressures of 1 torr or more, the exciting radiation is all absorbed in a
very thin sheath at the edge of the vapor and Interactions with the wall dominating the observations.
[4]In this paper, we report results obtained with a type of optical pumping which is applicable
from a few torr to several atmospheres. High power continuum lamps have been used to populate Hg^
excited states directly from the weak Van der Waals well and continuum region of the electronic
ground state. Figure 1.1 shows the postulated Hg^ potential curves''^^ and the location of the ab-
sorption band which we have used for our optical pumping (it must be emphasized that very little is
known about these curves and figure 1 may be shown to be incorrect by future research. This ab-
sorption band was studied extensively by Kuhn and Freudenberg and Lennuier ''^'^and has been shown
to extend from the resonance line at 253.7 to beyond 320 nm depending on the pressure and temper-
ature. The band is optically thick in the region of 253.7 nm but we have produced strong volume
excitation even at pressures of 10 atm. The details of this optical pumping technique and the
various experimental procedures are discussed in section 2.
In section 3, we present an analysis of steady state data from the 335 and 485 nm fluorescence
bands. This analysis indicates that the excited electronic states which emit these bands (and
3 1probably the entire manifold of states which arise from 6 + 6 S^) are in thermal equilibrium
among themselves (but not with the electronic ground state) . This analysis also gives a 6500 cm
activation energy for transitions from the 485 reservoir to the 335 reservoir.
In section 4, we present some preliminary time decay data which shows that the 485 and 335
bands decay with the common lifetime and this lifetime is a strong function of the temperature and
density of the mercury vapor.
2

II. EXPERIMENTAL
In this section, we describe the mercury containment cells, filling procedure, oven and temper-
ature controllers, light sources used to excite the molecular spectra, detection systems, spectro-
graphs, and calibration procedures. Purity of the cells and mercury used in these experiments is
of the utmost importance; some anomalous results that we obtained by filling the cells with labor-
atory grade triple-distilled mercury and ordinary vacuum techniques will be discussed along with
the mercury handling procedures we have now developed.
In all the experiments described in this monograph, we used a light source to excite mercury
vapor contained in a quartz cell. The pressure of the mercury was determined by a cold finger at-
tached to the cell and the temperature was controlled by heating the cell body. Figure 2.1 is a
typical schematic of our apparatus.
A. Cell and Oven
The cells were made from 2.5 cm dia. quartz tubing in the form of a cross. The four windows
were of UV grade quartz and fused onto the cell body. The optical path length between windows was
3.65 cm. The cell had a small tube extending from its body that acted as a reservoir for the mercur
and as a cold finger so that the mercury vapor pressure could be varied independently of cell temper
ature. Since the cell body was not made out of UV-grade quartz, it fluoresced strongly in a broad
band centered around 400 nm if any of the exciting radiation impinged on it. To help eliminate
this problem a mask of liquid gold was painted around the edge of each window to help prevent in-
cident radiation from directly entering the cell body and to mask the fluorescing edge of the cell
from the detection optics. Cells of this design could not be operated much above atmospheric pres-
19 -3sure (densities < 10 cm )
.
The cell was contained in a two compartment oven constructed of low density fire brick in which
the compartments were heated separately, each with a temperature regulating system. The upper part
of the oven where the cell proper was housed determined the mercury vapor temperature and was equip-
ped with four window ports to coincide with the four windows on the cell, each port was fitted with
a quartz window to prevent heat loss (see fig. 2.1). Inside this oven and surrounding the cell was
a thin-walled stainless steel cylinder with four window ports cut in it. This provided additional
heat and light baffling as well as providing a base on which the heater was wound.
The lower oven housed the mercury reservoir and had no windows, thus providing maximum temper-
ature stability and uniformity. Thermocouples were attached directly to the glass side arm at a poi
where it was full of liquid mercury. The side arm also had a thin layer of asbestos wrapped on it
* A thick organic solution containing gold which when painted on a surface, dried and heated to
> 600°C leaves a thin layer of gold bonded to the surface. The usual coating of "aquadag" will not
work as it burns off in air at temperatures above 500°C.

and was finally wrapped with several layers of heavy aluminum foil to insure temperature uniformity.
The heater for this part of the oven was a coil of nichrome wire wound just on the inside of the fire
brick.
Both oven compartments were heated by direct current through series regulators whereby the cur-
rent to the heater was controlled by the difference potential between the control thermocouple and a
reference voltage set to the desired temperature.
This system was of low heat capacity and temperature changes as large as 300° C could be ac-
complished within 15 minutes. However, tight regulation controlled the reservoir temperature to
o± 0.05 C for periods as long as several days resulting in mercury vapor density control to better
than 0.5%.
B. Purity Problems and Cell Filling Procedures
[7]In the older literature , it had been noted that air and other gases destroyed the fluorescence.
[8] [9]More recently Stupavsky, Drake, and Krause observed an anomalous Hg2 band that Vlkls and LeRoy
have subsequently suggested was due to an impurity of HgCl. In general, mercury is known ^^^'^ to com-
bine with many atomic and molecular species. For these reasons, it is necessary to take great care
to insure purity in preparing sample cells.
In our initial experiment, we filled the cells with laboratory grade triple-distilled mercury.
The cell was pumped down to a pressure of 10 ^ torr and baked to 300°C before the Hg was distilled
into it. We found that when the cells were heated to give a mercury pressure of 2-5 atm and exposed
to any of the blue argon ion laser lines, the characteristic A85 nm blue-green Hg^ fluorescence
band appeared. The first cell failed, however, when the pressure exceeded several atmospheres. With
a new cell and slightly improved vacuum techniques, we tried to reproduce and study this laser in-
duced fluorescence effect under carefully controlled conditions. The fluorescence was weaker and
lasted only a few hours after initial heating. With the improved vacuum techniques for preparing
mercury cells as described below, this laser induced fluorescence completely disappeared, indicating
that it is probably produced by an impurity in some laboratory grade mercury. Although time has not
allowed an investigation of this "sensitized fluorescence", we have used it as an indication of the
cleanliness in the various cells.
The cells used for the experiments described in this monograph were prepared in the following
Prior to the actual filling of a cell, laboratory grade, triple-distilled mercury is distilled
into ampules with the arrangement shown In figure 2.2. The ampule filling apparatus is attached
through a "U" tube trap to a bakeable vacuum station and the entire system is baked at 400 ° C for
-924 hours. On cooling, a vacuum of ~ 10 torr is attained. The system is then backfilled with
4

argon to 1 atm pressure and opened at point A. Laboratory grade mercury Is injected into point C
and the system closed at point B. The "U" tube trap is then cooled with liquid and the argon
is pumped out of the system. The pressure at this point with the Hg vapor trapped out, is—8
2 X 10 torr. Using a foam plastic cup fitted over the filling tube (B) and inverted "U"
tube (D) and filled with dry ice, a reflux column is set up; C B. A small fraction of the re-
fluxing Hg migrates over into the ampules. When an ampule is filled with approximately 5 gm of
mercury, it is tipped off and removed from this system. This procedure results in ampules of pure
mercury sealed under a vacuum of a few times lO"^ torr. To keep the pumping station clean, the
remaining system is again filled with argon and cut between the liquid nitrogen trap and the per-
manent part of the station. This removes all glass that has been exposed to mercury.
To fill a cell, the arrangement shown in figure 2.3 is constructed on the pumping station. It
consists simply of the cell to be filled, an ampule of mercury and a "U" tube for a trap. Since
the cell is to be operated at temperatures up to 900°C, it must be baked at least to this temper-
ature. For this purpose, a small oven made of a heater and fire brick Is placed around the cell
a]
of the vacuum station Is baked at AOO°C for 24-36 hours. After the bake-out, the system is cooled,
the small oven removed, the trap cooled in liquid nitrogen and the mercury ampule opened. At this
point and throughout the rest of the filling procedure, the pressure on the vacuum side of the trap
—8is less than 10 torr. Some of the mercury is then transferred, again by distillation, into the
cell. Mercury often bolls violently when distilled and mercury droplets entrained in the vapor could
be carried directly into the cell. To prevent this, we boll the mercury gently and make the glass
between the Hg ampule and the cell of sufficient length and slope (fig. 2.3) so that any entrained
mercury condenses on the walls and rolls back toward the ampule. During the tip-off operation, the
cell is heated to cause a large flux of mercury vapor to sweep out past the tip-off point and carry
with it out-gassed products of the tip-off operation.
With the cells prepared in this manner and with appropriate excitation, we have been able to
16 20 —3observe Hg2 fluorescence over a density range of 10 to 10 cm and vapor temperatures of 175 to
SOCPc. These signals are stable and show no change over 24 hours of operation. With these clean
vapors, we do not observe fluorescence induced by any of the Ar^ laser lines.
5

C. Optical Pumping and Light Sources
Lennuier^^"' and Kuhn and Freudenberg ^^"^ have shown that mercury vapor absorbs radiation in a
broad band from the 253.7 nm resonance line to beyond 320 nm. This type of optical pumping is a
"clean" technique, in which only the bands of interest (335 and A85 nm) are excited and fluorescence
is produced throughout the cell. Figure 2.4 shows Kuhn and Freudenberg ' s relative absorption co-
efficient a as a function of wavelength where I/l^ = . Also plotted on the same graph Is the
ratio R of integrated fluorescence intensity of the 335 band to the exciting wavelength intensity
[4]as a function of exciting wavelength at a pressure of 600 torr.
These results show that one can couple power into any depth of mercury vapor and at almost any
vapor density and thus obtain volume excitation. To make full use of this pumping scheme for
20 -3densities up to 10 cm , we have used several types of lamps to maximize the power in the wave-
16 ""3length region effective at the particular density region investigated. At low densities < 10 cm
16 18 —3a germicidal resonance lamp is most effective, for densities from 10 to 10 cm a medium pressure
18 —3(Osram type) mercury lamp most effectively excites the Hg^ bands. Above 10 cm high pressure
xenon and mercury-xenon compact arc lamps are used. We recently obtained a commercial ADP frequency
doubler which was used to double the 514.5 nm Argon ion laser line thus producing a 10 mW beam of
257.2. nm radiation. This light source produces a small volume, high density excitation.
For the rather preliminary time resolved studies which are presented in section IV, a coaxial
system consisting of a lOJ energy storage capacitor, a switching thyratron and a 2-4 mm air spark
gap was used. During the .5-1 psec discharge time of the circuit, the air spark radiated light
with a spectral distribution roughly corresponding to a 10,000 K blackbody.
Each of these light sources (except for the laser) was used in conjunction with an optical
system which collected, collimated, filtered and refocused the light into the cell. This system
consists of simple, single element f/1.5 quartz lenses and a tri-compar tmented cell which contained
the desired combination of filter solutions, see figure 2.1. The filter used throughout most of this
work is one of NiS0^-H20, CoS0^-H20 and pure Cl^ gas. This combination gives a high transmission
(T > 50%) at 270 nm; the transmission curve is given in figure 2.5.max o a
In addition to the light sources above, we have used the 337.1 nm output of a pulsed 1 MW
nitrogen laser to excite the mercury vapor. The 485 nm band fluorescence was observed through a
19 -3broad band 480 nm interference filter at densities in excess of 10 cm . A cw He-Cd laser (10
19 -3mW at 325 nm) also excites the Eg^ band fluorescence at densities > 10 cm . In both cases the
excitation was rather weak and neither technique was used beyond the initial trials.
6

D. Detection Systems
To detect the molecular mercury bands at 335 and 485 nm we have used both S(Q) blue response
and S-20 red response photomultipliers. To observe the molecular bands in the appropriate spectral
region we either used the photomultipliers with filters or a 1/3 meter scanning monochrometer , de-
pending on the type of experiment and light intensity. The transmission curves of the broadband
interference filters used to measure the 335 and 485 band, are shown in figures 2.6 and 2.7.
The spectrometer was calibrated for wavelength, instrument line profile, and (with each of the
photomultipliers) quantum efficiency. The spectrometer has a spectral line width of 0.07 nm (FWHM)
at a slit width of 10 ym and a line width of 0.3 nm at a slit width of 135 ym. The spectrometer
scattered light level beyond 1.5 band widths was found to be < 0.5% in both cases. We generally
used slit widths corresponding to an instrumental bandwidth of 0.3 - 1.0 nm. We used a spectral
irradiance tungsten iodine lamp to calibrate the photomultiplier and spectrometer combinations
for relative quantum efficiency. The lamp was essentially a blackbody source at a specific color
temperature for a fixed current input to the lamp. In our case, the calibration was made at two
color temperatures 3110 ± 15 K and 2785 ± 15 K. The independent calibrations agreed to within ± 1%
in the spectral region 300-700 nm.
7

III. STEADY STATE DATA
A. Band Shapes
The cw-optlcal pumping schemes described in the previous section have been used to excite mercury
vapor at pressures ranging from about one torr to several atmospheres and temperatures ranging from
175°C to 1000°C. The entire fluorescence spectrum has been scanned under moderate resolution (about
0.3 nm to 1.0 nm) from 230 nm to 700 nm using various spectrometers and photomultipliers. A typical
photoelectric trace is shown in figure 3.1. This trace was taken with a 1/3 meter spectrometer, with
a resolution of about 0.3 nm, using a photomultiplier with an S(Q) response curve. The total re-
sponse of the instrument was calibrated using a standard lamp, and the trace shown in figure 3.1
includes this correction factor. (The intensities reported in this paper are proportional to the
number of photons per wavelength interval.) Since the correction factor with the S(Q) phototube
becomes rather large for X > 550 nm, another trace was made using the same spectrometer with an
S-20 phototube. This particular curve shows fluorescence excited with the 150 W Xe continuum lamp
filtered to pass only 240 to 290 nm radiation (discussed in Section II). Since this is a very high
intensity source, the radiation scattered by the cell constitutes an appreciable signal which is seen
in figure 3.1 as a continuum between 240 and 290 nm. Measurements of this scattering, taken with the
cell at room temperature, enable us to subtract out its contribution but it doesn't interfere appre-
ciably with the 335 band in any case.
A similar curve, excited with the frequency doubled Argon ion laser, is shown in figure 3.2. In
this case, the doubled laser output was focused into a small volume thus creating a high excimer
13 3 3density (estimated at 10 /cm ) and some secondary pumping of the 7 S-j^ state of atomic mercury is
observed. This figure also shows scattering of the doubled laser line at 257.2 nm as well as a
small amount of the primary laser line at 514.5 nm which scattered into the cell. More recent
runs using unfocused 257.2 excitation show no atomic emission and with better filtering, the 514.5
scatter has been removed. Comparison of laser excited fluorescence data with lamp excited data
3shows no difference between the two (other than a weak excitation of the 7 obtained by focusing
the laser into a small volume)
.
It is interesting to note that the peak of the familiar 485 band occurs at 510 nm in figures 3.1
and 3.2. In our uncorrected traces the peak occurred at 485 but when the data are corrected for the
spectrometer response function, the true maximum appears at 510. The 335 band shape is essentially
unchanged when corrected for the spectrometer response function. Since the band shapes and the lo-
cation of the maximum intensity are rather important quantities in evaluating potential curves and
transition probabilities, the shift of the apparent maximum from 485 nm to 510 nm emphasizes the
need for well-calibrated detection systems.
8

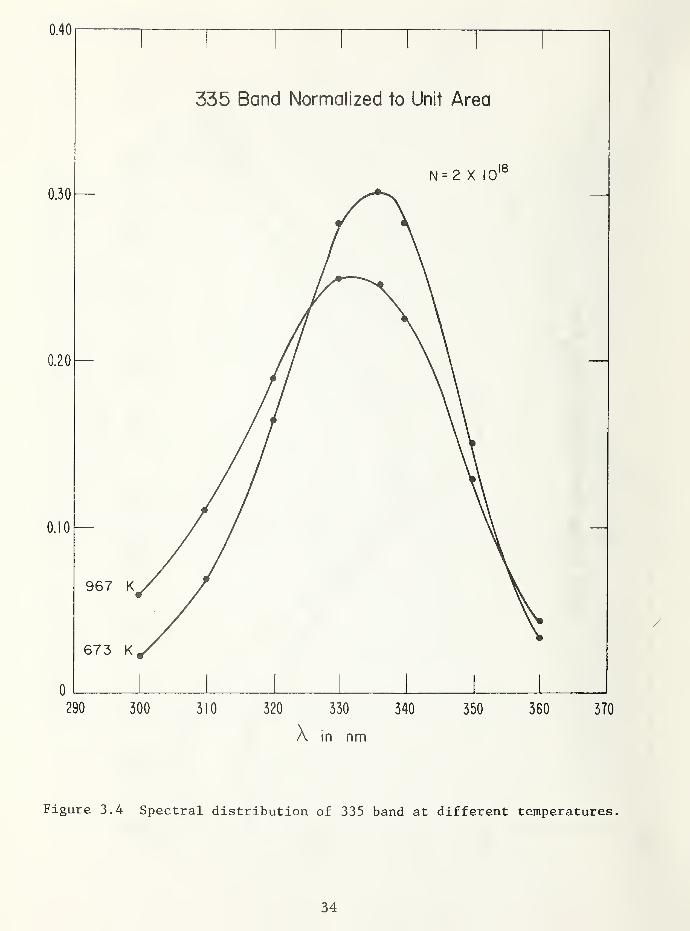
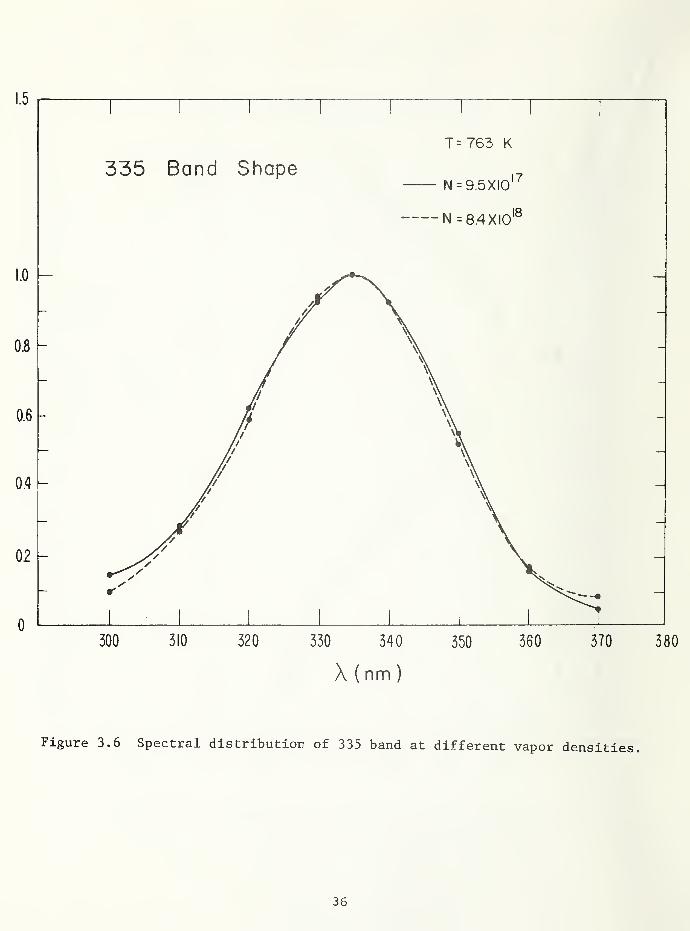
The shapes of the 335 and 485 bands as functions of density and temperature are shown in figures
3.3 - 3.6. The integrated band intensities are normalized to unity in order to show the shifts of
the populations within the respective bands. As temperature is increased, both bands show a de-
crease in peak intensity, an overall broadening of the band and a slight shift toward the blue. This
is what one would expect from a Boltzmann distribution of vibrational states; that is, an increase
in temperature reduces the population at the bottom of the well which radiates the intensity maximum,
and correspondingly increases the population of the higher vibration states which radiate in the
wings of the band. The shift to the blue will be discussed later in this section.
Figures 3.5 and 3.6 show that the band shapes are not affected by changes in density. This
is also what one would expect from a thermal distribution of vibrational states since the Boltz-
mann factor is independent of density. The absence of density dependence of the shape of the 485
band cannot be used to confirm or deny the mechanism of collision induced radiation which is often
proposed for this band.
B. Band Intensities
The intensities of the 485 and 335 bands were measured as functions of temperature and density.
Most of these measurements were made using filters in front of a photomultiplier rather than a spectre
meter in order to increase the signal and thereby extend the range of these measurements. A compar-
ison of the filter functions, figures 2.6 and 2.7, with the observed spectral distribution, figure
3.1, shows that the filters did nor Integrate the entire band. The filters do cover the center of
the bands hence the readings are proportional to the total band intensities and the intensity ratios
should be accurate. This assertion was checked by integrating spectrometer tracings, such as figure
3.1 in the temperature-density range where spectrometer measurements could be made; the intensity
ratios obtained with the filters agreed with those obtained from spectrometer tracings to better
than 1%. We certainly do not propose this figure as an estimate of the error in all of our data, but
it does nonetheless indicate excellent agreement between these two measurement techniques at least
as far as intensity ratios are concerned.
In figure 3.7, we have plotted the log of the intensity ratio R = I (485) /I (335) versus 1/kT
where kT is in cm Figure 3.7 shows only six representative curves but several sets of similar
data have been analyzed by computer. A linear least squares program was used to fit the data points
17 -3for N > 10 and T > 575 K (i.e. 1/kT < 2.5 x 10 ). The slopes in the linear portion of the data,
(solid lines) T >_ 573 K, give an activation energy of 6500 cm with a ± 2% scatter and this scatter
appears random; that is, there is no systematic trend in the calculated slope as a function of densit)
o 17This linearity shows that, for T ^ 575 K and N > 10 ^ the populations are related by
^335/\85

where e = 6500 cm to within ± 2%. The fact that there is no variation in this slope over nearly
two orders of magnitude in density provides a compelling argument that the two electronic states
(which radiate 485 and 335 respectively) are in thermal equilibrium.
17The N = 10 run was not analyzed by computer because there are not enough points at high
temperatures to be certain about where thermal equilibrium applies. A straight line was drawn throu
these data with a 6500 cm"-"- slope for comparison with the other data. The N = 5 x lO"""^ run clearly
shows that the two electronic states are not in equilibrium with one another at this density.
The deviation observed by decreasing the temperature at a constant density is not the only
means of achieving a deviation from equilibrium. Another technique is to lower the density for a
fixed temperature. This is illustrated in figure 3.8 where we plot the Intensity ratio R versus
density for several fixed temperatures lying both above and below the critical value of 575 K dis-
cussed above. In addition to our data, we have also plotted some low density data of Matland and
[12]McCoubrey which were obtained with the resonance line excitation discussed in Section I.
It should be noted that the latter were taken in the afterglow (after switching off their resonance
lamp) whereas our data are taken in steady state with a continuum lamp. Since the two electronic
states are not in thermal equilibrium for N < lO"*"^ , this may not be a valid comparison. None of
the data in this figure have been calibrated to account for the band width of the filters or the
relative sensitivity of the phototube in the blue 335 and green 485 regions. These corrections
would only multiply R by a constant, hence the slope of the curves is correct even though the ver -
tical position of the curves is arbitrary. That is, the fact that our data at 470 K joins smoothly
with the Matland-McCoubrey data at 473 K is fortuitous. Furthermore, the 519 K curve lies above
the 470°K only because it was arbitrarily displaced upward one order of magnitude to make the data
easier to read, the actual measurements lie between the 470 K and 623 K curves. The two asjraiptotes
2R °: N and R « N have been drawn in as dashed lines to aid in the interpretation of the data.
We first consider the region N > lO"*"^ on the 631 K and 623 K curves. The previous discussion
has shown that the states radiating 485 and 335 are in thermal equilibrium for this temperature-den-
sity range, yet figure 3.8 shows that the intensity ratio increases linearly with N over at least
two decades in N. Assuming that the 335 nm radiation is due to spontaneous emission, this would
indicate that 485 is radiated either by the collision induced mechanism
*or by stable Hg^:
Hg^ + Hg -> 3Hg + hv^g^ (3.2)
Hg* + Hg Hg* (3.3)
Hg* - 3Hg + hv^g^ (3.4)
10

It is impossible to distinguish between these two mechanisms with our current data.
17 2We next consider the data for N < 10 . These data show a strong tendency toward an N de-
2pendence at the lower densities. Although none of these data are truly parallel to the N asymptote,
2they seem to be approaching it more closely as N decreases. The transition from N to N dependence
seems to occur at about lO"*"*^. This change is rather difficult to detect In the 623 K data but there
are clear systematic deviations from linearity for the low density points on this curve. It would
be desirable to have more points at lower N for this temperature because this is one of the cases
which is clearly in thermal equilibrium when N > lO"*"^. It would therefore be instructive to measure
more accurately its deviation from the linear N dependence as N is decreased. Unfortunately, the
485 band becomes very weak for low N and high T and it was possible to go to lower N only for the
lowest temperatures (such as the 519 K curve for example). The latter overlaps the lO"*"^ region
very well; this curve agrees quite well with the low pressure afterglow measurements of Matland-
[12]McCoubrey but at high N it never quite achieves the linear N dependence exhibited by the high
temperature data. This is not surprising since, in view of figure 3.7 we would not expect to be in
thermal equilibrium at this temperature.
In summary then, we have compelling evidence that the states responsible for the 485 and 335
fluorescence band are in thermal equilibrium for high temperatures T > 575 K and densities N > 10'''^.
In the high temperature-density region where thermal equilibrium applies, the linear dependence of
P = 1(485) /I(335) on N would seem to indicate that 485 is emitted by a density dependent process
*such as collision induced radiation, eq. (3.3), or Hg^ formation, eqs. (3.4) and (3.5).
C. Potential Curves
In this section, we present a preHmlnary analysis of the electronic potential curves involved
in the 485 and 335 fluorescence. For similar discussions see Hedges, et. al. '^^^^ Doyle or
Sando and Dalgarno ^^^^. The number of photons per unit wavelength emitted in a transition between
a bound excited electronic state "a" and a repulsive ground state "b" ,is
3^ =^ Z^^^,J d. 6(hv . E^^j + O
exp( - E ^/kT)S^^, -avJ JJ
I
2
Z(T) ' avJ,beJ'I
(3.5)
CN*(T) ,exp( - E,,j/kT)Sjj, 2
^ ^5 vJJ' Z(T) ' avJ,beJ'
where (v,J) are vibration rotation quantum numbers for a, (eJ') are the corresponding quantum numbers
11

for b (e is a continuous nuclear kinetic energy quantum number), D is the transition dipole moment,
it
S is the Honl-London factor, the total number of excimers is N (T) , the excimer state population den-
sities are described by a Boltzmann distribution with a partition function Z(T), and C denotes miscel-
laneous uninteresting constants. The integral over nuclear kinetic energy e removes the delta func-
tion and, in the second line, e equals (E^^^-hv)
.
The dipole matrix element in eq. (3.5) can be expressed in terms of vibrational wavefunctions as
D T 1, T. =/"
D , (R)^-^ (R)4';J'(R)dR (3.6)avJ,bEJ J ab av b£
where D (R) denotes the dipole matrix element between the electronic states a and b. This integralab
can be evaluated using WKB wavefunctions^"""^^
in which case one finds that the integrand is sharply
peaked about a critical radius R^ at which the radial momenta for upper and lower states are equal
(Franck-Condon principle)
:
or since, e = E --hv,' avJ
2yR^ 2V\
.T, ^ ^^J(J + 1) „ X^^J'(J' + 1)
hv = V (R, ) ^ - V (R,) 5^ ^
2yR^2b X
2yR^2
(3.8)
In the last line of eq . (3.8) we have used the fact that the rotational levels with large thermal
populations correspond to large J values, thus the AJ = ±1,0 selection rule Implies that the ro-
tational energies in eq. (3.8) essentially cancel out. That is, for a given vibrational level
and a specific R^, all rotational levels emit photons of essentially the same frequency. There is
some rotational broadening due to the inexact cancellation of the rotational energies, but this is
negligible for our purposes. Since the integrand in Eq. (3.6) is sharply peaked at R^ , the function
D^^ may be factored out as '-'^^,(^;)^) ^^'^ the remaining Franck-Condon overlap integral evaluated by the
method of stationary phase. Mies argues that the WKB phase integral (the integral over the radial
momentum) for the repulsive state b will be small (compared with tt) at the point R^. Equation (3.6)
then reduces to
^avJ.beJ- = Dab^^^C^^) (R ) - V, (R )dR, ) a ^ b
^
(3.9)
If the WKB phase integral is not small is replaced by a slightly more complicated function of
R-j^. We must therefore emphasize that, for the high temperatures of interest to us (T > 400 K) this
phase integral will be small only if R^ lies near the classical turning point for the repulsive state
12

(within 0.5 X). This will be a good approximation since the WKB continuum wavefunctlon is sharply
peaked about the classical turning point. In fact, one must be somewhat careful about using a WKB
wavefunctlon for '^gy(Rj^) because the latter diverges at the turning point. However, eq. (3.9) can
[17]also be derived using Airy wavefunctions which do not diverge , hence one can readily find well
behaved wavefunctions for use with this expression. It should be noted that eq.(3.9) is quite
[181similar to the "reflection method" in which the repulsive state wavefunctlon Is replaced by a
delta function at the classical turning point. It should also be noted that eq. (3.9) breaks down
if the derivative of (V - V,) should vanish at R-, ; in such a case one must use the full Airya b A
function results ^^^^ (i.e. without assuming that the WKB phase Integral for state b is small).
We next note that the vibrational wavefunctlon depends on J only through the radial kineticav J °
2 2energy E^^j - ^g^^) •^(•J l)/2lJR . Since for not too large values of J the shape of the po-
2 2tentlal energy curve V^(R) + -K J(J + l)/2yR does not differ appreciably from that of V^(R), we will
2 2approximate the rotational energy by^ J(J + l)/2yR^. This approximation ignores a small distortion
[19]produced by the rotational energy but this should be negligible for our purposes . We may there-
fore replace E^^j in eq. (3.5) by:
_ -fi^J(J + 1)
avJ ~''av
"„ „ 2 (3.10)2yR^
thus removing all J dependence from the vibrational wavefunctlon. Substituting eqs. (3.7) and (3.10)
into eq, (3.5) and performing the J' sum of S^^, (which yields (2J + 1)), we obtain:
, cAtI, '°ab(^x)l'l\v^>l'X ^5 vJ (dv/dR^)
(3.11)
(2J + 1) expI-(E^y +'fi^J(J + l)/2)JR^^)/kT
|
Z(T)
where W denotes the (rotationless) vibrational wavefunctlon with energy eigenvalue E and theay ° av
derivative °^ ~ V^) was replaced by (dv/dR^) according to eq. (3.8). Next using the identity
E » T (R, ) + V(R, ) where T(R, ) is the nuclear kinetic energy at the point R, and assuming that theav V A A A A
rotational spacing is much smaller than kT, we replace the sum over J by an Integral which yields
R,exp {- V (R,)/kTi 2
(dv/dRj^) I ab'
X E (R,)i ^ -p{- yy/'-^
^ CN (T) 2ykT y , ^ , .
^5 ^2 (dv/dR,) I ab^ X-"A A
(3.12)
^ Z(T)
13

I1
2
We have now obtained an expression which relates I-^^ to the dipole strength |D^^(Rt^)| and the
probability of finding the nuclei at the radial separation where the radiative transition takes
2place. The probability is described by a Boltzmann spatial distribution, ^"^^ exp {-V^(R^) /kT}
,
multiplied by a momentum distribution which is in the form of a sum over vibrational states. Assum-
ing that the vibrational spacing (estimated to be the order of 150 cm '') is much less than kT (so that
many vibrational levels are populated) , the sum over vibrational states is easily performed using
2either harmonic oscillator or WKB eigenfunctions and one obtains 2iJkT/'tt . The partition function,
which includes both bound and free states, is dominated by the continuum contribution hence,
Z(T) - (2TTMkT/-ft^)^''^V (3.13)
where V is the volume of the system. Defining the density of excited states by n (T) we finally
obtain (cf. eq. (8) of ref. (13))2
-W^'^^Kb^h^^' (3.14)I = Cn (T)
A (dv/dR^)
If the temperature is less than or comparable to the vibrational spacing It is better to use eq.
(3.12). For our data, eq. (3.14) should be sufficient and it is this expression which we will
use to analyze the data presented in this report. For the purposes of our analysis this result can
be summarized by writing
A
where f(I^^) represents the effective transition probability at the point R-|^.
To use eq. (3.15) effectively, we first consider the ratio of intensities at two different wave-
*lengths in the same electronic band system. The log of this ratio will be (notice that the n (T)
cancels out)
(3.16)log(I,/I^,) =
If we plot this log versus 1/kT, the slope of the linear plot will give V (R, ) - V (R,,) . By doing
a A a A
this for several values of A', we can plot out as a function of wavelength. Of course, we can't
get the absolute energy without using some known energy level as a reference thus, for the present,
we will plot relative to some arbitrarily chosen reference point. For convenience, we will
choose the energy level which is responsible for 500 nm emission since we always have a strong
signal at this wavelength. Figure (3.9) shows a semilog plot of (I^/I^q^) versus 1/kT for several
wavelengths in the 485 band; the number in parentheses gives the slope in cm The excellent
linearity of these plots shows that the vibrational states are in thermal equilibrium as one would
expect. These data, and several more sets, which we have not plotted, have been analyzed by a
least squares computer program to obtain the slopes. The resulting V (R-, ) is plotted in figure (3.10)a A
14

together with the ground state curve obtained from the relation V, (R, ) = V (R, ) - hv. If the 485D A a A
band Is emitted by Hg^, our picture of these potential curves figure (3.10), is somewhat altered
by the fact that V then depends on two radial parameters as well as the angles between the inter-
nuclear vectors.
In figure (3.11) the same procedure has been followed for the 335 band choosing the state which
radiates at 336 nm as our energy origin. In figure (3.12), we have plotted ^° ^^^^
potential curves for the 335 band can be plotted relative to the energy of the state which radiates
at 500 nm. These curves are given in figure (3.13).
At this point, we should emphasize that the potential curves plotted in figures (3.10) and (3.13)
were obtained from the slope of the log R versus 1/kT plots in figures (3.9), (3.11) and (3.12). These
potentials are therefore unaffected by temperature independent quantities such as f-values, etc.
Figures (3.10) and (3.13) verify the bound-free nature of the 485 and 335 bands. These figures
also appear to Indicate that the region of the ground state involved in the 485 band lies somewhat
higher on the repulsive wall than the region corresponding to the 335 band and there is some overlap
at the edges of the bands. This is consistent with figure (1.1) but it does not prove that figure
(1.1) is the correct picture because we only have V versus A not V versus R and one cannot say with
certainty that the ground state curves in figures (3.10) and (3.13) actually refer to the same state
(e.g. the ground state of Hg^ is probably similar but not identical to that for Ug^
.
In conclusion we must emphasize that the potential curves V vs A, presented in this report,
are preliminary data and may be somewhat in error, particularly around 350 nm to 400 nm where the
fluorescence bands overlap. We are currently taking more extensive data at various pressures which
will be computer analyzed to provide greater accuracy.
D. The Effective Transition Probability
It is well known that the probability for emission depends on the internuclear spearatlon.
In eq. (3.14) there are several factors which determine this probability and, in eq. (3.15), we have
divided them into two categories according to their temperature dependence. The potential energy
V(R^) and the Boltzmann factor were discussed in the previous section; in this section we will briefly
discuss the temperature independent quantity f(R^).
2The function f(Rj^) is strongly influenced by the dimensional factor which (for our case)
causes f to increase with decreasing wavelength. Since f is inversely proportional to (dv/dR) <^
(dV /dR) - (dVj^/dR), this factor will tend to make f larger in the region where both and are
2repulsive (longer wavelengths) thus counteracting the effect of R to some extent. Finally there
Is the dlpole strength D .(Rj) where radial dependence Is unknown.
15

It Is possible to obtain relative values of f as a function of wavelength by comparing the
quantity
= X~^exp { - V^(R^)/kT} (3.17)
with the observed intensity I^ for some fixed temperature. Such a comparison has been made for
both bands and the results are given in tables (3.1) and (3.2). The comparison was made for two
different temperatures in order to give an idea of the scatter in calculated values of f. This
scatter seems to be the order of 10%, but it should be possible to do a bit better when more accurate
potentials are obtained. The functions f(R^) are relatively constant near the centers of the bands
with a rapid increase in the short wavelength (large R^) limit.
At this point, no attempt has been made to estimate an absolute value of f(R^); the present
analysis is intended only to give an idea of the type of gain profiles to be expected for these
bands.
The blue shift of the peaks of both bands, which was observed with increasing temperature,
(figs. 3.3 and 3.4) is now seen to result from a combination of ^(^-y) and the X ^ factor in eq.
(3.15). These factors combine to make an effective transition probability which increases strongly
with decreasing wavelength.
16

IV. TIME DEPENDENCE
Using the pulsed discharge continuum lamp described in section II C, we have observed the time
evolution of the 335 and 485 bands throughout a density range of lO'''^ to 10'''^ Hg atoms/cm"^ and a tem-
perature range of 473 to 973 K. Light from the lamp passed through the tri-compartmental filter
(see fig. 2.1) and the resulting fluorescence was observed at right angles through either the 335 or
485 broad band interference filters (fig. 2.6).
18Figure (4.1) shows a typical time history trace for a density of 10 and a vapor temperature of
523 K. Part "a" shows the overall rise and decay of the 485 band time with a 10 psec/div time
scale while part "b" shows the rise of the fluorescence with an expanded scale of 2 ysec/div. At
17 -3low pressures (3 x 10 cm ) the rise of the 335 band is the order of 30 ysec and about 25% faster
18 19 -3than that of the 485 band, whereas at higher pressures (10 -10 cm ), the two bands rise
almost simultaneously with rise times in the range 10 to 1 psec. The observed rise times decrease
linearly with increasing density but show almost no temperature dependence; increasing only slightly
as the temperature increases from 200°C to 350°C and remaining constant after that.
It is interesting to note that while the duration of the flashlamp pulse is 1 usee, the rise
time of the fluorescence bands has been observed to be as long as 40 ysec (at N = 3 x 10'''^). One
possible explanation for this delay assumes that the postulated merging ^^'^ of the '^l and ^0^ curves
3(see fig. 1.1) causes the high lying 1^ vibrational states (which are the ones being directly pumped)
to dissociate before they can radiate (the A value is expected to be the order of 10^ - 10^) or before
3collisions can produce vibrational relaxation. The Pq atomic state would then serve as a reservoir
for this excitation and the slow rise in fluorescence intensity would be determined by the rate
3at which Pq feeds energy back to the molecules. Initial attempts to test this hypothesis by
3measuring the time history of the Pq have been hampered by lack of intensity.
-tlxThe long time decay fits an exponential, e , from 80% of the maximum intensity out to
about 3 time constants (the limit of our measurement). Both bands decay simultaneously to within
the experiment error of ± 1 ysec at all pressures and temperatures for which we have made the measure-
ment. As shown in figure (4.2) there is a striking temperature dependence; first a sharp increase in
lifetime and then a decrease. The point at which the maximum time constant is observed is where the
dominant emission changes (see fig. 4.3) from 485 nm (low temperature) to 335 nm (at high tempera-
18 —3tares). For a density of 2 x 10 cm , this point is at T = 730 K.
The complex behavior of both rise and decay processes indicates the presence of several
competing processes. We made several attempts to model the data but more extensive data will be
needed before any meaningful analysis is possible.
17
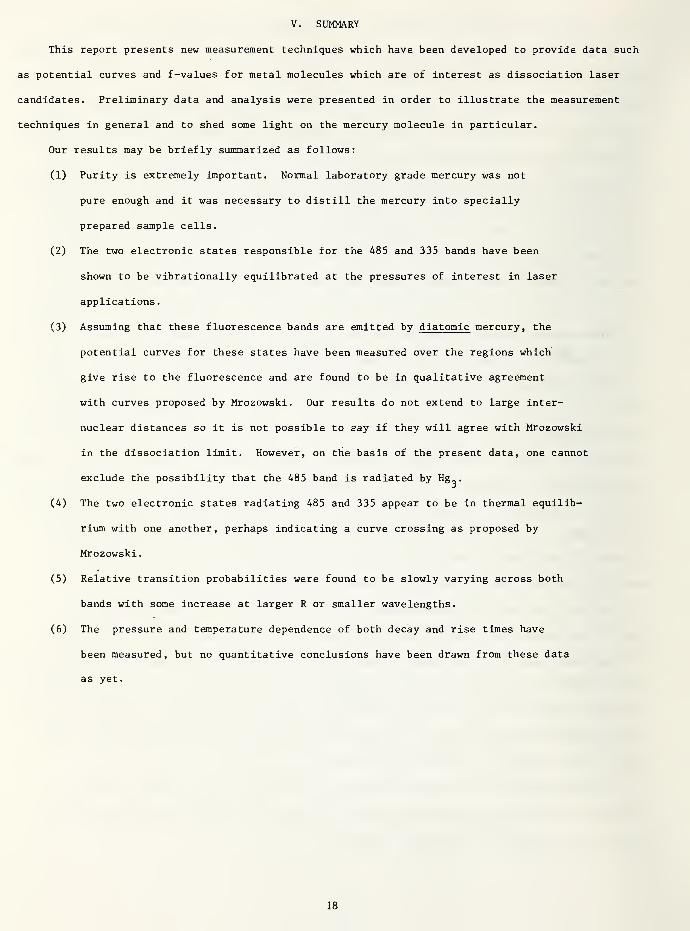
V. SUMMARY
This report presents new measurement techniques which have been developed to provide data such
as potential curves and f-values for metal molecules which are of interest as dissociation laser
candidates. Preliminary data and analysis were presented in order to illustrate the measurement
techniques in general and to shed some light on the mercury molecule in particular.
Our results may be briefly summarized as follows:
(1) Purity is extremely important. Normal laboratory grade mercury was not
pure enough and it was necessary to distill the mercury into specially
prepared sample cells.
(2) The two electronic states responsible for the 485 and 335 bands have been
shown to be vibrationally equilibrated at the pressures of interest in laser
applications.
(3) Assuming that these fluorescence bands are emitted by diatomic mercury, the
potential curves for these states have been measured over the regions which
give rise to the fluorescence and are found to be in qualitative agreement
with curves proposed by Mrozowski. Our results do not extend to large inter-
nuclear distances so it is not possible to say if they will agree with Mrozowski
in the dissociation limit. However, on the basis of the present data, one cannot
exclude the possibility that the 485 band is radiated by Hg^.
(4) The two electronic states radiating 485 and 335 appear to be in thermal equilib-
rium with one another, perhaps indicating a curve crossing as proposed by
Mrozowski.
(5) Relative transition probabilities were found to be slowly varying across both
bands with some increase at larger R or smaller wavelengths.
(6) The pressure and temperature dependence of both decay and rise times have
been measured, but no quantitative conclusions have been drawn from these data
as yet.
18

VI. ACKNOWLEDGMENTS
We would like to acknowledge many helpful discussions with Dr. A. V. Phelps and Prof. J. Cooper
of the Joint Institute for Laboratory Astrophysics. We also wish to thank Mme. Denlse Perrin of the
University of Paris VI for providing us with information on the optical pumping of via the con-
tinuum absorption band. In addition, we wish to express appreciation to Dr. R. J. Carbone for many
stimulating discussions and for organizing a symposium on mercury at the AEG Los Alamos Laboratories
which provided many new ideas on the kinetics of such systems.
19

VII. REFERENCES
1. A. 0. McCoubrey, Phys. Rev. 93, 1249 (1954); R. A. Phaneuf, J. Skonleczny, and L. Krause,
Phys. Rev. A8, 2980 (1973); J. Skonieczny and L. Krause, Phys. Rev. A9, 1612 (1974) and
references contained therein.
2. A. Atajew, A. Rutscher, and R. Winkler, Beit. Plasma Physik 12, 339 (1972); R. J. Carbone and
M. M. Litvak, J. Appl. Phys, 39, 2413 (1968); H. Takeyama, J. Sci. Hiroshima Univ. 15, 235
(1952). •
3. D. J. Eckstrom, R. M. Hill, D. C. Lorentz, and H. H. Nakano, Chem. Phys. Lett. 23, 112 (1973);
R. M. Hill, D. J. Eckstrom, D. C. Lorentz, and H. H. Nakano, Appl. Phys. Lett. 23, 373 (1973).
4. Subsequent to our work, Mme. D. Perrin referred us to the work of R. Lennuier on non resonance
line pumping of Hg2. (a) R. Lennuier, Compt. Rend. 213 , 169 (1941), (b) R. Lennuier and
Y. Crenn, Compt. Rend. 216 , 486 (1943), and (c) R. Lennuier and Y. Crenn, Compt. Rend. 216,
533 (1943).
5. S. Mrozowski, Rev. Mod. Phys. 1^, 153 (1944).
6. H. Kuhn and K. Freudenberg, z. Physik, 76, 38 (1932). Translated by K-B. Persson and
M. M. Hessel. A copy of this translation is available upon request to the authors of this
report.
7. R. W. Wood, Physical Optics (Dover Publications, Inc. New York) 1961 p. 636.
8. M. Stupavsky, G. W. F. Drake and L. Krause, Phys. Lett. 39A, 394 (1972).
9. A. C. Vikis and D. J. LeRoy, Phys. Lett. 44A, 325 (1973).
10. P. Pringsheim, Fluorescence and Phosphorescence (Interscience , New York, 1949).
11. R. Stair, W. E. Schneider, J. K. Jackson, Appl. Optics 1, 1151 (1963).
12. C. G. Matland and A. 0. McCoubrey > unpublished research memo.
13. R. E. M. Hedges, D. L. Drummond, and A. Gallagher, Phys. Rev. 6^, 1519 (1972).
14. Robert 0. Doyle, J. Quant. Spectrosc. and Radiat. Transfer, 8, 1555, (1968).
15. K. M. Sando and A. Dalgarno > Mol. Phys. 20, 103 (1971).
16. F. H. Mies , J. Chem. Phys. 48, 482 (1968).
17. W. H. Miller , J. Chem. Phys. 48, 464 (1968).
18. G. Herzberg, "Spectra of Diatomic Molecules" Van Nostrand Reinhold Co. 1950, p. 392.
20

Table 3.1 for 335 mn band, T = 873K, kT = 605 cm
X
-(V^-V33^)/kTe
-5 -(V - V )/kT(X/336) e
^obsf
300 0.034 .059 .145 2.46
310 .173 .259 .353 1.36
320 .45 .574.68
1.18
330 .78 .85 .96 1.12
336 1.0 1.0 1.0
340 1.02 .96.93
.97
350 .88 .72.545
.76
360 .396
T = 673 K,
.28
kT = 467 cm"''"
.17 .61
300 .013 .022 .066 3.0
310 .10 .15 .21 1.4
320 .36 .46 .53 1.15
330 .726 .79 .91 1.15
336 1.0 1.0 1.0 1.0
340 1.03 .97 .97 1.0
350 .85 .69 .55 .8
360 .30 .21 .26 + 0.1 1.24
21
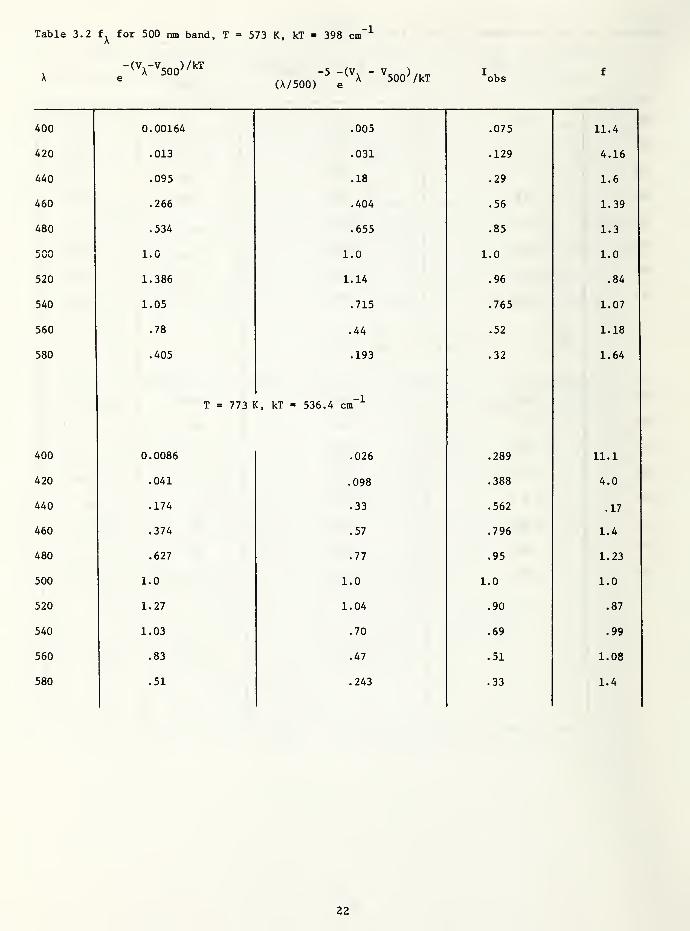
Table 3.2 for 500 mn band, T = 573 K, kT = 398 cm-1
-(^-^500)/^^-5 - ^500^kT
(A/500) e ^'^^ obs
400 0.00164 .005 .075 11.4
420 .013 .031 .129 4.16
440 .095 .18 .29 1.6
460 .266 .404 .56 1.39
480 .534 .655 .85 1.3
1.0 1.0 1.0 1.0
520 1.386 1.14 .96 .84
540 1.05 .715 .765 1.07
560 .78 .44 .52 1.18
580
\
.405 .193 .32 1.64
i >
T = 773 IC, kT = 536.4 cm"^
400 0.0086 .026 .289 11.1
420 .041 .098 .388 4.0
440 .174 .33 .562. 17
460 .374 .57 .796 1.4
480 .627 .77 .95 1.23
500 1.0 1.0 1.0 1.0
520 1.27 1.04 .90 .87
540 1.03 .70 .69 .99
560 .83 .47 .51 1.08
580
<
.51 .243 .33,
1.4
22

23

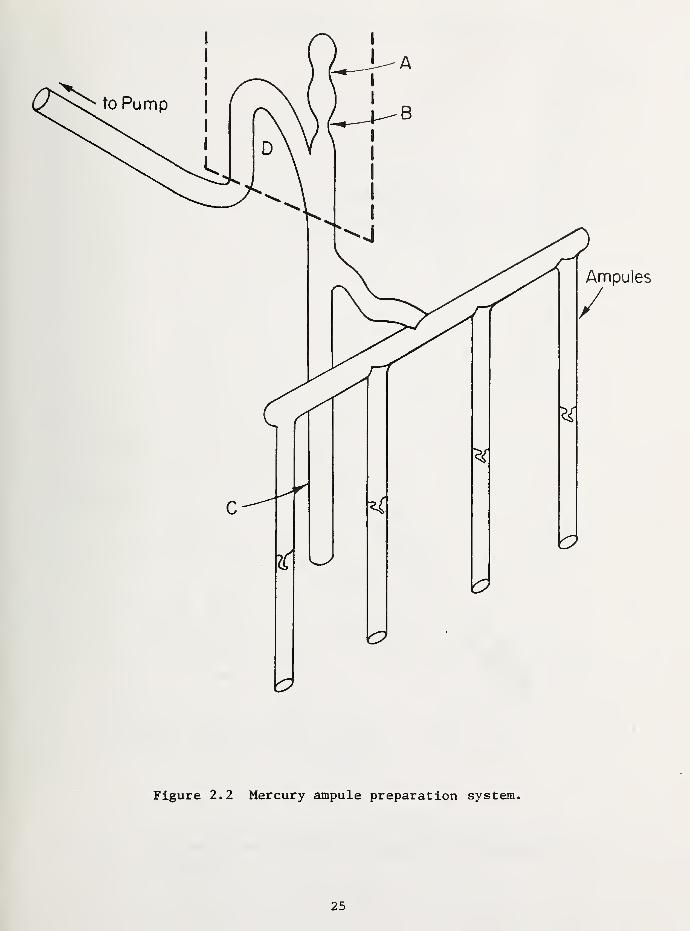
Figure 2.2 Mercury ampule preparation system.
25

Figure 2.3 Mercury cell distillation system.
26

Figure 2.4 Absorption coefficient and integrated band intensity versuswavelength.
27

Figure 2.5 Transmission curve of tri-compartment filter.
28


X(nm)
Figure 2.7 Transmission curve of 485 bandpass filter.
30


X (nm
)
Figure 3.2 Spectral distribution of Hg^ fluorescence excited by 257.2 nm
laser line.
32

33
0.40
335 Band Normalized to Unit Area
N= 2 X 10
X in nm
Figure 3.4 Spectral distribution of 335 band at different temperatures.
34

35
T= 763 K
335 Band Shape,
N = 9.5XI0'
^N=8,4XI0'
300 310 320 330 340 350 360 370 380
, X { nm
)
Figure 3.6 Spectral distribution of 335 band at different vapor densities.
36

l/kT = l.5XI0"3cm. 2.0 2.5 3.0
T = (960" K) (725 K) (575 K) (485 K)
Figure 3.7 Ratio of 485/335 band intensities versus temperature.
37

roI
o
cO)
•HCO
PS(U
CO
CO
(U
>CO
(U
•H
•HCO
(U
a•H
13G
mCOen
m00St
O•H
00
CO
•HP4
9££j / 98K
-3 Q

oo
2.0
( I /kT) cm
2.5
520 (130)
530 (50)
540 (20)
560 (100)
580 (360)
480 (250)
460 (527)
440 (938)
420 (1715)
400 (2552)
3.0
Figure 3.9 Normalized intensities versus temperature in the 485 band.
39

X{nm)
Figure 3.10 Potentials corresponding to the 485 band.
40

(0roro
338 (15)
340 (16)
342 (0)
346 (50)
350 (76)
354 (267)
360 (560)
330 (150)
320 (480)
310 (1060)
1.5 2.0 2.5 3.0
(l/kT) cm
Figure 3.11 Normalized intensities versus temperature in the 335 band.
41

(6542 cm"')
3.
(1/kT) cm
Figure 3.12 Ratio of 485/335 versus temperature.
42

43

-4-l-l-f j 1 11 -H-H- II 1
1 11(1nil 1 1 1
1
-t-H-H II II
mm'"mm II 11 II 1
11 1 II nil
1 1 11 Mil' 1 1 11 1 II 1
( b) 2 ytxsec/ Div.
Figure 4.1 Time history of the 485 fluorescence band, (a) lOysec/divisionand (b) 2 ysec/division.
44

45

Figure 4.3 Fluorescence spectrum at various temperatures for a fixedatomic density of 2 x 10^ ^cm ^.
46

NBS-1 14A (REV. 7-73)
U.S. DEPT. OF COMM.BIBLIOGRAPHIC DATA
SHEET
1. PUBLICATION OR REPORT NO.
NBS MN- 143
2. Gov't AccessionNo.
3. Recipient's Accession No.
4. TITLE AND SUBTITLE
Analysis of Optically Excited Mercury Molecules
5. Publication Date
January 1975
6. Performing Organization Code
7. AUTHOR(S)R. E. Drullinger, M. M. Hessel and E. W. Smith
8. Performing Organ. Report No.
9. PERFORMING ORGANIZATION NAME AND ADDRESS
NATIONAL BUREAU OF STANDARDS, Boulder LabsDEPARTMENT OF COMMERCEWASHINGTON, D.C. 20234
10. Project/Task/Work Unit No.
271646111. Contract/Grant No.
891 & LS74-4
12. Sponsoring Organization Name and Complete Address (Street, City, State, ZIP)
Advanced Research Projects Agency, 1490 Wilson Blvd.,Arlington, VA 22209; Los Alamos Scientific Laboratories,BX1663 Los Alamos, New Mexico 87544
13. Type of Report & PeriodCovered
Final14. Sponsoring Agency Code
15. SUPPLEMENTARY NOTES
16. ABSTRACT (A 200-word or less (actual summary of most significant information. If document includes a significant
bibliography or literature survey, mention it here.)
The Eg^ molecule is representative of a class of molecules which have dis-sociative ground states and bound excited states. It can therefore be used as a
prototype of this class of molecules which are of interest as potential new lasercandidates. Because of the non-bound ground state, standard absorption spectro-scopic techniques cannot be used to obtain the necessary information about theexcited states. We have therefore developed new measurement techniques to ob-tain potential curves, f-values, and kinetic behavior for Hg^, These techniquesare applicable to this whole class of dissociation molecular systems.
17. KEY WORDS (six to twelve entries; alphabetical order; capitalize only the first letter of the first key word unless a proper
name; separated by semicolons)
Dissociation laser; excimers; excited state kinetics; f-values; mercury molecules;new spectroscopis techniques; optical excitation; potential curves.
18. AVAILABILITY Unlimited 19. SECURITY CLASS(THIS REPORT)
21. NO. OF PAGES
1For Official Distribution. Do Not Release to NTIS
UNCLASSIFIED51
1
^ ^ Order From Sup. of Doc, U.S. Government P&intina Office
Washington. D.C. 20402. SD Cat. No. Cn« 44:14320. SECURITY CLASS
(THIS PAGE)22. Price
1 ! Order From National Technical Information Service (NTIS)Springfield, Virginia 22151 UNCLASSIFIED
$1.10
11
USCOMM-DC 29042-P74
U.S. GOVERNMENT PRINTING OFFICE: 1975- 583-016:38


NBS TECHNICAL PUBLICATIONS
PERIODICALS
JOURNAL OF RESEARCH reports National Bureauof Standards research and development in physics,
mathematics, and chemistry. Comprehensive scientific
papers p-ive complete details of the work, including
laboratory data, experimental procedures, and theoreti-
cal and mathematical analyses. Illustrated with photo-graphs, drawings, and charts. Includes listings of otherNBS papers as issued.
Published in two sections, available separately:
• Physics and Chemistry (Section A)
Papers of interest primarily to scientists working in
these fields. This section covers a broad range of physi-
cal and chemical research, with major emphasis onstandards of physical measurement, fundamental con-
stants, and properties of matter. Issued six times a
year. Annual subscription: Domestic, $17.00; Foreign,
$21.25.
• Mathematical Sciences (Section B)
Studies and compilations designed mainly for the math-ematician and theoretical physicist. Topics in mathe-matical statistics, theory of experiment design, numeri-cal analysis, theoretical physics and chemistry, logical
design and programming of computers and computersystems. Short numerical tables. Issued quarterly. An-nual subscription: Domestic, $9.00; Foreign, $11.25.
DIMENSIONS/NBS (formerly Technical News Bul-
letin)—This monthly magazine is published to informscientists, engineers, businessmen, industry, teachers,
students, and consumers of the latest advances in
science and technology, with primary emphasis on the
work at NBS.DIMENSIONS/NBS highlights and reviews such
issues as energy research, fire protection, building
technology, metric conversion, pollution abatement,health and safety, and consumer product performance.In addition, DIMENSIONS/NBS reports the results of
Bureau programs in measurement standards and tech-
niques, properties of matter and materials, engineeringstandards and services, instrumentation, and automaticdata processing.
NONPERIODICALS
Monographs—Major contributions to the technical liter-
ature on various subjects related to the Bureau's scien-
tific and technical activities.
Handbooks—Recommended codes of engineering andindustrial practice (including safety codes) developedin cooperation with interested industries, professional
organizations, and regulatory bodies.
Special Publications—Include proceedings of high-level
national and international conferences sponsored byNBS, precision measurement and calibration volumes,NBS annual reports, and other special publications
appropriate to this grouping such as wall charts andbibliographies.
Applied Mathematics Series—Mathematical tables,
manuals, and studies of special interest to physicists,
engineers, chemists, biologists, mathematicians, com-puter programmers, and others engaged in scientific
and technical work.
National Standard Reference Data Series—Providesquantitative data on the physical and chemical proper-tics of materials, compiled from the world's literature
and critically evaluated. Developed under a world-wideprogram coordinated by NBS. Program under authorityof National Standard Data Act (Public Law 90-396).
Building Science Series—Dissemmates technical infor-
mation developed at the Bureau on building materials,components, systems, and whole structures. The series
presents research results, test methods, and perform-ance criteria related to the structural and environmen-tal functions and the durability and safety character-istics of building elements and systems.
Technical Notes—Studies or reports which are completein themselves but restrictive in their treatment of asubject. Analogous to monographs but not so compre-hensive in scope or definitive in treatment of the sub-ject area. Often serve as a vehicle for final reports of
work performed at NBS under the sponsorship of othergovernment agencies.
Voluntary Product Standards—Developed under pro-
cedures published by the Department of Commerce in
Part 10, Title 15, of the Code of Federal Regulations.The purpose of the standards is to establish nationallyrecognized requirements for products, and to provideall concerned interests with a basis for common under-standing of the characteristics of the products. TheNational Bureau of Standards administers the Volun-tary Product Standards program as a supplement to
the activities of the private sector standardizingorganizations.
Federal Information Processing Standards Publications(FIPS PUBS)—Publications in this series collectively
constitute the Federal Information Processing Stand-ards Register. The purpose of the Register is to serve
as the official source of information in the Federal Gov-ernment regarding standards issued by NBS pursuantto the Federal Property and Administrative Services
Act of 1949 as amended. Public Law 89-306 (79 Stat.
1127), and as implemented by Executive Order 11717
(38 FR 12315, dated May 11, 1973) and Part 6 of Title
15 CFR (Code of Federal Regulations). FIPS PUBSwill include approved Federal information processingstandards information of general interest, and a com-plete index of relevant standards publications.
Consumer Information Series—Practical information,
based on NBS research and experience, covering areasof interest to the consumer. Easily understandablelanguage and illustrations provide useful backgroundknowledge for shopping in today's technological
marketplace.
NBS Interagency Reports—A special series of interim
or final reports on work performed by NBS for outside
sponsors (both government and non-government). In
general, initial distribution is handled by ihe sponsor;public distribution is by the National Technical Infor-
mation Service (Springfield, Va. 22151) in paper copyor microfiche form.
Order NBS publications (except Bibliographic Sub-scription Services) from: Superintendent of Documents,Government Printing Office, Washington, D.C. 20402.
BIBLIOGRAPHIC SUBSCRIPTION SERVICES
The following current-awareness and literature-survey
bibliographies are issued periodically by the Bureau:
Cryogenic Data Center Current Awareness Service
(Publications and Reports of Interest in Cryogenics).
A literature survey issued weekly. Annual subscrip-
tion: Domestic, $20.00; foreign, $25.00.
Liquefied Natural Gas. A literature survey issued quar-terly. Annual subscription: $20.00.
Superconducting Devices and Materials. A literature
survey issued quarterly. Annual subscription: $20.00.
Send subscription orders and remittances for the pre-
ceding bibliographic services to the U.S. Departmentof Commerce, National Technical Information Serv-
ice, Springfield, Va. 22151.
Electromagnetic Metrology Current Awareness Service
(Abstracts of Selected Articles on MeasurementTechniques and Standards of Electromagnetic Quan-tities from D-C to Millimeter-Wave Frequencies).
Issued monthly. Annual subscription: $100.00 (Spe-
cial rates for multi-subscriptions). Send subscription
order and remittance to the Electromagnetic Metrol-
ogy Information Center, Electromagnetics Division,
National Bureau of Standards, Boulder, Colo. 80302.

U.S. DEPARTMENT OF COMMERCENational Bureau of StandardsWashington, D.C. 20234
OFFICIAL BUSINESS
Penalty tor Private Use. $300