Embed Size (px)
Citation preview

AN ANALYSIS OF FOUR IMPLEMENTATION LEVELS FOR THE POSITIVE
BEHAVIORAL INTERVENTIONS AND SUPPORTS (PBIS) ON SELECTED
AGGREGATED HIGH SCHOOL STUDENT PERFORMANCE OUTCOMES
A Record of Study
by
KIMBERLY LASHON RHODES-MONETTE
Submitted to the Office of Graduate and Professional Studies of
Texas A&M University
in partial fulfillment of the requirements for the degree of
DOCTOR OF EDUCATION
Chair of Committee, Gwendolyn Webb-Hasan
Committee Members, Homer Tolson
Beverly Irby
Novella Carter
Head of Department, Fred Nafukho
December 2014
Major Subject: Educational Administration
Copyright 2014 Kimberly L. Rhodes-Monette

ii
ABSTRACT
The Positive Behavioral Interventions and Support (PBIS) framework is a school-
wide program formulated to address discipline and academic performance along with social
behavior skills. The framework provides a positive approach to school interventions through
creating a normative culture by communicating and supporting student behavior expectations
across all school context. I examined the differences among four levels (i.e. high, moderate,
low, or none) of PBIS implementation on selected aggregated high school student
performance outcome variables from 2007 through 2011. Many PBIS researchers have
focused only on how the implementation of the PBIS system impacts the academic
performance and discipline rates at elementary and middle school levels. My study may
bridge a gap in literature and make the connection between the levels of PBIS policy
implementation on student performance variables at the high school level such as the (a)
discipline rate, (b) academic achievement rate (i.e. math and reading TAKS pass rates), (c)
attendance rate, (d) dropout rate, and (e) graduation rate.
The study was conducted in 10 high schools within one suburban-urban school
district. An ex post facto design was used to examine the differences in student performance
outcomes among the high schools with varying levels of PBIS implementation. A two factor
factorial mixed model ANOVA was used to analyze the data. There was a significant
difference in the means of the Dropout Rate between levels of PBIS implementation. There
was a significant difference in the means of the Discipline Infraction Rate, Math TAKS Pass
Rate, and Attendance Rate across the time span of the study. There was no difference in the
means for the Reading TAKS Pass Rate or Graduation Rate.

iii
DEDICATION
I want to thank God for giving me the strength to complete this project. I would like
to dedicate this body of work to my daughter, Brittany Baisley. She has stood by my side
through this entire process and sacrificed a great deal of quality time, so I could complete my
studies. I especially thank my parents, James and Shirley Rhodes, for their undying love and
support. I would also like to thank my many family members, friends and coworkers who
have supported me throughout this process. I could not have achieved my goal without your
love and support. A very special thank you is dedicated to my car pool group, Drs. Dewayne
McGary, Robert Long III, and Cheryl Henry. Their continued support and guidance helped
me to endure this process from beginning to end.
iv
ACKNOWLEDGEMENTS
I would like to acknowledge my chair, Dr. Gwendolyn Webb-Hasan for her
unwavering support. I also would like to thank my committee members for their input and
evaluation especially my statistic’s professor Dr. Homer Tolson along with Dr. Norvela
Carter and Dr. Beverly Irby.
v
TABLE OF CONTENTS
Page
ABSTRACT ………………………………………………………………………. ii
DEDICATION …………………………………………………………………….. iii
ACKNOWLEDGEMENTS ……………………………………………………….. iv
TABLE OF CONTENTS …………………………………………………………. v
LIST OF FIGURES ……………………………………………………………….. viii
LIST OF TABLES ………………………………………………………………… xi
CHAPTER I INTRODUCTION …………………………………………………… 1
Positive Behavioral Interventions and Supports…………………………… 2
Statement of the Problem…………………………………………………... 5
Purpose of the Study ………………………………………………………. 6
Significance of the Study …………………………………………………. 6
Initial Research Tasks ……………………………………………………... 7
Research Questions ………………………………………………………... 8
Assumptions ……………………………………………………………...... 9
Limitations ………………………………………………………………… 9
Operational Definitions …………………………………………………… 10
Summary of the Introduction ……………………………………………… 12
CHAPTER II REVIEW OF LITERATURE ………………………………………. 14
Overview of Positive Behavioral Interventions and Supports …………...... 14
PBIS Concepts and Goals …………………………………………. 16
PBIS in Different Contexts ………………………………………... 17
PBIS and School Climate ………………………………………...... 20
PBIS and the Level of Implementation ……………………………. 21
PBIS and Student Performance Outcomes ………………………… 23
Variables that Influence Students to Leave High School Before
Completion ……………………………………………………………….... 24
The Discipline Gap ………………………………………………… 26
The Academic Gap ………………………………………………… 28
School Climate Issues .…………………………………………….. 30
vi
The Residual Effects of Leaving High School Before Completion………... 31
No Child Left Behind Act (NCLB) and Response to Intervention (RTI)….. 34
Policy Implementation……………………………………………………… 35
Hypotheses of the Study…………………………………………………… 37
Summary of the Review of Literature……………………………………… 37
CHAPTER III METHODOLOGY ………………………………………………… 39
Initial Research Tasks……………………………………………………… 39
Research Questions………………………………………………………… 40
Design of the Study………………………………………………………… 40
State, District and School Environments…………………………………… 41
The State……………………………………………………………. 41
The District…………………………………………………………. 42
The Schools…………………………………………………………. 43
Variables Examined………………………………………………………… 44
The Independent Variables…………………………………………. 44
The Dependent Variables…………………………………………... 44
Data Collection Instruments………………………………………………... 46
Validity and Reliability of the Instruments………………………… 46
Data Collection……………………………………………………………... 48
The Independent Variables…………………………………………. 48
The Dependent Variables…………………………………………... 49
Data Analysis………………………………………………………………. 49
Summary of the Methodology ...…………………………………………… 50
CHAPTER IV RESULTS …………………………………………………………. 51
State, District and School Demographics…………………………………... 51
The State……………………………………………………………. 52
The District…………………………………………………………. 55
The Schools…………………………………………………………. 58
Results of Initial Research Task 1 ……………………………………….… 92
The Duration of PBIS ……………………………………………… 93
The Composition of the PBIS Leadership Team …………………... 94
The Composition of the PBIS Motto and Matrix Team …………… 95
PBIS Training and Supports in the Initial Training Year …………. 97
Ongoing PBIS Practices …………………………………………… 97
Staff Perceptions of PBIS Practices ……………………………….. 98
Results of Initial Research Task 2 …...…………………………………….. 100
Research Questions - An Analysis of the Outcome Variables…………….. 101
The Discipline Infraction Rate …..………………………………… 102
The Math & Reading TAKS Pass Rates ..…………………………. 116
The Attendance Rate ..……………………………………………... 135
The Dropout Rate ..………………………………………………... 144

vii
The Graduation Rate ...…………………………………………….. 156
Summary of the Results …………………………………………………… 162
CHAPTER V CONCLUSIONS…………………………………………………… 164
Interpretation and Summary of the Population Trends…………………….. 164
Interpretation and Summary for the Level of PBIS Implementation………. 166
Interpretation and Summary of Student Performance Outcomes………….. 167
Implications for Future Research................................................................... 170
REFERENCES…………………………………………………………………….. 172
APPENDIX A …………………………………………………………………….. 183
APPENDIX B …………………………………………………………………….. 188
APPENDIX C …………………………………………………………………….. 191
APPENDIX D …………………………………………………………………….. 193
APPENDIX E …………………………………………………………………….. 195
APPENDIX F …………………………………………………………………….. 199
APPENDIX G …………………………………………………………………….. 202
APPENDIX H …………………………………………………………………….. 208
APPENDIX I …………………………………………………………………….. . 214
APPENDIX J …………………………………………………………………….. . 220
APPENDIX K …………………………………………………………………….. 226

viii
LIST OF FIGURES
FIGURE Page
1 Duration of PBIS Implementation……………………………………………... 94
2 Composition of PBIS Leadership Teams……………………………………… 95
3 Composition of PBIS Motto and Matrix Development Teams……………….. 96
4 Ongoing Staff and Student PBIS Practices……………………………………. 97
5 The Discipline Infraction Rate Mean Values for the Differing Levels of PBIS
Implementation across the Years …………………………………………….. 109
6 The Discipline Infraction Rate Mean Values for PBIS Implementation across
the Years ……………………………………………………………………… 115
7 The Math TAKS Pass Rate Mean Values for the Differing Levels of PBIS
Implementation across the Years …...………………...……………………… 122
8 The Math TAKS Pass Rate Mean Values for PBIS Implementation across the
Years ………………………………………………………………………… 128
9 The Reading TAKS Pass Rate Mean Values for the Differing Levels of PBIS
across the Years …………………………………………………………….. 131
10 The Reading TAKS Pass Rate Mean Values for PBIS Implementation across
the Years ……………………………………………………..………………. 134
11 The Attendance Rate Mean Values for the Differing Levels of PBIS
Implementation across the Years ……………………………………………... 138
12 The Attendance Rate Mean Values for PBIS Implementation across the Years. 144
13 The Dropout Rate Mean Values for the Differing Levels of PBIS
Implementation across the Years ……………………..………………………. 152
14 The Dropout Rate Mean Values for PBIS Implementation across the Years ... 155
15 The Graduation Rate Mean Values for the Differing Levels of PBIS
Implementation across the Years …………………………………….……….. 159

ix
16 The Graduation Rate Mean Values for PBIS Implementation across the Years 162
17 The Math and Reading TAKS Pass Rates for HS 1…………………………… 209
18 The Math and Reading TAKS Pass Rates for HS 2…………………………... 209
19 The Math and Reading TAKS Pass Rates for HS 3…………………………… 210
20 The Math and Reading TAKS Pass Rates for HS 4…………………………… 210
21 The Math and Reading TAKS Pass Rates for HS 5………………………….... 211
22 The Math and Reading TAKS Pass Rates for HS 6…………………………... 211
23 The Math and Reading TAKS Pass Rates for HS 7…………………………... 212
24 The Math and Reading TAKS Pass Rates for HS 8…………………………... 212
25 The Math and Reading TAKS Pass Rates for HS 9………………………….. 213
26 The Math and Reading TAKS Pass Rates for HS 10………………………… 213
27 The Attendance Rate for HS 1………………………………………………… 215
28 The Attendance Rate for HS 2………………………………………………... 215
29 The Attendance Rate for HS 3………………………………………………... 216
30 The Attendance Rate for HS 4………………………………………………… 216
31 The Attendance Rate for HS 5……………………………………………….... 217
32 The Attendance Rate for HS 6………………………………………………… 217
33 The Attendance Rate for HS 7………………………………………………… 218
34 The Attendance Rate for HS 8………………………………………………… 218
35 The Attendance Rate for HS 9………………………………………………… 219
36 The Attendance Rate for HS 10……………………………………………….. 219
37 The Dropout Rate for HS 1 …………………………………………………… 221
38 The Dropout Rate for HS 2 …………………………………………………... 221
x
39 The Dropout Rate for HS 3 …………………………………………………… 222
40 The Dropout Rate for HS 4 …………………………………………………... 222
41 The Dropout Rate for HS 5 …………………………………………………... 223
42 The Dropout Rate for HS 6 ………………………………………………….... 223
43 The Dropout Rate for HS 7 …………………………………………………… 224
44 The Dropout Rate for HS 8 …………………………………………………... 224
45 The Dropout Rate for HS 9 …………………………………………………… 225
46 The Dropout Rate for HS 10 …………………………………………………. 225
47 The Graduation Rate for HS 1 ………………………………………………... 227
48 The Graduation Rate for HS 2 ………………………………………………... 227
49 The Graduation Rate for HS 3 ……………………………………………….. 228
50 The Graduation Rate for HS 4 ………………………………………………... 228
51 The Graduation Rate for HS 5 ………………………………………………... 229
52 The Graduation Rate for HS 6 ………………………………………………… 229
53 The Graduation Rate for HS 9 ………………………………………………... 230
54 The Graduation Rate for HS 10 ………………………………………………. 230

xi
LIST OF TABLES
TABLE Page
1 The Student Enrollment Population in Texas Public School System
from 2007-2011 ………………………………………………………………... 53
2 The Student Ethnicity Population in the Texas Public School System
from 2007-2011 ………………………………………………………………... 54
3 The Student Learner Diversity Population in the Texas Public School System
from 2007-2011…………………………………………………………………. 55
4 The Student Enrollment Population in the District from 2007-2011…………... 56
5 The Student Ethnicity Population in the District from 2007-2011…………….. 57
6 The Student Learner Diversity Population in the District from 2007-2011…… 58
7 The Student Enrollment Population in HS 1 from 2007-2011………………… 60
8 The Student Ethnicity Population in HS 1 from 2007-2011…………………… 61
9 The Student Learner Diversity Population in HS 1 from 2007-2011………….. 62
10 The Student Enrollment Population in HS 2 from 2007-2011………………… 63
11 The Student Ethnicity Population in HS 2 from 2007-2011…………………… 64
12 The Student Learner Diversity Population in HS 2 from 2007-2011………….. 65
13 The Student Enrollment Population in HS 3 from 2007-2011………………… 66
14 The Student Ethnicity Population in HS 3 from 2007-2011…………………… 67
15 The Student Learner Diversity Population in HS 3 from 2007-2011…………. 68
16 The Student Enrollment Population in HS 4 from 2007-2011………………... 69
17 The Student Ethnicity Population in HS 4 from 2007-2011………………….. 70
18 The Student Learner Diversity Population in HS 4 from 2007-2011………….. 71
xii
19 The Student Enrollment Population in HS 5 from 2007-2011………………… 72
20 The Student Ethnicity Population in HS 5 from 2007-2011…………………… 73
21 The Student Learner Diversity Population in HS 5 from 2007-2011…………. 74
22 The Student Enrollment in HS 6 from 2007-2011……………………………. 75
23 The Student Ethnicity Population in HS 6 from 2007-2011………………….. 76
24 The Student Learner Diversity Population in HS 6 from 2007-2011………….. 77
25 The Student Enrollment Population in HS 7 from 2007-2011……………….... 78
26 The Student Ethnicity Population in HS 7 from 2007-2011…………………… 79
27 The Student Learner Diversity Population in HS 7 from 2007-2011………….. 80
28 The Student Enrollment Population in HS 8 from 2007-2011………………… 81
29 The Student Ethnicity Population in HS 8 from 2007-2011…………………… 82
30 The Student Learner Diversity Population in HS 8 from 2007-2011………….. 83
31 The Student Enrollment Population in HS 9 from 2007-2011…………………. 84
32 The Student Ethnicity Population in HS 9 from 2007-2011…………………… 85
33 The Student Learner Diversity Population in HS 9 from 2007-2011………...... 86
34 The Student Enrollment Population in HS 10 from 2007-2011……………….. 87
35 The Student Ethnicity Population in HS 10 from 2007-2011…………………. 88
36 The Student Learner Diversity in HS 10 from 2007-2011……………………. 89
37 The Central Tendency of the Total Student Population for the High Schools… 90
38 The Central Tendency of the Student Ethnicity Population for the High Schools 91
39 The Central Tendency of the Student Learner Diversity Population for the
High Schools …………………………………………………………………... 92
40 The Number of EBS Survey Questions in each Category……………………... 99

xiii
41 The Calculations of Factors for Initial Research Task 2 .……………………… 100
42 The Discipline Infraction Rate Within-Subjects Effect Test for the
Differing Levels of PBIS Implementation and Years …………………………. 104
43 The Discipline Infraction Rate Sidak Test across the Years for the
Differing Levels of PBIS Implementation …………………………………….. 105
44 The Discipline Infraction Rate Main Effect Within-Subjects Contrast
for the Differing Levels of PBIS Implementation and Years …………………. 106
45 The Discipline Infraction Rate Between-Subjects Effect Test for the
Differing Levels of PBIS Implementation …………………………………….. 107
46 The Discipline Infraction Rate Within-Subjects Effect Test for PBIS
Implementation and Years …………………………………………………….. 111
47 The Discipline Infraction Rate Sidak Test across Years for PBIS
Implementation ………………………………………………………………… 112
48 The Discipline Infraction Rate Main Effect Within-Subject Contrast Test for
PBIS Implementation and Years ………………………………………………. 113
49 The Discipline Infraction Rate Between-Subjects Effect Test for PBIS
Implementation ………………………………………………………………… 113
50 The Math TAKS Pass Rate Within-Subjects Effect Test for the Differing
Levels of PBIS Implementation and Years ……………………………………. 118
51 The Math TAKS Pass Rate Sidak Test for the for the Differing Levels
of PBIS Implementation across Years …………………………………………. 119
52 The Math TAKS Pass Rate Within-Subjects Contrast Test for the Differing
Levels of PBIS Implementation and Years ……………………………………. 120
53 The Math TAKS Pass Rate Between-Subjects Effect Test for the Differing
Levels of PBIS Implementation ……………………………………………….. 120
54 The Math TAKS Pass Rates Within-Subjects Effect Test for PBIS
Implementation and Years …………………………………………………….. 124
55 The Math TAKS Pass Rate Sidak Test for the across Years for PBIS
Implementation ………………………………………………………………… 125
56 The Math TAKS Pass Rate Within-Subjects Contrast Test for PBIS

xiv
Implementation and Years …………………………………………………….. 126
57 The Math TAKS Pass Rate Between-Subjects Effect Test for PBIS
Implementation ………………………………………………………………… 126
58 The Reading TAKS Pass Rate Within-Subjects Effects Test for the
Differing Levels of PBIS Implementation and Years …………………………. 130
59 The Reading TAKS Pass Rate Between-Subjects Effect Test for the
Differing Levels of PBIS Implementation and Years …………………………. 130
60 The Reading TAKS Pass Rate Within-Subjects Effects Test for
PBIS Implementation and Years ………………………………………………. 133
61 The Reading TAKS Pass Rate Between-Subject Test for PBIS Implementation 133
62 The Attendance Rate Within-Subjects Effect Test for the Differing Levels of
PBIS Implementation and Years ………………………………………………. 137
63 The Attendance Rate Between-Subject Effect Test for the Differing Levels of
PBIS Implementation ………………………………………………………….. 137
64 The Attendance Rate Within-Subject Effect Test for the PBIS
Implementation and Years …………………………………………………….. 140
65 The Attendance Rate Sidak Test PBIS Implementation across the Years …….. 141
66 The Attendance Rate Within-Subjects Contrast Test for PBIS Implementation
and Years ……………………………………………………………………… 142
67 The Attendance Rate Between-Subjects Effect Test for PBIS Implementation… 142
68 The Dropout Rate Within-Subjects Effect Test for Differing Levels of
PBIS Implementation and Years ……………………………………………… 147
69 The Dropout Rate Multivariate Test for the Simple Main Effect of the
PBIS Implementation Levels ………………………………………………….. 148
70 The Dropout Rate Univariate Test for the Simple main Effects for the
Differing Levels of PBIS Implementation …………………………………….. 149
71 The Dropout Rate Between-Subjects Effect Test for the Differing Levels
of PBIS Implementation …………………………………………………….. 150
72 The Dropout Rate Within-Subjects Effect Test for PBIS Implementation

xv
and Years ……………………………………………………………………. 154
73 The Dropout Rate Between-Subjects Effect Test for PBIS Implementation ... 154
74 The Graduation Rate Within-Subjects Effect Test for the Differing Levels of
PBIS Implementation and Years …………………………………………….. 158
75 The Graduation Rate Between-Subjects Effect Test for the Differing Levels of
PBIS Implementation ………………………………………………………... 158
76 The Graduation Rate Within-Subjects Effect Test for PBIS Implementation
and Year ……………………………………………………………………… 161
77 The Graduation Rate Between-Subjects Effect Test for PBIS Implementation ... 161
78 The EBS Survey Results………………………………………………………... 200
79 The Transformation of the Discipline Infractions for HS 1 …………………… 203
80 The Transformation of the Discipline Infractions for HS 2 …………………... 203
81 The Transformation of the Discipline Infractions for HS 3 …………………… 204
82 The Transformation of the Discipline Infractions for HS 4 …………………... 204
83 The Transformation of the Discipline Infractions for HS 5 …………………… 205
84 The Transformation of the Discipline Infractions for HS 6 …………………… 205
85 The Transformation of the Discipline Infractions for HS 7 …………………... 206
86 The Transformation of the Discipline Infractions for HS 8 …………………... 206
87 The Transformation of the Discipline Infractions for HS 9 ………………….. 207
88 The Transformation of the Discipline Infractions for HS 10 …………………. 207

1
CHAPTER I
INTRODUCTION
The preparation of students to become productive members of society is one goal of
education. Educators are preparing students for various options after high school including:
(a) university or trade school matriculation, (b) military service, or (c) employment in the
workforce. Ideally, when students receive high school diplomas, they are prepared to become
productive members of society. Weiss (1988) concluded high school completion plays a
significant role in students’ future success. To meet the demands of society after high school,
the Elementary and Secondary Education Act (ESEA), passed by the U.S. government in
1965, stiffened the standards for high school students. In 2001, the ESEA was renewed as the
No Child Left Behind Act (NCLB) and the standards were redefined. Although the standards
to graduate from high school are more rigorous, employers complain that high school
graduates going directly into the workforce remain ill prepared for the rigors of the current
workforce (Graves, 2009). Many students from culturally and linguistically different
backgrounds have experienced more difficulties completing high school (Sugai & Horner,
2002a).
Weiss (1988) compared high school graduates with dropouts across four job
components. The components included (a) output per hour, (b) comparative advantage in
more complex job functions, (c) propensity to quit, and (d) propensity to be absent. Through
his investigation, Weiss found high school graduates earn higher wages relative to dropouts.
He discovered an advantage for graduates in output per hour and an advantage in more

2
complex job functions. Weiss concluded high school graduates, in comparison to dropouts,
had a lower rate of absenteeism and were less likely to quit their jobs (Weiss, 1988).
In 1998, Holzer and Danziger conducted a study of job availability for disadvantaged
workers. Holzer and Danziger (1998) identified disadvantaged workers as students of color
(i.e., Black and Hispanic), high school dropouts and welfare recipients. In their research, they
compared the work habits and skill levels of high school graduates to those of disadvantaged
workers. Holzer and Danziger concluded that disadvantaged workers lacked those skills
necessary to perform complex job related tasks and were therefore less likely to become
employed. The results of their study supported one of the goals of education to not only
prevent students from leaving high school before graduation but to also strive for the
successful completion of high school with the necessary skills to become successful in the
workforce.
As previously identified, there are advantages for students obtaining a high school
diploma prior to entering the workforce. However, Harrison (2010) reported that less than
75% of students in the U.S. graduated from high school each year, which when compared to
the graduation rates of students of other industrialized nations, accounted for one of the
lowest rates. In order to best prepare students for lifelong success, educators must work to
prevent students from leaving high school prior to graduation. By promoting graduation from
high school, educators should increase the ability of students to meet the demands of the
workforce.
Positive Behavioral Interventions and Supports
One program schools have employed to support the improvement of measures for
students' performance outcomes was the Positive Behavioral Interventions and Supports

3
(PBIS). PBIS had been identified in the educational literature as an intervention program for
addressing disciplinary cases related to behavioral changes and was conducted school-wide,
with all students being held responsible for knowing and following the framework (Horner,
Sugai, Todd, & Lewis-Palmer, 2005). PBIS has also been referenced as a school-wide
program formulated to address cases of discipline and academic performance (Hemmelgarn,
Glisson, & James, 2006). The conceptual framework of PBIS was defined as an aggregate of
procedures, management methods, and techniques designed to enhance students’ educational
experiences leading to desired positive changes (Sugai, 2009).
The creators of PBIS, Drs. George Sugai and Robert Horner, described the theoretical
foundation of PBIS as an organizational practice designed to approach school behaviors from
a positive perspective (Sugai and Horner, 2002a, 2002b, 2006, and 2009). PBIS was designed
as a three-tiered framework for a school-wide approach to preventing behavior problems.
The first tier of the PBIS continuum involved a behavior plan designed for all students and
staff. The first tier laid the foundation for the communication and establishment of the
normative behaviors and expectations across the school setting. At this level, the behavioral
goals should be met by 80 to 85% of the student body. The second tier of the continuum was
designed to assist students in need of more support toward positive behaviors. At this level,
the behavioral goals should be met by the 10 to 15% of the student body needing more
support. The third tier was designed to provide additional supports, including adult contact
and mentoring, frequent and positive prompts, and the support of specialist. At this level, the
behavioral goals should be met by the 1 to 5% of the student body in need of more intensive
interventions (Sugai & Horner, 2002, 2002b, 2006, & 2009).

4
To meet the goal of preparing students to complete their studies and meet future
responsibilities with success, many educators in U.S. schools developed and implemented
intervention strategies to address the needs of students who are at-risk of dropping out. A
national survey of 3,691 school-based delinquency prevention programs operating in the
spring of 1998 focused on characteristics related to the successful implementation of school-
based programs (Gottfredson & Gottfredson, 2002). The characteristics from the survey
study included organizational capacity, organizational support, program features, and the
integration of the program into normal school operations, local initiation, and local planning.
Researchers found that 71% of the employed programs identified best practices as designed
by the program and less than 50% of the designed methods were employed. Based upon these
findings, the researchers concluded the effectiveness of school-based programs was greatly
impacted by the level of implementation for the program (Gottfredson & Gottfredson, 2002).
Gottfredson, Jones, and Gore, 2002, found that the cognitive-behavioral intervention
programs applied through instructional programs were not fully implemented in any of the
observed classes. In this middle school study by Gottfredson, Jones, and Gore, discipline,
attendance, and academic data were compared between the fall and spring semesters. The
researchers revealed a decrease in the program effectiveness from the fall to spring
semesters. The researchers believed that the decrease in the effectiveness of programs was
due to a school climate of low expectations. Based upon their observations, the researchers
concluded the level of implementation and resulting success rates of programs depended
heavily on a supportive school climate (Gottfredson, Jones, & Gore, 2002). Based upon
Gottfredson, Jones, and Gore study, the level of implementation had an impact on the success
of school-based programs.
5
To meet the demands of society after high school, the Elementary and Secondary
Education Act (ESEA), passed by the U.S. government in 1965, made the standards for high
school students more stringent. In 2001, the ESEA was renewed as the No Child Left Behind
Act (NCLB) and standards were redefined. The school district in which this research was
conducted defined a successful high school graduate as an effective communicator;
competent problem solver; self-directed learner; responsible citizen; and quality producer. In
order to best prepare students for lifelong success, educators must work to prevent students
from leaving high school prior to graduation. By promoting graduation from high school,
educators will increase the ability of students to meet the demands of the workforce.
Statement of the Problem
A problem often associated with students’ decisions to drop out of high school is the
experience of a disconnection between themselves and the academic and social aspects of the
school environment (Bryk and Thum, 1989). The process by which many students leave
school prior to completion most likely began years prior to the point of their actual departure
from school. Although the process may have originated at the elementary and middle grade
levels, the process was often completed at the high school level in the form of students’
decisions to dropout before graduation (Harrison, 2010; Sagett, 2004).
In 2002, Griffin explored the linkage between students’ decisions to dropout and their
connections to the school environment. The disconnection between students and the school
may have occurred as a result of repeated negative experiences in the school environment
through discipline and academic performance (Griffin, 2002). Griffin reported students were
far more likely to dropout when they began to doubt the value of the educational experience
as it applied to their personal realities. Although Griffin’s study focused on two ethnic groups
6
of students, African American and Hispanic, Griffin revealed some of the challenges many
at-risk students face when making decisions for dropping out of high school. Many students
from culturally and linguistically different backgrounds have experienced more difficulties
completing high school (Sugai & Horner, 2002a).
Purpose of the Study
Positive Behaviors Interventions and Supports (PBIS) was an organizational practice
for positively influencing students’ behavior. Using an ex post facto design, I conducted a
quantitative study to analyze the differences in student performance in schools with differing
levels of PBIS implementation across five school years. The following are the selected
aggregated student performance outcomes variables: (a) discipline infraction rate, (b) math
and reading TAKS Passing Rates, (c) attendance rate, (d) dropout rate, and (e) graduation
rate. I analyzed the differences made by PBIS implementation on these variables for students
within 10 high schools in one district. The students in each of the schools were between the
ninth and twelfth grade.
Differences in students’ performance were observed by analyzing the level of
implementation of the PBIS program. Results from my study may allow educators to
examine their own levels of PBIS implementation and how student performance is affected
by this implementation. A review of policy implementation may show how the PBIS
program could be utilized to promote the goal of increasing high school graduation rates for
students.
Significance of the Study
Dr. George Sugai and Dr. Rober Horner revealed tangible benefits for student
behavioral change which functions to minimize discipline incidents and other detrimental

7
effects on students’ education (Sugai & Horner, 2002a). The focus of the literature on PBIS
had been on reducing students’ discipline incidents and increasing students’ academic
achievement (Sugai & Horner, 2006). Despite the success rates associated with the adoption
of PBIS, a knowledge gap exists in the understanding the differences in the level of PBIS
implementation model and its effect on student performance outcomes beyond discipline and
academic performance.
In my study, I explored several gaps in the educational literature of PBIS. I
discovered PBIS literature in which researchers examined only the relationship between
PBIS and the academic performance and discipline assignments of students at the elementary
and middle school levels (Bradshaw, Reinke, Brown, Bevans, & Leaf, 2008c; Warren,
Bohanon-Edmonson, Trunbull, & Sailor, et al., 2006). However, the present study bridged a
gap in the literature and made connections between the levels of PBIS policy implementation
on student performance variables at the high school level. I will share the results of my study
with the examined school district. The district may be able to utilize the results from my
study to identify system-wide evidence of the current execution practices of PBIS. The initial
research tasks and questions of my study were designed to address whether differing levels of
PBIS implementation resulted in variation of students’ performance outcomes at the high
school level with a focus on the graduation rate.
Initial Research Tasks
1. To determine the implementation level of PBIS at each high school based upon the
following criteria:
a. The duration of PBIS practice.
b. The composition of PBIS leadership team.

8
c. The composition of PBIS motto and matrix development team.
d. The initial PBIS training.
e. The ongoing PBIS training and support.
f. The perception of the staff members regarding the effectiveness of the PBIS
practices.
2. To categorize each high school into one of four PBIS implementation levels (high,
moderate, low, or none).
Research Questions
1. Is there a difference in the aggregated student performance of high schools with differing
levels of PBIS implementation on the following selected aggregated outcome variables:
a. The discipline infraction rate?
b. The math TAKS pass rate?
c. The reading TAKS pass rate?
d. The attendance rate?
e. The dropout rate?
f. The graduation rate?
2. Is there a difference in the aggregated student performance of PBIS high schools and
non-PBIS high schools on the following selected outcome variables:
a. The discipline infraction rate?
b. The math TAKS pass rate?
c. The reading TAKS pass rate?
d. The attendance rate?
e. The dropout rate?

9
f. The graduation rate?
Assumptions
One goal of PBIS was to keep students in the academic setting in order to facilitate
learning. The positive reinforcement, central to the PBIS model, directly counters the
traditional punishment-based means of dealing with students’ unacceptable behavior within
high schools. Thus, the term “positive change” has remained critical when implementing
PBIS in schools (Hemmelgarn, Glisson, & James, 2006). According to Bohanon, Flannery,
Mallory, and Fenning (2009), a continuum of interventions are needed to support students in
an effort to prevent them from dropping out of school. The authors concluded the embedment
of preventive strategies, such as PBIS, into the climate of schools could close the gap
between academic achievement and students’ discipline infractions while improving the
school climate and increasing the likelihood of graduation for all (Bohanon, Flannery,
Mallory, & Fenning, 2009).
Limitations
This study had the following limitations:
1. I used students’ performance data for ten high schools in one school district.
2. I examined the student performance outcome variables at the school level rather than at
student level because the level of implementation was determined at the school level.
3. I established the level of PBIS implementation using my own research objectives.
4. I used an ex post facto design to collect data from both state and district level
organizations.

10
Operational Definitions
This study was conducted in the state of Texas. Although the following terms may be
familiar to educators in Texas, some of these terms may have multiple interpretations. The
operational definitions for these terms were derived from PBIS literature, the Texas
Education Agency (TEA), and the Glossary for the Academic Excellent Indicator System
(AEIS) designed by TEA.
The Academic Excellence Indicator System (AEIS) was the annual report of
student performance data. The reports are available at the school and district level.
The Annual Dropout Rate was a percentage calculated by dividing the number of
students who did not complete school and did not return by the number of 9th
through 12th
graders who were in attendance for that school year.
The At-Risk student was one who met one of the criterions of the Texas Education
Code TEC 29.081. The data to make this determination came from the PEIMs
report of the school.
The Attendance Rate was calculated by dividing the total number of days students
were present during the school year by the total number of school days for that
year.
The Discipline Rate was a percentage derived from the number of discipline
incidents reported by the school divided by the student population of the school.
The Graduation Rate (Completion Rate I) referred to the percentage of students
who graduated, continued school after the graduation was expected, or received a
General Education Development (GED) certificate with their cohort.

11
The Level of PBIS Implementation was the concluding analysis of PBIS practices
as measured by the number of years of implementation, the presence and
composition of the PBIS implementation team, the composition of the PBIS motto
and matrix development team, the ongoing training and support of PBIS with the
staff and students of the school and the evaluation of the perception of staff
members of the effectiveness of the PBIS program on their campus.
Positive Behavior Interventions and Supports (PBIS) was a school-wide
behavioral program designed to set and teach appropriate student behavior
expectations.
The PBIS Leadership Team was a collection of stakeholders of the school. The
team was utilized to guide the staff and students through the implementation
process of the PBIS program concepts and practices.
The PBIS Matrix communicated the expected student behaviors in various
locations of the school i.e. the classroom, hallway, bathroom, bus, and cafeteria.
The statements were displayed in a chart form in student language in various
locations in the schools.
The PBIS Motto was the defined school-wide expectations of 3-5 positively
phrased statements which were designed to be short and embedded into the
culture and climate of the school. Many schools designed their PBIS Motto
around their school theme or mascot.
The PBIS Motto and Matrix Development Team was a collection of individuals
within the school who examined the discipline and academic student data of the
school then created a personalized PBIS Motto and Matrix based upon school

12
climate and culture to effectively communicate the student behavior goals of the
school to the students.
The PBIS Motto and Matrix Leadership Team was a collection of individuals
within the school who trained the staff on PBIS policies and procedures. This
team led the staff member through the initial training.
The Public Education Information Management System (PEIMS) was a state
database used to collect data from all Texas public schools.
The Texas Assessment of Knowledge and Skills (TAKS) was the Texas state
standardized assessment of student mastery of the Texas curriculum of students in
the areas of math, reading, science, writing, and social studies. The areas of
TAKS examined in this study were math and reading at the school level because
math and reading were the only subjects tested at each grade level. The tested
grade levels include ninth, tenth and eleventh grades.
The Texas Education Agency (TEA) is the educational administrative organization
for all Texas public schools.
Summary of the Introduction
An introduction to this ex post facto quantitative study designed to examine if there
are a difference among (1) the differing levels for implementation of PBIS and (2) PBIS and
non-PBIS high schools and the following student performance outcomes: (a) discipline
infraction rate, (b) math and reading TAKS pass rate, (c) attendance rate, (d) dropout rate,
and (e) graduation rate was presented in Chapter I. I also presented the (a) theoretical
framework for PBIS, (b) statement of the problem, (c) purpose and significance of the study,
and (d) initial research tasks and questions. I also included a listing of the operational

13
definitions used in my study, along with assumptions and limitations of the study. In
subsequent chapters, I explored literature related to the study, presented my methodology,
reported findings and results, and discussed the results of my study.

14
CHAPTER II
REVIEW OF LITERATURE
In this chapter, I provided a review of literature to support my record of study. My
study was designed to examine the differences between the implementation of Positive
Behavioral Interventions and Supports (PBIS) on aggregated student performance outcomes
of high school subjects, including graduation rate, across five years. I began the review with
an overview of the PBIS literature. The review of this literature included the theoretical
framework of PBIS and the evolution of the PBIS program from a special education practice
to a school-wide intervention. I also included literature on the influence of PBIS within
elementary, middle and high schools on student performance outcomes. This led to an
examination of literature on school climate and the high school context. I followed this
literature with an examination of factors influencing students’ decisions to leave high school
before completion as well as the impact of their non-completion. To conceptualize the study,
I closed the review with an overview of the No Child Left Behind Act (NCLB) and the
Response to Intervention (RTI) method of academic intervention followed by a review of
policy implementation.
Overview of Positive Behavioral Interventions and Supports (PBIS)
While conducting a comprehensive review of the PBIS literature, I noted key
elements of an effective PBIS school-wide program implementation. These elements were
found to be essential in the success of the program in multiple settings. In the early literature
of PBIS, the system was referred to as Positive Behavior Supports (Sugai & Horner, 2002a;
Sugai & Horner, 2006). As the concept of school-wide interventions grew, the name evolved

15
to Positive Behavioral Interventions and Supports (MDE, 2001; Muscott, Mann, Benjamin, et
al, 2004). The name has since evolved to School Wide Behavior Supports (Bradshaw,
Reinke, Brown, et al., 2008; Sugai, Horner, Algozzine, Barrett, et al., 2010; Flannery, Frank,
Kato, et al., 2013).
The PBIS framework was based upon amendments to the Individuals with
Disabilities Education Act of 2004 (Sugai & Horner, 2009). Drs. Sugai and Horner’s
framework provided consideration to students whose behaviors fell outside of acceptable
social norms and violated school codes of conduct (Sugai, Horner, Dunlap, Hienerman,
Lewis, Nelson, et al. 2000). For example, each student in special education settings had an
Individual Education Plan (IEP) to address educational needs. Sugai et al. (2000) adopted
this concept and applied Positive Behavior Supports and Functional Behavior Assessment to
all students in individual schools. They designed a systematic process for identifying
problem behaviors and events which reliably led to the occurrence of those behaviors; while
also designing a program to sustain non-behaviors over time (Sugai et al., 2000).
Critical to the success of a PBIS system was the adoption of a prevention-based
approach to behavior issues directed for the majority of students in a school, with specialty
prevention for those students considered at-risk, and highly specialized approaches for those
considered to have high risk behavior patterns (Sugai & Horner, 2002; Warren et al., 2006).
Sugai (2009) noted three key tiers of the PBIS framework (i.e., general student population, at
risk students and high-risk students). These tiers were not meant to become labels for
students, merely classifications for current types of behavior displayed by students. Thus,
interventions were used in specific cases for students across the three levels, dependent on
specific behaviors (Sugai, 2009).
16
By addressing behaviors immediately, even before official referral and placement, the
PBIS framework has the beneficial effect of causing minimal changes to a students’ learning
context (Carter & Sugai, 1989; Warren, et al., 2006). The PBIS framework, therefore,
referred to an inclusive system-wide school program designed to promote the deterrence of
discipline problems (Sugai et al, 2000; Sugai & Horner, 2000; 2002a; 2002b). Since practices
within the framework evolved from the special education program, a precursor was the
functional behavioral assessment, which strove to base decisions on solid evidentiary
foundations, (Sugai & Horner, 1999-2000; Sugai et al., 2000).
PBIS Concepts and Goals
One goal of the PBIS framework was to increase students’ performance outcomes,
such as academic achievement, social competence and preparation for adult work and career
responsibilities (Sugai et al., 2000; Sugai & Horner, 2002a; Warren, Bohanon-Edmonson,
Turbull, Sailor, Wickham, Griggs, & Beech, 2006). Practitioners (e.g., teachers and
administrators) within the PBIS framework began by defining desired outcomes and
consequences of student behaviors across multiple dimensions; adopting best-evidence
practices and curricula likely to facilitate those desired outcomes; making use of objective
data to determine decisions; and implementing necessary support systems to execute a PBIS
framework, including administrative support, school processes and routines. In effect, the
PBIS design had a focus on the prevention of behavioral issues through a proactive approach
to teaching children appropriate social behaviors (Sugai & Horner, 2002b).
The PBIS framework also included encouraging practitioners to utilize interventions
grounded in empirical evidence to effect change in students’ behavior (Sugai & Horner,
2002b; Sugai & Horner, 2009). The focus of the framework was on behavioral issues in five

17
separate domains: the individual student, within the classroom, outside the classroom in halls
and lunches, across the entire school and within the family and larger community. (Sugai &
Horner, 2009). Critical to the success of the framework was the need for teachers and school
staff to change their perspectives of students and to recognize the framework was not
designed solely for developmentally disabled students, all students could benefit from it.
PBIS in Different Contexts
The creators of the PBIS framework emphasized interventions specific to situations
and appropriate for students. Originally intended to help developmentally disabled
individuals, the framework has been employed to assist practitioners dealing with behavioral
issues in the general student population (Lassen, Steele, & Sailor, 2006). Looking at PBIS
across different contexts revealed combinations of state-wide, district-wide, and school-wide
practices. Many researchers of state- and district-wide studies used quantitative methods to
report results on the efficacy of the framework (MDE, 2001; Muscott, Mann, Benjamin, et.al,
2004). In contrast, researcher of school-wide studies were more likely to use either
qualitative or mixed methods to describe the influence of the framework in schools (Netzel &
Eber, 2003; Sagett, 2004; Guest, 2011).
PBIS at the State-Level
State practitioners offer different types of support in the PBIS framework, including
the basic informational training provided by the state of Missouri (Missouri Department of
Education, 2001). From a voluminous statewide perspective, Muller (2002) reviewed the
PBIS framework to determine what issues occurred. Muller found critical factors resulting
from statewide frameworks include (a) ensuring participation of all stakeholders (i.e., the
state teachers union, local educational agencies, social service agencies, and mental health
18
agencies), (b) providing appropriate assistance to local school districts on both a technical
and case management basis, (c) basing the statewide initiatives on PBIS types in terms of
reinforcing social behaviors, and (d) establishing a system to collect data to monitor results
and assess successes of the programs (Muller, 2002).
Resources made available by states for implementations of PBIS frameworks vary
considerably (Killu, Weber, Derby, & Barretto, 2006). In a study including responses from
stakeholders in 49 of 50 states, Killu, Weber, Derby, & Barretto noted the range of
information available from the states’ departments of education varies from none at all to
comprehensive. However, Killu et al. (2006) also noted having information available did not
ensure local districts and administrators would follow state guidelines, as these entities and
individuals generally had broad discretion to design and implement frameworks based on
local needs.
In 2007, Doolittle, Horner, and Bradley, conducted a survey of individuals from the
state department of education in all 50 states, plus the District of Columbia, to determine the
number of states implementing the social behavior goals and elements found in the PBIS
framework. The state initiatives measured in their study included (a) character education, (b)
school safety, (c) positive behavior support, and (d) professional development to support
initiatives, and (e) community/school joint behavior programs. In their study, the authors
found character education to be the most common initiative implemented across the 50 states
and District of Columbia (Doolittle, Horner, & Bradley, 2007).
PBIS at the District-Level
Research on the PBIS framework specifically focusing on district level
implementation was limited. Green (2009) studied a district-wide implementation of PBIS

19
and found certain key accomplishments had positive impacts on students’ outcome
performances. Characteristics of the framework included both a unified approach across all
schools at all levels and a common language across all schools. When a unified approach
occurred, Green noted decreased disciplinary referral; increased teacher presence in the
hallways, increased educational time and decreased inappropriate behaviors. In order to
accomplish this, however, the district administration made a firm commitment to
implementing the PBIS framework (Green, 2009).
PBIS at the School Level
In a large number of PBIS studies, the focus was on a school-wide context. Hagan-
Burke, Burke, and Sugai (2007) detailed specific interventions for working with students and
in classrooms, in order to maximize student’s on-task focus when faced with challenging
tasks. These authors used an alternating treatment methodology to confirm the effectiveness
of interventions and found strong support that these interventions did impact a student’s
ability to stay on task (Hagan-Burke, Burke, & Sugai, 2007).
Although researchers of the PBIS framework had well-documented successes in
elementary and middle schools, Sugai (2009) noted documentation of success in high schools
is limited, though anecdotal evidence exists for improvements at this level. In a study on the
implementation of the PBIS framework in a specific school over a period of four years,
Lassen, Steel, and Sailor (2006) reported implementing the framework school-wide produced
significant reductions in middle-school students’ inappropriate behaviors and sustained
change over time.
As reported earlier, Bohanon et al. (2009) studied the impact of PBIS on school
completion rates. The authors listed key differences in high schools compared to elementary

20
and middle schools, including (a) age of the students, (b) larger student populations, (d)
larger campus size, and (e) organization by subject area (e.g., English, Mathematics, and
Science). Sugai (2009) noted these differences in student populations, school size, and
organization structure warranted additional study of the influence of the framework in high
school settings.
PBIS and School Climate
Schools with effective discipline behavior intervention programs must be firm and
caring (Sugai et al., 2000). Multiple authors on PBIS research supported the view that when
applied school-wide, the implementation of PBIS frameworks reduce behavioral issues and
improved learning climates of schools (Lassen, Steele, & Sailor, 2006; Sugai & Horner,
2006). The School-wide Evaluation Tool (SET) was a measurement instrument used to
determine key criteria for school-wide PBIS frameworks, specifically: (a) existence of
behavioral expectations across the school; (b) teaching of expectations to all students; (c)
reward system for students complying with expectations; (d) consequences for students not
complying with expectations; (e) monitoring of student data used to determine decisions; and
(f) supporting practices of school administrators and school board members for the
framework (Horner et al., 2004; Lassen, Steele, & Sailor, 2006). The use of SET in a PBIS
framework required two to three hours of evaluation by an outside observer trained in PBIS
(Davis, 2011). Davis questioned, however, as to whether SET was a reliable tool in the
evaluation of school implementation of PBIS.
In a New Hampshire study, Muscott, Mann, Bejamin, Gately, Bell, and Muscott
(2004), showed positive results in most schools at the multi (75%), elementary (62%), and
middle school (50%) levels, but none of the high schools in the study successfully
21
implemented at least 80% of the PBIS framework. The authors offered no real explanation
for why success was not achieved at the high school level (Muscott, Mann, Bejamin, Gately,
Bell, & Muscott, 2004). Guthals (2009) investigated a similar study in Montana in which the
relationship of PBIS framework was studied along with its effect on students’ achievement,
problem behavior, and administrator stress. Lower administrative stress levels were found
with increased implementation of PBIS interventions (Guthals, 2009). Guest (2011) found
properly implemented PBIS frameworks have had a positive impact at the high school level
on students’ performance outcomes.
The more recent literature of Sugai, O’Keefe, and Fallon, 2012, took into
consideration the context of implementing PBIS in culturally and linguistically different
populations. These authors determined there was a need to adapt the practices of PBIS to
meet the needs of a differentiated school population. The proactive approach of developing
school-wide behavior expectations would be further enhanced by considering the needs of
culturally and linguistically differing students within a common school culture (Sugai,
O’Keefe, & Fallon, 2012).
PBIS and the Level of Implementation
Netzel and Eber (2003) documented results from a state-wide implementation of a
PBIS framework in Illinois., In their research, the authors noted the (a) necessity of
establishing school and district buy-ins and follow-through; (b) adaptation of the framework
to local needs and responses; (c) need to establish a communal philosophy within schools;
and (d) forging long-term commitment from school and district personnel (Netzel & Eber,
2003).
22
PBIS was not designed for short-term use; instead, the program requires a long-term
commitment from school officials over several academic years (Sugai & Horner, 2009).
Bradshaw, Reinke, Brown, Bevans, and Leaf, in 2008, reported on experiences of school
officials after implementing the program. The authors noted the critical importance of
initiating the program with an initial system evaluation and continual evaluation on a regular
basis. Each evaluation allowed officials to monitor progress and identify which components
of the program are proving effective (Bradshaw, et al., 2008).
Further confirmation of the effectiveness for the program was found in a study of a
multilevel PBIS implementation in Maryland schools (Barrett, Bradshaw, & Lewis-Palmer,
2008). The authors investigated 467 schools, with officials specifically trained in PBIS. The
researchers indicated that the results suggest the state has produced a mechanism effective
for generating a high-quality implementation for the program (Barrett et al., 2008). Another
study, a longitudinal study of schools implementing PBIS programs nationwide, was
conducted by Bradshaw, Koth, Thornton, and Leaf in 2009. The authors reported the PBIS
program had a significant positive impact on a variety of measures for the health of schools
(Bradshaw, Koth, Thornton, & Leaf, 2009). The authors also noted schools with faster
implementations of the program tended to begin from a higher organizational health in initial
stages, but those taking longer to implement the program showed greater improvements in
student performance outcomes.
Although PBIS models had been widely adopted, widespread adoption of these
models is no guarantee of success. Lindsey (2008) noted, for example, that the Drug Abuse
Resistance Education (DARE) program was widely adopted in the 1980s but was also
demonstrated to be ineffective. In contrast, PBIS, although adopted by a large number of
23
schools nationwide, has been far from universally implemented. Lindsey stated that
innovative models diffusing into broad use typically have five key characteristics: (a) a
relative advantage over other models, (c) compatibility with existing models (c) complexity
or perceived sophistication with greater complexity implying slower innovation adoption (d)
the ability to be established and tested on a trial basis, and (e) advantages to observers
(Lindsey, 2008). Lindsey showed in the research that PBIS has many of these characteristics,
but lacks complexity and ability to be established and tested on a trial basis.
PBIS and Student Performance Outcomes
There was a correlation between the school-wide number of office discipline referrals
(ODRs) and higher levels of inappropriate behavior within schools (Irvin, Tobin, Sprague,
Sugai, & Vincent, 2004). With respect to the impact of PBIS on school completion rates,
Bohanon, Flannery, Malloy, and Fenning (2009) studied the benefits of PBIS
implementations in the high school settings, specifically students with high-incidence
disabilities. The authors noted inappropriate behaviors and ODRs were associated with lower
school completion rates (Bohanon, Flannery, Malloy, & Fenning, 2009).
The PBIS model was based on available empirical evidence used to identify, design,
monitor, and assess interventions used in PBIS (Clonan, McDougal, Clark, & Davison,
2007). Clonan et al. found that the data assisted implementers in defining what kinds of
interventions were most likely to be effective for specific behavior problems. One such data
item commonly used was the number and types of ODRs. These data were readily available
and some evidence existed that the number of ODRs were related to poor student outcomes,
including failure to graduate (Clonan, et al., 2007). In PBIS, these data were to be viewed in
several ways, including (a) the overall number of ODRs in a period of time, (b) the types of

24
infractions represented by the ODRs, (c) the locations or settings in which ODRs occur (i.e.,
cafeteria, for example), and (d) the ODRs by student or by staff member. Such data provided
insight to guide development of the PBIS model and monitor success in improving students’
behavior.
McIntosh, Campbell, Carter, and Zumbo (2009) found a strong association between
ODRs and external behaviors, but no significant correlation between ODRs and internalized
issues, perhaps because internalized issues rarely result in referrals to the office. Still,
correlations existed between ODRs and students’ inappropriate behaviors as well as student
negative attitudes and classroom issues, such as orderliness and safety (McIntosh, Campbell,
Carter, and Zumbo, 2009).
PBIS has also been investigated as a correlate to other measures of student success,
including: (a) school attendance, (b) ODRs, and (c) scores in math and reading achievement
on high-stakes tests (Postles, 2011). In a three year longitudinal study, researchers compared
students from two middle schools which had implemented PBIS and two similar middle
schools which did not implement PBIS. Postles showed no significant correlation between
the measures of student success and PBIS (Postles, 2011).
Variables that Influence Students to Leave School Prior to Completion
Researchers have spent considerable time studying variables associated with students’
decisions to leave school prior to completion. These variables often relate to student
characteristics (e.g., ethnic or racial background, gender, or socio-economic status),
discipline, and academic performance. Ensminger and Slusarcick (1992) reported on a
longitudinal study for a cohort of urban Black first grade through high school students at high
risk for school dropout. More than half of students with school records for misappropriate

25
behavior failed to graduate. Within the cohort of students, their choice to dropout was
associated with male first-grade characteristics such as aggressive behavior and poor grades.
The authors further concluded economic status was less important for those students
classified as socio-economically disadvantaged, or having a mother who did not graduated
from high school. In addition, the authors found having an intact parental family with mother
and father exhibited positive influence on girls and predicted successful graduation
(Ensminger & Slusarcick, 1992).
Driscoll (1999) studied the risk of failing to complete high school among both
immigrant and native Hispanic youths. Beginning a study with eighth grade students, the
researcher followed a cohort for four years to determine completion rates. The researcher
determined second generation eighth grade students were more likely to complete high
school while both first and second generation Hispanic youths were more likely to complete
high school if they successfully completed one year of high school. Other factors impacting
the likelihood of dropping out for these students included family expectations, family
income, and past academic performances (Driscoll, 1999). Griffin (2002) noted a key
predictor of success in high school was whether or not students engaged in the learning
process. In a study comparing Black and Hispanic students with White and Asian students,
Griffin found Black and Hispanic students placed much less importance on educational
success when deciding whether to dropout or continue their education (Griffin, 2002).
The National Dropout Prevention Center (2007) identified a number of risk factors
for students’ failure to complete high school. The researchers primarily focused on two areas:
the individual and the family (Hammond, Linton, Smink, & Drew, 2007). While these factors
can be further delineated, Hammond, Linton, Smink, and Drew summarized these factors as:

26
(a) presence of an emotional disturbance or learning disability; (b) heavy adult
responsibilities or parenthood despite youth; social attitudes values and behaviors; (c) low
achieving academic performance; (d) low engagement with the school, as typified by poor
attendance, low expectations, refusal to make an effort, and so on; and (e) poor social
behavior at school. Hammond et al. noted important sub-factors (a) low socioeconomic
status, (b) highly mobile family, (c) low parental education, (d) multiple siblings, (e) single
parent or step-parent family, (f) disrupted family, (g) low family expectations, (h) a sibling
who did not complete high school, and (i) little parental engagement with school activities as
variables leading to students’ leaving school before graduation.
The Discipline Gap
In a study on antisocial behavior in schools, Mayer noted a number of factors
associated with students’ increased antisocial behavior (Mayer, 1995). Mayer identified
factors associated with discipline, including (a) attempts to deter criminal behavior by harsh
penalties; (b) abusive family relationships; (c) poor and/or inconsistent parenting skills; (d)
participation in peer and social groups with an antisocial tendency; (e) low involvement in
the school, as shown by poor attendance, (f) failure to do homework or participate in after-
school activities; (g) lack of clarity in explaining school policies or consistency in
enforcement; and (h) weak or inconsistent support of teachers by administration, with
students’ failure to complete high school. When such factors are common in schools, Mayer
concluded discipline would be a problem as well.
Skiba and Peterson (2000) similarly noted the negative impact of zero-tolerance
policies on resolving behavior issues because such policies resulted in removing students
from the classroom instead of correcting the behavior. Skiba, Michael Nardo, and Peterson
27
(2000) noted the evidentiary support for the influence of low socioeconomic status with
overrepresentation of disciplinary actions is less robust than issues of gender and race.
In 2002, Webb-Johnson reported that African-American learners often display
culturally socialized behaviors different from their classroom teacher and therefore
disproportionally receive office discipline referrals. In turn, these students of color were
removed from the learning environment more often and were not taught the skills necessary
to support their academic success (Webb-Johnson, 2002). To curtail this pattern, teachers of
African-American youth would benefit from culturally diverse professional development.
Given this clear evidentiary support for the notion that students of color were
disproportionally disciplined in school, the question arises as to why that was the case.
Monroe (2005) addressed reasons for this disparity. Monroe noted most education policies
reflect perspectives of those creating policy and as White-middle-class professionals inhabit
most policy making positions in the U.S. education system, their perspectives tend to
dominate. For example, while disrespectful and disobedient actions in a Midwestern school
were the most common factors for referrals, White teachers frequently interpreted behaviors
by Black students as being disrespectful and disobedient even when students did not intend
such behavior; this cultural disconnect between teachers and students was a common issue
identified by Monroe (2005). Furthermore, the current trend toward zero-tolerance for school
discipline—present in 94% of schools in Monroe’s study—appears to generate more
unintended consequences rather than resolving behavior issues (Monroe, 2005).
MacPherson and Carter (2009) noted disciplinary referrals were increasing in schools
across the country, implying a new approach to discipline within the school context.
MacPherson and Carter proposed a theory of academic optimism defined by three key

28
elements, including teachers having a sense of self-efficacy; teachers trusting both their
students and parents of students; and teachers creating student-centered classrooms focused
on high academic achievement for all students. Although a positive approach, the authors
referenced prior research and noted the need for further research into this approach for
improving classroom discipline (MacPherson & Carter, 2009).
Davis (2011) also reported that the number of suspensions in school not only
excessively impacted Black students, but also results in a significant loss of instructional
time, thus setting these students even farther behind classmates and leading to higher dropout
rates. Davis further reported, behaviors resulting in suspension or expulsion from school not
only reduced the total instructional time, but also reinforced the antisocial behaviors causing
disciplinary actions. Davis also found students of color were more likely to drop out of
school than other students. Although the study primarily focused on students of color, it
yields insight to dropout factors for all students (Davis, 2011).
The Academic Gap
An increasingly popular strategy to address the academic gap has been retaining
students at grade level. Jimerson (2001) performed a meta-analysis of research on the
effectiveness of student retention. The results of the author’s review of seventeen studies
noted that repeating a grade level rarely addressed the factors that caused the student to fail at
that grade level the first time. Thus, such students may require additional interventions to
help overcome deficits associated with factors linked to grade retention, including (a) low
socioeconomic status, (b) single-parent household, and (c) lower cognitive measures
(Jimerson, 2001). Longer term, Jimerson found that repetition of a grade did not assist
retained students, instead, holding students back in elementary school was associated with
29
dropping out of high school. Rather than grade retention, Jimerson suggested policy makers
consider studies in which more effective techniques including (a) providing mnemonic
strategies to children at risk, (b) enhancing students’ reading comprehension, (c) using
behavior modification and cognitive behavior modification techniques, (d) providing direct
instruction, (e) providing formative evaluation of children at risk, and (f) ensuring early
intervention for inappropriate behaviors are identified. In a follow-up review of seventeen
studies, Jimerson, Anderson, & Whipple, (2002) found grade retention provided a powerful
predictor for students’ dropout status.
More recently, Sirin (2005) performed a meta-analysis on the impact of
socioeconomic status and academic achievement. Sirin identified a significant relationship
between these two measures, but a relationship slightly smaller than found in an earlier
similar 1982 study. In particular, the author found that when funding and other focus was on
schools, rather than specific students, the impact of socioeconomic status was much higher.
Disparities in funding between richer and poorer areas were also noted as determinants of
that relationship (Sirin, 2005).
Further support for grade retention as a predictor of dropping out came from Roderick
(1994), in which grade retention during grades one through six in a longitudinal cohort of an
urban school system was shown to substantially increase the odds of students dropping out of
school. The author noted that retaining students for one grade after the sixth grade led to
disengagement during middle school and failure to complete high school (Roderick, 1994).
Roderick, in contrast with the Jimerson (2001) meta-analysis, showed retention of students in
elementary grades had little relationship with students’ high school graduation rates.
However, Jacob and Lefgren (2009) found retaining students in eighth grade significantly
30
increased the likelihood of students not completing high school. These authors noted
interventions can have significant broad-scale impacts beyond those they attempted to
address directly. Jacob and Lefgren provided a more recent study of the impact of retention
on students’ high school completion. Understanding the grade and social contexts of such
interventions was important in determining the most effective strategies to ensure effective
education of all students (Jacob & Lefgren, 2009).
Still, the impact of grade retention was controversial. Allen, Chen, Willson, and
Hughes (2009) performed an extensive meta-analysis of studies conducted on the effect of
retention on students’ future performance. In their analysis, the greatest negative impact of
grade retention occurred in studies having a weak study design in terms of controlling for
non-equivalences between retained and non-retained students. In other words, evidence for
medium to large effect of retention primarily occurs in studies with poor equivalency. By
contrast, studies with better quality design and equivalency between retained and non-
retained groups showed virtually no statistical significance between achievement levels of
retained and non-retained children (Allen, Chen, Willson, & Hughes, 2009).
School Climate Issues
Bryk and Thum (1989) explored the impact of internal differentiation and normative
environments on both absenteeism and failure to complete schooling. The organization and
structure of schools had an important influence on students who did not complete high
school. The authors hypothesized that a high degree of internal differentiation and a low
normative environment contributed to increased absenteeism and greater levels of dropouts.
Using a national database, the authors modeled absenteeism and failure to complete
schooling. The results of the analyses supported the authors’ hypotheses and indicated less
31
absenteeism and lower dropout rates when there was less differentiation in the school
population and when there was a higher normative environment. Furthermore, other variables
improving student results included having a teaching staff engaged with the students in a
school where discipline was perceived as both fair and effective (Bryk & Thum, 1989).
Social factors have been shown to affect the success of students in school. For
example, Pong (1997) noted that students from single-parent families or from step-families
have negatively impacted achievement in schools, even after controlling for demographics
and family background characteristics. Pong found, however, that establishing strong
parental networks within the school in part alleviated the impact of single-parent families and
step-families (Pong, 1997). Monroe suggested encouraging teachers to develop greater
cultural awareness, develop and implement culturally aware disciplinary policies, expand the
discussion around disciplinary issues, and improve the quality of instruction to make it more
engaging to the students (Monroe, 2005).
Christenson and Thurlow (2004) gave evidence to support the concept that effective
interventions to reduce dropouts cannot be a one-size-fits-all prospect, but instead must be
individualized to some extent. These authors proposed a school culture which identified at-
risk students and devised an intervention strategy designed to address the specific issues of
each student and to ensure that the student remained engaged with school (Christenson &
Thurlow, 2004).
The Residual Effects of Leaving High School Before Completion
The residual effects of leaving high school before completion included issues related
to work record, transition from school to work, wages, learning disabilities, and prison. In
1987, Rumberger speculated on how well high school dropouts would fare in future job

32
markets. Rumberger concluded high school dropouts faced a dismal future in the job market.
One key factor identified by Rumberger was the work record (Rumberger, 1987).
Specifically, Rumberger and Weiss (1988) noted young workers who were high school
dropouts also quit jobs frequently and tended to have weaker work records (Rumberger &
Weiss. 1988).
Why students who did not complete high school could not find jobs was addressed by
Rosenbaum, Kariya, Settersten, and Maier (1990). These authors investigated four theories,
including: (a) segmented theory, in which employers ignore the skills of youths; (b) human
capital theory which asserts youths’ unemployment is due to their own deficiencies; (c)
signaling theory, which claims the economic costs of identifying the skills and abilities of
youths is too high; and, (d) network theory, which asserts that information from a trusted
social network source is more effective and believable (Rosenbaum, Kariya, Settersten, &
Maier, 1990). Rosenbaum et al., in particular, looked at institutional networks between
employers and schools. The authors noted these networks, in most industrialized nations,
were effective mechanisms for improving the ability of youth to find jobs after high school
(Rosenbaum, Kariya, Settersten, & Maier, 1990).
Murphy and Welch (1992) noted having a college education increased the earnings
per hour of men by 44%, and having more work experience increased hourly income by 75-
85%. The conclusion was clear, getting more education and working consistently through the
years provides greater economic rewards to students (Murphy & Welch, 1992).
A further issue related to student dropout was learning disabilities. Wagner and
Blackorby (1996) cited statistics from the National Longitudinal Transition Study of Special
Education Students (NLTSSES) which found 30% of disabled students dropped out of high

33
school and 8% dropped out of school before entering high school. Typically, such students
stayed in school until they were 18 years old, but had earned fewer than half the course
credits needed to graduate. In studying these students, Wagner and Blackorby found those
students having strong concentration of courses in some type of vocational training were
more likely to find employment. In addition, those students with speech or learning
disabilities came closest to achieving the employment rates for the rest of the population.
Perhaps most importantly, students with learning disabilities had a higher probability of
being poor (Wagner and Blackorby, 1996).
Nearly two percent of all adult males were incarcerated in prisons throughout the
U.S., a near-doubling in only ten years (Katz, Krueger, Burtless, & Dickens, 1999). (Katz,
Krueger, Burtless, and Dickens, noted that because of this increase, the low unemployment
rates of the 1990s might have been partly illusory because prison inmates were not counted
in those statistics. (Katz, Krueger, Burtless, and Dickens, stated that economic researchers
consistently demonstrate that students with at least a high school degree were less likely to be
incarcerated in the prison system ((Katz, Krueger, Burtless, & Dickens, 1999).
These issues underlined the need to have every young person graduate from high
school. Completing high school remained the single most significant step to acquiring a
productive adulthood, a higher education, career and business success, and the foundation to
the wealth building capacity experienced by the majority of Americans (Weiss, 1988).
Successful completion of high school is an early predictor of a person’s achievement level
within the society (Graves, 2009). Once students drop out of high school, their economic
paths diverge drastically from educated counterparts, and regaining that foothold in the job
market becomes substantially more difficult as the years pass (Graves, 2009a; Foss, 2010). In
34
2011, the job market for high school dropouts bore out Rumberger’s predictions. Students
who dropped out of high school were far less able to find jobs compared to their peers; those
that did find jobs encountered higher and more prolonged rates of unemployment and
underemployment when compared to their counterparts with more education (Foss, 2010).
No Child Left Behind Act (NCLB) and the Response to Intervention (RTI)
The authors of the NCLB Act highlighted the achievement gap between white and
minority students. As a result, school officials have developed links between assessment and
instruction referred to as response to intervention (Demski, 2009). RTI, as defined by
Demski, was a framework identifying at risk students and using data to design educational
programs which best meet students’ needs. Educators were able to structure RTI within a
basic three tier structure. Tier 1 was research-based classroom instruction meeting the needs
of 80-85% of students. Tier 2 was a more intensive approach reaching approximately 10-15%
of students. Finally, Tier 3 was a special education service addressing the needs of the
remaining 5-10% of students. Fuchs and Fuchs (2006) characterized RTI as a multitier
academic intervention intensifying as students move up the tiers within the intervention.
A purposeful design was utilized to align concepts of PBIS with those of RTI. To
begin, school-wide expectations were established for all students. Then, as students displayed
needs, either targeted or intense supports were put into place (Fuchs & Fuchs, 2006). As
students move up the continuum of support, the design of supports for students’ achievement
became more personalized (Sugai & Horner, 2000). The supports moved from general or
universal to a targeted, student specific approach. Consequently, a more intensive support
was designed for a small student population (Fuchs & Fuchs, 2006).

35
Policy Implementation
In studies of urban populations, improvement for schools more often focused on
setting high standards for teachers’ performance rather than on students’ performance on
high stakes tests (Darling-Hammond, 2000). Thus, Darling-Hammond concluded policy
implementation strategies should focus more on encouraging quality teaching than high-
stakes tests. Other recommendations for implementation included: a focus on students
learning core concepts and relevant skills for modern economic success, use of standards-
based testing to improve teaching, and focus on improving teacher quality at all levels
(Darling-Hammond, 2000).
Darling-Hammond (2004) noted the current emphasis on new standardized testing as
a means of evaluating students and schools severely punished schools and led to less access
to educational opportunities. Darling-Hammond proposed several strategies for improving
this situation, including: (a) equalizing resources across all schools, (b) establishing standards
for students’ opportunities to learn , (c) modernizing curricula in low-socioeconomic area
schools, and (d) investing in quality teaching (Darling-Hammond, 2004).
According to Cohen, Moffitt, and Goldin (2007), well-designed policies contained the
resources, incentives and oversight needed to shape practice. The authors reviewed the
relationship between policy and practice in public education. For these authors, policy
depended on practice. The authors cited the source of conflict between policy and practice as
the gap created between ambitious policy aims and the lack of resources available for
implementation. To manage the dilemma of putting policy into practice, Cohen et al. (2007)
offered four factors of actions and resources: (a) aims, (b) instruments, (c) capacity, and (d)
environment. Aims are used to identify desired outcomes from policy implementation.
36
Ambitious aims required practitioners to move from traditional methods of instructions and
assessment (Cohen et al., 2007). When aims were not clearly defined or ambiguous, the lack
of clarity allowed practitioners to interpret policy on an individual basis. This individual
interpretation hindered effective policy implementation. Instruments were the resources
provided by policy makers to aid in the implementation of the policy. Such resources may
include money, mandates for action, incentives to comply, flexibility to adapt policy with the
local conditions, and ideas that inspire or inform implementers’ understanding and actions.
Capacity was the resource practitioners offered to aid in the implementation process. Those
resources may have included knowledge, values, and skill along with intrinsic resources such
as will. The environment itself to which the policy must be implemented contributed to the
results of the policy (Cohen et al., 2007).
The pressure on teachers to improve student academic performance and social
behavior has also led to greater interest in monitoring teacher performance in the classroom.
For example, Colvin, Flannery, Sugai, and Monegan (2009) identified a format for observing
classroom performance focused on three variables: (a) instructional setting of classrooms, (b)
instructional practice of teachers, and (c) behavior of students in the classroom. Using these
variables, the authors provided specific feedback to teachers in specific situations and
conditions under which poor performance occurred. After teachers made appropriate
changes, the researchers noted students were more engaged in instruction and the amount and
severity of inappropriate behavior had substantially reduced (Colvin, Flannery, Sugai, &
Monegan 2009).
37
Hypotheses of the Study
In an effort to curtail discipline and improve students’ performance outcomes, many
school districts adopted the PBIS framework to expose students to social skills (Demski,
2009). In my study, I analyzed the differences between the differing levels of PBIS
implementation on student performance outcomes in ten high schools within one school
district across five years. In my hypotheses, based upon the a review of literature, (a) there
should be significant differences in the students’ performance outcomes in high schools
associated with the level at which PBIS was implemented in the high school across the years
of the study and (b) there should be significant differences in the students’ performance
outcomes in high schools in with PBIS implementation as compared to those high schools
without PBIS implementation.
Summary of the Review of Literature
In this chapter, I reviewed literature related to the PBIS framework, high school
dropout variables, and residual impacts related to dropping out of high school along with
legislative initiatives and policy implementation. First, I discussed the PBIS framework,
including concepts and goals of the framework. I then explored the influence of the
framework on students’ performance outcomes within various contexts. In terms of the
academic gap for dropout students, a key issue was whether students had experienced grade
retention. I also explored the impact of dropping out, noting that students failing to complete
high school suffer significant economic and career setbacks. Background information on
NCLB and RTI was given to support the need for effective school-wide behavior and
academic support programs. Finally, hypotheses were developed from the evidentiary
38
literature presented. In the following chapter I discussed the methodology used in my study,
including the research design, research questions, and data collection and analysis sections.

39
CHAPTER III
METHODOLOGY
The purpose of this quantitative study was to analyze the differences of student
performance outcomes for ten high schools with differing levels of PBIS implementation.
The measured student performance outcome variables were the discipline infraction rate, the
math and reading academic performance rates, the attendance rate, the dropout rate, and the
graduation rate across five years. I organized this chapter to explain the methodology utilized
to accomplish the initial research tasks and answer the research questions in the following
manner: (a) design of the study; (b) state, district, and school environments; (c) variables
examined; (d) instruments; (e) data collection; and (h) data analysis. The following initial
research tasks and questions were addressed:
Initial Research Tasks
1. To determine the implementation level of PBIS at each high school based upon the
following criteria:
a. The duration of PBIS practice.
b. The composition of PBIS leadership team.
c. The composition of PBIS motto and matrix development team.
d. The initial PBIS training.
e. The ongoing PBIS training and support.
f. The perception of the staff members regarding the effectiveness of the PBIS
practices.
40
2. To categorize each high school into one of four PBIS implementation levels (high,
moderate, low, or none).
Research Questions
1. Is there a difference in the aggregated student performance of high schools with
differing levels of PBIS implementation on the following selected outcome variables:
a. The discipline infraction rate?
b. The math TAKS pass rate?
c. The reading TAKS pass rate?
d. The attendance rate?
e. The dropout rate?
f. The graduation rate?
2. Is there a difference in the aggregated student performance of PBIS high schools and
non-PBIS high schools on the following selected outcome variables:
a. The discipline infraction rate?
b. The math TAKS pass rate?
c. The reading TAKS pass rate?
d. The attendance rate?
e. The dropout rate?
f. The graduation rate?
Design of the Study
I employed an ex post facto quantitative research design in this study (Gall, Gall &
Borg, 2007). Existing data were used to analyze the difference among highs school with
differing levels of PBIS implementation on discipline infractions, math and reading academic

41
performance, attendance, dropout, and graduation rates of ten high schools within one school
district. The ex post facto research design was purposeful because I did not manipulate the
PBIS variable to affect the student performance outcome variables (Gall, Gall, & Borg,
2007). Thus, through the usage of the ex post facto study design, I did not choose the year for
which the schools implemented the PBIS program or influence the level of PBIS
implementation within each school. The nature of the study design allowed me to draw on
the casual inferences needed to address the initial research task and answer the research
questions posed as definitively as possible.
State, District and School Environments
The State
The selected district was located in the state of Texas. In 1993, the Texas State
Legislature mandated the creation of a public school accountability system for rating and
evaluating school districts and campuses. As a result, public schools in the state of Texas
received administrative leadership, resources and guidance from the Texas Education
Agency (TEA). There were many responsibilities of TEA to the public schools of Texas.
Some of the responsibilities of TEA included the development of the state-wide curriculum,
the administration of the state-wide assessment of the curriculum, the management of a state-
wide data collection system along with the rating of schools under the state-wide
accountability system (TEA, 2011).
Information gathered for my study on the aggregated student performance data of
each high school was obtained from a state-wide data-base, the Public Education Information
Management System (PEIMS). TEA representatives organized the information from PEIMS
and displayed the information into an annual Academic Excellence Indicator System (AEIS)

42
report for each public district and school. The information was published and made
assessable to the public through the TEA website, http://www.tea.state.tx.us/ (TEA, 2007;
TEA, 2008; TEA 2009; TEA, 2010; TEA, 2011; & TEA, 2012). The definitions for all terms
used on the AEIS reports were found in the AEIS Glossary for each school year and accessed
through the TEA website as well (TEA, 2007; TEA, 2008; TEA 2009; TEA, 2010; TEA,
2011; & TEA, 2012).
The District
A convenience sample of one school district allowed the researcher to compare ten
high schools that operated within a unified structure (Creswell, 2003). The setting of this
study was a large suburban public school district in the southeast region of Texas. The ex
post facto design of the study utilized existing data from the school district and TEA. The
district data were acquired from the various departments of the school district and the TEA
website. The values of the examined aggregated student performance outcome variables were
collected in yearly intervals over a period of five school years, 2006-2007 through 2010-
2011.
TEA classified each Texas school district into one of the following categories: major
urban, major suburban, other central city, other central city suburban, independent town, non-
metropolitan: fast growing, non-metropolitan: stable, rural, and charter school districts. The
selected district exhibited qualities of two classifications; major urban and major suburban.
According to the TEA definitions, a major urban district was located in a county with a
minimum population of 775,000, contains at least 75% of the student in that county enrolled
in the public school, and services at least 35% of the student population that was considered
economically disadvantaged (TEA, 2011). A major suburban district was defined as a

43
district that did not meet the criteria of a major urban, was in close proximity to a major
urban district or in the same county of a major district, and its enrollment is at least 3 percent
that of the neighboring major urban district or at least 4,500 students (TEA, 2011).
During the last year of this study, the selected district was the 2nd
largest in the
county, the 3rd
largest in the state, and the 25th
largest in the nation (American School and
University, 2011, as cited by the selected district, 2011). Over the last several years, the
district had experienced a tremendous amount of growth. Since 2000, the district added 32
new campuses. By the conclusion of the 2010-2011 school year of this study, the district
operated 83 campuses: 52 elementary, 16 middle schools, 11 high schools, and 4 special
program facilities.
As of the last year of the study, 2011, the selected school district possessed the
characteristics of a major urban district as defined by TEA. It was located in a county of
more than 775,000 residents and serviced 46.5 % economically disadvantaged students
(TEA, 2011). However, TEA guidelines only allowed one major urban district per county.
Therefore, since the selected district was located within the same county as a major urban
district with a larger population; it was classified as a major suburban district (TEA, 2011).
The Schools
As mentioned earlier in this chapter, the school district operated eleven high schools.
However, only ten of the eleven high schools met the criteria of this study through the
utilization of a comprehensive curriculum for ninth to twelve grade students. The excluded
high school serviced eleventh and twelfth grades only and did not offer the comprehensive
curriculum that was found in the evaluated ten high schools.

44
The sampling procedure was purposeful in nature. The students enrolled in the ten
high schools within the sample district were the sources of the aggregated student
performance data at the school level (Warner, 2013). The observed high schools were coded
as HS 1, HS 2, HS 3, HS 4, HS 5, HS 6, HS 7, HS 8, HS 9, and HS 10. By comparing the
data of the high schools with differing levels of PBIS implementation, the results of the study
may yield evidentiary results which educators at the state, district, and campus levels may
draw conclusions regarding the effect of application of PBIS on student performance
outcomes at the high school level.
Variables Examined
The aggregated student performance outcomes of high school students grouped into
ten high schools in one Texas school district were analyzed in this study. The study included
PBIS and non-PBIS high schools.
The Independent Variables
The level of PBIS implementation within each high school was an independent
variable. I evaluated the level of PBIS implementation of each high school in Initial Research
Task 1. The resulting evidence collected from Initial Research Task 1 yielded the
categorization of each high school into quantified nominally ranked implementation levels;
high, moderate, low, or none in Initial Research Task 2. The second independent variable
was time. The schools were evaluated over the span of 5 years (2007-2011).
The Dependent Variables
The aggregated student performance outcomes examined were the discipline
infraction rate; the math and reading academic performance pass rates; the attendance rate;
the dropout rate, and the graduation rate. These variables were continuous in nature. The
45
academic pass rate on the math and reading portions of the TAKS, attendance rate, dropout
rate, and graduation rate were recorded as a percentage related to the student population of
the school. The variable values were obtained from the AEIS report of each high school
through TEA. The student performance rates of each high school were recorded for each year
of the study.
During the evaluated years of this study 2006-2007 through 2010-2011, the indicators
used by the state to rate schools varied. Although there were variations in the indicators the
state used to rate the districts and schools, the variables observed throughout this study were
reported each year. These performance indicators were submitted by each school to TEA
through the PEIMS system.
The numbers of student discipline infractions were not accessible through TEA.
These values were obtained from the Department of Informational Services of the school
district. The district-wide student behavior expectations were defined in the student
handbook and code of conduct of the school district. For the purposes of this study, the
recorded number of discipline infractions included student behavior offenses which
interfered with classroom instruction such as excessive talking and inappropriate interactions
with peers and adults. The infraction number excluded offenses such as tardy to class or
placements to the discipline campus. The tardy infraction was excluded because it fell under
the attendance policy; therefore, the consequences were not clearly defined by the student
code of conduct policy of the district. According to the Department of Student Services of the
selected district, the schools used a high rate of variability when reporting tardy infractions;
therefore, the Department of Student Services did not include these values in their PBIS
report to the district. With regards to the exclusion of the discipline placement count, the
46
student behaviors which resulted in the discipline placement were a part of the discipline
infraction number. Including the discipline placement count would duplicate some of the
infraction count; therefore, this number was not included in the total number of discipline
infractions.
Data Collection Instruments
A survey design was utilized to establish the levels of implementation of PBIS within
a school (Creswell, 2003). The evaluation of the level of implementation of each campus was
gathered through the use of two surveys: The Principal PBIS Implementation Survey
(Appendix A) and the Effective Behavior Support (EBS) survey (Appendix B). The
participants of the Principal PBIS Implementation Survey were the principals of each PBIS
high school. The participants of the EBS survey were the staff members of each PBIS high
school. The data for the aggregated student performance outcomes were gathered from two
sources: the Department of Information Services of the school district and the annual AEIS
report of each school for each year of the study.
Validity and Reliability of the Instruments
The two surveys were utilized to categorize the schools into levels of PBIS
implementation. The Principal PBIS Implementation Survey was used to invite the principal
of each PBIS high school to report the PBIS implementation practices at the campus level to
include the year of PBIS implementation, the introductory training of PBIS ideas, concepts
and practices with staff members, along with the ongoing professional development with
staff and training in PBIS of the student population. The EBS survey was administered by the
Department of Information Services of the school district towards the end of each school
year. In the EBS survey, staff members of the PBIS schools recorded their perceptions of the
47
level of PBIS implementation in four areas: the host environment, the team management of
data, the non-classroom setting/active supervision, and the classroom.
To establish the content validity of the Principal PBIS Implementation Survey, I
utilized a test group of 10 educational administrators who participated in a PBIS school. The
test group answered the survey questions then evaluated whether the survey yielded a
measurement of the level of implementation from the survey participants. The test group met
with me to discuss the implications of the survey and the ability for me to yield the desired
measurement of the level of implementation as perceived by the campus principal with
regards to the initial PBIS training and on-going staff development and student training on
PBIS concepts. The test group agreed that I would be able to draw relevant and purposeful
inferences from the scores on the survey model.
The validity of the EBS survey was established through the Educational and
Community Supports, College of Education at University of Oregon by Robert H. Horner,
Ph.D (Coffey & Horner, 2012). According to Dr. Horner, EBS was a survey assessment
tool/instrument for research, annual assessment, and progress monitoring of the
implementation of school-wide PBIS implementation practices. According to Horner, the
survey met the validity requirement because the design was evidence-based and reliable; it
was consistent across states, met the assessment needs, and was not duplicated by any other
tool/instrument currently in use (Coffey & Horner, 2012). The reliability was an estimate of
the consistency of the results to previous similar studies (Gall, Gall & Boyd, 2007).
The aggregated student performance outcome variables were recorded on the Student
Performance Outcome Data Collection Instrument (Appendix C). The discipline infraction
count was obtained from the school district database. The TAKS (math and reading) pass
48
rates, attendance rate, dropout rate and graduation rate are obtained from TEA. The Student
Performance Outcome Data Collection Instrument was designed to organize the collected
independent and dependent data of each school. The instrument was accepted by the
committee members during the record of study proposal hearing at Texas A&M University.
Data Collection
Prior to collecting data, approval was granted by the International Review Board at
Texas A & M University and the school district. Data collection began June of 2012.
The Independent Variables
A prerequisite to gain permission to conduct research within the selected district
required me to obtain the signed approval of the principal of each high school evaluated in
the study. To begin the approval process, I requested a meeting with each principal. This
request was sent electronically via email to each principal (Appendix D). To verify university
approval for my research to the principals, I gave each principal a copy of the Texas A & M
Information Sheet (Appendix E). The Information Sheet was designed by Texas A & M
University to describe the purpose, risk, benefits, and the level of participation needed to
complete the study to the participant. Secondly, I met with the ten principals individually to
answer questions regarding the purpose and goal of the research study. The principals of
campuses who implemented PBIS completed the principal survey. The principals of non-
PBIS schools were not given the survey because their schools did not participate in PBIS.
The EBS survey was used to gather the staff members’ perceptions of the level of
PBIS implementation within their high school. The selected school district’s Department of
Campus Improvement administered the survey electronically to the staff members of PBIS
campuses beginning in 2008. The department then collected and submitted the data it to the

49
Department of Student Services of the district. The results of the EBS surveys were available
for 2008, 2009, 2010, and 2011 school years.
The evaluation years were selected based upon the implementation of PBIS into the
high schools. Implementation began in the 2006-2007 school year and the study concluded in
the 2010-2011 school year. The beginning implementation year was determined by the
school district.
The Dependent Variables
The discipline infraction data for each school was supplied by the Department of
Information Services of the school district. The math and reading TAKS pass rates, the
attendance rate, the dropout rate, and the graduation rate for each year of the study were
located on the AEIS report obtained through TEA.
Data Analysis
I employed multiple quantitative techniques to analyze the data of this study. The
quantitative data were analyzed through the computer software program Statistical Package
for the Social Sciences (SPSS) manufactured by IBM. Descriptive and parametric analytical
techniques were employed to define, describe, and analyze the findings in the form of figures
and tables (Creswell, 2003; Fields, 2009). All statistical tests were conducted at an alpha
level of 0.05. The results were analyzed for statistical significance at that level.
Descriptive statistics were utilized to describe the state, district, and school
populations. The level of PBIS implementation was evaluated through the use of two
surveys: The Principal PBIS Implementation Survey and the EBS survey. The results of these
surveys were quantified to produce numerical values. Basic mathematical calculations, such
as adding and averaging, were performed to summate the values of the criteria of this

50
independent variable to assign the level of PBIS implementation at the high schools. The
resulting values were used to assign the levels of PBIS implementation which were high,
moderate, low, and none.
Next, I examined the differences for the differing levels of PBIS implementation in
terms of on the aggregated student performance variables across the years of the study with a
2 factor factorial mixed model analysis of variance, ANOVA (Fields, 2009). Mauchly’s test
of sphericity was conducted to test the null hypothesis of whether the covariance matrix of
the orthonormalized values was proportional to the identity matrix of each student
performance outcome variable. To determine whether there was significance in the test
within the values of the variables and years of the study, one of two test procedures were
used. If sphericity was met, then results of the Sphercity Assumed were used. If sphericity
was not met, then results of the Lower-bound were used (Fields, 2009). If significance was
found for the interaction term of the within-subjects tests, Simple Main Effects (SME)
analyses were performed. The values of the Sidak pair-wise comparison procedures were
used to determine where differences existed within a profile.
Summary of the Methodology
In previous chapters, I introduced the study and reviewed literature related to the
study. In this chapter, I organized the methodology of this study to communicate the research
design, state, district, and school environments, the variables examined, data collection
instruments utilized and the validity and reliability of those instruments along with data
collection procedures, and data analyses. In the following chapters, the findings and results
along with a discussion of the results will be displayed to address the initial research tasks
and provide answers for the research questions.
51
CHAPTER IV
RESULTS
In my ex post facto quantitative study, I analyzed differences for PBIS
implementation in the high school setting. My outcome variables were selected aggregated
student performance variables across five years. My investigation involved ten high schools
within one school district in the state of Texas. I used data over the span of five years from
the 2006-2007 to the 2010-2011 school years.
In the previous chapters, I introduced the initial research tasks and questions, as well
as a review of pertinent literature and the methodology I used to address the initial research
tasks and questions of this study. In this chapter, I displayed the findings and results of the
study. I began the chapter with a description of the state, district and schools’ student
demographic data. I then reviewed the initial research tasks and questions. Next, I displayed
the values of the independent variables and the dependent variables examined for each high
school. I concluded the chapter with the results of the 2 factor factorial mixed model
ANOVA tests. Using these tests, I analyzed differences of PBIS implementation on the
selected aggregated student performance outcome variables across the years of the study.
State, District, and School Demographics
To describe the state, district, and school environments, I listed the values of variables
within the public school environment which include: (a) grade K-12 student enrollment, (b)
the high school enrollment (grades 9-12), (c) the percentage of high school enrollment
(grades 9-12) for the state and district, (d) the percentage of the each monitored ethnicity
group, as well as (e) the percentage of some student learner diversity attributes within the

52
state, district, and schools. The state and district school data included grades K-12. The
examined high schools’ population data included students enrolled in the grades 9-12.
Most researchers studying PBIS and student performance, as evidenced in my
literature review, also reviewed student demographic population trends to illustrate the size
and diversity of the context of a studied system. The student population was the total number
of students enrolled in each school. To display the cultural diversity of the chosen district, I
presented the ethnic population percentages of the following student subpopulations: African
American, Hispanic, White, Native American, and Asian/Island Pacific. To display some of
the learner diversity attributes of the chosen district, I recorded the percentages of
Economically Disadvantaged, Limited English Proficiency, and Special Education student
subpopulations. My descriptions of the population data were based upon the information
collected from TEA covering 2006-2007 to 2010-2011 school years.
The State
I described the Texas public school system student population enrollment for grades
K-12 in Tables 1 through 3. In Table 1, I displayed the K-12 public school enrollment.

53
Table 1
The Student Enrollment in the Texas Public School System from 2007 to 2011
Year
Total K-12 student
enrollment
Total high school (9-12)
student enrollment
Percentage high school
student enrollment (%)
2007 4,576,933 1,271,344 27.8
2008 4,651,516 1,290,924 27.8
2009 4,728,204 1,296,385 27.4
2010 4,824,778 1,319,638 27.4
2011 4,912,385 1,339,882 27.3
During the span of this study, the total student enrollment increased from 4,576,933 students
in 2007 to 4,912,385 students in 2011. The high school enrollment increased from 1,271,344
students in 2007 to 1,339,882 students in 2011. The percentage of high school students
enrolled in Texas public schools decreased from 27.8% in 2007 to 27.3% in 2011.
I described the cultural diversity in the Texas public school system grades K-12
enrollment in Table 2.

54
Table 2
The Student Ethnicity Population in the Texas Public School System from 2007-2011
Year
African
American (%)
Hispanic
(%)
White
(%)
Native
American (%)
Asian/Island
Pacific (%)
2007 14.4 46.3 35.7 0.3 3.3
2008 14.3 47.2 34.8 0.3 3.4
2009 14.2 47.9 34.0 0.4 3.6
2010 14.0 48.6 33.3 0.4 3.7
2011 12.9 50.3 31.2 0.5 3.5
During the span of the study, the percentage of the African American population decreased
from 14.4% in 2007 to 12.9% in 2011. The percentage of the Hispanic population increased
from 46.3% in 2007 to 50.3% in 2011. The percentage of the White population decreased
from 35.7% in 2007 to 31.2% in 2011. The percentage of the Native American population
increased from 0.3% in 2007 to 0.5% in 2011. The percentage of the Asian/Pacific Islander
population increased from 3.3% in 2007 to 3.5% in 2011. I described the learner diversity in
the Texas public school system grades K-12 enrollment in Table 3.

55
Table 3
The Student Learner Diversity Population in the Texas Public School System from 2007-
2011
Year
Economically
Disadvantaged (%)
Limited English
Proficiency (%)
Special Education
(%)
2007 55.5 16.0 10.6
2008 55.3 16.7 10.0
2009 56.7 16.9 9.4
2010 59.0 16.9 9.0
2011 59.2 16.9 8.8
The percentage of the Economically Disadvantaged student population increased from 55.5%
in 2007 to 59.2% in 2011. The percentage of the Limited English Proficiency student
population increased from 16.0% in 2007 to 16.9% in 2011. The percentage of the Special
Education student population decreased from 10.6% in 2007 to 8.8% in 2011.
The District
I used the total public school enrollment for grades K-12 value to describe the relative
size of the district. In addition, I used the ethnic population percentages of the following
student subpopulations: African American, Hispanic, White, Native American, and
Asian/Island Pacific to describe the cultural diversity within the district. Finally, I used the
Economically Disadvantaged, Limited English Proficiency, and Special Education student

56
populations to describe the diversity of learners within the district. I described the public
school enrollment for grades K-12 for the district in Table 4.
Table 4
The Student Enrollment in the District from 2007 to 2011
Year K-12 Student Enrollment
High School (9-12)
Enrollment
High School (9-12)
Percentage (%)
2007 91,889 25,845 28.1
2008 96,546 27,033 28.0
2009 100,505 27,971 27.8
2010 103,897 29,094 28.0
2011 105,860 29,955 28.3
The total enrollment of the district, during the span of this study, increased from 91,889
students in 2007 to 105,860 students by 2011. The high school enrollment increased from
25,845 students in 2007 to 29,955 students in 2011. The percentage of high school students
increased from 28.1% in 2007 to 28.3% in 2011. I described the cultural diversity using the
ethnic population percentages in Table 5.

57
Table 5
The Student Ethnicity Population in the District from 2007-2011
Year
African
American (%)
Hispanic
(%)
White
(%)
Native
American (%)
Asian/Island
Pacific (%)
2007 14.6 35.2 41.4 0.3 8.5
2008 15.2 37.1 38.8 0.3 8.6
2009 15.7 38.7 37.1 0.3 8.8
2010 16.5 38.9 35.5 0.3 8.8
2011 15.5 42.5 31.0 0.2 8.0
The percentage of the African American population increased from 14.6% in 2007 to 15.5%
in 2011. The percentage of the Hispanic population increased from 35.2% in 2007 to 42.5%
in 2011. The percentage of the White population decreased from 41.4% in 2007 to 31.0% in
2011. The percentage of the Native American population decreased from 0.3% in 2007 to
0.2% in 2011. The percentage of the Asian/Pacific Islander population decreased from 8.5%
in 2007 to 8.0% in 2011. I described the learner diversity attributes for the school district in
Table 6.
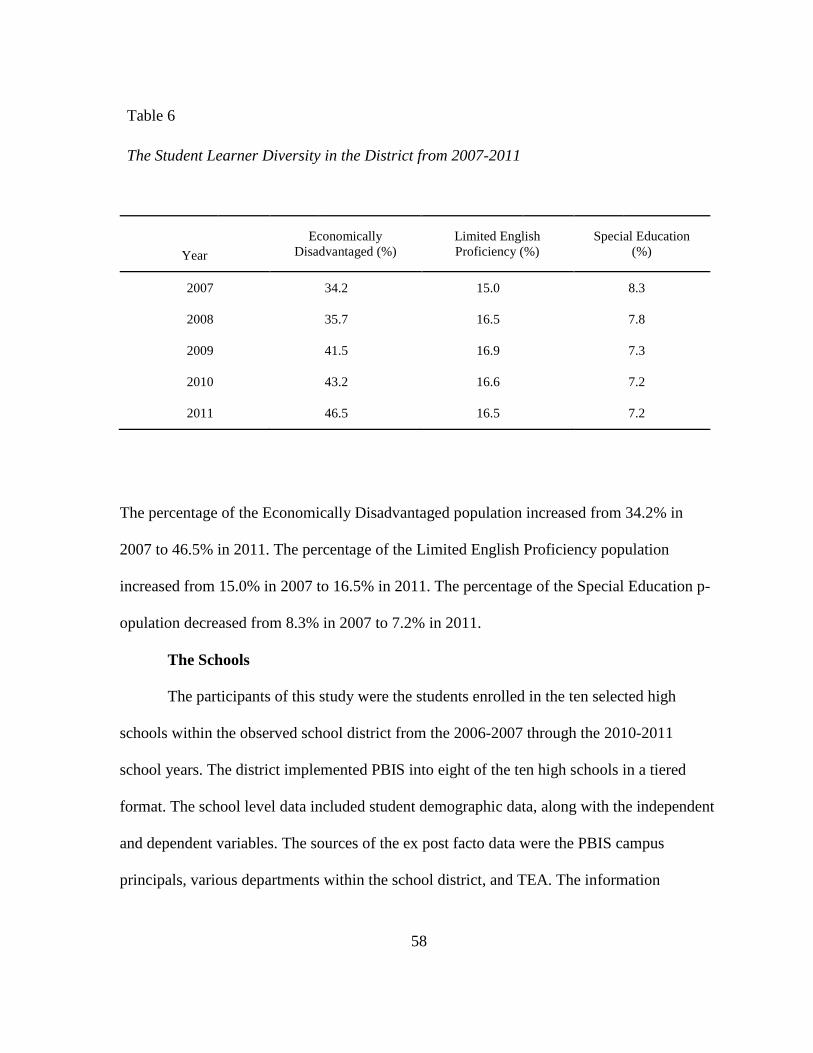
58
Table 6
The Student Learner Diversity in the District from 2007-2011
Year
Economically
Disadvantaged (%)
Limited English
Proficiency (%)
Special Education
(%)
2007 34.2 15.0 8.3
2008 35.7 16.5 7.8
2009 41.5 16.9 7.3
2010 43.2 16.6 7.2
2011 46.5 16.5 7.2
The percentage of the Economically Disadvantaged population increased from 34.2% in
2007 to 46.5% in 2011. The percentage of the Limited English Proficiency population
increased from 15.0% in 2007 to 16.5% in 2011. The percentage of the Special Education p-
opulation decreased from 8.3% in 2007 to 7.2% in 2011.
The Schools
The participants of this study were the students enrolled in the ten selected high
schools within the observed school district from the 2006-2007 through the 2010-2011
school years. The district implemented PBIS into eight of the ten high schools in a tiered
format. The school level data included student demographic data, along with the independent
and dependent variables. The sources of the ex post facto data were the PBIS campus
principals, various departments within the school district, and TEA. The information
59
gathered was used to address the research objectives and questions. The high schools were
coded as HS 1, HS 2, HS 3, HS 4, HS 5, HS 6, HS 7, HS 8, HS 9, and HS 10.
I described the high schools using student population values. For example, I used the
total high school enrollment value to describe the relative size of schools over the course of
the study. In addition, I used ethnic population percentages to describe the cultural diversity
of schools during the study. I presented the following student subpopulations: African
American, Hispanic, White, Native American, and Asian/Island Pacific of each high school.
Finally, I used Economically Disadvantaged, Limited English Proficiency, and Special
Education student subpopulations to describe the student learner diversity within each high
school.
HS 1
I described the school enrollment for HS 1 in Table 7.
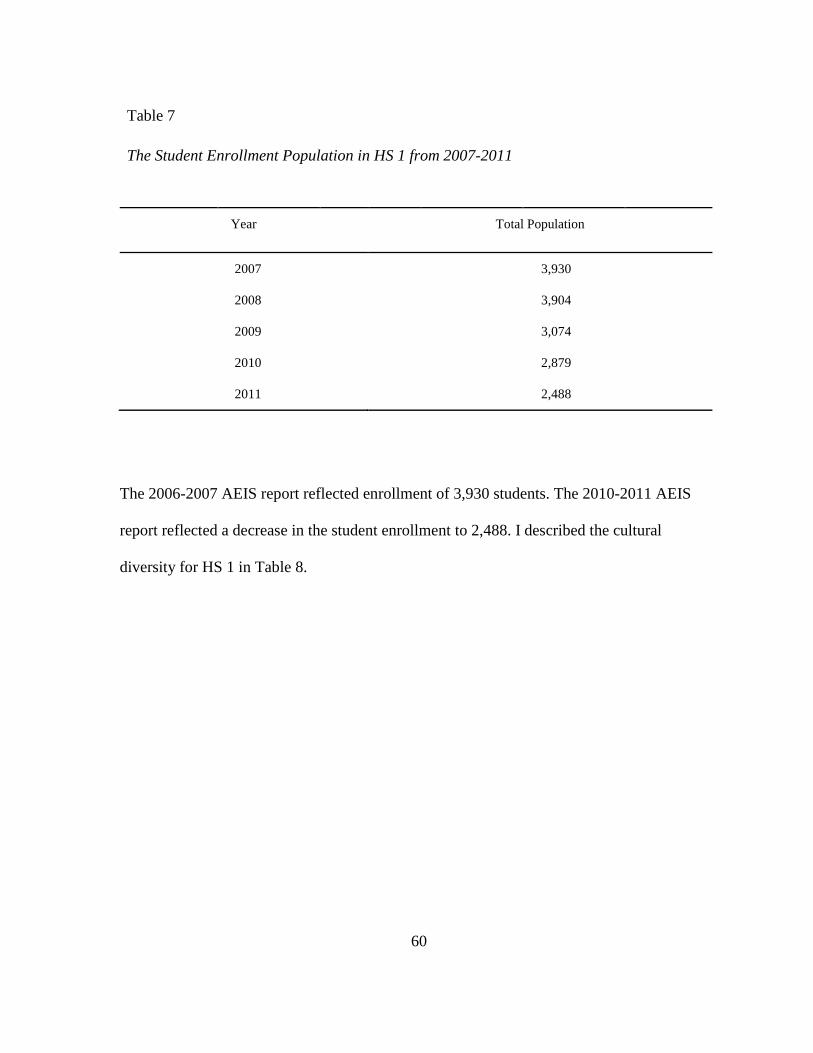
60
Table 7
The Student Enrollment Population in HS 1 from 2007-2011
Year Total Population
2007 3,930
2008 3,904
2009 3,074
2010 2,879
2011 2,488
The 2006-2007 AEIS report reflected enrollment of 3,930 students. The 2010-2011 AEIS
report reflected a decrease in the student enrollment to 2,488. I described the cultural
diversity for HS 1 in Table 8.
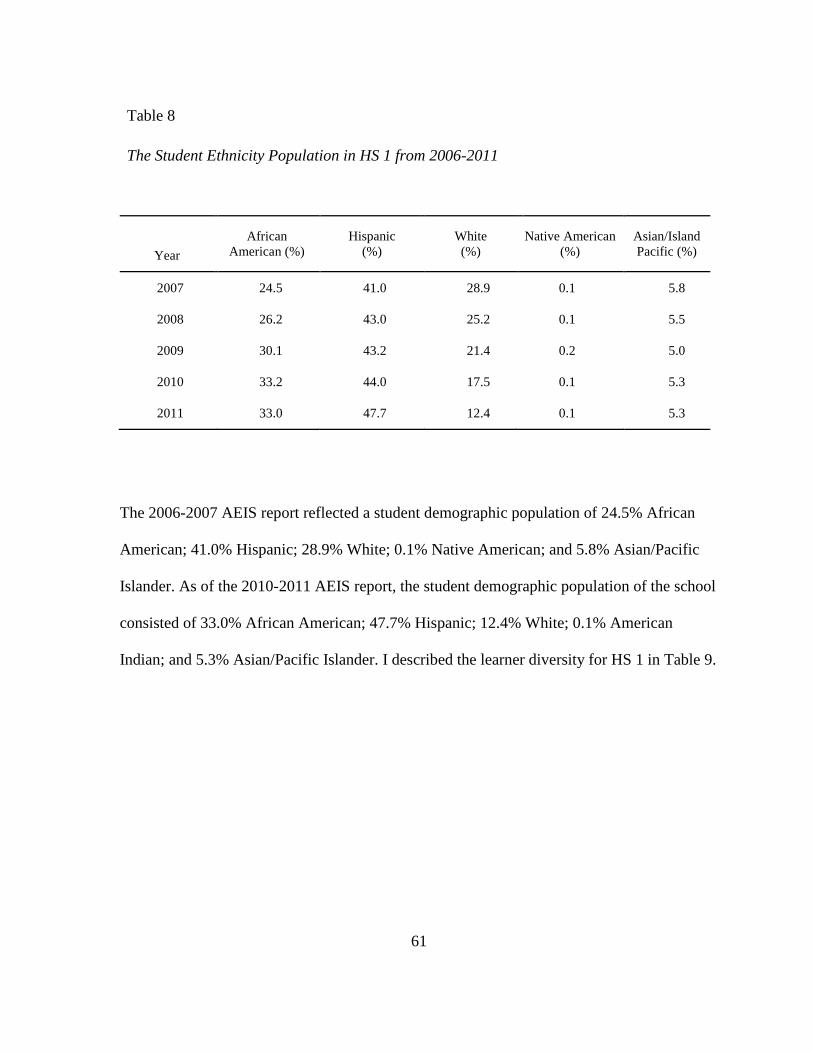
61
Table 8
The Student Ethnicity Population in HS 1 from 2006-2011
Year
African
American (%)
Hispanic
(%)
White
(%)
Native American
(%)
Asian/Island
Pacific (%)
2007 24.5 41.0 28.9 0.1 5.8
2008 26.2 43.0 25.2 0.1 5.5
2009 30.1 43.2 21.4 0.2 5.0
2010 33.2 44.0 17.5 0.1 5.3
2011 33.0 47.7 12.4 0.1 5.3
The 2006-2007 AEIS report reflected a student demographic population of 24.5% African
American; 41.0% Hispanic; 28.9% White; 0.1% Native American; and 5.8% Asian/Pacific
Islander. As of the 2010-2011 AEIS report, the student demographic population of the school
consisted of 33.0% African American; 47.7% Hispanic; 12.4% White; 0.1% American
Indian; and 5.3% Asian/Pacific Islander. I described the learner diversity for HS 1 in Table 9.

62
Table 9
The Student Learner Diversity Population in HS 1 from 2007-2011
Year
Economically
Disadvantaged (%)
Limited English
Proficiency (%)
Special Education
(%)
2007 37.7 7.4 8.5
2008 42.0 7.1 8.5
2009 52.0 6.1 8.0
2010 56.5 4.3 8.1
2011 63.1 4.9 9.0
The student learner diversity population of HS 1included 37.7% Economically
Disadvantaged, 7.4% Limited English Proficiency, and 8.5% Special Education in 2007. This
changed to 63.1% Economically Disadvantaged, 4.9% Limited English Proficiency and 9.0%
Special Education in 2011.
HS 2
I described the school enrollment for HS 2 in Table 10.

63
Table 10
The Student Enrollment Population in HS 2 from 2007-2011
Year Total Population
2007 3,109
2008 2,992
2009 3,033
2010 2,962
2011 3,000
The 2006-2007 AEIS report reflected an enrollment of 3,109 students. The 2010-2011 AEIS
report reflected a decrease in the student enrollment to 3,000. I described the cultural
diversity for HS 2 in Table 11.

64
Table 11
The Ethnicity Population in HS 2 from 2007-2011
Year
African
American (%)
Hispanic
(%)
White
(%)
Native
American (%)
Asian/Island
Pacific (%)
2007 17.8 42.7 26.2 0.3 13.1
2008 17.5 46.9 23.6 0.4 12.6
2009 17.9 46.7 23.0 0.4 12.0
2010 18.1 48.8 20.6 0.0 12.4
2011 17.1 52.1 17.7 0.3 11.2
The 2006-2007 AEIS report reflected a student demographic population of 17.8% African
American; 42.7% Hispanic; 26.2% White; 0.3% Native American; and 13.1% Asian/Pacific
Islander. As of the 2010-2011 AEIS report, the student demographic population of the school
consisted of 17.1% African American; 52.1% Hispanic; 17.7% White; 0.3% Native
American; and 11.2% Asian/Pacific Islander. I described the learner diversity for HS 2 in
Table 12.

65
The student learner diversity population included 38.9% Economically Disadvantaged, 8.4%
Limited English Proficiency, and 9.1% Special Education in 2007. This changed to 54.3%
Economically Disadvantaged, 6.9% Limited English Proficiency, and 9.8% Special
Education in 2011.
HS 3
I described the school enrollment for HS 3 in Table 13.
Table 12
The Student Learner Diversity Population in HS 2 from 2007-2011
Year
Economically
Disadvantaged (%)
Limited English
Proficiency (%)
Special Education
(%)
2007 38.9 8.4 9.1
2008 38.6 8.1 9.0
2009 47.2 7.7 9.5
2010 49.0 7.4 9.2
2011 54.3 6.9 9.8

66
Table 13
The Student Enrollment Population in HS 3 from 2007-2011
Year Total Population
2007 3,331
2008 3,271
2009 3,071
2010 3,191
2011 3,310
The student population of HS 3 decreased from 3,331 in 2007 to 3,310 in 2011. I described
the cultural diversity of HS 2 in Table 14.

67
Table 14
The Student Ethnicity Population in HS 3 from 2007-2011
Year
African
American (%)
Hispanic
(%)
White
(%)
Native
American (%)
Asian/Island
Pacific (%)
2007 9.7 16.5 67.5 0.3 6.0
2008 10.9 19.6 62.2 0.2 7.1
2009 13.1 21.3 56.7 0.3 8.7
2010 13.3 21.7 56.0 0.4 8.6
2011 11.8 24.1 52.9 0.3 8.8
The 2006-2007 AEIS report reflects a student demographic population of 9.7% African
American; 16.5% Hispanic; 67.5% White; 0.3% Native American; and 6.0% Asian/Pacific
Islander. As of the 2010-2011 AEIS report, the student demographic population of the school
consists of 11.8% African American; 24.1% Hispanic; 52.9% White; 0.3% American Indian;
and 8.8% Asian/Pacific Islander. I described the learner diversity for HS 3 in Table 15.

68
Table 15
The Student Learner Population in HS 3 from 2007-2011
Year
Economically
Disadvantaged (%)
Limited English
Proficiency (%)
Special Education
(%)
2007 11.0 2.0 9.2
2008 13.1 2.6 8.9
2009 20.7 2.8 8.4
2010 22.9 2.4 7.3
2011 23.5 2.4 6.0
This population includes 7.6% Economically Disadvantaged, 1.2% Limited English
Proficiency, and 8.7% Special Education in 2007. The learner diversity population changed
to 23.5% Economically Disadvantaged, 2.4% Limited English Proficiency, and 6.0% Special
Education in 2011.
HS 4
I described the school enrollment for HS 4 in Table 16.

69
Table 16
The Student Enrollment in HS 4 from 2007-2011
Year Total Population
2007 3,451
2008 3,569
2009 3,208
2010 3,126
2011 2,908
In HS 4 the student population decreased from 3,451 in 2007 to 2,908 in 2011. I described
the cultural diversity for HS 4 in Table 17.

70
Table 17
The Learner Diversity Population in HS 4 from 2007-2011
Year
African
American (%)
Hispanic
(%)
White
(%)
Native
American (%)
Asian/Island
Pacific (%)
2007 14.3 28.9 47.8 0.3 8.7
2008 16.4 33.2 42.3 0.3 7.8
2009 16.4 32.8 42.5 0.2 8.2
2010 16.8 34.3 40.5 0.4 8.0
2011 14.6 38.2 37.2 0.1 6.4
The 2006-2007 AEIS report reflected a student demographic population of 14.3% African
American; 28.9% Hispanic; 47.8% White; 0.3% Native American; and 8.7% Asian/Pacific
Islander. As of the 2010-2011 AEIS report, the student demographic population of the school
consisted of 14.6% African American; 38.2% Hispanic; 37.2% White; 0.1% Native
American; and 6.4% Asian/Pacific Islander. I described the learner diversity for HS 4 in
Table 18.
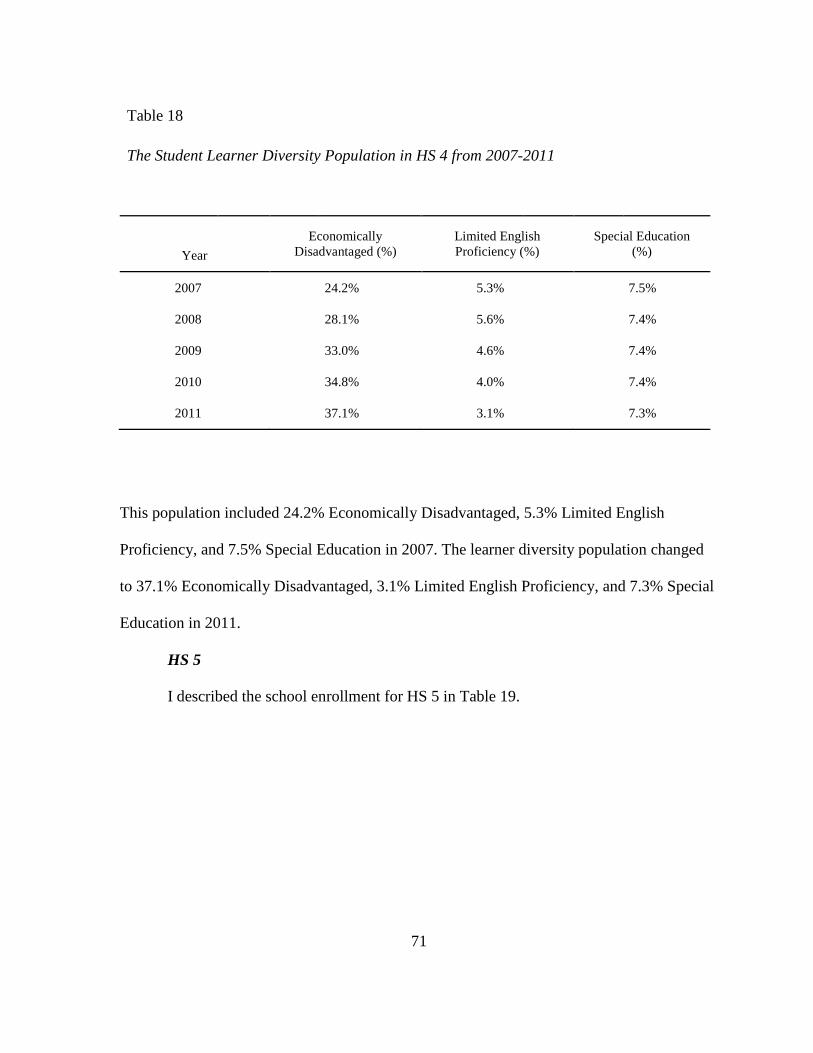
71
Table 18
The Student Learner Diversity Population in HS 4 from 2007-2011
Year
Economically
Disadvantaged (%)
Limited English
Proficiency (%)
Special Education
(%)
2007 24.2% 5.3% 7.5%
2008 28.1% 5.6% 7.4%
2009 33.0% 4.6% 7.4%
2010 34.8% 4.0% 7.4%
2011 37.1% 3.1% 7.3%
This population included 24.2% Economically Disadvantaged, 5.3% Limited English
Proficiency, and 7.5% Special Education in 2007. The learner diversity population changed
to 37.1% Economically Disadvantaged, 3.1% Limited English Proficiency, and 7.3% Special
Education in 2011.
HS 5
I described the school enrollment for HS 5 in Table 19.
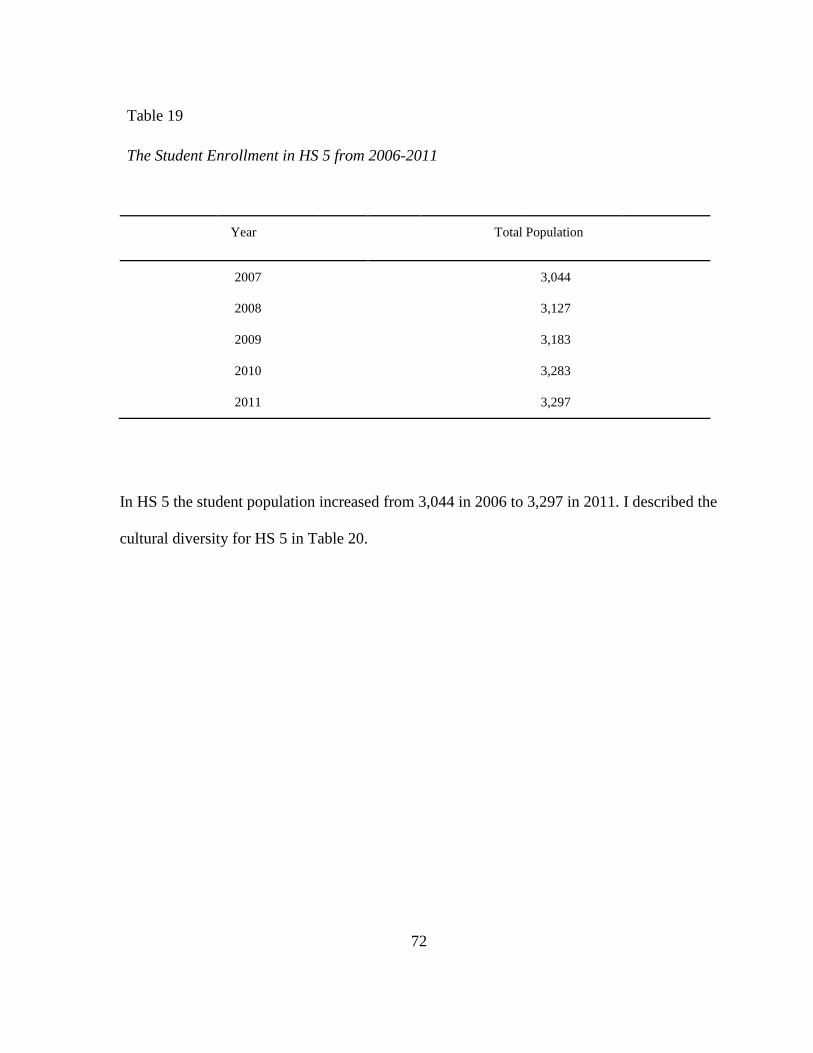
72
Table 19
The Student Enrollment in HS 5 from 2006-2011
Year Total Population
2007 3,044
2008 3,127
2009 3,183
2010 3,283
2011 3,297
In HS 5 the student population increased from 3,044 in 2006 to 3,297 in 2011. I described the
cultural diversity for HS 5 in Table 20.

73
Table 20
The Student Ethnicity Population in HS 5 from 2007-2011
Year
African
American (%)
Hispanic
(%)
White
(%)
Native
American (%)
Asian/Island
Pacific (%)
2007 12.0 20.7 59.7 0.4 7.3
2008 13.0 23.9 54.3 0.3 8.5
2009 14.9 26.3 49.0 0.3 9.5
2010 15.7 28.9 45.7 0.3 9.4
2011 16.5 30.8 40.9 0.2 9.0
The 2006-2007 AEIS report reflected a student demographic population of 12.0% African
American; 20.7% Hispanic; 59.7% White; 0.4% Native American; and 7.3% Asian/Pacific
Islander. As of the 2010-2011 AEIS report, the student demographic population of the school
consisted of 16.5% African American; 30.8% Hispanic; 40.9% White; 0.2% Native
American; and 9.0% Asian/Pacific Islander.
I described the learner diversity for HS 5 in Table 21.

74
Table 21
The Learner Diversity Population in HS 5 from 2007-2011
Year
Economically
Disadvantaged (%)
Limited English
Proficiency (%)
Special Education
(%)
2007 18.6 3.7 9.5
2008 20.9 5.0 8.9
2009 27.8 4.4 8.3
2010 31.3 4.2 8.2
2011 35.7 3.6 7.3
This population included 18.6% Economically Disadvantaged, 3.7% Limited English
Proficiency, and 9.5% Special Education in 2007. This changed to 35.7% Economically
Disadvantaged, 3.6% Limited English Proficiency, and 7.3% Special Education in 2011.
HS 6
I described the school enrollment for HS 6 in Table 22.
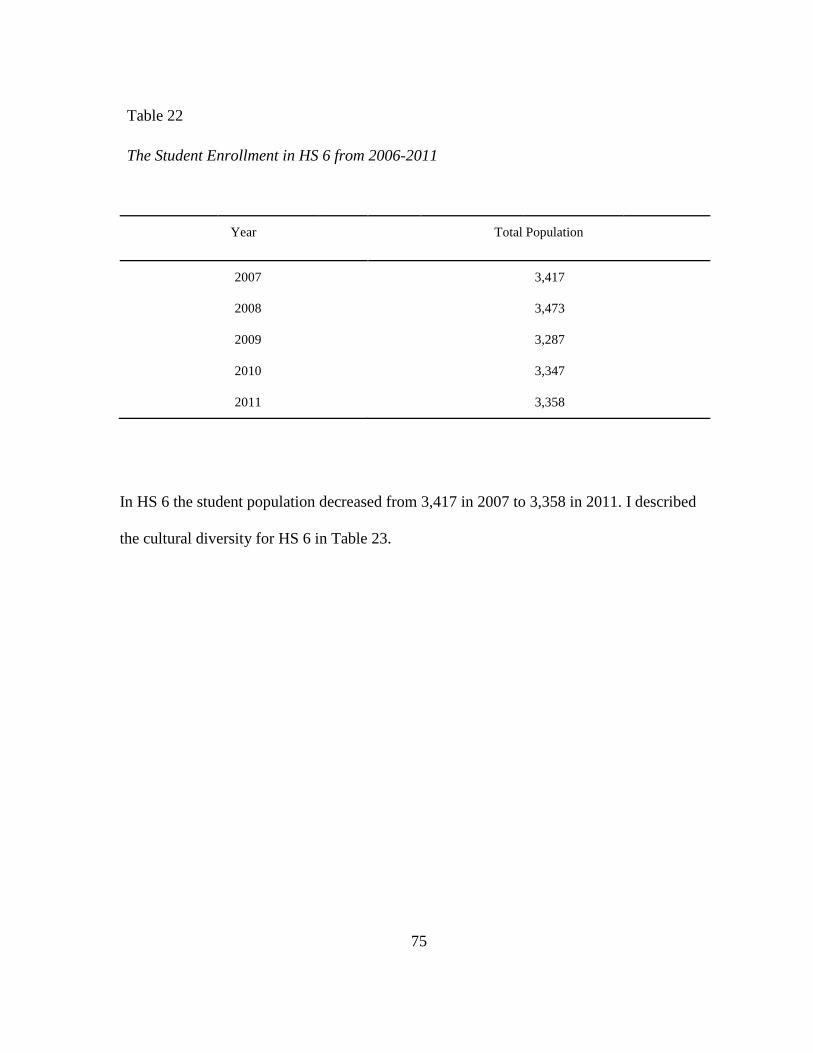
75
Table 22
The Student Enrollment in HS 6 from 2006-2011
Year Total Population
2007 3,417
2008 3,473
2009 3,287
2010 3,347
2011 3,358
In HS 6 the student population decreased from 3,417 in 2007 to 3,358 in 2011. I described
the cultural diversity for HS 6 in Table 23.

76
Table 23
The Student Ethnicity Population in HS 6 from 2007-2011
Year
African
American (%)
Hispanic
(%)
White
(%)
Native
American (%)
Asian/Island
Pacific (%)
2007 16.2 31.9 39.8 0.1 12.1
2008 16.4 36.9 35.1 0.1 11.5
2009 17.5 37.7 33.0 0.2 11.7
2010 19.0 37.3 31.6 0.2 11.9
2011 18.1 39.1 28.1 0.3 11.2
The 2006-2007 AEIS report reflected a student demographic population of 16.2% African
American; 31.9% Hispanic; 39.8% White; 0.1% Native American; and 12.1% Asian/Pacific
Islander. As of the 2010-2011 AEIS report, the student demographic population of the school
consisted of 18.1% African American; 39.1% Hispanic; 28.1% White; 0.3% Native
American; and 11.2% Asian/Pacific Islander. I described the learner diversity for HS 6 in
Table 24.

77
Table 24
The Learner Diversity Population in HS 6 from 2007-2011
Year Economically
Disadvantaged (%)
Limited English
Proficiency (%)
Special Education
(%)
2007 26.1 6.0 7.5
2008 28.7 6.4 7.5
2009 34.7 6.2 6.9
2010 35.5 5.7 7.6
2011 40.5 5.1 6.8
This population included 26.1% Economically Disadvantaged, 6.0% Limited English
Proficiency, and 7.5% Special Education in 2007. This changed to 40.5% Economically
Disadvantaged, 5.1% Limited English Proficiency, and 6.8% Special Education in 2011.
HS 7
I described the school enrollment for HS 7 in Table 25.

78
Table 25
The Student Population in HS 7 from 2007-2011
Year Total Population
2007 -
2008 -
2009 1,535
2010 2,389
2011 3,208
The enrollment information for HS 7 is limited. HS 7 opened in the fall of 2008. The student
population increased from 1,535 in 2009 to 3,208 in 2011. I described the cultural diversity
of HS 7 during the study is presented in Table 26.

79
Table 26
The Student Ethnicity Population in HS 7 from 2007-2011
Year
African
American (%)
Hispanic
(%)
White
(%)
Native
American (%)
Asian/Island
Pacific (%)
2007 - - - - -
2008 - - - - -
2009 20.1 53.2 20.7 0.3 5.8
2010 21.6 52.7 19.5 0.3 5.8
2011 21.5 53.6 16.5 0.3 5.7
The 2008-2009 AEIS report reflected a student demographic population of 20.1% African
American; 53.2% Hispanic; 20.7% White; 0.3% Native American; and 5.8% Asian/Pacific
Islander. As of the 2010-2011 AEIS report, the student demographic population of the school
consisted of 21.5% African American; 53.6% Hispanic; 16.5% White; 0.3% Native
American; and 5.7% Asian/Pacific Islander. I described the learner diversity for HS 7 in
Table 27.

80
Table 27
The Student Learner Diversity Population in HS 7 from 2007-2011
Year
Economically
Disadvantaged (%)
Limited English
Proficiency (%)
Special Education
(%)
2007 - - -
2008 - - -
2009 56.1 8.7 7.2
2010 54.3 7.1 6.5
2011 58.4 6.0 7.0
This population included 56.1% Economically Disadvantaged, 8.7% Limited English
Proficiency and 7.2% Special Education in 2009. This changed to 58.4% Economically
Disadvantaged, 6.0% Limited English Proficiency and 7.0% Special Education in 2011.
HS 8
I described the school enrollment for HS 8 in Table 28.
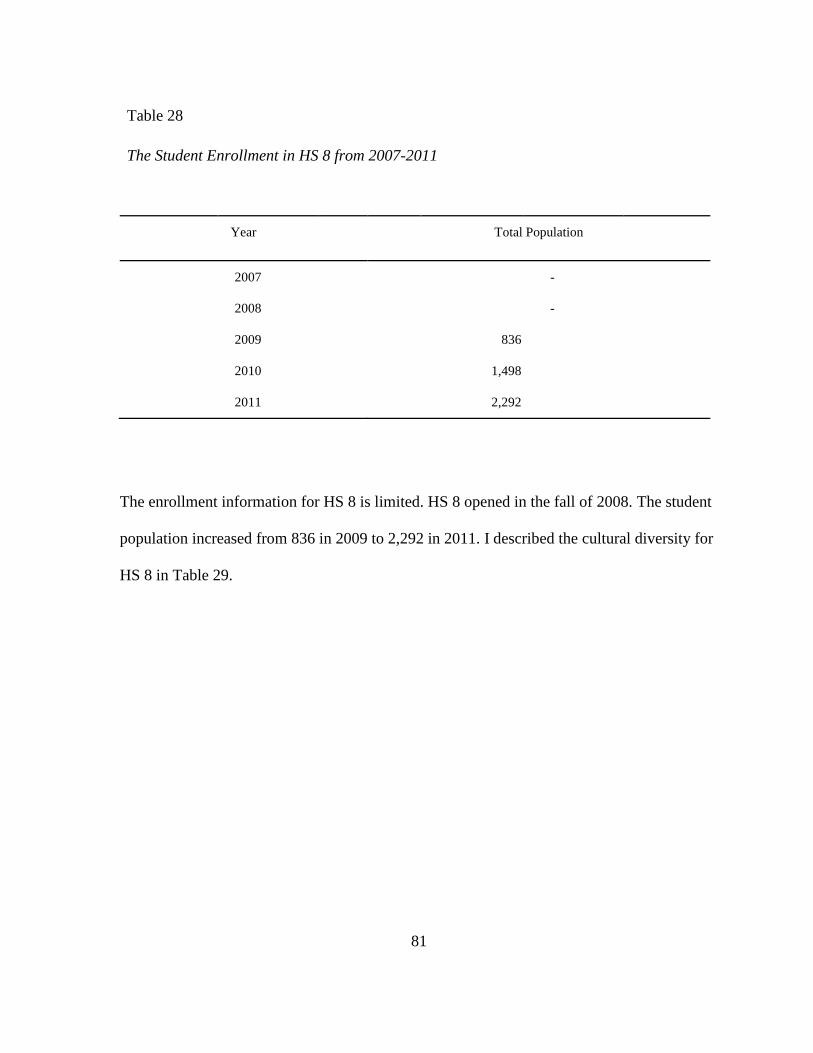
81
Table 28
The Student Enrollment in HS 8 from 2007-2011
Year Total Population
2007 -
2008 -
2009 836
2010 1,498
2011 2,292
The enrollment information for HS 8 is limited. HS 8 opened in the fall of 2008. The student
population increased from 836 in 2009 to 2,292 in 2011. I described the cultural diversity for
HS 8 in Table 29.

82
Table 29
The Student Ethnicity Population in HS 8 from 2007-2011
Year
African
American (%)
Hispanic
(%)
White
(%)
Native
American (%)
Asian/Island
Pacific (%)
2007 - - - - -
2008 - - - - -
2009 11.4 14.4 68.2 0.5 5.6
2010 11.4 15.4 65.7 0.3 7.3
2011 11.4 21.2 57.9 0.0 5.8
The 2008-2009 AEIS report reflected a student demographic population of 11.4% African
American; 14.4% Hispanic; 68.2% White; 0.5% Native American; and 5.6% Asian/Pacific
Islander. As of the 2010-2011 AEIS report, the student demographic population of the school
consisted of 11.4% African American; 21.2% Hispanic; 57.9% White; 0% Native American;
and 5.8% Asian/Pacific Islander. I described the learner diversity for HS 8 in Table 30.
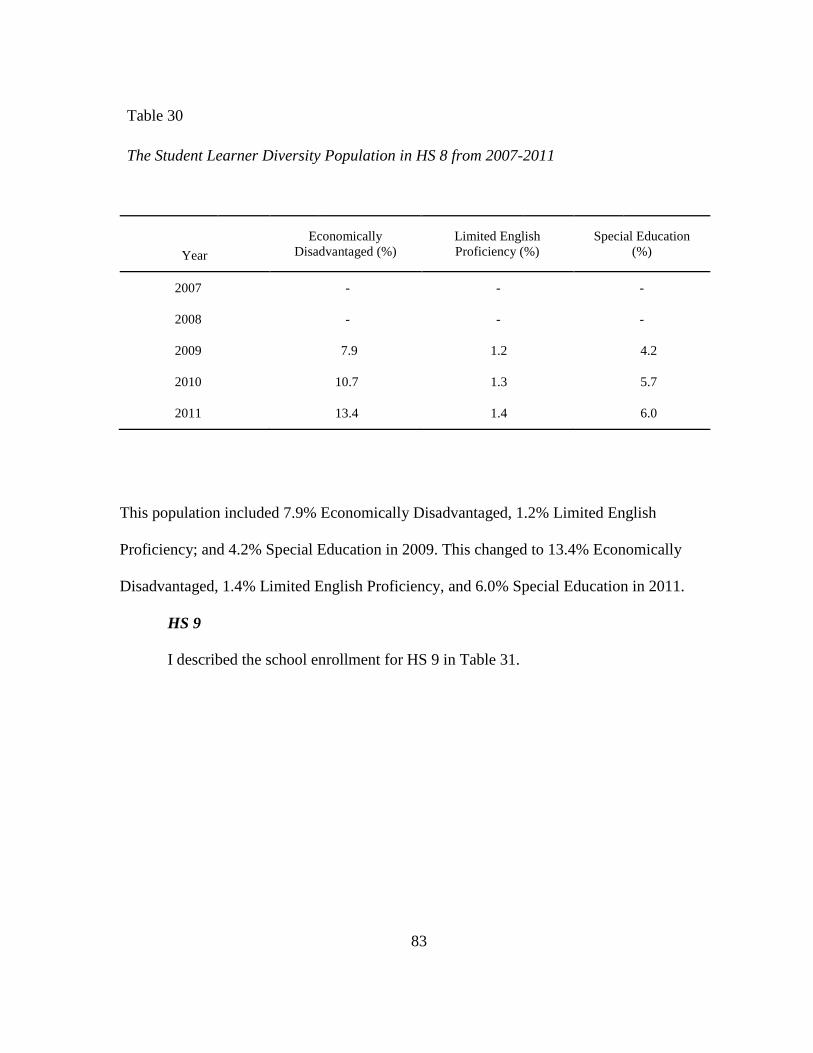
83
Table 30
The Student Learner Diversity Population in HS 8 from 2007-2011
Year
Economically
Disadvantaged (%)
Limited English
Proficiency (%)
Special Education
(%)
2007 - - -
2008 - - -
2009 7.9 1.2 4.2
2010 10.7 1.3 5.7
2011 13.4 1.4 6.0
This population included 7.9% Economically Disadvantaged, 1.2% Limited English
Proficiency; and 4.2% Special Education in 2009. This changed to 13.4% Economically
Disadvantaged, 1.4% Limited English Proficiency, and 6.0% Special Education in 2011.
HS 9
I described the school enrollment for HS 9 in Table 31.

84
Table 31
The Student Enrollment in HS 9 from 2007-2011
Year Total Population
2007 3,172
2008 3,118
2009 2,984
2010 2,953
2011 3,149
In HS 9 the student population decreased from 3,172 in 2007 to 3,149 in 2011. I described
the cultural diversity for HS 9 in Table 32.

85
Table 32
The Ethnicity Population in HS 9 from 2007-2011
Year
African
American (%)
Hispanic
(%)
White
(%)
Native
American (%)
Asian/Island
Pacific (%)
2007 11.9 36.5 40.7 0.3 10.7
2008 12.7 37.9 37.6 0.3 11.6
2009 12.9 38.5 36.6 0.3 11.8
2010 13.4 40.4 34.1 0.2 11.8
2011 13.1 46.0 26.5 0.1 11.2
The 2006-2007 AEIS report reflected a student demographic population of 11.9% African
American; 36.5% Hispanic; 40.7% White; 0.3% Native American; and 10.7% Asian/Pacific
Islander. As of the 2010-2011 AEIS report, the student demographic population of the school
consisted of 13.1% African American; 46.0% Hispanic; 26.5% White; 0.1% American
Indian; and 11.2% Asian/Pacific Islander. I described the learner diversity for HS 9 in Table
33.

86
Table 33
The Learner Diversity Population in HS 9 from 2007-2011
Year
Economically
Disadvantaged (%)
Limited English
Proficiency (%)
Special Education
(%)
2007 26.1 5.0 7.1
2008 28.9 6.1 7.5
2009 33.1 5.5 7.3
2010 35.5 5.5 6.9
2011 41.8 5.1 6.8
This population included 26.1% Economically Disadvantaged, 5.0% Limited English
Proficiency, and 7.1% Special Education in 2007. The student learner diversity population
changed to 41.8% Economically Disadvantaged, 5.1% Limited English Proficiency, and
6.8% Special Education in 2011.
HS 10
I described the school enrollment for HS 10 in Table 34.

87
Table 34
The Student Enrollment in HS 10 from 2007-2011
Year Total Population
2007 2,114
2008 3,201
2009 3,479
2010 3,153
2011 2,681
The student population increased from 2,114 in 2007 to 2,681 in 2011. I described the
cultural diversity for HS 10 in Table 35.
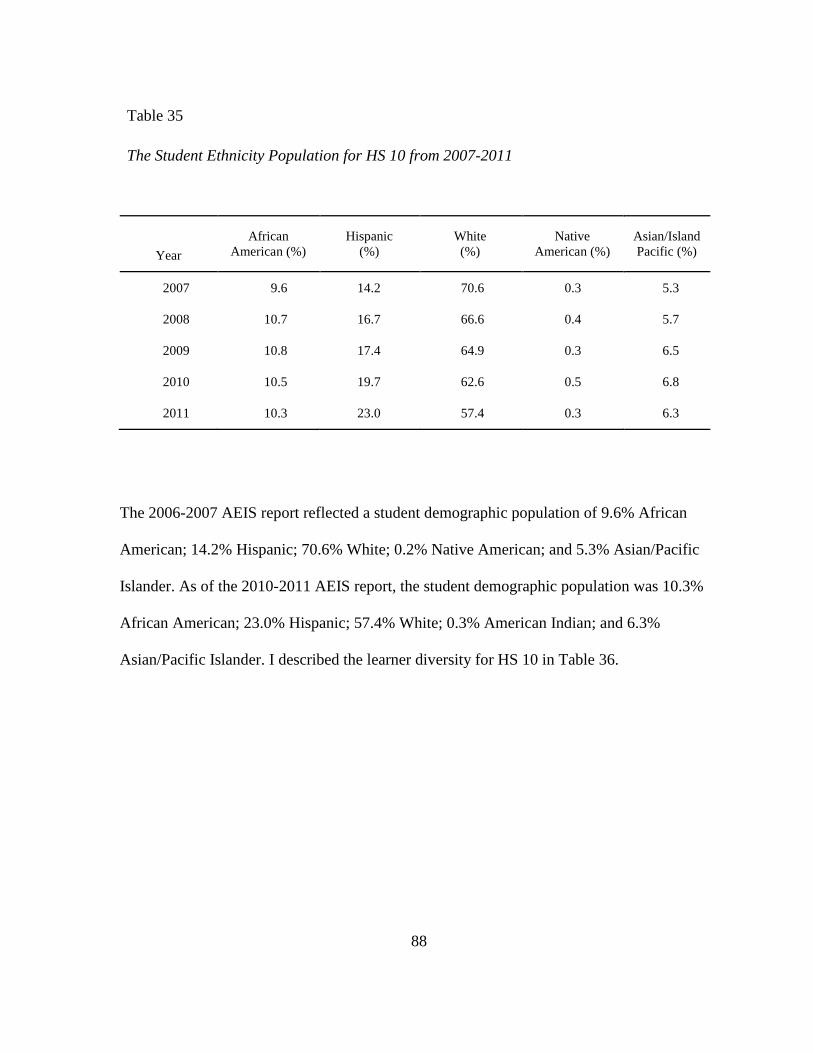
88
Table 35
The Student Ethnicity Population for HS 10 from 2007-2011
Year
African
American (%)
Hispanic
(%)
White
(%)
Native
American (%)
Asian/Island
Pacific (%)
2007 9.6 14.2 70.6 0.3 5.3
2008 10.7 16.7 66.6 0.4 5.7
2009 10.8 17.4 64.9 0.3 6.5
2010 10.5 19.7 62.6 0.5 6.8
2011 10.3 23.0 57.4 0.3 6.3
The 2006-2007 AEIS report reflected a student demographic population of 9.6% African
American; 14.2% Hispanic; 70.6% White; 0.2% Native American; and 5.3% Asian/Pacific
Islander. As of the 2010-2011 AEIS report, the student demographic population was 10.3%
African American; 23.0% Hispanic; 57.4% White; 0.3% American Indian; and 6.3%
Asian/Pacific Islander. I described the learner diversity for HS 10 in Table 36.
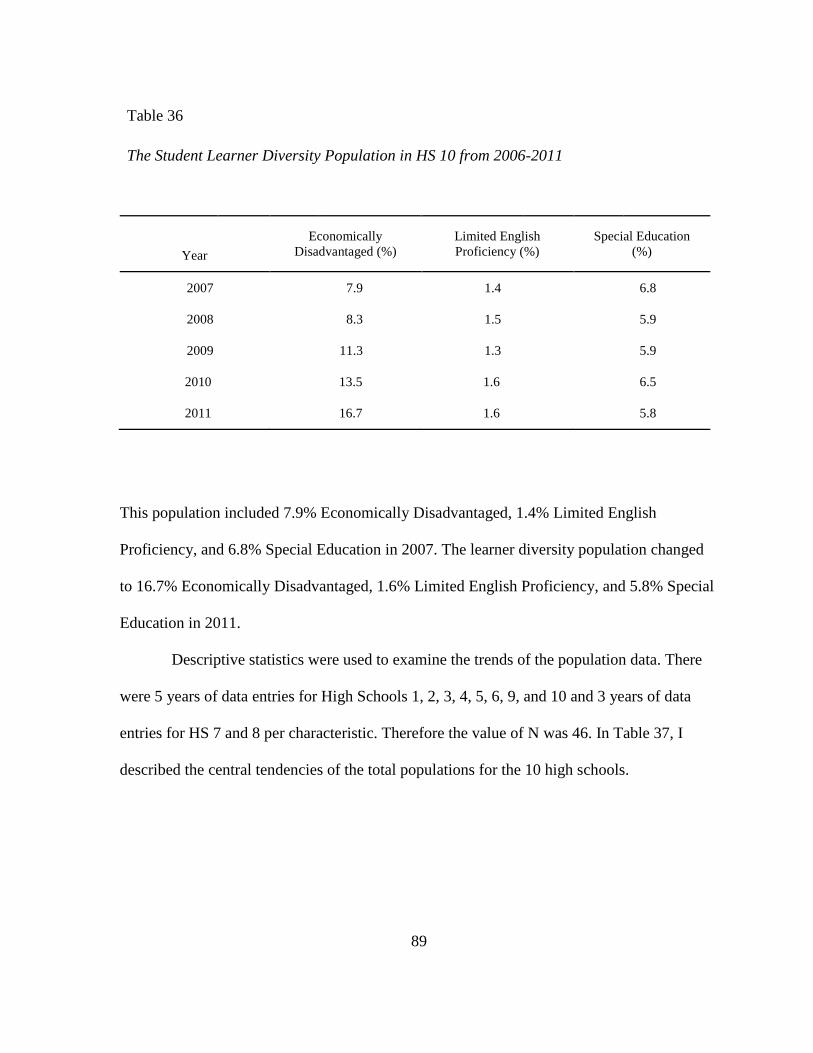
89
Table 36
The Student Learner Diversity Population in HS 10 from 2006-2011
Year
Economically
Disadvantaged (%)
Limited English
Proficiency (%)
Special Education
(%)
2007 7.9 1.4 6.8
2008 8.3 1.5 5.9
2009 11.3 1.3 5.9
2010 13.5 1.6 6.5
2011 16.7 1.6 5.8
This population included 7.9% Economically Disadvantaged, 1.4% Limited English
Proficiency, and 6.8% Special Education in 2007. The learner diversity population changed
to 16.7% Economically Disadvantaged, 1.6% Limited English Proficiency, and 5.8% Special
Education in 2011.
Descriptive statistics were used to examine the trends of the population data. There
were 5 years of data entries for High Schools 1, 2, 3, 4, 5, 6, 9, and 10 and 3 years of data
entries for HS 7 and 8 per characteristic. Therefore the value of N was 46. In Table 37, I
described the central tendencies of the total populations for the 10 high schools.
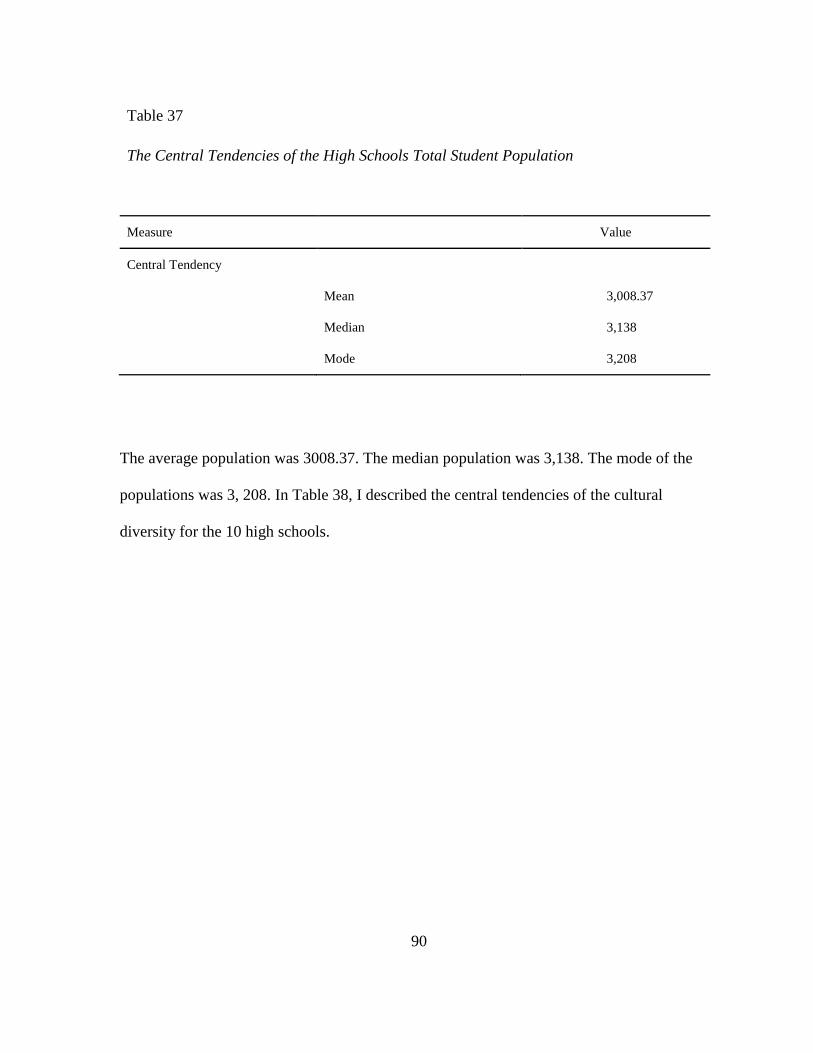
90
Table 37
The Central Tendencies of the High Schools Total Student Population
Measure Value
Central Tendency
Mean 3,008.37
Median 3,138
Mode 3,208
The average population was 3008.37. The median population was 3,138. The mode of the
populations was 3, 208. In Table 38, I described the central tendencies of the cultural
diversity for the 10 high schools.
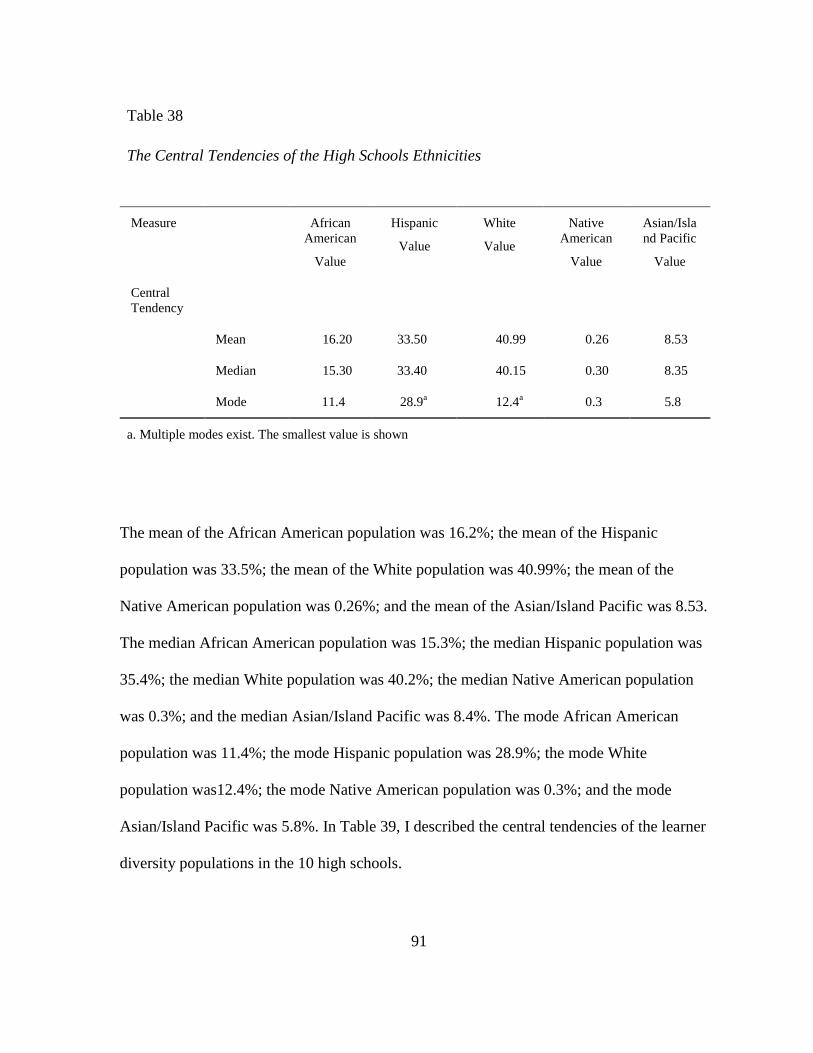
91
Table 38
The Central Tendencies of the High Schools Ethnicities
Measure African
American
Value
Hispanic
Value
White
Value
Native
American
Value
Asian/Isla
nd Pacific
Value
Central
Tendency
Mean 16.20 33.50 40.99 0.26 8.53
Median 15.30 33.40 40.15 0.30 8.35
Mode 11.4 28.9a 12.4
a 0.3 5.8
a. Multiple modes exist. The smallest value is shown
The mean of the African American population was 16.2%; the mean of the Hispanic
population was 33.5%; the mean of the White population was 40.99%; the mean of the
Native American population was 0.26%; and the mean of the Asian/Island Pacific was 8.53.
The median African American population was 15.3%; the median Hispanic population was
35.4%; the median White population was 40.2%; the median Native American population
was 0.3%; and the median Asian/Island Pacific was 8.4%. The mode African American
population was 11.4%; the mode Hispanic population was 28.9%; the mode White
population was12.4%; the mode Native American population was 0.3%; and the mode
Asian/Island Pacific was 5.8%. In Table 39, I described the central tendencies of the learner
diversity populations in the 10 high schools.

92
Table 39
The Central Tendencies of the High Schools Student Learner Diversity Population
Measure Economical
Disadvantaged
Value
Limited English
Proficiency
Value
Special Education
Value
Central
Tendency
Mean 31.552 4.646 7.546
Median 32.150 5.000 7.400
Mode 7.9a 1.3
a 7.3
a
a. Multiple modes exist. The smallest value is shown
The mean of the Economical Disadvantaged was 31.6%; the mean of the Limited English
Proficiency was 4.7%; and the mean of Special Education was 7.5%. The median
Economical Disadvantaged was 32.1%; the median Limited English Proficiency was 5.0%
and the median Special Education was 7.4%. The mode Economical Disadvantaged was
7.9%; the mode Limited English Proficiency was 1.3% and the mode Special Education was
7.3%.
Results of Initial Research Task 1
The goal of the Initial Research Task 1 was to analyze the implementation level of
PBIS at each PBIS high school. The observation of the level of implementation at the campus
level included the use of two surveys; Principal PBIS Implementation Survey (Appendix A)
and the employee perception survey, Effective Behavior Support (EBS) (Appendix B).

93
Schools HS 9 and HS 10 were not included in this objective because these schools did not
implement PBIS.
I administered the first survey, the Principal PBIS Implementation Survey, to the
current principals of the PBIS high schools to record the PBIS implementation practices of
the campus during the span of the study. The principals reported the number of years PBIS
had been practiced on their campus, the composition of the PBIS leadership team, the
composition of the team used to develop the campus PBIS motto and matrix, and information
about initial and on-going PBIS training and support practices for staff and students.
The second survey, the EBS survey was administered electronically by the
Department of Campus Improvement and Research of the school district to the staff members
of each PBIS school. The second tool recorded the perception of staff members regarding the
“In Place” PBIS practices in the school.
The collection of the data began from the year of implementation into the first high
school, 2006-2007 and continued until 2010-2011. The criterions in the Initial Research Task
1 were assigned a numerical value based upon the level of participation. The total values of
each school were compared to one another to determine the overall level of implementation
of each school in the Initial Research Task 2. The possible implementation level outcomes
were high, moderate, low, or none.
The Duration of PBIS
The first year of district implementation, 2006-2007, included two high schools, HS1
and HS 2. Four high schools, HS 3, HS 4, HS 5 and HS 6, were added in the 2007-2008
school year. However, HS 4 only practiced PBIS for two years. HS 7 and HS 8 opened in
2008-2009, as PBIS high schools. The remaining two high schools, HS 9 and HS 10 did not

94
implement PBIS. In Figure 1 there is a display of the number of years PBIS was practiced in
the observed high schools.
Figure 1. Duration of PBIS Implementation
Figure 1. HS 1 and HS 2 participated for 5 years. The value for HS 1 and HS 2 were 5. HS 3,
HS 5, and HS 6 participated in PBIS for 4 years and therefore had a value of 4. HS 7 and HS
8 participated in PBIS for 3 years and had a value of 3. HS 4 participated in PBIS for 2 years
and had a value of 2. HS 9 and HS 10 had a value of zero.
The Composition of the PBIS Leadership Team
A commonality of each school was the introductory training. The campus leadership
team provided a training day for the staff members on PBIS concepts and practices prior to
the fall semester of their first implementation year. The composition of the leadership teams
are displayed in Figure 2.
0
1
2
3
4
5
1 2 3 4 5 6 7 8 9 10
Ye
ars
High Schools
Duration of PBIS Implementation
Years of Implementation

95
Figure 2. Composition of PBIS Leadership Teams
Figure 2. The leadership team of HS 3 and HS 8 was comprised of administrators and
teachers only. The value for these high schools was 2. The leadership team of HS 1, HS 2,
HS 5, HS 6 and HS 7 comprised of administrators, teachers and educational/teaching
assistants. The value of these high schools was 3. The leadership team of HS 4 included
administrators, teachers, educational/teaching assistants and custodial staff. The value of
these high schools was 4. HS 9 and HS 10 had a value of zero.
The Composition of the PBIS Motto and Matrix Team
After the campus leadership team trained the staff, a team was assembled to develop
the PBIS matrix and motto. The composition of the teams used to develop the campus motto
and matrix are displayed in Figure 3.
0
1
2
3
4
5
6
7
8
1 2 3 4 5 6 7 8 9 10
Team
Me
mb
ers
High Schools
Composition of the PBIS Leadership Team
Administrators
Teachers
Paraprofessionals
Custodial Staff

96
Figure 3. Composition of PBIS Motto and Matrix Development Teams
Figure 3. The motto and matrix development committee of HS 2 consisted of only teachers.
HS 2 was given the numerical value of 1. The committee members of HS 1, HS 5, HS 7 and
HS 8 each had three types of members: administrators, teachers and paraprofessionals
(educational/teaching assistants). The resulting numerical value of these high schools was 3.
In addition to administrators, teachers and educational/teaching assistants, HS 3 and HS 6
included community members such as parents. This additional inclusion increased the values
of HS 3 and HS 6 to 4. The motto and matrix development team at HS 4 consisted of the
aforementioned members as well as the custodial and cafeteria staff. Therefore, HS 4 was
assigned the value of 6. HS 9 and HS 10 had a value of 0.
0
1
2
3
4
5
6
7
8
1 2 3 4 5 6 7 8 9 10
Team
Me
mb
ers
High Schools
Composition of thePBIS Motto & Matrix Development Teams
Administrators
Teachers
Paraprofessionals
Students
Parents
Custodial Staff

97
PBIS Training and Support in the Initial Training Year
The initial year of training was equal at all PBIS campuses. The leadership team of
each high school received two days of training and development on the concepts and
principals of PBIS. The training was provided by the Department of Student Services. The
value of 1 was assigned to each school because they did participate in the initial training.
Ongoing PBIS Practices
After the first year, the principals participating in the survey revealed variations in the
amount of on-going PBIS training and staff development with students and staff. In Figure 4,
I displayed the levels of staff development and student training practice in each school.
Figure 4. On-going Staff and Student PBIS Practices
1
2
3
4
1 2 3 4 5 6 7 8 9 10
PB
IS T
rain
ing
Leve
l
High Schools
On-going Staff & Student PBIS Practices
Staff
Student
4=High 3=Moderate 2=Low 1=None

98
Figure 4. I described the implementation practices in HS 2, HS 5, and HS 8 as high. The
principals at these schools integrated the staff and student awareness and training of the PBIS
concepts multiple times during the year into various activities. I described the
implementation practices in HS 3 and HS 7 as moderate. The leadership team reviewed PBIS
a few times a year and as necessary with teachers in need of additional support. I described
the implementation practices of HS 1, HS 4, and HS 6 as low. These schools completed the
minimal amount of review with staff and students, usually once a year at the beginning of
year. HS 9 and HS 10 were rated as none in both of these criterions.
Staff Perceptions of PBIS Practices
The Effective Behavior Support (EBS) survey was designed by Sugai, Horner &
Todd (2000) to help school administrators evaluate the current status and areas of growth in
four areas of support provided by the PBIS system; the host environment, the team
management of data, non-classroom settings/active supervision, and the classroom (Sugai,
Homer, &Todd, 2000). The EBS Survey was administered to staff members at the end of
each school year. According to the designers of the survey, all staff members should take the
survey the initial year. The district in this study administered the survey electronically to
every staff member in schools using the PBIS system.
During this study, the EBS Survey was administered during the 2007-2008 through
2010-2011 school years. The 2007-2008 & 2008-2009 surveys contained 45 questions. The
2009-2010 survey contained 27 questions. The 2010-2011 survey contained 28 questions.
For comparative purposes, only the common questions were reviewed; therefore only the
twenty-seven common questions were examined. I displayed the quantity of questions
examined by the researcher in each evaluated support area of PBIS in Table 40.

99
Table 40
Number of EBS Survey Questions in each Category
Category of Support Number of Questions
Host Environment (HE) 4
Team Management Data (TMD) 8
Non-Classroom/Active Supervision (NC) 6
Classroom (CL) 9
Total Questioned Analyzed 27
The EBS questions were asked in two parts: current status and priority for improvement.
However, since the purpose of this study was to analyze the current level of implementation;
the answers related to the current status were recorded. In Table 78 (appendix F), a summary
of each high school’s EBS survey results is displayed.
Survey participants were able to rate each of the areas by selecting whether the
process was in place (high), partially in place (moderate), or not in place (low). Blank answer
choices were not included in the analysis. The categorization of the perspective of the staff in
each area was completed in two parts; first by totaling the number of “in place” choice
selections for each question in the category then dividing the resulting number by the number
of survey participants for each category. A high level was assigned to the category if the
resulting percentage was 70% or higher. A moderate level was assigned if the resulting
percentage was between 50 and 69%. A low level was assigned if the resulting percentage
was at or below 49%. The levels were assigned a corresponding numerical value. The high

100
level was 4, the moderate level was 3 and the low level was 2. Then the values for each year
were totaled to give a total EBS for the span of the study.
Results of Initial Research Task 2
There were 6 factors in the Initial Research Task 1 used to calculate the level of
implementation at the campus level: a) the number of years the school participated in PBIS;
b) the composition of the leadership team; c) the composition of the PBIS motto and matrix
development team; d) the initial training; e) the ongoing training practices for staff and
students; and f) the EBS survey results. The calculations for High Schools 1-8 are given
below in Table 41.
Table 41
The Calculations of Factors for Research Task 2
Factor HS 1 HS 2 HS 3 HS 4 HS 5 HS 6 HS 7 HS 8
A 5 5 4 2 4 4 3 3
B 3 3 2 4 3 3 3 2
C 3 1 4 6 3 4 3 3
D 4 4 4 4 4 4 4 4
E 2 4 3 4 4 2 3 4
F 46 61 47 25 42 52 46 47
Total 63 78 64 45 60 69 62 63
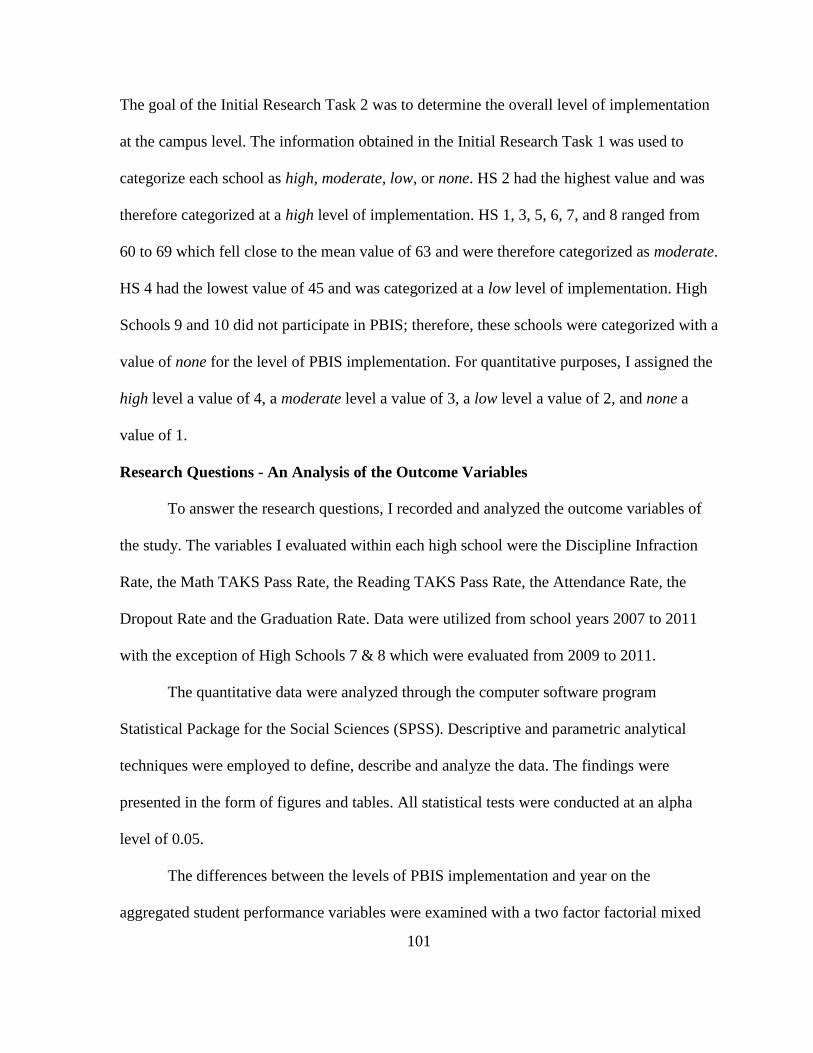
101
The goal of the Initial Research Task 2 was to determine the overall level of implementation
at the campus level. The information obtained in the Initial Research Task 1 was used to
categorize each school as high, moderate, low, or none. HS 2 had the highest value and was
therefore categorized at a high level of implementation. HS 1, 3, 5, 6, 7, and 8 ranged from
60 to 69 which fell close to the mean value of 63 and were therefore categorized as moderate.
HS 4 had the lowest value of 45 and was categorized at a low level of implementation. High
Schools 9 and 10 did not participate in PBIS; therefore, these schools were categorized with a
value of none for the level of PBIS implementation. For quantitative purposes, I assigned the
high level a value of 4, a moderate level a value of 3, a low level a value of 2, and none a
value of 1.
Research Questions - An Analysis of the Outcome Variables
To answer the research questions, I recorded and analyzed the outcome variables of
the study. The variables I evaluated within each high school were the Discipline Infraction
Rate, the Math TAKS Pass Rate, the Reading TAKS Pass Rate, the Attendance Rate, the
Dropout Rate and the Graduation Rate. Data were utilized from school years 2007 to 2011
with the exception of High Schools 7 & 8 which were evaluated from 2009 to 2011.
The quantitative data were analyzed through the computer software program
Statistical Package for the Social Sciences (SPSS). Descriptive and parametric analytical
techniques were employed to define, describe and analyze the data. The findings were
presented in the form of figures and tables. All statistical tests were conducted at an alpha
level of 0.05.
The differences between the levels of PBIS implementation and year on the
aggregated student performance variables were examined with a two factor factorial mixed

102
model analysis of variance, ANOVA (Fields, 2009). Mauchly’s test of sphericity was
conducted to determine if the variance/covariance matrix was significantly different from an
identity matrix (Fields, 2009). To determine whether there was significance in the tests of
within-subjects, one of two tests was used. If sphericity was met, the results of the Sphericity
Assumed were used. If sphericity was not met, the results of the Lower-bound were used
(Fields, 2009). If significance was found in the within-subjects test for interaction, a Simple
Main Effects (SME) analysis was performed. If the SME was significant, the value of the
Sidak test was used to determine where significance occurred. If a significant main effect for
Year was obtained, trend analysis and Sidak were used to probe the difference.
The Discipline Infraction Rate
The number of discipline infractions for the high schools was obtained from the
school district. The number of discipline infractions was transformed into a percentage rate
by dividing the number of incidents by the student population for each high school. A display
of the resulting values is found in Tables 79 – 88 (Appendix G).
The values of the Discipline Infraction Rate of the high PBIS implementation high
school, HS 2, ranged from 116.6% to 169.7%.The values of the moderate high schools, HS 1,
3, 5, 6, 7, and 8 were as follows: (a) values of the Discipline Infraction Rate of HS 1 ranged
from 112.6% to 176.4%, (b) values of the Discipline Infraction Rate of HS 3 ranged from
68.1% to 95.7%, (c) values of the Discipline Infraction Rate of HS 5 ranged from 82.3% to
108.4%, (d) values of the Discipline Infraction Rate of HS 6 ranged from 79.9% to 115.8%,
(e) values of the Discipline Infraction Rate of HS 7 ranged from 148.4% to 171.7%, and (f)
values of the Discipline Infraction Rate of HS 8 ranged from 68.1% to 95.7%.

103
The values of the low PBIS implementation high school, HS 4, ranged from 86.2% to
116.3%. The values of the none PBIS implementation high schools, HS 9 and 10 were as
follows: (a) values of the Discipline Infraction Rate of HS 9 ranged from 82% to 119.9%, (b)
values of the Discipline Infraction Rate of HS 10 for each year were all under 100%, and (c)
the range of the Discipline Infraction Rate was 54.4% to 92.3%. For all schools, the
Discipline Infraction Rates that were less than 100% represent a rate less than the student
population. The values over 100% indicate that the percentage of Discipline Infraction Rate
was greater than the student population.
The Discipline Infraction Rate for the Differing Levels of PBIS Implementation
and Years
Mauchly’s Test of Sphericity was conducted to test the null hypothesis of whether the
covariance matrix of the orthonormalized transformed Discipline Infraction Rate data was
proportional to an identity matrix. The assumption of sphericity was met (p= 0.241). A two-
factor factorial mixed model analysis of the Discipline Infraction Rate Level of PBIS
Implementation and Years was conducted. In Table 42, there is a display of the within-
subject effects.
In Table 42, with Sphericity assumed, there was not a significant interaction for Years
and Level of PBIS implementation (p=0.263) yet there was a large effect size of 0.400.
However, there was a significant main effect obtained for Years (p=0.003) along with a large
effect of 0.469 and a high power of 0.935. A post hoc Sidak test and trend analysis was
conducted on the Years. The results of the Sidak test are presented in Table 43.
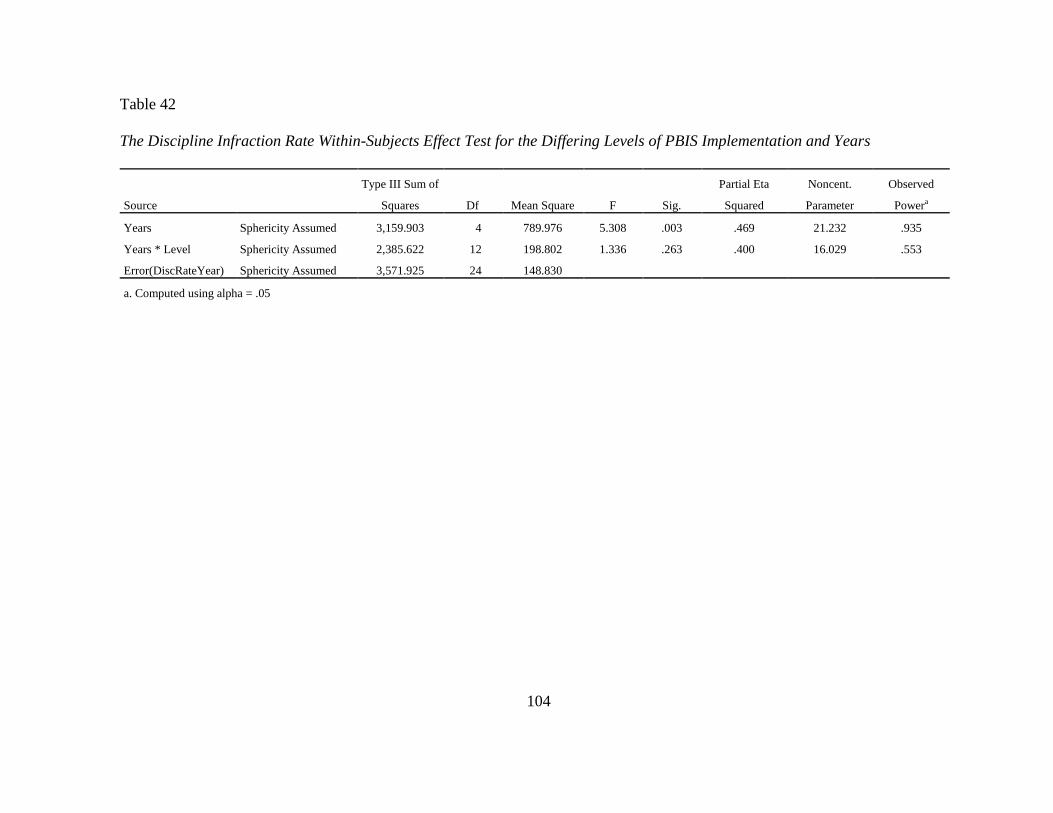
104
Table 42
The Discipline Infraction Rate Within-Subjects Effect Test for the Differing Levels of PBIS Implementation and Years
Source
Type III Sum of
Squares Df Mean Square F Sig.
Partial Eta
Squared
Noncent.
Parameter
Observed
Powera
Years Sphericity Assumed 3,159.903 4 789.976 5.308 .003 .469 21.232 .935
Years * Level Sphericity Assumed 2,385.622 12 198.802 1.336 .263 .400 16.029 .553
Error(DiscRateYear) Sphericity Assumed 3,571.925 24 148.830
a. Computed using alpha = .05

105
Table 43
The Discipline Infraction Rate Sidak Test for the Differing Levels of PBIS Implementation
between the Years
(I) Years (J) Years Mean Difference
(I-J)
Std. Error Sig.b 95% Confidence Interval for Differenceb
Lower Bound Upper Bound
1
2 -3.787 4.560 .997 -23.377 15.802
3 20.171 10.033 .615 -22.929 63.270
4 15.133 9.584 .836 -26.036 56.302
5 20.367 5.992 .136 -5.374 46.107
2
1 3.787 4.560 .997 -15.802 23.377
3 23.958 8.438 .259 -12.290 60.207
4 18.921 6.861 .285 -10.555 48.396
5 24.154* 4.205 .012 6.092 42.217
3
1 -20.171 10.033 .615 -63.270 22.929
2 -23.958 8.438 .259 -60.207 12.290
4 -5.037 3.983 .946 -22.149 12.074
5 .196 7.400 1.000 -31.595 31.987
4
1 -15.133 9.584 .836 -56.302 26.036
2 -18.921 6.861 .285 -48.396 10.555
3 5.037 3.983 .946 -12.074 22.149
5 5.233 6.349 .997 -22.039 32.506
5
1 -20.367 5.992 .136 -46.107 5.374
2 -24.154* 4.205 .012 -42.217 -6.092
3 -.196 7.400 1.000 -31.987 31.595
4 -5.233 6.349 .997 -32.506 22.039
Based on estimated marginal means
*. The mean difference is significant at the .05 level.
b. Adjustment for multiple comparisons: Sidak.

106
Table 44
The Discipline Infraction Rate Main Effect Within-Subjects Contrast Test for the Differing Levels of PBIS Implementation and
Years
Source Year Type III Sum of
Squares
df Mean Square F Sig. Partial Eta
Squared
Noncent.
Parameter
Observed
Powera
Years
Linear 2135.172 1 2135.172 12.376 .013 .673 12.376 .832
Quadratic 51.426 1 51.426 .201 .670 .032 .201 .067
Cubic 183.225 1 183.225 2.397 .173 .285 2.397 .258
Order 4 790.080 1 790.080 8.775 .025 .594 8.775 .696
Error(Years)
Linear 1035.143 6 172.524
Quadratic 1538.026 6 256.338
Cubic 458.558 6 76.426
Order 4 540.198 6 90.033
a. Computed using alpha = .05

107
Table 45
The Discipline Infraction Rate Between-Subjects Effect Test for the Differing Levels of PBIS Implementation
Source
Type III Sum of
Squares Df Mean Square F Sig. Partial Eta Squared Noncent. Parameter Observed Powera
Level 10452.618 3 3,484.206 .589 .644 .227 1.767 .115
Error 35501.980 6 5,916.997
a. Computed using alpha = .05

108
In Table 43, with the Sidak test, there is a statistically significant difference between
Years 2 and 5 (p=0.012) for the Discipline Infraction Rate. In Table 44, there is a display of
the trend analysis for the Year. I identified a statically significant linear trend (p=0.013) with
a large effect size of 0.673 and quartic trend (p=0.025) with a large size of 0.594 for the
Year. However, the majority, 2135.172, of the total sums of squares, 3139.903, was
explained in a linear trend. This decreasing linear trend can be viewed in Figure 5.
In Table 45, there is a display of the main effect of Years for the differing Levels of
PBIS implementation. There was not a statically significant value for the between-subjects
effects for the differing Levels of PBIS implementation (p=0.644). In Figure 5, there is a
display of the Discipline Infraction Rate mean values for the differing Levels of PBIS
implementation.
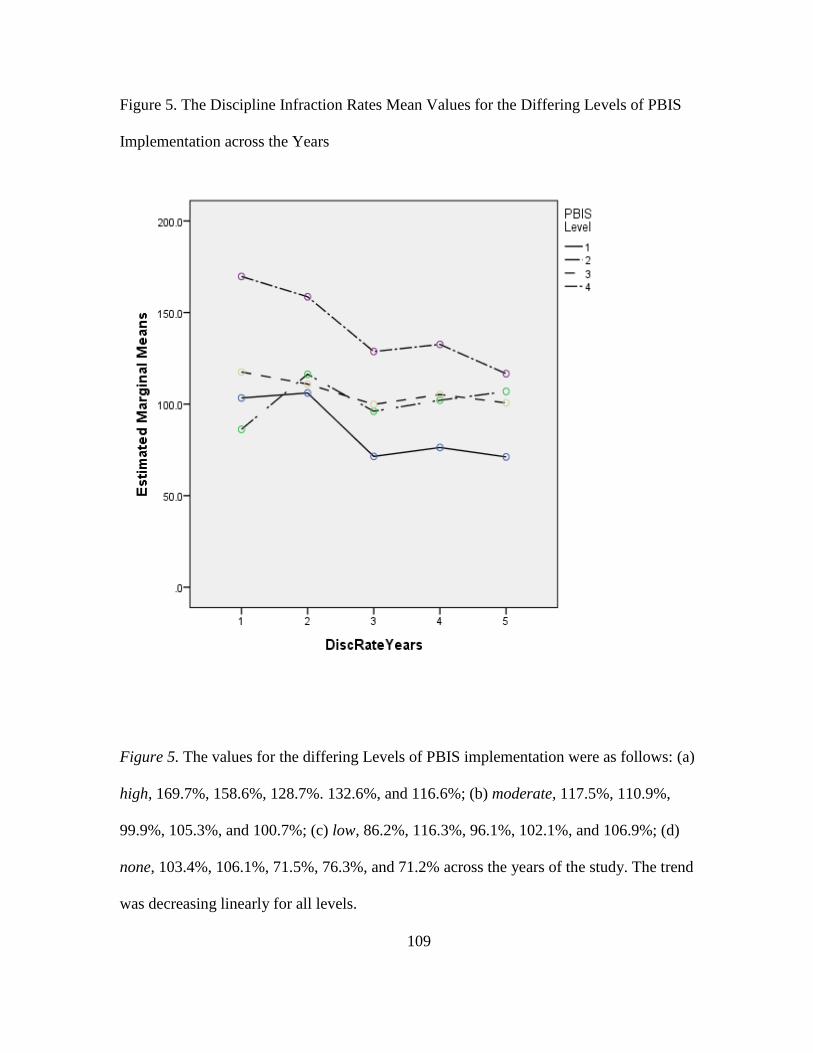
109
Figure 5. The Discipline Infraction Rates Mean Values for the Differing Levels of PBIS
Implementation across the Years
Figure 5. The values for the differing Levels of PBIS implementation were as follows: (a)
high, 169.7%, 158.6%, 128.7%. 132.6%, and 116.6%; (b) moderate, 117.5%, 110.9%,
99.9%, 105.3%, and 100.7%; (c) low, 86.2%, 116.3%, 96.1%, 102.1%, and 106.9%; (d)
none, 103.4%, 106.1%, 71.5%, 76.3%, and 71.2% across the years of the study. The trend
was decreasing linearly for all levels.
110
The Discipline Infraction Rate for the PBIS Implementation and Years
Mauchly’s Test of Sphericity was conducted to test the null hypothesis of whether the
covariance matrix of the orthonormalized transformed Discipline Infraction Rate data was
proportional to an identity matrix. The assumption of sphericity was met (p=0.189). A two-
factor factorial mixed model analysis of PBIS Implementation and Years was conducted. In
Table 46, there is a display of the within-subject effects.
In Table 46, with Sphericity assumed, there was not a significant interaction for Years
and PBIS implementation (p=0.448). However, there was a significant main effect obtained
for Years (p=0.001) along with a large effect size of 0.436 and a high power of 0.974. A post
hoc Sidak test and trend analysis were conducted on the Years. The results of the Sidak test
are presented in Table 47.
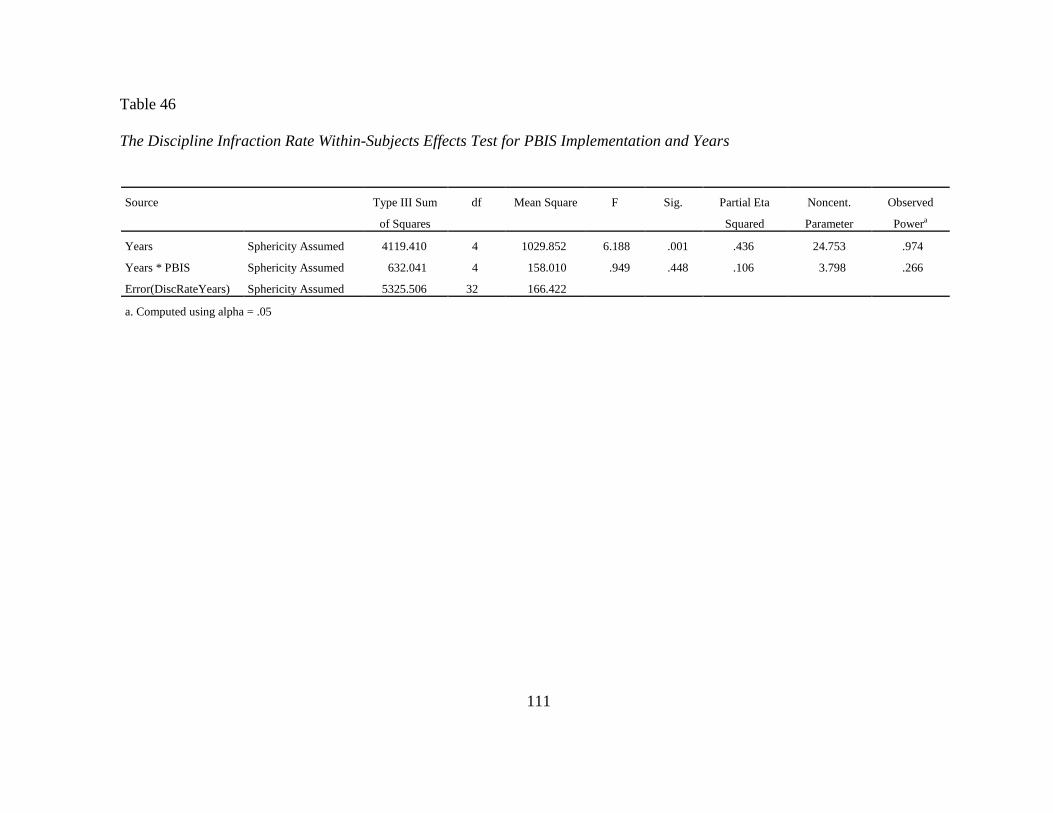
111
Table 46
The Discipline Infraction Rate Within-Subjects Effects Test for PBIS Implementation and Years
Source Type III Sum
of Squares
df Mean Square F Sig. Partial Eta
Squared
Noncent.
Parameter
Observed
Powera
Years Sphericity Assumed 4119.410 4 1029.852 6.188 .001 .436 24.753 .974
Years * PBIS Sphericity Assumed 632.041 4 158.010 .949 .448 .106 3.798 .266
Error(DiscRateYears) Sphericity Assumed 5325.506 32 166.422
a. Computed using alpha = .05
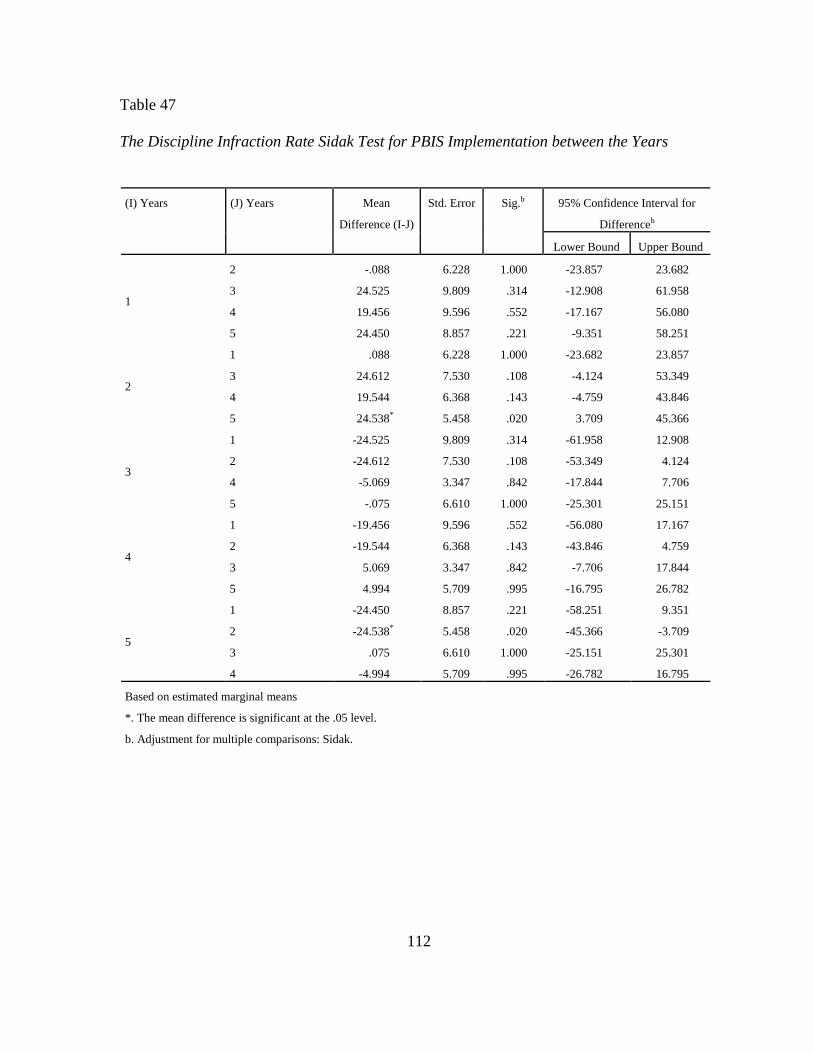
112
Table 47
The Discipline Infraction Rate Sidak Test for PBIS Implementation between the Years
(I) Years (J) Years Mean
Difference (I-J)
Std. Error Sig.b 95% Confidence Interval for
Differenceb
Lower Bound Upper Bound
1
2 -.088 6.228 1.000 -23.857 23.682
3 24.525 9.809 .314 -12.908 61.958
4 19.456 9.596 .552 -17.167 56.080
5 24.450 8.857 .221 -9.351 58.251
2
1 .088 6.228 1.000 -23.682 23.857
3 24.612 7.530 .108 -4.124 53.349
4 19.544 6.368 .143 -4.759 43.846
5 24.538* 5.458 .020 3.709 45.366
3
1 -24.525 9.809 .314 -61.958 12.908
2 -24.612 7.530 .108 -53.349 4.124
4 -5.069 3.347 .842 -17.844 7.706
5 -.075 6.610 1.000 -25.301 25.151
4
1 -19.456 9.596 .552 -56.080 17.167
2 -19.544 6.368 .143 -43.846 4.759
3 5.069 3.347 .842 -7.706 17.844
5 4.994 5.709 .995 -16.795 26.782
5
1 -24.450 8.857 .221 -58.251 9.351
2 -24.538* 5.458 .020 -45.366 -3.709
3 .075 6.610 1.000 -25.151 25.301
4 -4.994 5.709 .995 -26.782 16.795
Based on estimated marginal means
*. The mean difference is significant at the .05 level.
b. Adjustment for multiple comparisons: Sidak.

113
Table 48
The Discipline Infraction Rate Main Effect Within-Subjects Contrast Test for PBIS Implementation and Years
Source DiscRateYears Type III Sum of
Squares
df Mean Square F Sig. Partial Eta
Squared
Noncent.
Parameter
Observed
Powera
Years
Linear 2998.110 1 2998.110 10.288 .012 .563 10.288 .802
Quadratic 174.163 1 174.163 .835 .387 .095 .835 .128
Cubic 137.124 1 137.124 1.534 .251 .161 1.534 .194
Order 4 810.013 1 810.013 10.597 .012 .570 10.597 .813
Error(Years)
Linear 2331.237 8 291.405
Quadratic 1667.673 8 208.459
Cubic 715.097 8 89.387
Order 4 611.499 8 76.437
a. Computed using alpha = .05
Table 49
The Discipline Infraction Rate Between-Subjects Effects Test for PBIS Implementation
Source Type III Sum of
Squares
df Mean Square F Sig. Partial Eta Squared Noncent. Parameter Observed Powera
PBIS 4924.289 1 4924.289 .960 .356 .107 .960 .139
Error 41030.309 8 5128.789
a. Computed using alpha = .05

114
In Table 47, with the Sidak test, there was a statistically significant difference
between Years 2 and 5 (p=0.020) for the Discipline Infraction Rate. In Table 48, there is a
display of the trend analysis for the Years. I identified a statistically significant linear trend
(p=0.012) with a large effect size of 0.563 and quartic trend (p=0.012) with a large effect size
of 0.570 for the Years. However, the majority of the sums of squares, 2998.110, of the total
sum of squares, 4119.410, were explained in a linear trend. In Figure 6, the decreasing linear
trend can be viewed across the years of study for PBIS implementation and Years.
In Table 49, there is a display of the between-subjects effects of the Discipline
Infraction Rate for the PBIS implementation. There was not a statistically significant value
for the between-subjects effects for the PBIS and non-PBIS implementation (p=0.356). In
Figure 6, there is a display of the Discipline Infraction Rate mean values for the PBIS
implementation across the Years.
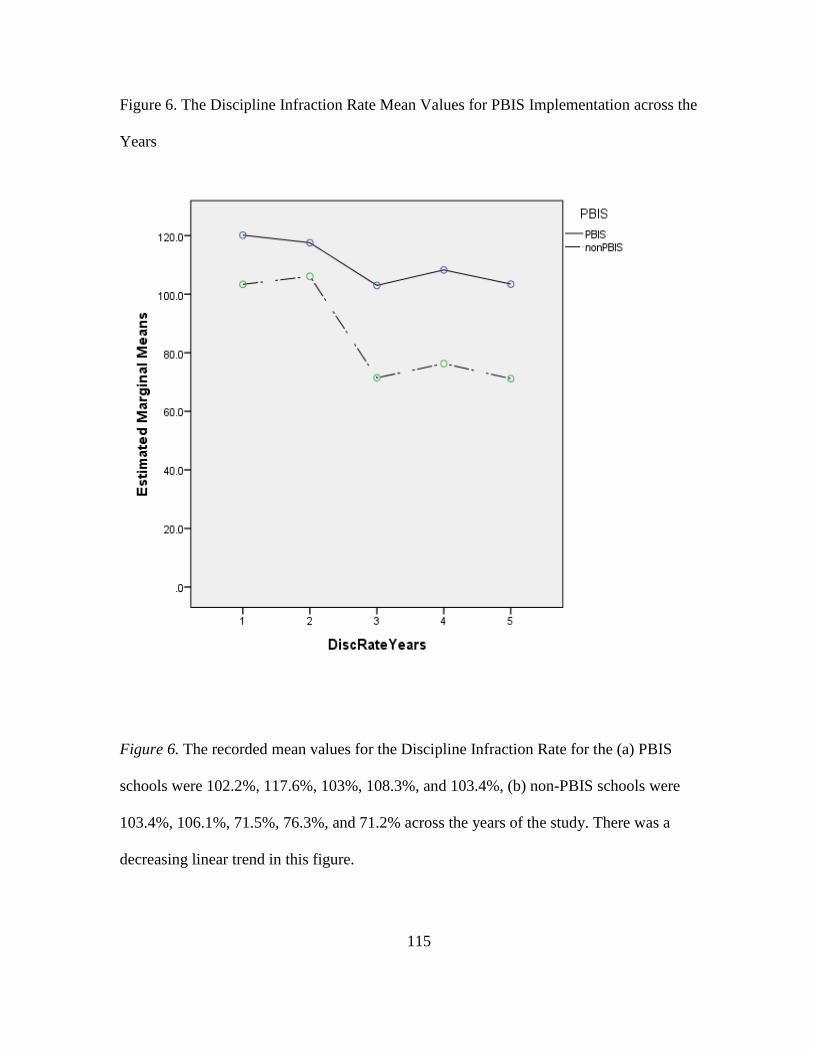
115
Figure 6. The Discipline Infraction Rate Mean Values for PBIS Implementation across the
Years
Figure 6. The recorded mean values for the Discipline Infraction Rate for the (a) PBIS
schools were 102.2%, 117.6%, 103%, 108.3%, and 103.4%, (b) non-PBIS schools were
103.4%, 106.1%, 71.5%, 76.3%, and 71.2% across the years of the study. There was a
decreasing linear trend in this figure.

116
The Math & Reading TAKS Pass Rates
The academic performance of the aggregated student groups was measured by the
performance on the math and reading TAKS. In Figures 17 – 26 (Appendix H) there is a
display of results of the math and reading TAKS scores for the High Schools 1-10. Data were
revealed from school years 2007 to 2011 with the exception of High Schools 7 & 8 which
were examined from 2009 to 2011.
The values of Math TAKS Pass Rate of the high PBIS implementation high school,
HS 2, were as follows. The Math TAKS Pass Rate ranged from 71% to 78% and the Reading
TAKS Pass Rate ranged from 90% to 92%. The Math and Reading TAKS Pass Rate for the
moderate PBIS implementation level high schools, HS 1, 3, 5, 6, 7 and 8 were as follows (a)
HS 1, the Math TAKS Pass Rate ranged from 64% to 72% and the Reading TAKS Pass Rate
ranged from 89% to 93%; (b) HS 3, the Math TAKS Pass Rate ranged from 85% to 91% and
the Reading TAKS Pass Rate ranged from 94% to 97%; (c) HS 5, the Math TAKS Pass Rate
ranged from 77% to 85% and the Reading TAKS Pass Rate ranged from 90% to 95%; (d) HS
6, the Math TAKS Pass Rate ranged from 76% to 83% and the Reading TAKS Pass Rate
ranged from 88% to 94%; (e) HS 7, the Math TAKS Pass Rate ranged from 69% to 77% and
the Reading TAKS Pass Rate ranged from 92% to 94%; (f) HS 8, the Math TAKS Pass Rate
ranged from 92% to 93% and the Reading TAKS Pass Rate ranged from 98% to 99%.
For the low PBIS implementation level school, HS 4, the values of the Math TAKS
Pass Rate ranged from 74% to 84% and the Reading TAKS Pass Rate ranged from 89% to
96%. For the schools with none PBIS implementation, HS 9 and 10, the TAKS pass rates
were as follows (a) HS 9, the Math TAKS Pass Rate ranged from 75% to 83% and the

117
Reading TAKS Pass Rate ranged from 91% to 94%; (b) HS 10, the Math TAKS Pass Rate
ranged from 87% to 94% and the Reading TAKS Pass Rate ranged from 97% to 98%.
The Math TAKS Pass Rate for the Differing Levels of PBIS Implementation and
Years
Mauchly’s Test of Sphericity was conducted to test the null hypothesis of whether the
covariance matrix of the orthonormalized Math TAKS Pass Rate data was proportional to an
identity matrix. The assumption of sphericity was met (p=0.320). A two-factor factorial
mixed model analysis of the Level of PBIS Implementation and Years was conducted. In
Table 50, there is a display of the within-subject effects.
In Table 50, with Sphericity assumed, there was not a significant value was obtained
for Years and Level of PBIS implementation (p=0.581) yet there was a large effect size of
0.304. However, a statistically significant main effect was obtained for Years (p=0.000)
along with a large effect size of 0.768 and a high power of 1.000. A post hoc Sidak test and
trend analysis were conducted on the Years. The results of the Sidak test are presented in
Table 51.
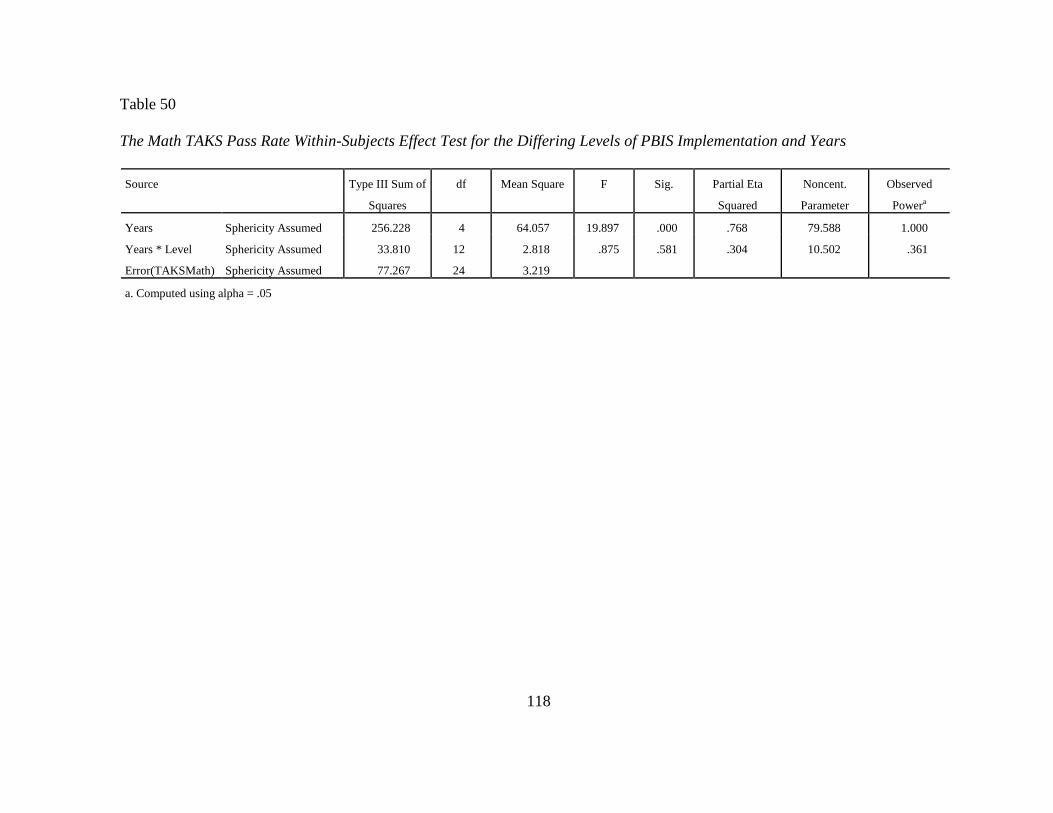
118
Table 50
The Math TAKS Pass Rate Within-Subjects Effect Test for the Differing Levels of PBIS Implementation and Years
Source Type III Sum of
Squares
df Mean Square F Sig. Partial Eta
Squared
Noncent.
Parameter
Observed
Powera
Years Sphericity Assumed 256.228 4 64.057 19.897 .000 .768 79.588 1.000
Years * Level Sphericity Assumed 33.810 12 2.818 .875 .581 .304 10.502 .361
Error(TAKSMath) Sphericity Assumed 77.267 24 3.219
a. Computed using alpha = .05
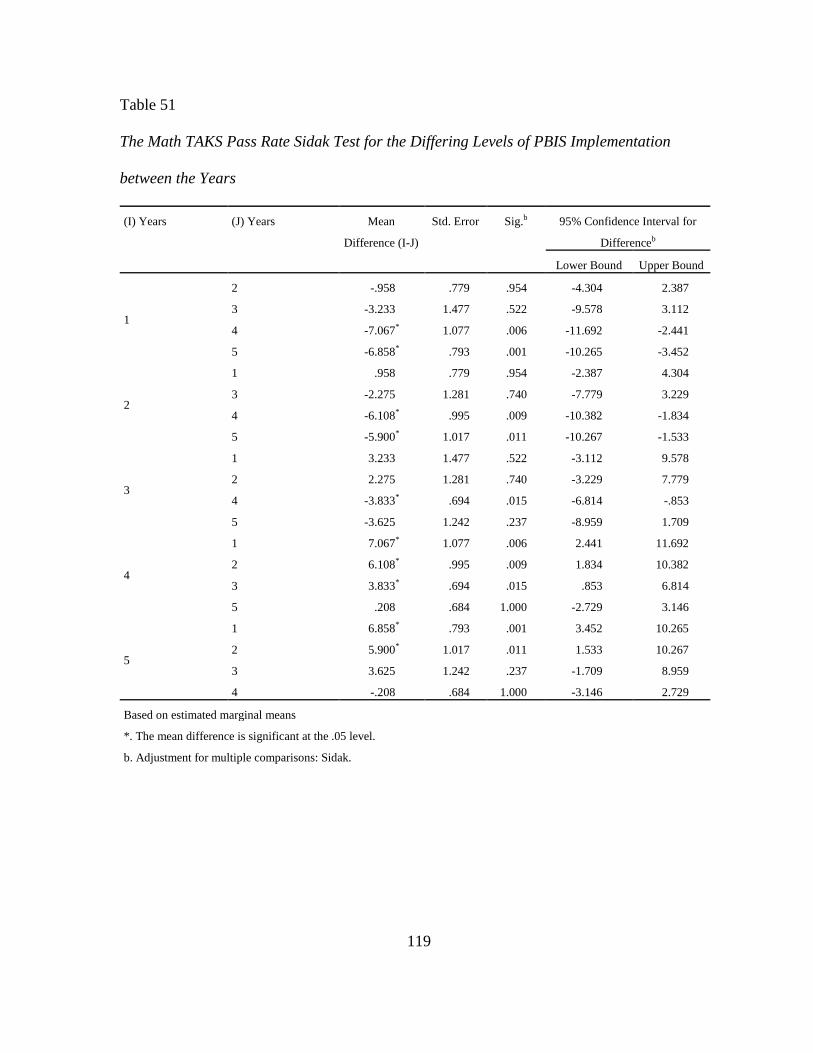
119
Table 51
The Math TAKS Pass Rate Sidak Test for the Differing Levels of PBIS Implementation
between the Years
(I) Years (J) Years Mean
Difference (I-J)
Std. Error Sig.b 95% Confidence Interval for
Differenceb
Lower Bound Upper Bound
1
2 -.958 .779 .954 -4.304 2.387
3 -3.233 1.477 .522 -9.578 3.112
4 -7.067* 1.077 .006 -11.692 -2.441
5 -6.858* .793 .001 -10.265 -3.452
2
1 .958 .779 .954 -2.387 4.304
3 -2.275 1.281 .740 -7.779 3.229
4 -6.108* .995 .009 -10.382 -1.834
5 -5.900* 1.017 .011 -10.267 -1.533
3
1 3.233 1.477 .522 -3.112 9.578
2 2.275 1.281 .740 -3.229 7.779
4 -3.833* .694 .015 -6.814 -.853
5 -3.625 1.242 .237 -8.959 1.709
4
1 7.067* 1.077 .006 2.441 11.692
2 6.108* .995 .009 1.834 10.382
3 3.833* .694 .015 .853 6.814
5 .208 .684 1.000 -2.729 3.146
5
1 6.858* .793 .001 3.452 10.265
2 5.900* 1.017 .011 1.533 10.267
3 3.625 1.242 .237 -1.709 8.959
4 -.208 .684 1.000 -3.146 2.729
Based on estimated marginal means
*. The mean difference is significant at the .05 level.
b. Adjustment for multiple comparisons: Sidak.
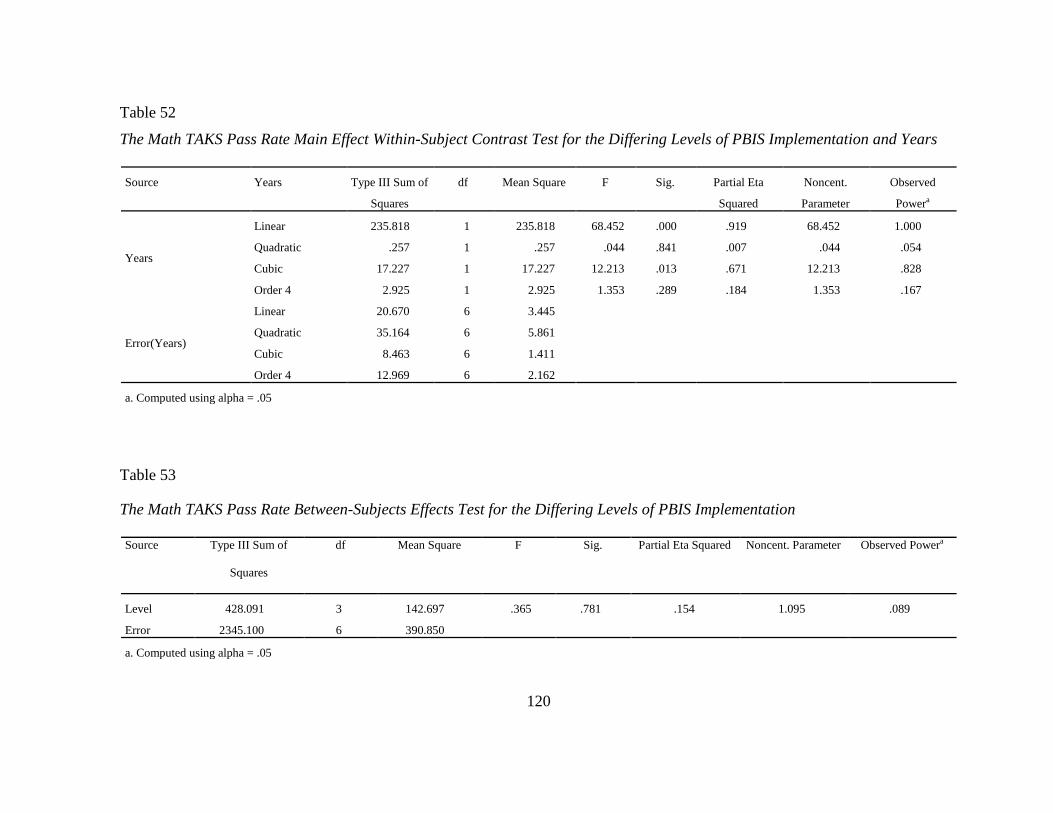
120
Table 52
The Math TAKS Pass Rate Main Effect Within-Subject Contrast Test for the Differing Levels of PBIS Implementation and Years
Source Years Type III Sum of
Squares
df Mean Square F Sig. Partial Eta
Squared
Noncent.
Parameter
Observed
Powera
Years
Linear 235.818 1 235.818 68.452 .000 .919 68.452 1.000
Quadratic .257 1 .257 .044 .841 .007 .044 .054
Cubic 17.227 1 17.227 12.213 .013 .671 12.213 .828
Order 4 2.925 1 2.925 1.353 .289 .184 1.353 .167
Error(Years)
Linear 20.670 6 3.445
Quadratic 35.164 6 5.861
Cubic 8.463 6 1.411
Order 4 12.969 6 2.162
a. Computed using alpha = .05
Table 53
The Math TAKS Pass Rate Between-Subjects Effects Test for the Differing Levels of PBIS Implementation
Source Type III Sum of
Squares
df Mean Square F Sig. Partial Eta Squared Noncent. Parameter Observed Powera
Level 428.091 3 142.697 .365 .781 .154 1.095 .089
Error 2345.100 6 390.850
a. Computed using alpha = .05
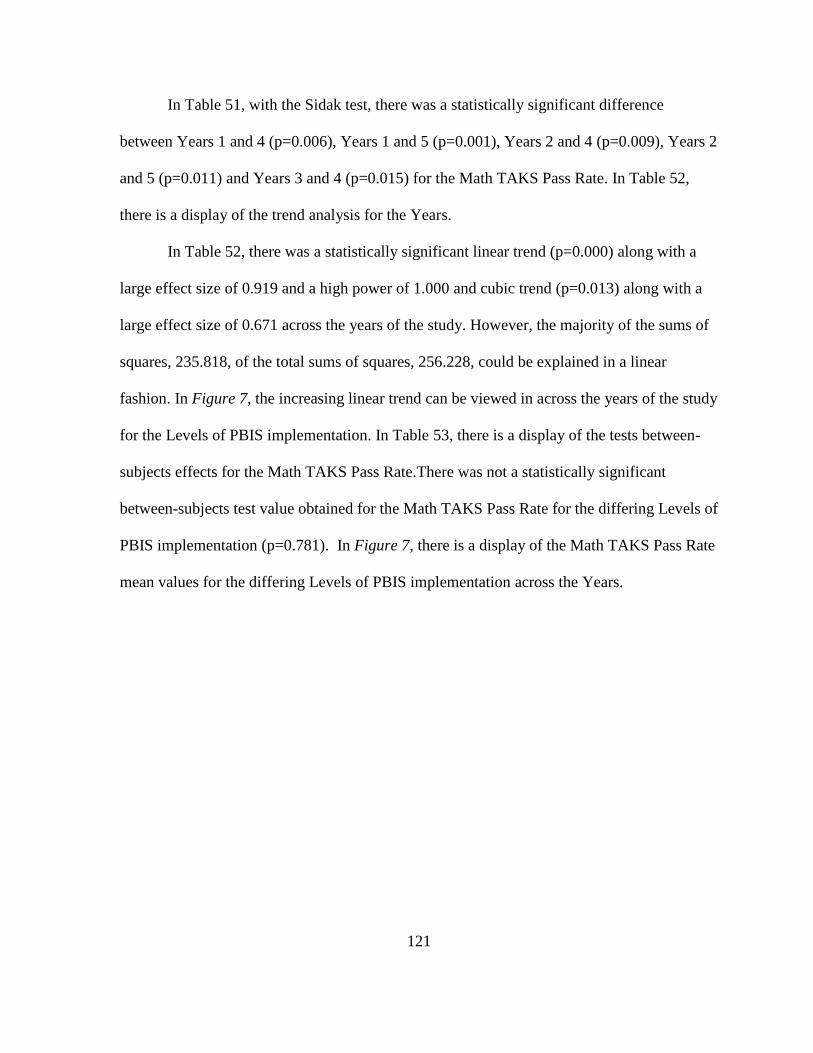
121
In Table 51, with the Sidak test, there was a statistically significant difference
between Years 1 and 4 (p=0.006), Years 1 and 5 (p=0.001), Years 2 and 4 (p=0.009), Years 2
and 5 (p=0.011) and Years 3 and 4 (p=0.015) for the Math TAKS Pass Rate. In Table 52,
there is a display of the trend analysis for the Years.
In Table 52, there was a statistically significant linear trend (p=0.000) along with a
large effect size of 0.919 and a high power of 1.000 and cubic trend (p=0.013) along with a
large effect size of 0.671 across the years of the study. However, the majority of the sums of
squares, 235.818, of the total sums of squares, 256.228, could be explained in a linear
fashion. In Figure 7, the increasing linear trend can be viewed in across the years of the study
for the Levels of PBIS implementation. In Table 53, there is a display of the tests between-
subjects effects for the Math TAKS Pass Rate.There was not a statistically significant
between-subjects test value obtained for the Math TAKS Pass Rate for the differing Levels of
PBIS implementation (p=0.781). In Figure 7, there is a display of the Math TAKS Pass Rate
mean values for the differing Levels of PBIS implementation across the Years.

122
Figure 7. The Math TAKS Pass Rate Mean Values for the Differing Levels of PBIS
Implementation across the Years
Figure 7. The values for the differing Levels of PBIS implementation were as follows: (a)
high, 71%, 71%, 73%, 78%, and 78%; (b) moderate, 78.6%, 79%, 80%, 83%, and 82.5%; (c)
low, 74%, 75%, 79%, 84%, and 83%; (d) none, 81%, 84.5%, 85.5%, 87.5%, and 88.5%.
There was an increasing linear trend for the Math TAKS Pass Rate across the years of the
study.
123
The Math TAKS Pass Rate for PBIS Implementation and Years
Mauchly’s Test of Sphericity was conducted to test the null hypothesis of whether the
covariance matrix of the orthonormalized Math TAKS Pass Rate data was proportional to an
identity matrix. The assumption of sphericity was met (p=0.053). A two-factor factorial
mixed model analysis of PBIS Implementation and Years was conducted. In Table 54, there
is a display of the within-subject effects.
In Table 54, with Sphericity assumed, there was not a significant interaction for Years
and PBIS implementation (p=0.625). However, a significant main effect (p=0.000) was
obtained along with a large effect size of 0.657 and a high power of 1.000 for Years. A post
hoc Sidak test and trend analysis were conducted on the Years. The results of the Sidak test
are presented in Table 55.
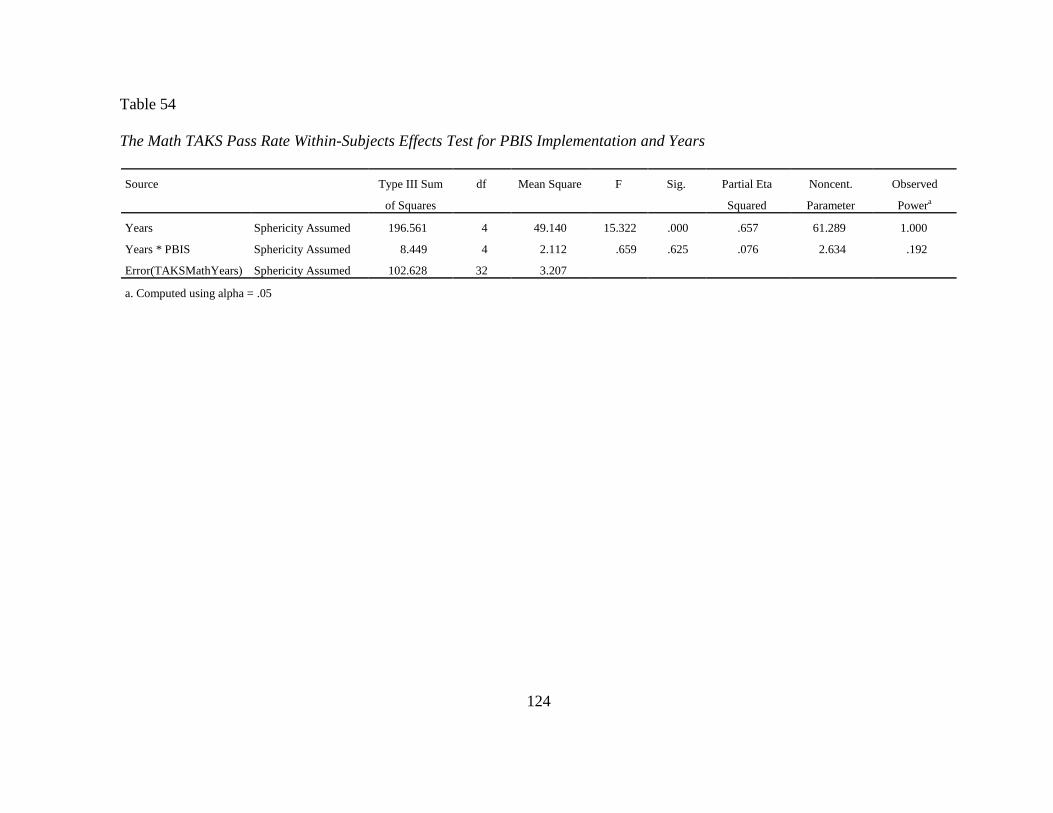
124
Table 54
The Math TAKS Pass Rate Within-Subjects Effects Test for PBIS Implementation and Years
Source Type III Sum
of Squares
df Mean Square F Sig. Partial Eta
Squared
Noncent.
Parameter
Observed
Powera
Years Sphericity Assumed 196.561 4 49.140 15.322 .000 .657 61.289 1.000
Years * PBIS Sphericity Assumed 8.449 4 2.112 .659 .625 .076 2.634 .192
Error(TAKSMathYears) Sphericity Assumed 102.628 32 3.207
a. Computed using alpha = .05
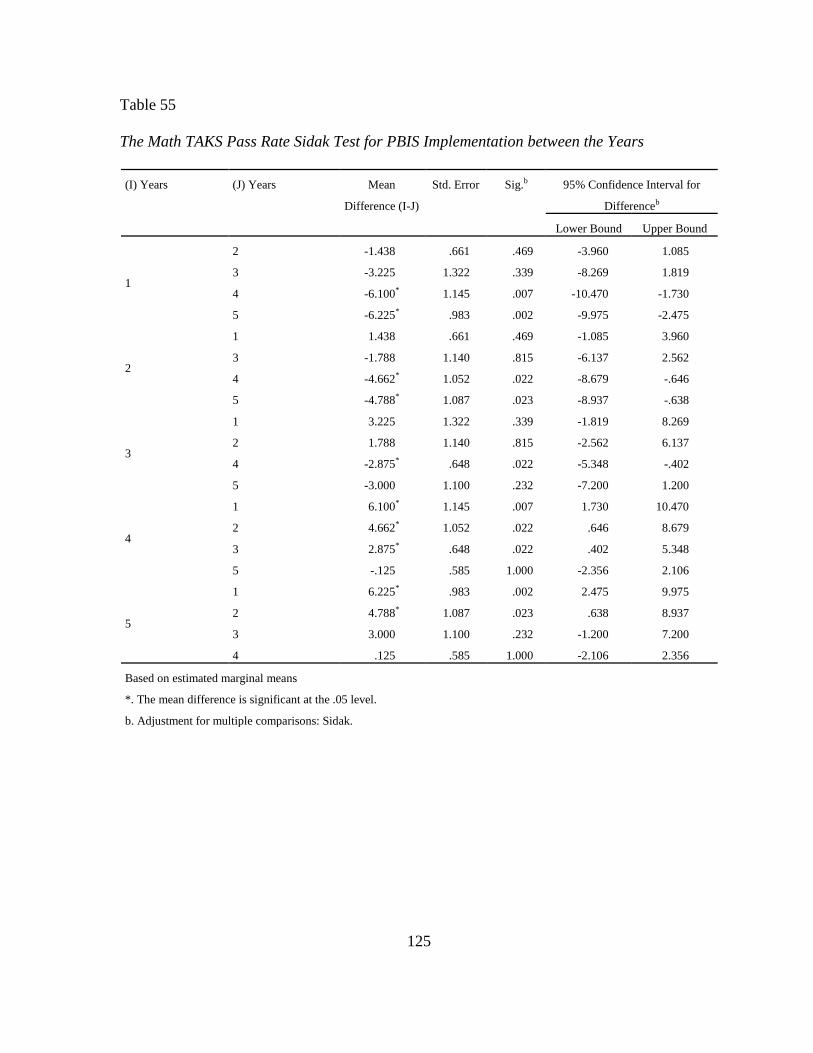
125
Table 55
The Math TAKS Pass Rate Sidak Test for PBIS Implementation between the Years
(I) Years (J) Years Mean
Difference (I-J)
Std. Error Sig.b 95% Confidence Interval for
Differenceb
Lower Bound Upper Bound
1
2 -1.438 .661 .469 -3.960 1.085
3 -3.225 1.322 .339 -8.269 1.819
4 -6.100* 1.145 .007 -10.470 -1.730
5 -6.225* .983 .002 -9.975 -2.475
2
1 1.438 .661 .469 -1.085 3.960
3 -1.788 1.140 .815 -6.137 2.562
4 -4.662* 1.052 .022 -8.679 -.646
5 -4.788* 1.087 .023 -8.937 -.638
3
1 3.225 1.322 .339 -1.819 8.269
2 1.788 1.140 .815 -2.562 6.137
4 -2.875* .648 .022 -5.348 -.402
5 -3.000 1.100 .232 -7.200 1.200
4
1 6.100* 1.145 .007 1.730 10.470
2 4.662* 1.052 .022 .646 8.679
3 2.875* .648 .022 .402 5.348
5 -.125 .585 1.000 -2.356 2.106
5
1 6.225* .983 .002 2.475 9.975
2 4.788* 1.087 .023 .638 8.937
3 3.000 1.100 .232 -1.200 7.200
4 .125 .585 1.000 -2.106 2.356
Based on estimated marginal means
*. The mean difference is significant at the .05 level.
b. Adjustment for multiple comparisons: Sidak.

126
Table 56
The Math TAKS Pass Rate Main Effect Within-Subjects Contrast Test for PBIS Implementation and Years
Source TAKSMathYears Type III Sum of
Squares
df Mean Square F Sig. Partial Eta
Squared
Noncent.
Parameter
Observed
Powera
Years
Linear 187.416 1 187.416 34.865 .000 .813 34.865 .999
Quadratic 1.081 1 1.081 .237 .639 .029 .237 .072
Cubic 6.150 1 6.150 4.884 .058 .379 4.884 .493
Order 4 1.914 1 1.914 1.169 .311 .127 1.169 .159
Error(Years)
Linear 43.004 8 5.375
Quadratic 36.451 8 4.556
Cubic 10.074 8 1.259
Order 4 13.099 8 1.637
a. Computed using alpha = .05
Table 57
The Math TAKS Pass Rates Between-Subjects Effects Test for PBIS Implementation
Source Type III Sum of
Squares
df Mean Square F Sig. Partial Eta Squared Noncent.
Parameter
Observed Powera
PBIS 246.864 1 246.864 .782 .402 .089 .782 .122
Error 2526.327 8 315.791
a. Computed using alpha = .05

127
In Table 55, with the Sidak test, there was a statistically significant difference
between Years 1 and 4 (p=0.007), Years 1 and 5 (p=0.002), Years 2 and 4 (p=0.022), Years 2
and 5 (p=0.023), and Years 3 and 4 (p=0.022) for the Math TAKS Pass Rate. In Table 56,
there is a display of the trend analysis for the Math TAKS Pass Rate Year.
In Table 56, I identified a statistically significant linear trend (p=0.000) observed
across the years of the study with a large effect size of 0.813 and a high power of 0.999. The
majority of the sum of squares was explained in a linear trend. In Figure 8, the increasing
linear trend can be viewed across the Years of study for the Math TAKS Pass Rate. In Table
57, there is a display of the between-subjects effects for the Math TAKS Pass Rate for PBIS
implementation.
In Table 57, there was not a statistically significant between-subject effects test value
obtained for the Math TAKS Pass Rates of PBIS implementation (p=0.089). In Figure 8,
there is display of the Math TAKS Pass Rate mean values for PBIS implementation across
the Years.

128
Figure 8. The Math TAKS Pass Rate Mean Values for PBIS Implementation across the Years
Figure 8. The recorded mean values for the (a) PBIS schools were 77.1%, 77.4%, 79.0%,
82.8%, and 82.0%; and (b) non- PBIS schools were 81%, 84.5%, 85.5%, 87.5%, and 88.5%.
The mean values had a positive linear trend.

129
The Reading TAKS Pass Rate for the Differing Levels of PBIS Implementation and
Years
Mauchly’s Test of Sphericity was conducted to test the null hypothesis of whether the
covariance matrix of the orthonormalized Reading TAKS Pass Rate data was proportional to
an identity matrix. The assumption of sphericity was not met (p= 0.009). A two-factor
factorial mixed model analysis of the Level of PBIS Implementation and Years was
conducted. In Table 58, there is a display of the within-subject effects.
In Table 58, with Lower-bound, there was not a significant interaction for Years and
Level of PBIS implementation (p=0.747). Also, there is not a significant main effect obtained
across the years (p=0.101). In Table 59, there is a display of the between-subjects effects of
the Reading TAKS Pass Rates for the differing Levels of PBIS implementation.

130
Table 58
The Reading TAKS Pass Rate Within-Subjects Effects Test for the Differing Levels of PBIS Implementation and Years
Source Type III Sum
of Squares
df Mean Square F Sig. Partial Eta
Squared
Noncent.
Parameter
Observed
Powera
Years Lower-bound 64.625 1.000 64.625 3.752 .101 .385 3.752 .371
Years * Level Lower-bound 21.600 3.000 7.200 .418 .747 .173 1.254 .095
Error(TAKSReadYears) Lower-bound 103.336 6.000 17.223
Table 59
The Reading TAKS Pass Rates Between-Subjects Effects Test for the Differing Levels of PBIS
Source Type III Sum of
Squares
df Mean Square F Sig. Partial Eta Squared Noncent. Parameter Observed Powera
Level 34.500 3 11.500 .189 .900 .086 .567 .070
Error 365.324 6 60.887
a. Computed using alpha = .05

131
In Table 59, there was not a statistical significance in the between-subjects effect of
the Reading TAKS Pass Rates at the differing Levels of PBIS implementation (p=0.900). In
Figure 9, there is a display of the Reading TAKS Pass Rate means for each of the differing
Levels of PBIS implementation.
Figure 9. The Reading TAKS Pass Rate Mean Values for the Differing Levels of PBIS
Implementation across the Years
132
Figure 9. The values for the differing Levels of PBIS implementation were as follows: (a)
high, 90%, 91%, 93%, 94%, and 92%; (b) moderate, 92%, 92.8%, 92.5%, 95.3, and 94.8%;
(c) low, 89%, 91%, 94%, 96%, and 95%; and (d) none, 94%, 94%, 95.5%, 96%, and 95.5%.
Reading TAKS Pass Rate for PBIS Implementation and Years
Mauchly’s Test of Sphericity is conducted to test the null hypothesis of whether the
covariance matrix of the orthonormalized Reading TAKS Pass Rate data is proportional to an
identity matrix. The assumption of sphericity is not met (p=0.001). A two-factor factorial
mixed model analysis of PBIS Implementation and Years was conducted. In Table 60, there
is a display of the within-subject effects.
In Table 60, with Lower-bound, there was not a significant interaction for Years and
PBIS implementation (p=0.566). There was also no significant main effect obtained for
Years (p=0.149). In Table 61, there is a display of the tests between subjects for the Reading
TAKS Pass Rates of PBIS implementation.

133
Table 60
The Reading TAKS Pass Rate Within-Subjects Effects Test for PBIS Implementation and Years
Source Type III Sum
of Squares
df Mean
Square
F Sig. Partial Eta
Squared
Noncent.
Parameter
Observed
Powera
Years Lower-bound 38.150 1.000 38.150 2.552 .149 .242 2.552 .291
Years * PBIS Lower-bound 5.350 1.000 5.350 .358 .566 .043 .358 .083
Error(TAKSReadYears) Lower-bound 119.586 8.000 14.948
a. Computed using alpha = .05
Table 61
The Reading TAKS Pass Rate Between-Subjects Test for PBIS Implementation
Source Type III Sum of
Squares
df Mean Square F Sig. Partial Eta Squared Noncent. Parameter Observed Powera
PBIS 24.500 1 24.500 .522 .490 .061 .522 .098
Error 375.324 8 46.916
a. Computed using alpha = .05
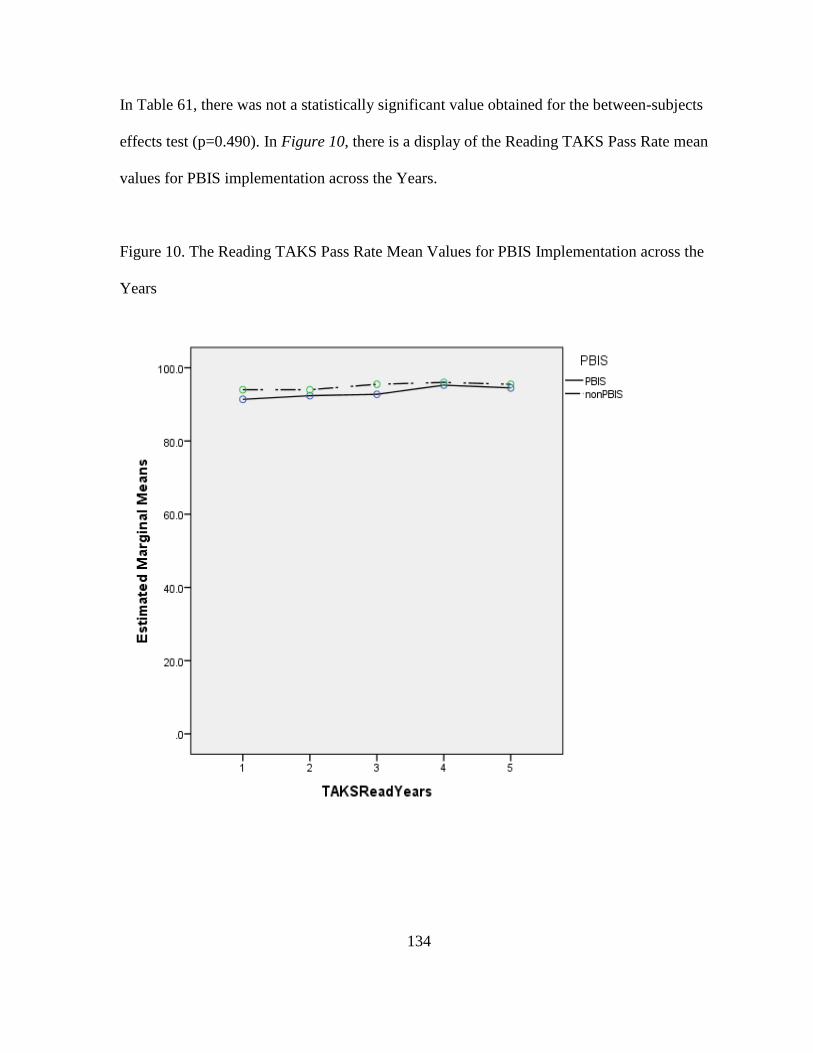
134
In Table 61, there was not a statistically significant value obtained for the between-subjects
effects test (p=0.490). In Figure 10, there is a display of the Reading TAKS Pass Rate mean
values for PBIS implementation across the Years.
Figure 10. The Reading TAKS Pass Rate Mean Values for PBIS Implementation across the
Years
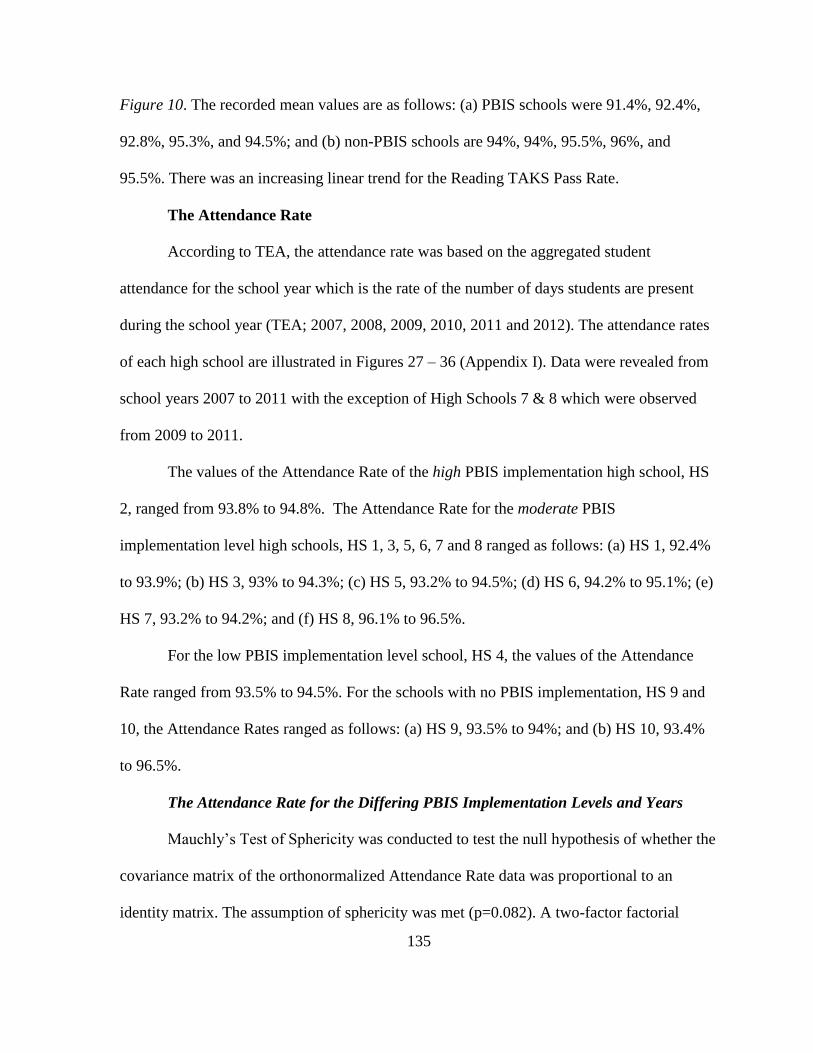
135
Figure 10. The recorded mean values are as follows: (a) PBIS schools were 91.4%, 92.4%,
92.8%, 95.3%, and 94.5%; and (b) non-PBIS schools are 94%, 94%, 95.5%, 96%, and
95.5%. There was an increasing linear trend for the Reading TAKS Pass Rate.
The Attendance Rate
According to TEA, the attendance rate was based on the aggregated student
attendance for the school year which is the rate of the number of days students are present
during the school year (TEA; 2007, 2008, 2009, 2010, 2011 and 2012). The attendance rates
of each high school are illustrated in Figures 27 – 36 (Appendix I). Data were revealed from
school years 2007 to 2011 with the exception of High Schools 7 & 8 which were observed
from 2009 to 2011.
The values of the Attendance Rate of the high PBIS implementation high school, HS
2, ranged from 93.8% to 94.8%. The Attendance Rate for the moderate PBIS
implementation level high schools, HS 1, 3, 5, 6, 7 and 8 ranged as follows: (a) HS 1, 92.4%
to 93.9%; (b) HS 3, 93% to 94.3%; (c) HS 5, 93.2% to 94.5%; (d) HS 6, 94.2% to 95.1%; (e)
HS 7, 93.2% to 94.2%; and (f) HS 8, 96.1% to 96.5%.
For the low PBIS implementation level school, HS 4, the values of the Attendance
Rate ranged from 93.5% to 94.5%. For the schools with no PBIS implementation, HS 9 and
10, the Attendance Rates ranged as follows: (a) HS 9, 93.5% to 94%; and (b) HS 10, 93.4%
to 96.5%.
The Attendance Rate for the Differing PBIS Implementation Levels and Years
Mauchly’s Test of Sphericity was conducted to test the null hypothesis of whether the
covariance matrix of the orthonormalized Attendance Rate data was proportional to an
identity matrix. The assumption of sphericity was met (p=0.082). A two-factor factorial
136
mixed model analysis of Level of PBIS Implementation and Years was conducted. In Table
62, there is a display of the within-subject effects.
In Table 62, with Sphericity assumed, there was not a significant interaction for Years
and PBIS implementation (p=0.703). There was also no significant main effect obtained for
Years (p=0.082). In Table 63, there is a display of the test between-subjects effect for the
Attendance Rate across the differing Levels of PBIS implementation.
In Table 63, a statistically significant value was not obtained between-subject for the
Attendance Rate across Years at differing Levels of PBIS implementation. In Figure 11,
there is a display of the Attendance Rate mean values for the differing levels of PBIS
implementation across the Years.
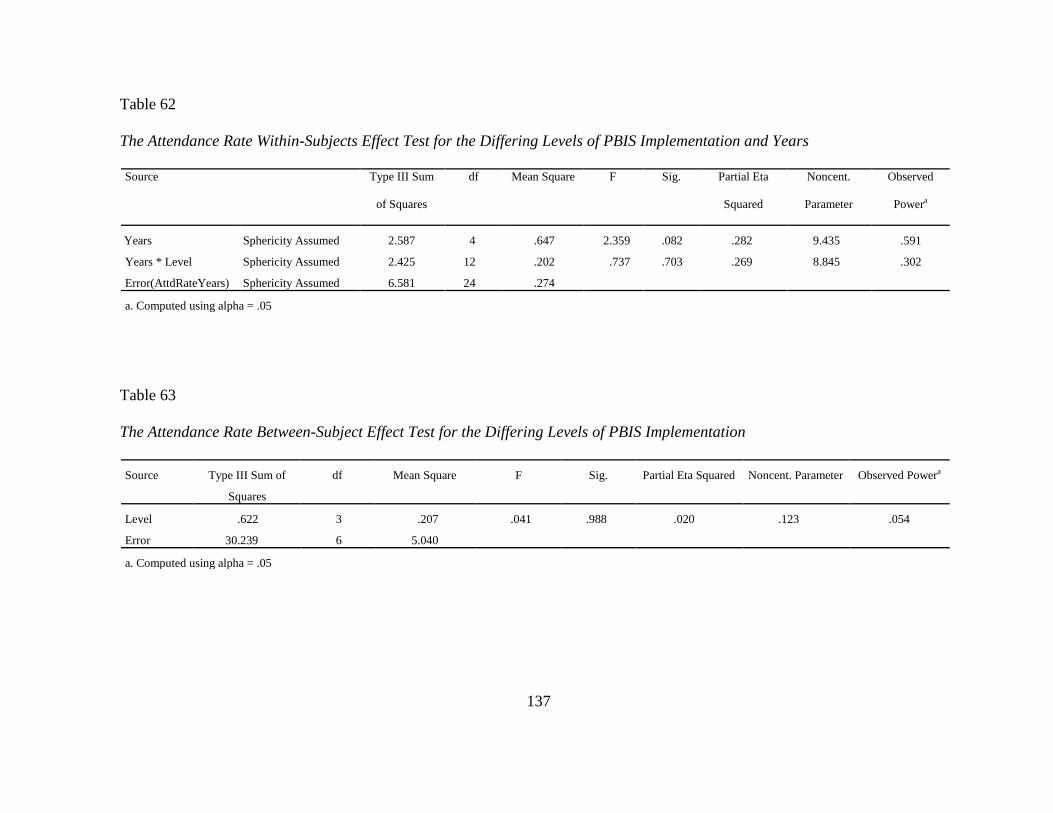
137
Table 62
The Attendance Rate Within-Subjects Effect Test for the Differing Levels of PBIS Implementation and Years
Source Type III Sum
of Squares
df Mean Square F Sig. Partial Eta
Squared
Noncent.
Parameter
Observed
Powera
Years Sphericity Assumed 2.587 4 .647 2.359 .082 .282 9.435 .591
Years * Level Sphericity Assumed 2.425 12 .202 .737 .703 .269 8.845 .302
Error(AttdRateYears) Sphericity Assumed 6.581 24 .274
a. Computed using alpha = .05
Table 63
The Attendance Rate Between-Subject Effect Test for the Differing Levels of PBIS Implementation
Source Type III Sum of
Squares
df Mean Square F Sig. Partial Eta Squared Noncent. Parameter Observed Powera
Level .622 3 .207 .041 .988 .020 .123 .054
Error 30.239 6 5.040
a. Computed using alpha = .05
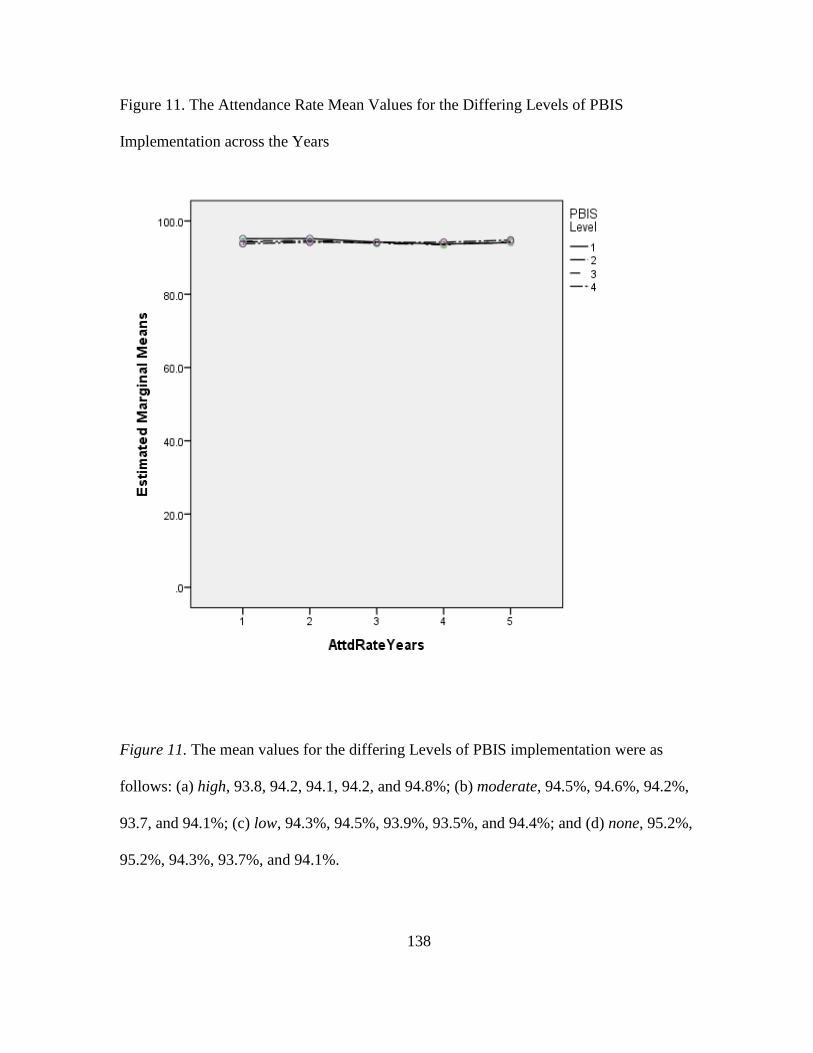
138
Figure 11. The Attendance Rate Mean Values for the Differing Levels of PBIS
Implementation across the Years
Figure 11. The mean values for the differing Levels of PBIS implementation were as
follows: (a) high, 93.8, 94.2, 94.1, 94.2, and 94.8%; (b) moderate, 94.5%, 94.6%, 94.2%,
93.7, and 94.1%; (c) low, 94.3%, 94.5%, 93.9%, 93.5%, and 94.4%; and (d) none, 95.2%,
95.2%, 94.3%, 93.7%, and 94.1%.

139
The Attendance Rate for PBIS Implementation and Years
Mauchly’s Test of Sphericity was conducted to test the null hypothesis of whether the
covariance matrix of the orthonormalized transformed Attendance Rate data was proportional
to an identity matrix. The assumption of sphericity was not met (p=0.005). A two-factor
factorial mixed model analysis of PBIS Implementation and Years was conducted and
resulted in a significant main effect across the years. In Table 64, there is a display of the
within-subject effects.
In Table 64, with Lower-bound, there was not a significant interaction for Years and
PBIS implementation. However, a statistically significant main effect was obtained across
the years (p=0.042) with a large effect size of 0.422. A post hoc Sidak test and trend analysis
were conducted for Years. The results of the Sidak test are presented in Table 65.
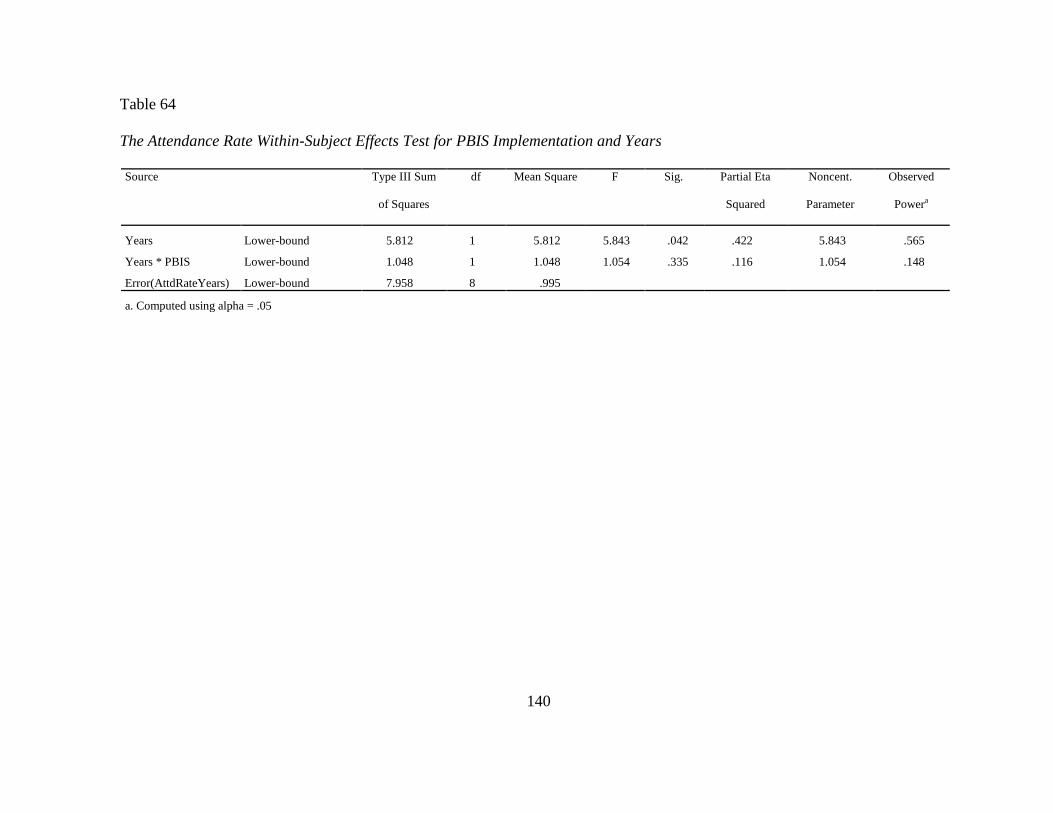
140
Table 64
The Attendance Rate Within-Subject Effects Test for PBIS Implementation and Years
Source Type III Sum
of Squares
df Mean Square F Sig. Partial Eta
Squared
Noncent.
Parameter
Observed
Powera
Years Lower-bound 5.812 1 5.812 5.843 .042 .422 5.843 .565
Years * PBIS Lower-bound 1.048 1 1.048 1.054 .335 .116 1.054 .148
Error(AttdRateYears) Lower-bound 7.958 8 .995
a. Computed using alpha = .05

141
Table 65
The Attendance Rate Sidak Test for PBIS Implementation between the Years
(I) Years (J) Years Mean
Difference (I-J)
Std. Error Sig.a 95% Confidence Interval for
Differencea
Lower Bound Upper Bound
1
2 -.112 .081 .899 -.423 .198
3 .569 .252 .427 -.394 1.532
4 1.044 .414 .306 -.537 2.624
5 .613 .316 .605 -.594 1.819
2
1 .112 .081 .899 -.198 .423
3 .681 .241 .202 -.238 1.601
4 1.156 .380 .149 -.294 2.606
5 .725 .271 .248 -.309 1.759
3
1 -.569 .252 .427 -1.532 .394
2 -.681 .241 .202 -1.601 .238
4 .475 .230 .529 -.402 1.352
5 .044 .233 1.000 -.846 .934
4
1 -1.044 .414 .306 -2.624 .537
2 -1.156 .380 .149 -2.606 .294
3 -.475 .230 .529 -1.352 .402
5 -.431 .229 .636 -1.304 .442
5
1 -.613 .316 .605 -1.819 .594
2 -.725 .271 .248 -1.759 .309
3 -.044 .233 1.000 -.934 .846
4 .431 .229 .636 -.442 1.304
Based on estimated marginal means
a. Adjustment for multiple comparisons: Sidak.
With the Sidak test, there was no significance found between any of the years for the
Attendance Rate. In Table 66, there is a trend analysis for the Years.

142
Table 66
The Attendance Rate Main Effect Within-Subjects Contrast Test for PBIS Implementation and Years
Source Years Type III Sum of
Squares
df Mean Square F Sig. Partial Eta
Squared
Noncent.
Parameter
Observed
Powera
Years
Linear 3.629 1 3.629 6.188 .038 .436 6.188 .589
Quadratic .325 1 .325 2.268 .170 .221 2.268 .264
Cubic 1.850 1 1.850 9.470 .015 .542 9.470 .769
Order 4 .008 1 .008 .118 .740 .015 .118 .061
Error(Years)
Linear 4.692 8 .586
Quadratic 1.148 8 .143
Cubic 1.563 8 .195
Order 4 .556 8 .070
a. Computed using alpha = .05
Table 67
The Attendance Rate Between-Subjects Effect Test for PBIS Implementation
Source Type III Sum of
Squares
df Mean Square F Sig. Partial Eta Squared Noncent. Parameter Observed Powera
PBIS .572 1 .572 .151 .708 .019 .151 .064
Error 30.288 8 3.786
a. Computed using alpha = .05

143
In Table 66, there was significant linear trend (p=0.038) with a large effect size of
0.436 and significant cubic trend (p=0.015) with a large effect size of 0.542. However, the
majority, 3.629, of the total sums of squares 5.812 could be explained in a linear fashion. The
linear trend can be viewed in Figure 12. In Table 67, there is a display of the main effect of
the Attendance Rate for PBIS implementation.
In Table 67, there was not a significant between-subjects effect value obtained for
PBIS implementation. In Figure 12, there is a display of the Attendance Rate mean values
for PBIS and non-PBIS implementation across the years of the study.

144
Figure 12. The Attendance Rate Mean Values for PBIS Implementation across the Years
Figure 12. The mean values for the (a) PBIS schools were 94.4%, 94.6%, 94.2%, 93.8%, and
94.2%. The mean values for the non-PBIS schools were 95.2%, 95.2%, 94.3%, 93.7%, and
94.1%.
The Dropout Rate
According to TEA, a dropout was a student who left a public school and did not
graduate, received a General Educational Development (GED) certificate, or was not
145
continuing in school (TEA; 2007, 2008, 2009, 2010, 2011, & 2012). In this study, the
dropout rate was the percentage of the aggregated students per school that were measured as
a dropout. Data were revealed from school years 2007 to 2011 with the exception of High
Schools 7 & 8 which were evaluated from 2009 to 2011. An illustration of the Dropout Rate
for High Schools 1-10 can be viewed in Figures 37 – 46 (Appendix J).
The values of the Dropout Rate of the high PBIS implementation high school, HS 2,
ranged from 0.8% to 1.5%. The Dropout Rate for the moderate PBIS implementation level
high schools, HS 1, 3, 5, 6, 7 and 8 were as follows: (a) HS 1, ranged from 1.6% to 2.0%; (b)
HS 3, ranged from 0.6% to 1.3%; (c) HS 5, ranged from 0.4% to 1.2%; (d) HS 6, ranged
from 1.0% to 1.4%; (e) HS 7, ranged from 0.5% to 0.9%; and (f) HS 8, ranged from 0.0% to
0.2%.
For the low PBIS implementation level school, HS 4, the values of the Dropout Rate
ranged from 0.6% to 1.7%. For none PBIS implementation schools, HS 9 and 10, the
Dropout Rate were as follows: (a) HS 9, ranged from 0.6% to 1.4%; (b) HS 10, ranged from
0.1% to 0.2%.
The Dropout Rate for the Differing PBIS Implementation Levels and Years
Mauchly’s Test of Sphericity was conducted to test the null hypothesis of whether the
covariance matrix of the orthonormalized transformed Dropout Rate data was proportional to
an identity matrix. The assumption of sphericity was met (p=0.733). A two-factor factorial
mixed model analysis for the Level of PBIS Implementation and Years was conducted. In
Table 68, there is a display of the within-subject effects.
In Table 68, with Sphericity assumed, there was a statistically significant interaction
for Years and Level of PBIS implementation (p=0.047) with a large effect size of 0.526.
146
However, there was not a significant main effect for Years. An SME was conducted to probe
the interaction between the Years and Level of PBIS implementation. In Table 69, there is an
SME displayed to probe the differences in Years at each Level of PBIS implementation.
In Table 69, the multivariate test revealed no significance difference in Years for the
differing Levels of PBIS implementation. In Table 70, there is a display of the Dropout Rate
SME Univariate test for the differences in Levels of PBIS implementation at each Year.

147
Table 68
The Dropout Rate Within-Subjects Effect Test for the Differing Levels of PBIS Implementation and Years
Source Type III Sum
of Squares
df Mean Square F Sig. Partial Eta
Squared
Noncent.
Parameter
Observed
Powera
Years Sphericity Assumed .256 4 .064 1.287 .303 .177 5.149 .340
Years * Level Sphericity Assumed 1.322 12 .110 2.215 .047 .526 26.585 .820
Error(DrpOutRateYear) Sphericity Assumed 1.193 24 .050
a. Computed using alpha = .05
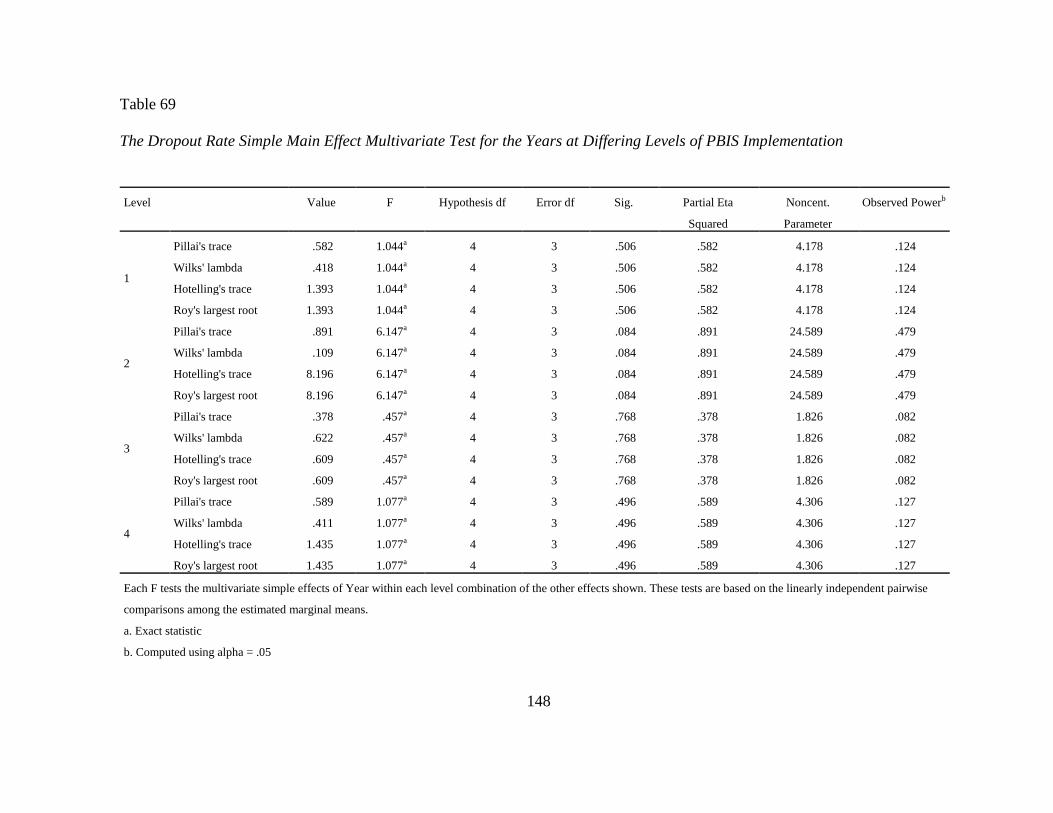
148
Table 69
The Dropout Rate Simple Main Effect Multivariate Test for the Years at Differing Levels of PBIS Implementation
Level Value F Hypothesis df Error df Sig. Partial Eta
Squared
Noncent.
Parameter
Observed Powerb
1
Pillai's trace .582 1.044a 4 3 .506 .582 4.178 .124
Wilks' lambda .418 1.044a 4 3 .506 .582 4.178 .124
Hotelling's trace 1.393 1.044a 4 3 .506 .582 4.178 .124
Roy's largest root 1.393 1.044a 4 3 .506 .582 4.178 .124
2
Pillai's trace .891 6.147a 4 3 .084 .891 24.589 .479
Wilks' lambda .109 6.147a 4 3 .084 .891 24.589 .479
Hotelling's trace 8.196 6.147a 4 3 .084 .891 24.589 .479
Roy's largest root 8.196 6.147a 4 3 .084 .891 24.589 .479
3
Pillai's trace .378 .457a 4 3 .768 .378 1.826 .082
Wilks' lambda .622 .457a 4 3 .768 .378 1.826 .082
Hotelling's trace .609 .457a 4 3 .768 .378 1.826 .082
Roy's largest root .609 .457a 4 3 .768 .378 1.826 .082
4
Pillai's trace .589 1.077a 4 3 .496 .589 4.306 .127
Wilks' lambda .411 1.077a 4 3 .496 .589 4.306 .127
Hotelling's trace 1.435 1.077a 4 3 .496 .589 4.306 .127
Roy's largest root 1.435 1.077a 4 3 .496 .589 4.306 .127
Each F tests the multivariate simple effects of Year within each level combination of the other effects shown. These tests are based on the linearly independent pairwise
comparisons among the estimated marginal means.
a. Exact statistic
b. Computed using alpha = .05
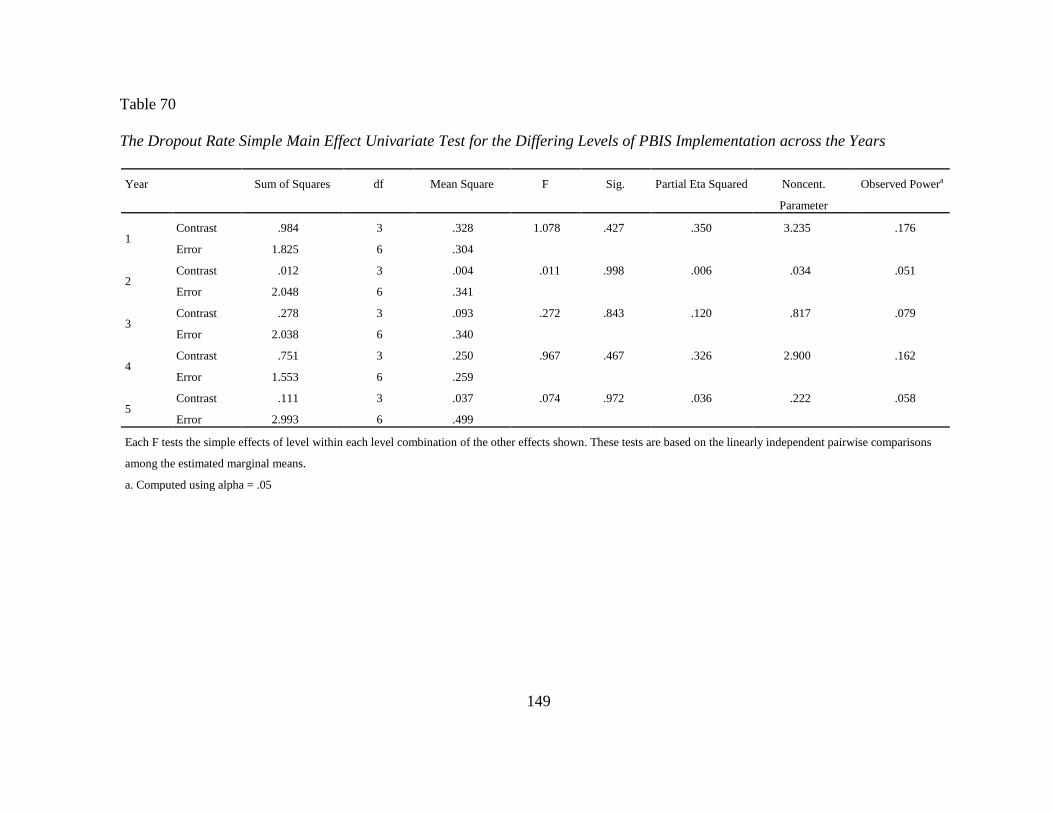
149
Table 70
The Dropout Rate Simple Main Effect Univariate Test for the Differing Levels of PBIS Implementation across the Years
Year Sum of Squares df Mean Square F Sig. Partial Eta Squared Noncent.
Parameter
Observed Powera
1 Contrast .984 3 .328 1.078 .427 .350 3.235 .176
Error 1.825 6 .304
2 Contrast .012 3 .004 .011 .998 .006 .034 .051
Error 2.048 6 .341
3 Contrast .278 3 .093 .272 .843 .120 .817 .079
Error 2.038 6 .340
4 Contrast .751 3 .250 .967 .467 .326 2.900 .162
Error 1.553 6 .259
5 Contrast .111 3 .037 .074 .972 .036 .222 .058
Error 2.993 6 .499
Each F tests the simple effects of level within each level combination of the other effects shown. These tests are based on the linearly independent pairwise comparisons
among the estimated marginal means.
a. Computed using alpha = .05

150
Table 71
The Dropout Rate Between-Subjects Effect Test for the Differing Levels of PBIS Implementation
Source Type III Sum of
Squares
df Mean Square F Sig. Partial Eta Squared Noncent. Parameter Observed Powera
Level .813 3 .271 .175 .909 .081 .526 .068
Error 9.265 6 1.544
a. Computed using alpha = .05
151
In Table 70, there was not a significant value obtained for the contrast for the Dropout
Rate for Levels at each Year. In Table 71, there is a display of the dropout rate between-
subjects effect test for the differing Levels of PBIS implementation.
In Table 71, there was no significant value found for the between-subjects effect for
the Dropout Rate at the differing Level of PBIS Implementation. In Figure 13, there is a
display of the mean values for the Dropout Rate for the differing levels of PBIS
implementation.
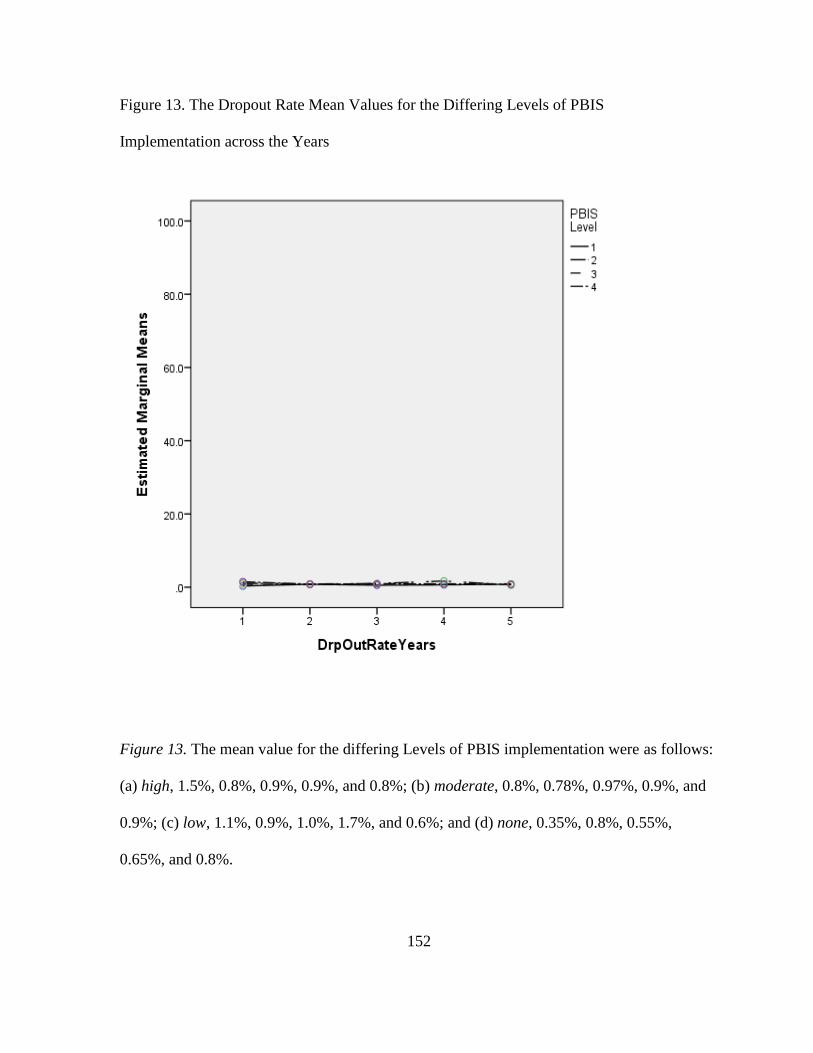
152
Figure 13. The Dropout Rate Mean Values for the Differing Levels of PBIS
Implementation across the Years
Figure 13. The mean value for the differing Levels of PBIS implementation were as follows:
(a) high, 1.5%, 0.8%, 0.9%, 0.9%, and 0.8%; (b) moderate, 0.8%, 0.78%, 0.97%, 0.9%, and
0.9%; (c) low, 1.1%, 0.9%, 1.0%, 1.7%, and 0.6%; and (d) none, 0.35%, 0.8%, 0.55%,
0.65%, and 0.8%.
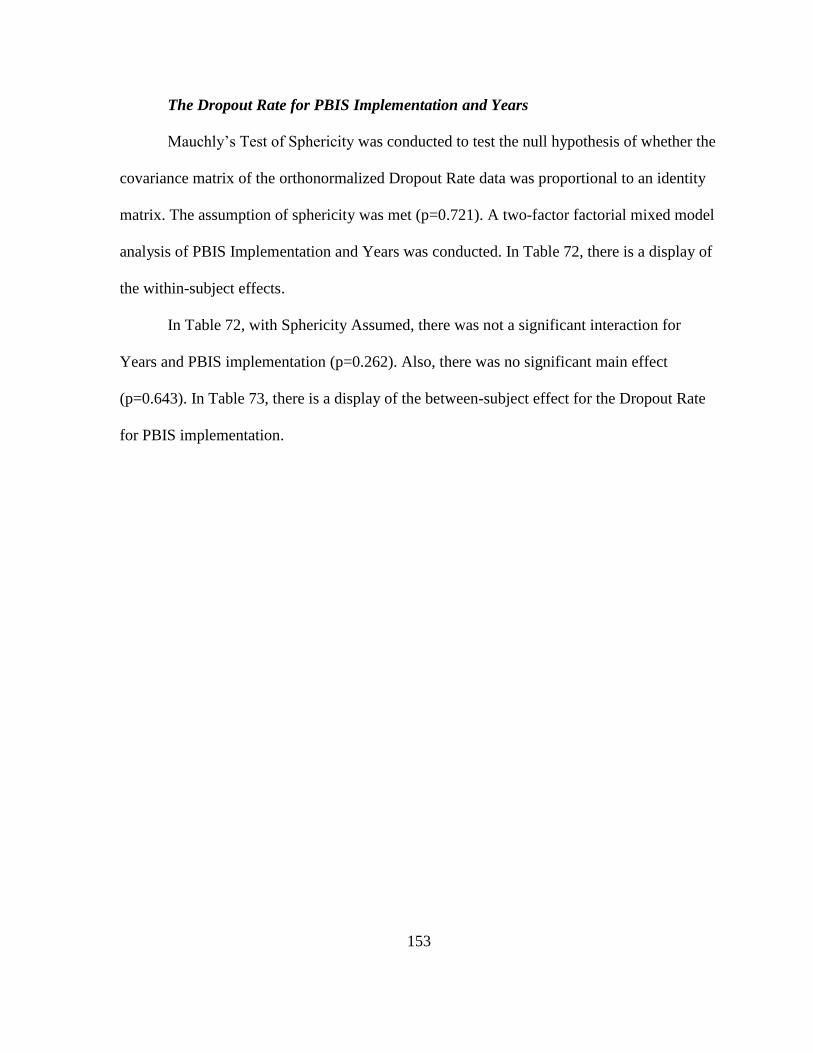
153
The Dropout Rate for PBIS Implementation and Years
Mauchly’s Test of Sphericity was conducted to test the null hypothesis of whether the
covariance matrix of the orthonormalized Dropout Rate data was proportional to an identity
matrix. The assumption of sphericity was met (p=0.721). A two-factor factorial mixed model
analysis of PBIS Implementation and Years was conducted. In Table 72, there is a display of
the within-subject effects.
In Table 72, with Sphericity Assumed, there was not a significant interaction for
Years and PBIS implementation (p=0.262). Also, there was no significant main effect
(p=0.643). In Table 73, there is a display of the between-subject effect for the Dropout Rate
for PBIS implementation.
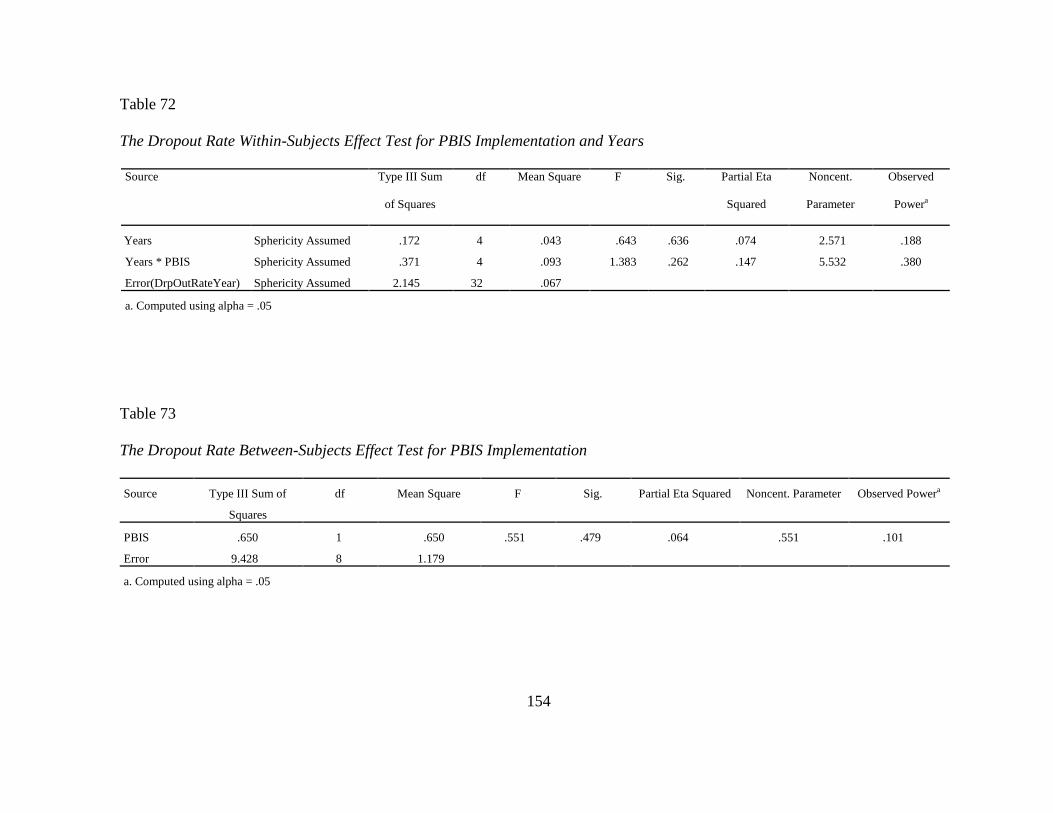
154
Table 72
The Dropout Rate Within-Subjects Effect Test for PBIS Implementation and Years
Source Type III Sum
of Squares
df Mean Square F Sig. Partial Eta
Squared
Noncent.
Parameter
Observed
Powera
Years Sphericity Assumed .172 4 .043 .643 .636 .074 2.571 .188
Years * PBIS Sphericity Assumed .371 4 .093 1.383 .262 .147 5.532 .380
Error(DrpOutRateYear) Sphericity Assumed 2.145 32 .067
a. Computed using alpha = .05
Table 73
The Dropout Rate Between-Subjects Effect Test for PBIS Implementation
Source Type III Sum of
Squares
df Mean Square F Sig. Partial Eta Squared Noncent. Parameter Observed Powera
PBIS .650 1 .650 .551 .479 .064 .551 .101
Error 9.428 8 1.179
a. Computed using alpha = .05
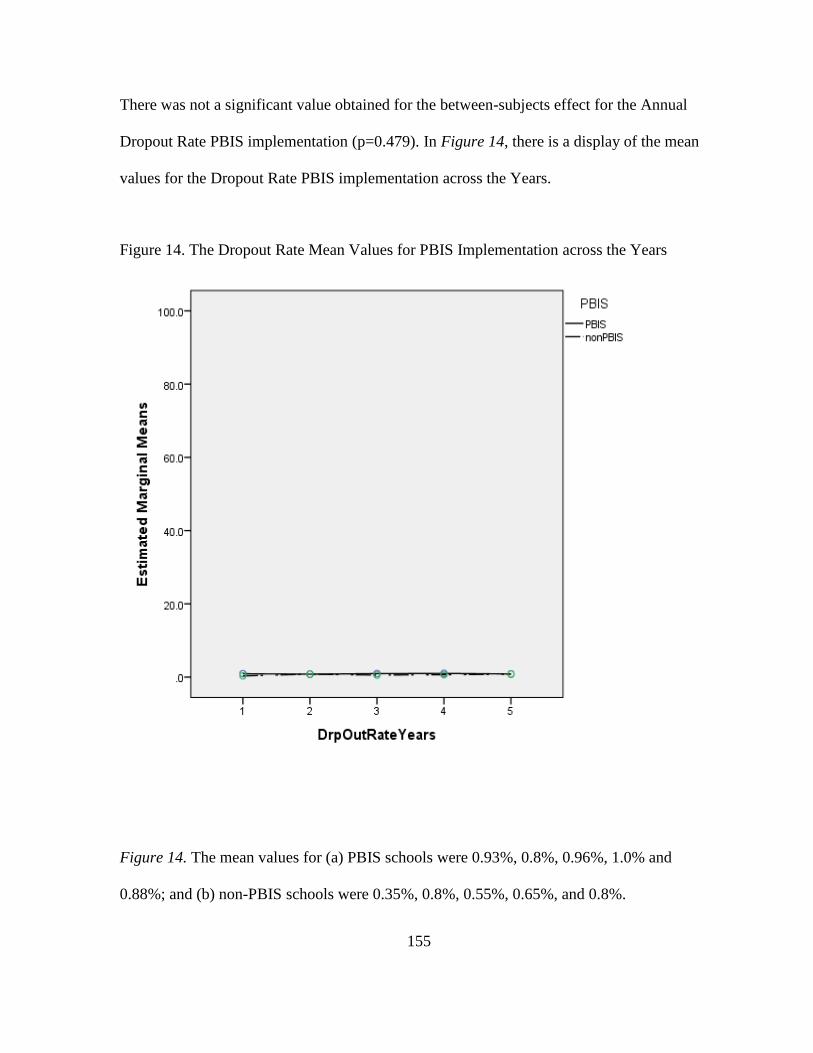
155
There was not a significant value obtained for the between-subjects effect for the Annual
Dropout Rate PBIS implementation (p=0.479). In Figure 14, there is a display of the mean
values for the Dropout Rate PBIS implementation across the Years.
Figure 14. The Dropout Rate Mean Values for PBIS Implementation across the Years
Figure 14. The mean values for (a) PBIS schools were 0.93%, 0.8%, 0.96%, 1.0% and
0.88%; and (b) non-PBIS schools were 0.35%, 0.8%, 0.55%, 0.65%, and 0.8%.
156
The Graduation Rate
According to TEA, the Graduation Rate was defined as the percentage of a cohort of
students that completed school, obtained a GED, or did not drop out of school (TEA; 2007,
2008, 2009, 2010, 2011, 2012). Data were revealed from school years 2007 to 2011 with the
exception of High Schools 7 & 8 which did not have a graduating class during the span of the
study. An illustration of the Graduation Rates for High Schools 1-10, with the exception of
HS 7 and HS 8, can be viewed in Figures 47 – 54 (Appendix K).
The value of the Graduation Rate of the high PBIS implementation high school, HS 2,
increased from 94.4% to 95.7%. The Graduation Rate for the moderate PBIS
implementation level high schools, HS 1, 3, 5 and 6 were as follows: (a) HS 1, the
Graduation Rate decreased from 95.3% to 91%; (b) HS 3, the Graduation Rate increased
from 97% to 97.8%; (c) HS 5, the Graduation Rate fluctuated from 97.4% to 96.7%; and (d)
HS 6, the Graduation Rate increased from 95.3% to 96.8%.
For the low PBIS implementation level school, HS 4, the values of the Graduation
Rate increased from 95.8% to 96.5%. For none PBIS implementation schools, HS 9 and 10,
the Graduation Rates were as follows: (a) HS 9, the graduation rate fluctuated from 98.3% to
96.2% and (b) HS 10, the Graduation Rate were recorded for two years, 2010 and 2011, and
increased from 99.1% to 99.4%.
The Graduation Rates for the Differing PBIS Implementation Levels and Years
Mauchly’s Test of Sphericity was conducted to test the null hypothesis of whether the
covariance matrix of the orthonormalized Graduation Rate data was proportional to an
identity matrix. The assumption of sphericity was met (p=0.479). A two-factor factorial
157
mixed model analysis of the Level of PBIS Implementation and Years was conducted. In
Table 74, there is a display of the within-subject effects.
In Table 74, with Sphericity assumed, there was not a significant interaction for Years
and Levels of PBIS implementation (p=0.878). There was not a significant main effect for
Years (p=0.880). In Table 75, there is a display of the Graduation Rate between-subjects test
for the differing Levels of PBIS implementation.
In Table 75, there was no significant effect obtained for the between-subjects
examination of the Graduation Rate at differing Levels of PBIS (p=0.573). In Figure 15,
there is a display of means for the differing levels of PBIS implementation.
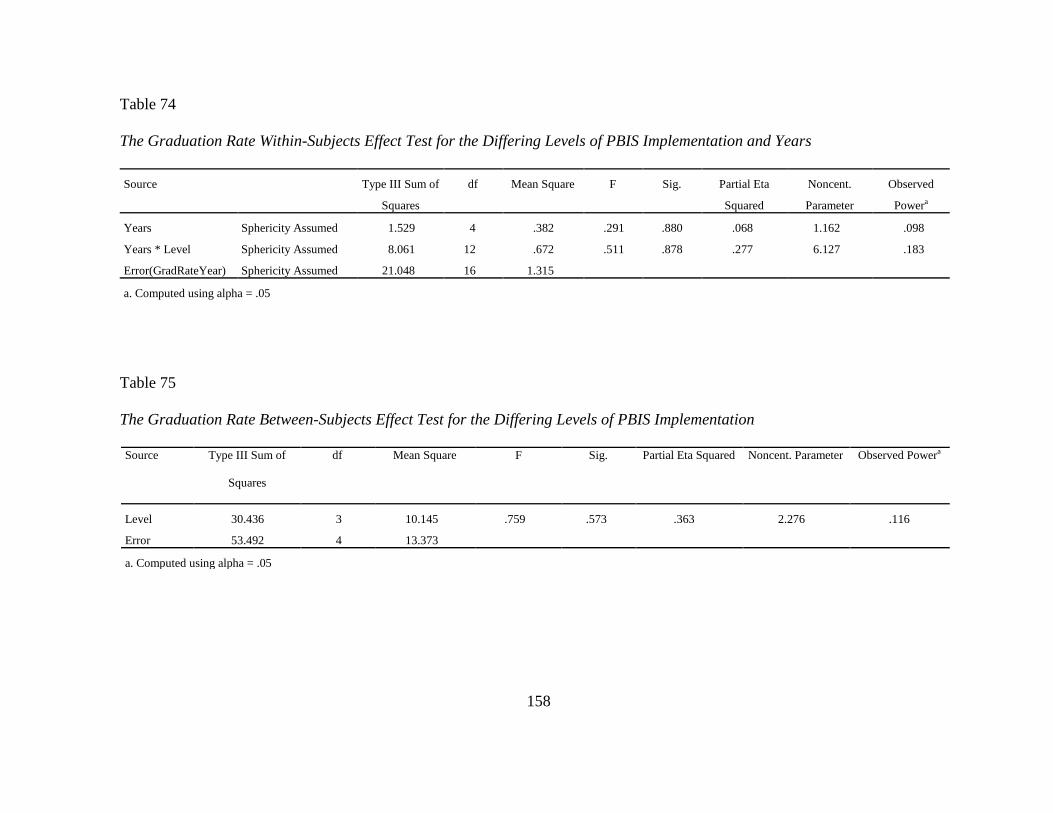
158
Table 74
The Graduation Rate Within-Subjects Effect Test for the Differing Levels of PBIS Implementation and Years
Source Type III Sum of
Squares
df Mean Square F Sig. Partial Eta
Squared
Noncent.
Parameter
Observed
Powera
Years Sphericity Assumed 1.529 4 .382 .291 .880 .068 1.162 .098
Years * Level Sphericity Assumed 8.061 12 .672 .511 .878 .277 6.127 .183
Error(GradRateYear) Sphericity Assumed 21.048 16 1.315
a. Computed using alpha = .05
Table 75
The Graduation Rate Between-Subjects Effect Test for the Differing Levels of PBIS Implementation
Source Type III Sum of
Squares
df Mean Square F Sig. Partial Eta Squared Noncent. Parameter Observed Powera
Level 30.436 3 10.145 .759 .573 .363 2.276 .116
Error 53.492 4 13.373
a. Computed using alpha = .05

159
Figure 15. The Graduation Rate Mean Values for the Differing Levels of PBIS
Implementation across the Years
Figure 15. The mean values for the differing Levels of PBIS implementation were as
follows: (a) high, 94.4%, 95.5%, 94.8%, 96.5%, and 95.7%; (b) moderate, 96.3%, 96.5%,
95.6%, 95.9%, and 95.6%; (c) low, 95.8%, 95.7%, 95.9%, 96.7%, and 96.5%; and (d) none,
98.8%, 97%, 98%, 97.9%, and 97.7%.

160
The Graduation Rates for PBIS Implementation and Years
Mauchly’s Test of Sphericity was conducted to test the null hypothesis of whether the
covariance matrix of the orthonormalized Graduation Rate data was proportional to an
identity matrix. The assumption of sphericity was met (p=0.479). A two-factor factorial
mixed model analysis of PBIS Implementation and Years was conducted. In Table 76, there
is a display of the within-subject effects.
In Table 76, with Sphericity assumed, there was no significant interaction for Years
and PBIS implementation (p=0.485). There was no significant main effect for Years
(p=0.715). In Table 77, there is a display of the between-subjects effect test.
In Table 77, there was no significant value obtained for the between-subjects effect
test (p=0.128). In Figure 16, there is a display of the Graduation Rate mean values for the
PBIS implementation across the Years.
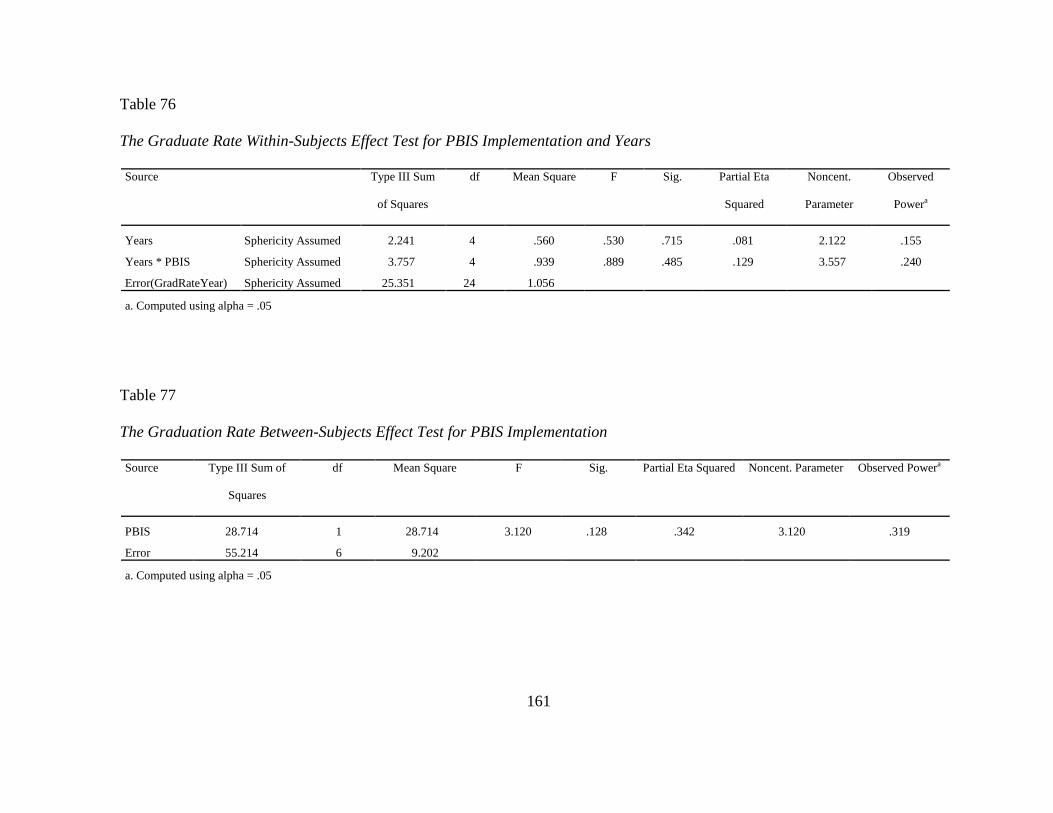
161
Table 76
The Graduate Rate Within-Subjects Effect Test for PBIS Implementation and Years
Source Type III Sum
of Squares
df Mean Square F Sig. Partial Eta
Squared
Noncent.
Parameter
Observed
Powera
Years Sphericity Assumed 2.241 4 .560 .530 .715 .081 2.122 .155
Years * PBIS Sphericity Assumed 3.757 4 .939 .889 .485 .129 3.557 .240
Error(GradRateYear) Sphericity Assumed 25.351 24 1.056
a. Computed using alpha = .05
Table 77
The Graduation Rate Between-Subjects Effect Test for PBIS Implementation
Source Type III Sum of
Squares
df Mean Square F Sig. Partial Eta Squared Noncent. Parameter Observed Powera
PBIS 28.714 1 28.714 3.120 .128 .342 3.120 .319
Error 55.214 6 9.202
a. Computed using alpha = .05

162
Figure 16. The Graduation Rate Mean Values for PBIS Implementation across the Years
Figure 16. The mean values were as follows: (a) PBIS schools, 95.9%, 96.2%, 95.5%,
96.1%, and 95.8% and (b) non-PBIS schools, 98.8%, 97%, 98%, 97.9%, and 97.7%.
Summary of the Results
In conclusion, in this chapter I presented the research findings and results. I began
with a description of the student population at the state, district and school levels. I gave the
total student population, the ethnic subpopulations and some of the student learner attributes

163
subpopulations. At the state, district, and school level there was an increase in student
population over the span of the study. There was variation at the school level of the ethnic
subpopulations and student learner attribute subpopulations.
The findings from the Initial Research Task 1 yielded to the classification of the High
Schools into the PBIS implementation levels of high, moderate, low and none in the Initial
Research Task 2. HS 2 had a high level of PBIS implementation. High Schools 1, 3, 5, 6, 7
and 8 had a moderate level of PBIS implementation. HS 4 had a low level of PBIS
implementation. HS 9 and HS 10 had none level PBIS implementation.
I addressed each research question with the two-factor factorial mixed model
ANOVA. The results were presented in the form of tables and figures. The first research
question was formulated to look at differences between the differing Levels of PBIS
Implementation and Years. An interaction was found for the Dropout Rate. The SMEs did
not reveal any significant values for the Dropout Rate and Years. There was no significant
interaction found between Years and differing Levels of PBIS Implementation for the
Discipline Infraction Rate, Math TAKS Pass Rate, Reading TAKS pass rate, Attendance
Rate, or Graduation Rate found. However, there was a significant main effect found for the
Discipline Infraction Rate, Math TAKS Pass Rate, and Attendance Rate across the Years of
the study.
The second research question was used to look at the differences between PBIS
implementation and Years. No significant interaction was found for any of the outcome
variables. A simple main effect was found for the Discipline Infraction Rate, Math TAKS
Pass Rate, and Attendance Rate across the Years of the study. In the next chapter, I will
discuss the results and implications.
164
CHAPTER V
CONCLUSIONS
Educators at the high school level have a responsibility to prepare students for
academic and social success while in school, as well as life after school. The primary focus
of my study was to analyze the differences in the aggregated student performance of high
school students in schools with varying levels of PBIS implementation. The outcome
variables examined were the: (a) discipline infraction rate, (b) math and reading TAKS pass
rates, (c) attendance rate, (d) dropout rate, and (e) graduation rate. My study involved 10 high
schools within one Texas school district. My primary goal was to determine if PBIS
implementation provided the necessary support needed for schools to improve student
performance outcomes and improve graduation rates. The descriptive and statistical findings
of my study may have implications in the development and extension of current PBIS
practices at the high school level. The generalizability of my results is somewhat limited;
however, the results contribute to the literature through evidence of no impact for the level of
PBIS implementation on student performance outcomes at the high school level.
Interpretation and Summary of the Population Trends
At the state level, evidence existed to suggest an overall increase in the number of
students enrolled in Texas public schools over the span of the study; however, the percentage
of students in grades 9 through 12 decreased over the same span. Changes in student
ethnicity populations at the state level revealed an increase in the number of Hispanic, Native
American and Asian students and a decrease in the number of African American and White
students. In addition, the learner diversity sub-populations for students identified as
165
economically disadvantaged or limited English proficiency increased. Finally, students
enrolled in special education decreased. These results support Darling-Hammond’s
conclusion regarding the changing culture within the American public education system
(Darling-Hammond, 2000, 2004).
At the district level, the population of students in grades 9 through 12 increased, as
did the total population of the district, over the time span of the study. Changes in student
ethnicity populations varied. Differing from the state, the district experienced a decrease in
students identified as White, Native American or Asian but an increase in students identified
as African American or Hispanic. Similar to the state, the district experienced an increase in
the percentage of students identified as economically disadvantaged and limited English
proficiency and a decrease in the percentage of students identified as special education.
These results also support Darling-Hammond’s conclusion that the culture within the
American public education system was currently experiencing a change (Darling-Hammond,
2000, 2004). Although the district was classified as a suburban district, it exhibited many
character traits of an urban district. By the end of the study, the total student population was
over 100,000 students and had 46.5% economically disadvantaged students (TEA, 2011).
At the school level, there was a great deal of variability between the schools during
the span of the study (2007-2011). The mean population was 3008.37, yet the range between
schools was 836 to 3991. The mean African American population was 16.2%, yet the range
between schools was 6.5% to 33.2%. The mean Hispanic population was 33.5%, yet the
range between schools was 12.6% to 53.6%. The mean White population was 40.9%, yet the
range between schools was 12.4% to 76.8%. The mean Native American population was
0.26%, yet the range between schools was 0% to 0.5%. The mean Asian/Island Pacific

166
population was 8.53%, yet the range between schools was 3.8% to 13.1%. The mean
economically disadvantaged population was 31.6%, yet the range between schools was 7.6%
to 63.1%. The mean limited English proficiency population was 4.7%, yet the range between
schools was 1.2% to 8.7%. The mean special education population was 7.5%, yet the range
between schools was 4.2% to 9.8%. The differences between schools were evident. Some
schools had small levels of diversity, yet some schools dealt with a large culturally and
linguistically diverse population. I noted that a general trend of schools within the district
which did not implement PBIS were not as culturally and linguistically diverse as the schools
that did implement PBIS.
Interpretation and Summary for the Level of PBIS Implementation
My research of policy implementation alluded to the belief that the greater the level
of implementation of a policy the more effective the outcome (Cohen, Moffit & Goldin,
2007). The level of PBIS implementation in high schools was evaluated through two
perspectives: principals in the Principal PBIS Implementation Survey (Appendix B) and staff
members in the EBS survey (Appendix B). The Principal PBIS Implementation Survey
yielded values for (a) duration of PBIS practice; (b) composition of the PBIS leadership
team; (c) composition of the PBIS motto and matrix development team; (d) initial PBIS
training; and (e) ongoing PBIS training and support for staff and students. The EBS survey
yielded values for the perception from the staff members regarding effectiveness of the “in
place” PBIS practices.
Based on the results in Chapter IV, the following discussion was related to the level
of PBIS implementation:

167
1. PBIS was implemented in a tiered format in the district; therefore, the time frame for
implementation ranged from two to five years.
2. The ongoing training and support varied from once to multiple times a year in which
PBIS was integrated into the majority of trainings and activities.
3. The staff perception of in place practices on the EBS survey revealed variation between
schools.
4. The High Schools were classified as follows: HS 4 was a high level of implementation,
HS 1, 3, 4, 5, 7, and 8 were a moderate level of implementation, HS 4 was a low level of
implementation and HS 9 and 10 were a none level of PBIS implementation because
PBIS was not implemented. This was a summation of the evaluation for the PBIS
practices at each school.
Interpretation and Summary for the Student Performance Outcomes
PBIS was a school-wide program designed to improve student performance be
creating a positive school culture (Sugai & Horner, 2002a). Many PBIS researchers
highlighted student performance outcomes, such as discipline infractions and academic
performance (Bohanon et al, 2009; Horner et al, 2005; McIntosh et al. 2008, 2009). My study
included behavior and academics and highlighted results for attendance, dropout, and
graduation rates. I looked at student performance form two perspectives, the level of PBIS
implementation and PBIS implementation versus non-PBIS implementation. A two factor
factorial mixed model ANOVA was performed for each of the perspectives on the
aggregated student performance outcome variables across the years of the study.
Based on the results in Chapter IV, the following discussion was related to the student
performance outcomes:
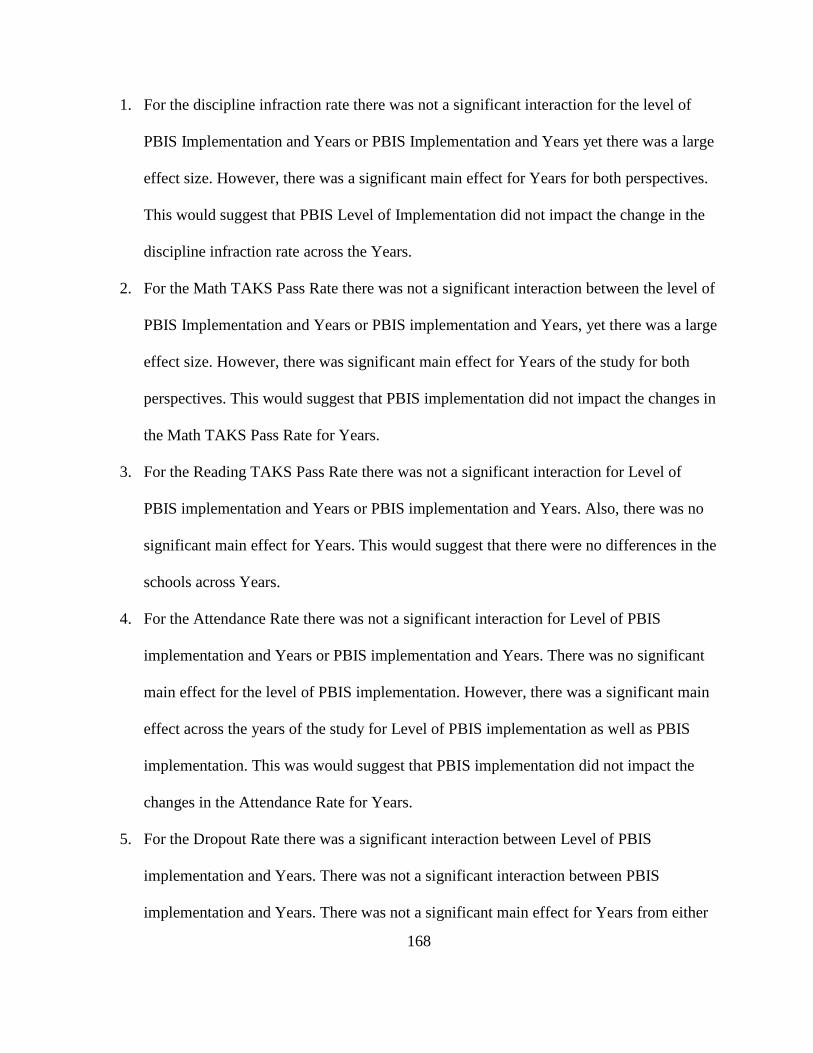
168
1. For the discipline infraction rate there was not a significant interaction for the level of
PBIS Implementation and Years or PBIS Implementation and Years yet there was a large
effect size. However, there was a significant main effect for Years for both perspectives.
This would suggest that PBIS Level of Implementation did not impact the change in the
discipline infraction rate across the Years.
2. For the Math TAKS Pass Rate there was not a significant interaction between the level of
PBIS Implementation and Years or PBIS implementation and Years, yet there was a large
effect size. However, there was significant main effect for Years of the study for both
perspectives. This would suggest that PBIS implementation did not impact the changes in
the Math TAKS Pass Rate for Years.
3. For the Reading TAKS Pass Rate there was not a significant interaction for Level of
PBIS implementation and Years or PBIS implementation and Years. Also, there was no
significant main effect for Years. This would suggest that there were no differences in the
schools across Years.
4. For the Attendance Rate there was not a significant interaction for Level of PBIS
implementation and Years or PBIS implementation and Years. There was no significant
main effect for the level of PBIS implementation. However, there was a significant main
effect across the years of the study for Level of PBIS implementation as well as PBIS
implementation. This was would suggest that PBIS implementation did not impact the
changes in the Attendance Rate for Years.
5. For the Dropout Rate there was a significant interaction between Level of PBIS
implementation and Years. There was not a significant interaction between PBIS
implementation and Years. There was not a significant main effect for Years from either

169
perspective. This would suggest that difference in the Dropout Rate was a function of the
Level of PBIS implementation and Years.
6. For the Graduation Rate there was not a significant interaction for Level of PBIS
implementation and Years or PBIS implementation and Years. Also, there was no
significant main effect across the years of the study. This would suggest that there were
no differences in the schools across Years.
One of the more interesting results from my study was related to discipline.
Specifically, schools with high levels of PBIS implementation had the highest discipline rates
in comparison to schools with lower levels of PBIS implementation. Although there was a
decrease in the amount of discipline for all schools over the span of the study, this result
could not be based upon the level of PBIS implementation. This contradicts the conclusion of
Sugai and Horner, designers of PBIS, who found that the implementation of PBIS decreased
the number of discipline incidents (Sugai and Horner, 2000, 2002a, 2002b, 2006, & 2009). I
found that discipline incidents decreased regardless of whether or not the school
implemented PBIS. There was no significant difference in student performance of the
discipline infraction rate between PBIS and non-PBIS schools.
On the other hand, results from my analysis for other issues were as expected. For
example, similar to the results of Guest (2013) there was an overall increase in students’
graduation rate in PBIS schools. In addition, there was also an increase in students’ academic
performance and attendance rates. Guest also reported a decrease in students’ dropout rate
when schools implemented PBIS (Guest, 2013). Schools in my study reported a decrease in
students’ dropout rate over the span of the study, consistent with Guest’s findings. Overall,
170
findings from my study were consistent with the majority of findings found in the PBIS
literature (Gottfredson et al, 1993, 2002; Horner et al. 2004, 2005; Lassen et al, 2006).
Implications for Future Research
The following implications were observed from the results of the study:
1. Further analyses should be conducted at the student level to examine if the level of
PBIS implementation impacts dropout rate.
2. Further analyses should be conducted at the student level to examine how schools
with diverse populations were able to perform without any significant difference.
3. Further analyses should be conducted at the student level to examine why there was
no significant interaction between the level of PBIS implementation and years for the
discipline infraction rate, math TAKS pass rate, reading TAKS pass rate, attendance
rate and graduation rate.
4. Further analyses should be conducted at the student level to examine why there was
no significant interaction between the PBIS implementation and years for the
discipline infraction rate, math TAKS pass rate, reading TAKS pass rate, attendance
rate, dropout rate and graduation rate.
5. Further analyses should be done to examine if, over a longer period of time, there is a
significant main effect in the discipline infraction rate, math TAKS pass rate and
attendance rate across the years.
Overall, after reviewing the findings of the study, I concluded that PBIS
implementation does not contribute to the difference in the student performance except
for the Dropout Rate. I would suggest to schools using PBIS to continue the practices in
an effort to decrease the Dropout Rate at the high school level. The school district

171
researchers should examine more closely the PBIS practices of the school with a high
level of PBIS implementation and determine how those practices impact student
performance at the student level. They should also examine the practices of non-PBIS
schools to determine the practices utilized to increase student performance. Ultimately, if
there is a continued decrease in the dropout rate and a positive impact on the variables
that lead to dropout, then PBIS may contribute to an increase in the graduation rate.

172
REFERENCES
Allen, C. S., Chen, Q., Willson, V. L., & Hughes, J. N. (2009). Quality of research design
moderates effects of grade retention on achievement: A meta-analytic, multi-level
analysis. Educational Evaluation and Policy Analysis. 31 (4), 480-499.
Barrett, S., Bradshaw, C. P., & Lewis-Palmer, T. (2008). Maryland statewide PBIS initiative:
Systems, evaluation, and next steps. Journal of Positive Behavior Interventions, 10,
105–114. doi:10.1177/ 1098300707312541.
Bohanon, H., Flannery, K. B., Malloy, J., & Fenning, P. (2009). Utilizing positive behavior
supports in high school settings to improve school completion rates for students with
high incidence conditions. Exceptionality, 17, 30-44.
Bradshaw, C. P., Koth, C. W., Thornton, L. A., & Leaf, P. J. (2009). Altering school climate
through school-wide Positive Behavioral Interventions and Supports: Findings from a
group-randomized effectiveness trial. Prevention science, 10 (2), 100-115.
Bradshaw C. P., Reinke, W. M., Brown, L. D., Bevans, K. B., & Leaf, P. J. (2008).
Implementation of school-wide positive behavioral interventions and supports (PBIS)
in elementary schools: Observations from a randomized trial. Education and
Treatment of Children, 31 (1), 1-26.
Bryk, A. S., & Thum, Y. M. (1989). The effects of high school organization on dropping out:
An exploratory investigation. American Educational Journal, 26 (3), 353-383.
Carter, J., & Sugai, G. (1989). Survey on prereferral practices: Responses from state
Departments of Education. Exceptional Children, 55 (4), 298+.
173
Cataldi, E.F., Laird, J., & Kewal-Ramani, A. (2009). High school dropout and completion
rates in the United States: 2007 (NCES 2009-064). National Center for Education
Statistics, Institute of Education Sciences, U.S. Department of Education.
Washington, DC. Retrieved from
http://nces.ed.gov/pubsearch/pubsinfo.asp?pubid=2009064.
Christenson, S. L., & Thurlow, M. L. (2004). Prevention considerations, interventions, and
challenges. Directions in Psychological Science, 13 (1), 36-39.
Clonan, S. M., McDougal, J. L., Clark, K., & Davison, S. (2007). Use of office discipline
referrals in school-wide decision making: A practical example. Psychology in the
Schools, 44 (1), 19-27.
Coffey, J. H. & Horner, R. H. (2012). The Sustainability of Schoolwide Positive Behavior
Interventions and Supports. Exceptional Children, 78 (4), 407-422.
Cohen, D. K., Moffitt, S. L., & Goldin, S. (2007). Policy and practice: The
dilemma. American Journal of Education, 113 (4), 515-548.
Colvin, G., Flannery, K. B., Sugai, G., & Monegan, J. (2009). Using observational data to
provide performance feedback to teachers: A high school case study. Preventing
School Failure, 53 (2), 95-104.
Creswell, J. W. (2003). Research design: qualitative, quantitative and mixed methods
approaches (2nd) edition. Thousand Oaks, CA: Sage Publications

174
Darling-Hammond, L. (2000). Transforming urban public schools: The role of standards and
accountability. Creating Change in Urban Public Education, December 7-8, 2000,
Harvard University. Retrieved from:
http://www.hks.harvard.edu/urbanpoverty/Urban%20Seminars/December2000/
hammond.pdf
Darling-Hammond, L. (2004). The color line in American education: Race, resources, and
student achievement. DuBois Review, 1 (2), 213-246.
Davis, K. S. (2011). Program evaluation of universal positive behavioral interventions and
supports in Kentucky. Dissertations, paper 6. Retrieved from:
http://digitalcommons.wku.edu/diss/6
Demski, J. (2009) Assess instruct repeat. T.H.E. Journal, 36(5), 30-36.
Driscoll, A. K. (1999). Risk of high school dropout among immigrant and native Hispanic
Youth. International Migration Review, 33 (4), 857-875.
Doolittle, J. H., Horner, R. H., & Bradley, R. (2007). Importance of student social behavior
in the mission statements, personnel preparation standards, and innovation efforts of
State Department of Education. The Journal of Special Educaiton , 40 (4), 239-245.
Ensminger, M. E., & Slusarcick, A. L. (1992). Paths to high school graduation or dropout: A
longitudinal study of a first-grade cohort. Sociology of Education, 65 (2), 95-113.
Field, A. (2009). Discovering statistics using SPSS (3rd
edition). London: Sage Publications
Flannery, K., Frank, J., McGarth Kato, M., Doren, B., & Fenning, P. (2013). Implementing
Schoolwide Positive Behavior Support in High School Settings: Analysis of Eight
High Schools. The High School Journal, 96 (4), 267-282.

175
Fuchs, D., & Fuchs, L. S. (2006). Introduction to response to intervention: What, why, and
how valid is it? Reading Research Quarterly, 41 (1), 93-99.
Gall, M. D. Gall. J. P., & Borg, W. R. (2007). Educational research: An introduction (8th
edition). Boston: Pearson/Allyn & Bacon.
Gay, L.R., & Airasian, P.W. (2003). Educational research:Competencies for analysis and
applications. UpperSaddle River, NJ: Merrill/PrenticeHall.
Gottfredson, G.D., Jones, E.M. & Gore, T.W. (2002). Implementation and Evaluation of a
Cognitive-Behavioral Intervention to Prevent Problem Behavior in a Disorganized
School. Prevention Science, 3 (1). 43-56.
Gottfredson, D. C., & Gottfredson, G. D. (2002). Quality of school-based prevention
programs: Results from a national survey. Journal of Research in Crime and
Delinquency, 39, 3–35.
Graves, E. D. (2009). The dropout epidemic: A crisis of human capital. Black Enterprise.
July 2009, p. 6.
Green, J. A. (2009). Changing past student discipline practices to create a district-wide
discipline plan. Education and Urban Society, 41 (4), 457-468.
Griffin, B. W. (2002). Academic disidentification, race, and high school dropouts. The High
School Journal, 85 (4), 71-81.
Guest, E. M. (2011). The impact of Positive Behavioral Interventions and Supports in
secondary school settings. Dissertation, University of Oregon, UMI Number
3466341.
176
Guthals, J. E. (2009). The relationship between positive behavior supports, student
achievement, severe problem behavior, and administrative stress. Dissertation,
University of Montana, UMI Number 3355758.
Hagan-Burke, S., Burke, M. D., & Sugai, G. (2007). Using structural analysis and academic-
based intervention for a student at risk of EBD. Behavioral Disorders, 32 (3), 175-
191.
Hammond, C., Linton, D., Smink, J., Drew, S. (2007). Dropout risk factors and exemplary
programs: A technical report. National Dropout Prevention Center/Network.
Harrison, G.B. (2010). Evaluating outcomes of the Jostens Renaissance program at a
suburban high school. (Doctoral dissertation). Retrieved from ProQuest LLC
database. (UMI 3435582)
Hemmelgarn, A. L., Glisson, G., & James, L. R. (2006). Organizational culture and climate:
Implications for services and interventions research. Clinical Psychology: Science
and Practice, 13, 73–89. doi:10.1111/j.1468-2850.2006.00008.x.
Holzer, H. J., & Danziger, S. (1998). Are jobs available for disadvantaged workers in urban
areas? Institute for Research on Poverty, Discussion Paper no. 1157-98.
Horner, R. H., Sugai, G., Todd, A. W., & Lewis-Palmer, T. (2005). School-wide positive
behavior support. In L. Bambara & L. Kern (Eds.), Individualized supports for
students with problem behaviors: Designing positive behavior plans (pp. 359–390).
New York: Guilford.

177
Horner, R., Todd, A., Lewis-Palmer, T., Irvin, L. K., Sugai, G., & Boland, J. (2004). The
School-wide Evaluation Tool (SET): A research instrument for assessing school-wide
positive behavior supports. Journal of Positive Behavior Interventions, 6, 3–12.
doi:10.1177/10983007040060010201.
Irvin, L. K., Tobin, T. J., Sprague, J. R., Sugai, G., & Vincent, C.G. (2004). Validity of office
discipline referral measures as indices of school-wide behavioral status and effects of
school-wide behavioral interventions. Journal of Positive Behavior Interventions. 6
(3), 131-147.
Jacob, B. A., Lefgren, L. (2009). The effect of grade retention on high school completion.
Center for Local, State and Urban Policy, Working Paper No. 12, February 2009.
Retrieved from: http://closup.umich.edu
Jimerson, S. R. (2001). Meta-analysis of grade retention research: Implications for practice in
the 21st century. School Psychology Review, 30 (3), 420-437.
Jimerson, S. R., Anderson, G. E., & Whipple, A. (2002). Winning the battle and losing the
war: Examining the relation between grade retention and dropping out of high school.
Psychology in the Schools, 39 (4), 441-457.
Katz, L. F., Krueger, A. B., Burtless, G., & Dickens, W. T. (1999). The high-pressure U.S.
labor market of the 1990s. Brookings Papers on Economic Activity, 1999, (1), 1-87.
Killu, K., Weber, K. P., Derby, K. M., & Barretto, A. (2006). Behavior intervention planning
and implementation of positive behavioral support plans: An examination of states’
adherence to standards of practice. Journal of Positive Behavior Interventions, 8 (4),
195-200.
178
Lassen, S. R., Steele, M. M., & Sailor, W. (2006). The relationship of school-wide positive
behavior support to academic achievement in an urban middle school. Psychology in
the Schools, 43 (6), 701-712.
Lindsey, B. C. (2008). Looking at positive behavior interventions and supports through the
lens of innovation diffusion. The Innovation Journal: The Public Sector Innovation
Journal, 13 (2), article 7.
MacPherson, K., & Carter, C. (2009). Academic optimism: The possible benefits over
current discipline policies. Journal of Cross-Disciplinary Perspectives in Education,
2 (1), 59-69.
Mayer, G. R. (1995). Preventing antisocial behavior in the schools. Journal of Applied
Behavior Analysis, 28 (4), 467-478.
McIntosh, K., Campbell, A. L., Carter, D. R., & Zumbo, B. D. (2009). Concurrent validity of
office discipline referrals and cut points used in schoolwide positive behavior support.
Behavioral Disorders, 34 (2), 100-113.
Missouri Dept. of Education (MDE). (2001). Positive behavioral interventions and supports
(PBIS). Show me how technical assistance bulletin. Division of Special Education
Missouri State Dept.. of Elementary and Secondary Education. ED 451 659.
Available from: http://www.coe.missouri.edu
Monroe, C. R. (2005). Why are “bad boys” always black? Causes of disproportionality in
school discipline and recommendations for change. The Clearing House, 79 (1), 45-
50.
179
Muller, E. (2002). Statewide behavior initiatives—Literature review and survey results.
Synthesis brief. National Association of State Directors of Special Education, ED
472-089. Retrieved from: http://www.nasdse.org/forum.htm
Murphy, K. M. & Welch, F. (1992). The structure of wages. The Quarterly Journal of
Economics, 107 (1), 285-326.
Muscott, H. S., Mann, E., Benjamin, T. B., Gately, S., Bell, K. E., & Muscott, A. J. (2004).
Positive behavioral interventions and supports in New Hampshire: Preliminary results
of a statewide system for implementing schoolwide discipline practices. Education
and Treatment of Children, 27 (4), 453-475.
Netzel, D.M., & Eber, L. (2003). Shifting from reactive to proactive discipline in an urban
school district: A change of focus through PBIS implementation. Journal of Positive
Behavior Interventions, 5, 71–79.
Pong, S-L. (1997). Family structure, school context, and eighth-grade math and reading
achievement. Journal of Marriage and Family, 59 (3), 734-746.
Postles, B. B. (2011). Do rewards work: The effects of positive behavior interventions and
support on state test scores. Ph.D. Dissertation, Capella University, UMI number
3450561.
Roderick, M. (1994). Grade retention and school dropout: Investigating the association.
American Educational Research Journal, 31, (4), 729-759.
Rosenbaum, J. E., Kariya, T., Settersten, R., & Maier, T. (1990). Market and network
theories of the transition from high school t work: Their application to industrialized
societies. Annual Review of Sociology, 16 (1990), 263-299.

180
Rumberger, R. W. & Lamb, S. P. (1998). The early employment and further education
experience of high school dropouts: A comparative study of the United States and
Australia. OECD Secretariat. May 1998.
Sagett, B. (2004). Relationships between the positive interventions and supports approach
and school climate. (Doctoral dissertation). Retrieved from ProQuest LLC database.
(UMI 3128287)
Sirin, S. R. (2005). Socioeconomic status and academic achievement: A meta-analytic review
of research. Review of Educational Research, 75: 417. doi:
10.3102/00346543075003417
Skiba, R. J., Michael, R. S., Nardo, A. C., & Peterson, R. (2000). The color of discipline:
Sources of racial and gender disproportionality in school punishment, Indiana
Education Policy Center, Policy report #SRS1.
Skiba, R. J., Peterson, R. L. (2000). School discipline at a crossroads: From zero tolerance to
early response. Exceptional Children, 66 (3), 335-347.
Sugai, G. (2009). Beyond the discipline handbook: How schools can implement a positive
approach to managing student behavior: A conversation with George Sugai. The
Education Digest, November 2009, 37-41.
Sugai, G., Horner, R. H., (1999-2000). Including the functional behavioral assessment
technology in schools. Exceptionality, 8 (3), 145-148.
Sugai, G., Horner, R. H. (2002a). The evolution of discipline practices: School-wide positive
behavior supports. Child & Family Behavior Therapy, 24 (1) 23-50.
Sugai, G., Horner, R. H. (2002b). Introduction to the special series on positive behavior
support in schools. Journal of Emotional and Behavioral Disorders, 10 (3), 130-135.

181
Sugai, G., Horner, R. H. (2006). A promising approach for expanding and sustaining school-
wide positive behavior support. School Psychology Review. 35 (2), 245-259.
Sugai, G., Horner, R. H. (2009). Responsiveness-to-intervention and school-wide positive
behavior supports: Integration of multi-tiered system approaches. Exceptionality, 17,
223-237.
Sugai, G., Horner, R.H., Algozzine, R., Barrett, S., Lewis, T., Anderson, C. et al. (2010).
School-wide positive behavior support: Implementers' blueprint and self-assessment.
Eugene, OR: University of Oregon. Retrieved from
http://www.pbis.org/common/pbisresources/publications/SWPBS_ImplementationBl
ueprint_vSep_23_2010.pdf
Sugai, G., Horner, R. H., Dunlap, G., Hieneman, M., Lewis, T. J., & Nelson, C. M., Scott et
al. (2000). Applying positive behavior support and functional behavioral assessment
in schools. Journal of Positive Behavior Interventions, 2 (3), 131-143.
Sugai, G., Fallon, L., & O’Keefe, B. (2012). SWPBS: Reconceptualizing & Studying
Culture. Center for Behavioral Educa”on & Research. Retrieved from
https://www.pbis.org/common/cms/files/pbisresources/SWPBIS_culture_Nov2_2012.
Texas Education Agency (TEA) (2006). Academic Excellence Indicator System (AEIS).
Retrieved from http://ritter.tea.state.tx.us/perfreport/aeis
Texas Education Agency (TEA) (2007). Academic Excellence Indicator System (AEIS).
Retrieved from http://ritter.tea.state.tx.us/perfreport/aeis
Texas Education Agency (TEA) (2008). Academic Excellence Indicator System (AEIS).
Retrieved from http://ritter.tea.state.tx.us/perfreport/aeis

182
Texas Education Agency (TEA) (2009). Academic Excellence Indicator System (AEIS).
Retrieved from http://ritter.tea.state.tx.us/perfreport/aeis
Texas Education Agency (TEA) (2010). Academic Excellence Indicator System (AEIS).
Retrieved from http://ritter.tea.state.tx.us/perfreport/aeis
Texas Education Agency (TEA) (2011). Academic Excellence Indicator System (AEIS).
Retreived from http://ritter.tea.state.tx.us/perfreport/aeis
Texas Education Agency (TEA) (2012). Academic Excellence Indicator System (AEIS).
Retreived from http://ritter.tea.state.tx.us/perfreport/aeis
Wagner, M. M., & Backorby, J. (1996). Transition from high school to work or college: How
special education students fare. The Future of Children Special Education for
Students with Disabilities, 6 (1), 103-120.
Warren, J. S., Bohanon-Edmonson, H. M., Turbull, A. P., Sailor, W., Wickham, D., Griggs,
P., & Beech, S. E. (2006). School-wide positive behavior support: Addressing
behavior problems that impede student learning. Educational Psychology Review, 18,
187-198.
Webb-Johnson, G. (2002). Are schools ready for Joshua? Dimensions of African-American
culture among students identified as having behavioral/emotional disorders.
International Journal of Qualitative Studies in Education, 15 (6), 653-671.
Weiss, A. (1988). High school graduation, performance, and wages. The Journal of Political
Economy, 96 (4), 785-820.
183
APPENDIX A
THE PRINCIPAL PBIS IMPLEMENTATION SURVEY

184
Principal PBIS Implementation Survey
Name of School
1. Select the years for which your school implemented PBIS. (Check all that apply)
2007
2008
2009
2010
2011
2. Does your school have a PBIS leadership team?
Yes
No
3. Who is a member of the PBIS leadership team? (Check all that apply)
Administrators
Paraprofessionals
Students
Parents
Custodial Staff
4. Does your school have a PBIS motto in place?
Yes
No
5. Who participated in the development of the motto? (Check all that apply)
Administrators
Teachers
Paraprofessionals
Students
Parents
Custodial Staff
Office Staff
Community Members
6. Does your school have a PBIS matrix in place?
Yes
No
7. Who participated in the development of the PBIS matrix? (Check all that apply.)
Administrators
Teachers
Paraprofessionals
Students
Parents
Custodial Staff
Cafeteria Staff Community Members
Teachers
Community Members
Cafeteria Staff
Office Staff

185
8. What type of formal training/introduction did staff members receive regarding
initial training of PBIS ideas, concepts and practices?
9. Did the staff receive training after the first year?
Yes
No
10. What type of ongoing PBIS training did your staff and/or students participate?
11. Was performance data, such as discipline rates and achievement rates, shared
with staff members?
Yes
No
The follow questions refer to the implementation practices of your campus.
Reflecting over the time since your school implemented PBIS, how often does the
faculty review the PBIS matrix and motto with students? (If your school did not
participate in PBIS during the school year listed, select N/A.)
12. Implementation Year (2006-2007)
N/A (PBIS was not in place)
Once a week
Once a grading period
Once a semester
Once a year
No training took place
Other (specify):
13. Implementation Year (2007-2008)
N/A (PBIS was not in place)
Once a week
Once a grading period
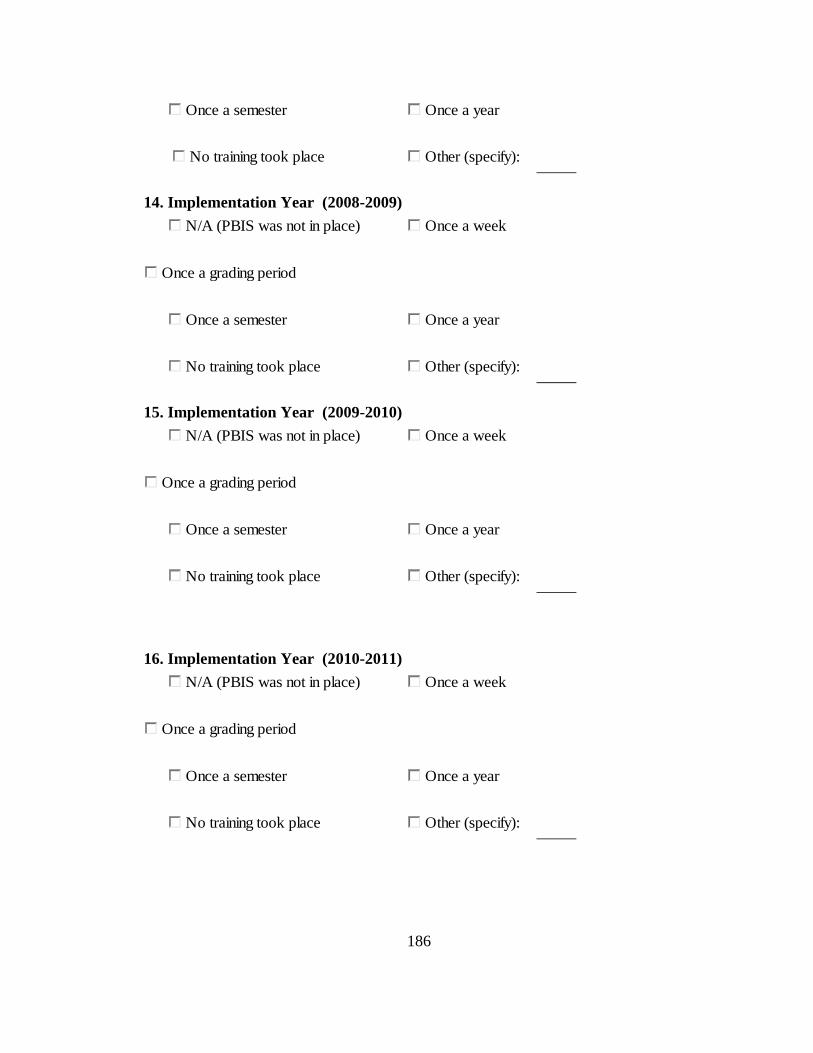
186
Once a semester
Once a year
No training took place
Other (specify):
14. Implementation Year (2008-2009)
N/A (PBIS was not in place)
Once a week
Once a grading period
Once a semester
Once a year
No training took place
Other (specify):
15. Implementation Year (2009-2010)
N/A (PBIS was not in place)
Once a week
Once a grading period
Once a semester
Once a year
No training took place
Other (specify):
16. Implementation Year (2010-2011)
N/A (PBIS was not in place)
Once a week
Once a grading period
Once a semester
Once a year
No training took place
Other (specify):

187
17. Did your staff participate administered the EBS survey from information
services in…
…2007-2008? …2008-2009? …2009-2010? …2010-2011?
Yes No
Yes No
Yes No
Yes No

188
APPENDIX B
EFFECTIVE BEHAVIOR SUPPORT (EBS) SURVEY
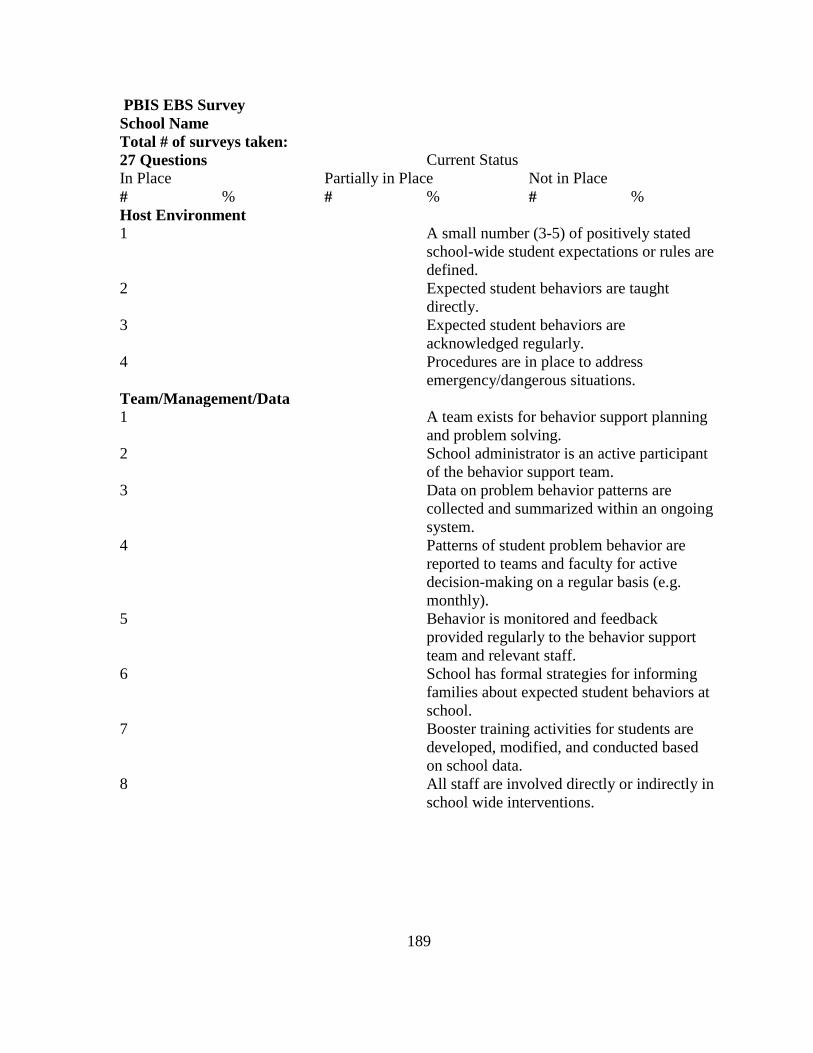
189
PBIS EBS Survey
School Name
Total # of surveys taken:
27 Questions Current Status
In Place Partially in Place Not in Place
# % # % # %
Host Environment 1 A small number (3-5) of positively stated
school-wide student expectations or rules are
defined.
2 Expected student behaviors are taught
directly.
3 Expected student behaviors are
acknowledged regularly.
4 Procedures are in place to address
emergency/dangerous situations.
Team/Management/Data 1 A team exists for behavior support planning
and problem solving.
2 School administrator is an active participant
of the behavior support team.
3 Data on problem behavior patterns are
collected and summarized within an ongoing
system.
4 Patterns of student problem behavior are
reported to teams and faculty for active
decision-making on a regular basis (e.g.
monthly).
5 Behavior is monitored and feedback
provided regularly to the behavior support
team and relevant staff.
6 School has formal strategies for informing
families about expected student behaviors at
school.
7 Booster training activities for students are
developed, modified, and conducted based
on school data.
8 All staff are involved directly or indirectly in
school wide interventions.

190
Non-Classroom Settings/Active Supervision 1 School-wide expected student behaviors are
taught and applied to non-classroom settings.
2 Adults actively supervise (move, scan, and
interact) with students in non-classroom
settings.
3 Transitions between instructional and non-
instructional activities are efficient and
orderly.
4 Acknowledgments exist for meeting
expected student behaviors in non-classroom
settings.
5 Staff receives regular opportunities for
developing and improving active supervision
skills.
6 All staff are involved directly or indirectly in
management of non-classroom settings.
Classroom 1 Expected student behavior and routines in
classroom are stated positively and defined
clearly.
2 Expected student behaviors and routines in
classroom are taught directly.
3 Expected student behaviors are
acknowledged regularly. (Positive
reinforcement: 5:1)
4 Procedures for expected and problem
behaviors are consistent with school-wide
procedures.
5 Students experience high rates of academic
success (>80%)
6 Teachers have regular opportunities for
access to assistance and recommendations
(observations, instruction, and coaching.)
7 Distinctions between office v. classroom
managed problem behaviors are clear.
8 A simple process exists for teachers to
requests assistance.
9 Options exist to allow classroom instruction
to continue when problem behavior occurs.

191
APPENDIX C
STUDERNT PERFORMANCE OUTCOME DATA COLLECTION INSTRUMENT
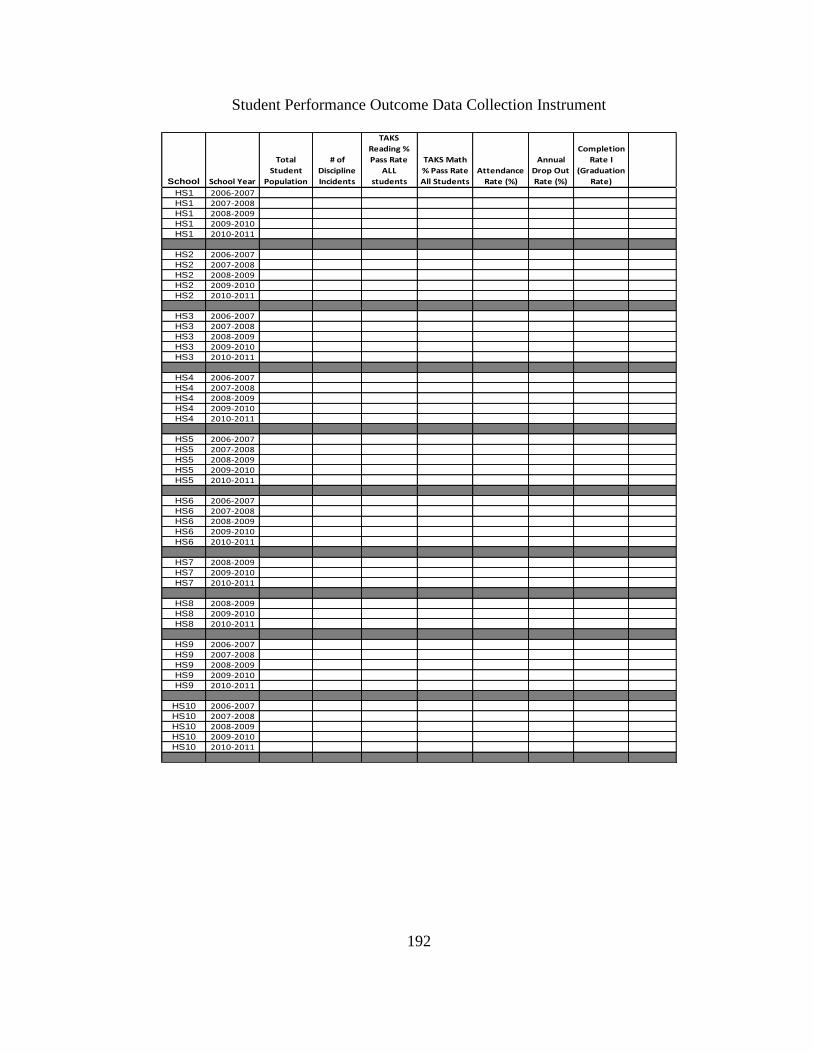
192
Student Performance Outcome Data Collection Instrument
School School Year
Total
Student
Population
# of
Discipline
Incidents
TAKS
Reading %
Pass Rate
ALL
students
TAKS Math
% Pass Rate
All Students
Attendance
Rate (%)
Annual
Drop Out
Rate (%)
Completion
Rate I
(Graduation
Rate)
HS1 2006-2007HS1 2007-2008HS1 2008-2009HS1 2009-2010HS1 2010-2011
HS2 2006-2007HS2 2007-2008HS2 2008-2009HS2 2009-2010HS2 2010-2011
HS3 2006-2007HS3 2007-2008HS3 2008-2009HS3 2009-2010HS3 2010-2011
HS4 2006-2007HS4 2007-2008HS4 2008-2009HS4 2009-2010HS4 2010-2011
HS5 2006-2007HS5 2007-2008HS5 2008-2009HS5 2009-2010HS5 2010-2011
HS6 2006-2007HS6 2007-2008HS6 2008-2009HS6 2009-2010HS6 2010-2011
HS7 2008-2009HS7 2009-2010HS7 2010-2011
HS8 2008-2009HS8 2009-2010HS8 2010-2011
HS9 2006-2007HS9 2007-2008HS9 2008-2009HS9 2009-2010HS9 2010-2011
HS10 2006-2007HS10 2007-2008HS10 2008-2009HS10 2009-2010HS10 2010-2011

193
APPENDIX D
LETTER TO PRINCIPAL

194
Dear Principal,
Hello, my name is Kimberly Rhodes-Monette and I am currently serving the district as an
assistant principal. I am contacting you because I am in need of your assistance.
I am in the process of completing my Doctorate in Education Administration from Texas
A& M University. I will analyze the differences between the implementation of Positive
Behaviors Interventions Supports (PBIS) in the district at the high school level. I want to
determine if the implementation of PBIS has a significant statistical impact on high
school graduation rates and factors related to students who drop out of high school such
as discipline assignments, attendance rates, and academic performance.
To accomplish my goal, I would like to schedule a meeting with you to discuss my
research and hopefully acquire your signature. To gain approval in the district, I must
submit a signed copy from each high school principal of the Application for Conducting
Research in the District (Internal Applicant). Once approved, I will receive the number
of student discipline assignments and the results of your staff PBIS perception surveys
directly from the Information Services department. The other factors (listed above) that
impact drop outs will be obtained from publicly available AEIS reports. I will cover the
school years 2006-2007 to 2010-2011.
My second appeal will ask you to complete a survey to determine the level of
implementation of PBIS on your campus. This portion can be completed once approval is
obtained from the district and IRB.
Thank you for your time and attention. I look forward to the opportunity to meet with you
soon. I have attached my Information Sheet, the district application and the PBIS survey
for your preview.
Sincerely,
Kimberly Rhodes-Monette

195
APPENDIX E
TEXAS A&M INFORMATION SHEET

196
INFORMATION SHEET
AN ANALYSIS OF FOUR IMPLEMENTATION LEVELS FOR THE POSITIVE
BEHAVIORAL INTERVENTIONS AND SUPPORTS (PBIS) ON SELECTED
AGGREGATED HIGH SCHOOL STUDENT PERFORMANCE OUTCOMES
The purpose of this form is to provide you (prospective research study participant)
information that may affect your decision whether or not to participate in this research.
Introduction I am planning to conduct research to determine the impact of the implementation of Positive
Behaviors Interventions Supports (PBIS) on High School graduation rates and factors
impacting the dropout rate. I am requesting your participation in a research based study.
I will conduct a quantitative study to analyze the differences of the implementation of PBIS
on the district at the High School level. I seek to determine if the implementation of PBIS has
a significant statistical difference between High School graduation rates and circumstances
relative to High School students who drop out such as discipline assignments, attendance
rates and academic performance.
Initial Research Tasks
1 To determine the implementation level of PBIS at each high school based upon the
following criteria:
a. The duration of PBIS practice.
b. The composition of PBIS leadership team.
c. The composition of PBIS motto and matrix development team.
d. The initial PBIS training.
e. The ongoing PBIS training and support.
f. The perception of the staff members regarding the effectiveness of the PBIS
practices.
2 To categorize each high school into one of four PBIS implementation levels (high,
moderate, low, or none).
Research Questions
1 Is there a difference in the aggregated student performance of high schools with differing
levels of PBIS implementation on the following selected aggregated outcome
variables:
a. The discipline infraction rate?
b. The math TAKS pass rate?
c. The reading TAKS pass rate?
d. The attendance rate?
e. The dropout rate?
f. The graduation rate?
2 Is there a difference in the aggregated student performance of PBIS high schools and
non-PBIS high schools on the following selected outcome variables:

197
a. The discipline infraction rate?
b. The math TAKS pass rate?
c. The reading TAKS pass rate?
d. The attendance rate?
e. The dropout rate?
f. The graduation rate?
How can you support my research?
Upon agreement to participate in this study, you will be provided a questionnaire to provide
feedback regarding the implementation practices of PBIS on your campus. The survey will
take approximately 20 minutes. You will also allow access to student discipline data and the
results of the faculty questionnaire conducted by the staff members reflecting their
perceptions of the implementation practices of PBIS on your campus.
What are the risks involved in this study?
The risks associated with this study are minimal and are not greater than risks ordinarily
encountered in daily life. Although the researchers have tried to avoid risks, you may feel
that some questions/procedures that are asked of you will be stressful or upsetting. You do
not have to answer anything you do not want to.
What are the possible benefits of this study?
You will receive no direct benefit from participating in this study; however, the results of this
study could potentially assist educational leaders in modifying implementation practices of
the PBIS system.
Do I have to participate?
Your participation is voluntary; you may decide not to participate or to withdraw at any time
without being affected. You may decide to not begin or to stop participating at any time. If
you choose not to be in this study or stop being in the study, there will be no effect on your
employment in the school district of study.
Who will know about my participation in this research study?
The information about you will be kept confidential to the extent permitted and/or required
by law. Records of this study will be kept in a locked safe; accessible to me exclusively.
Participants will be assigned a number; no identifiers will link you to this study or be
included in any sort of report that might be published.
Whom do I contact with questions about the research?
If you have questions regarding this study, you may contact:
Kimberly L. Rhodes-Monette
198
Whom do I contact about my rights as a research participant?
This research study has been reviewed by the Human Subjects’ Protection Program and/or
the Institutional Review Board at Texas A&M University. For research-related questions or
concerns regarding your rights as a research participant, you may contact these offices at
(979)458-4067 or [email protected].
Participation Please be sure you have read the above information in its entirety; feel free to submit
inquiries and receive a response to your satisfaction. Your response to the email or call (xxx)
xxx-xxxx; will confirm or decline your participation in my research study.

199
APPENDIX F
A DESCIPTION OF THE EFFECTIVE BEHAVIOR SUPPORT (EBS)
SURVEY RESULTS
TABLE 78
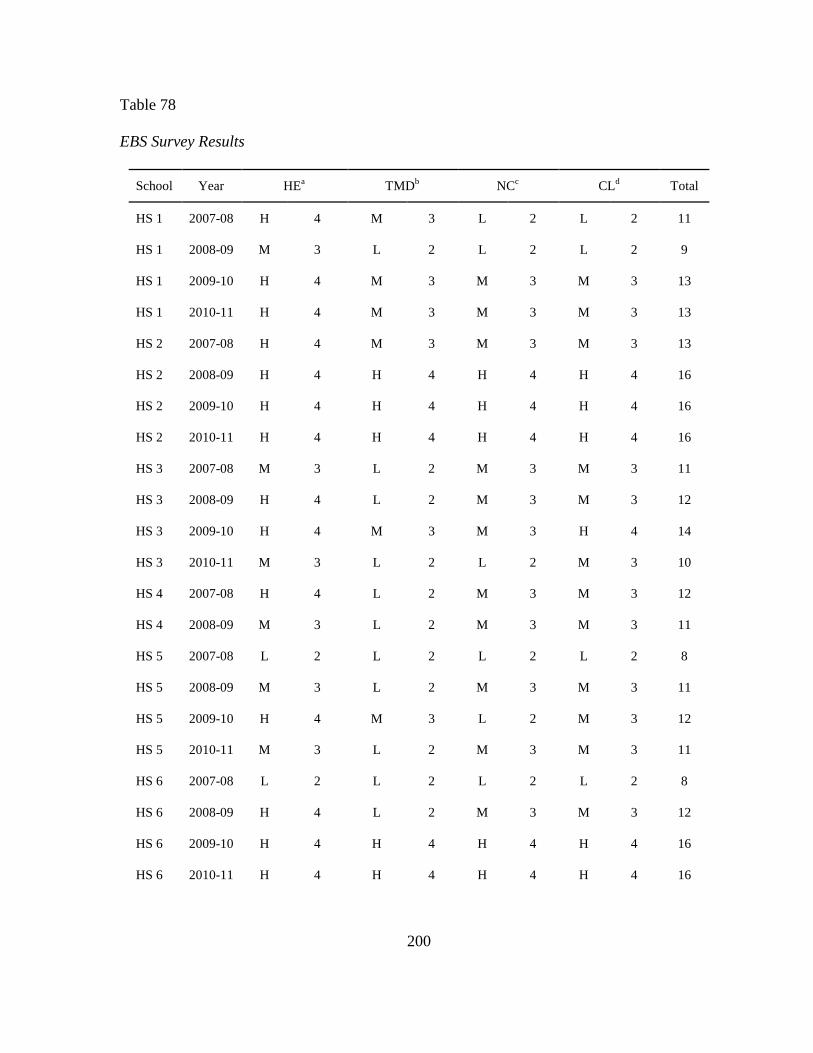
200
Table 78
EBS Survey Results
School Year HEa TMD
b NC
c CL
d Total
HS 1 2007-08 H 4 M 3 L 2 L 2 11
HS 1 2008-09 M 3 L 2 L 2 L 2 9
HS 1 2009-10 H 4 M 3 M 3 M 3 13
HS 1 2010-11 H 4 M 3 M 3 M 3 13
HS 2 2007-08 H 4 M 3 M 3 M 3 13
HS 2 2008-09 H 4 H 4 H 4 H 4 16
HS 2 2009-10 H 4 H 4 H 4 H 4 16
HS 2 2010-11 H 4 H 4 H 4 H 4 16
HS 3 2007-08 M 3 L 2 M 3 M 3 11
HS 3 2008-09 H 4 L 2 M 3 M 3 12
HS 3 2009-10 H 4 M 3 M 3 H 4 14
HS 3 2010-11 M 3 L 2 L 2 M 3 10
HS 4 2007-08 H 4 L 2 M 3 M 3 12
HS 4 2008-09 M 3 L 2 M 3 M 3 11
HS 5 2007-08 L 2 L 2 L 2 L 2 8
HS 5 2008-09 M 3 L 2 M 3 M 3 11
HS 5 2009-10 H 4 M 3 L 2 M 3 12
HS 5 2010-11 M 3 L 2 M 3 M 3 11
HS 6 2007-08 L 2 L 2 L 2 L 2 8
HS 6 2008-09 H 4 L 2 M 3 M 3 12
HS 6 2009-10 H 4 H 4 H 4 H 4 16
HS 6 2010-11 H 4 H 4 H 4 H 4 16
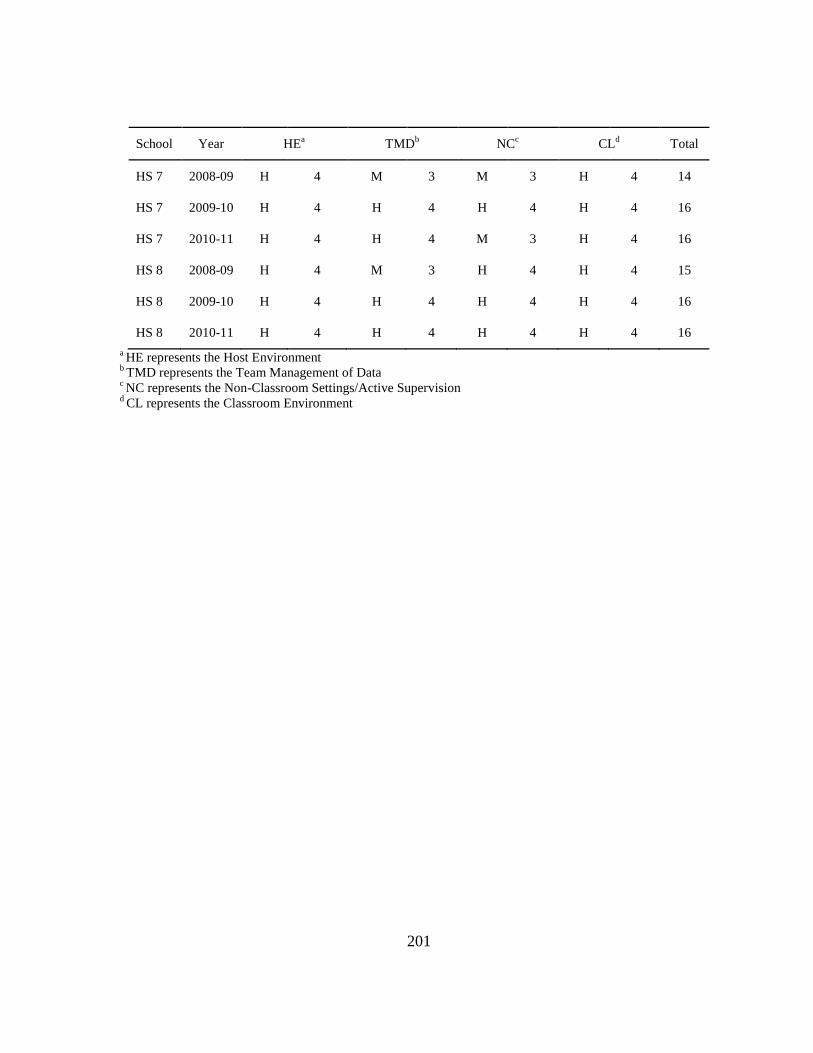
201
School Year HEa TMD
b NC
c CL
d Total
HS 7 2008-09 H 4 M 3 M 3 H 4 14
HS 7 2009-10 H 4 H 4 H 4 H 4 16
HS 7 2010-11 H 4 H 4 M 3 H 4 16
HS 8 2008-09 H 4 M 3 H 4 H 4 15
HS 8 2009-10 H 4 H 4 H 4 H 4 16
HS 8 2010-11 H 4 H 4 H 4 H 4 16
a HE represents the Host Environment
b TMD represents the Team Management of Data
c NC represents the Non-Classroom Settings/Active Supervision
d CL represents the Classroom Environment

202
APPENDIX G
A DESCRIPTION OF THE TRANSFORMATION OF THE
DISCIPLINE INFRACTION RATE
TABLES 79 – 88
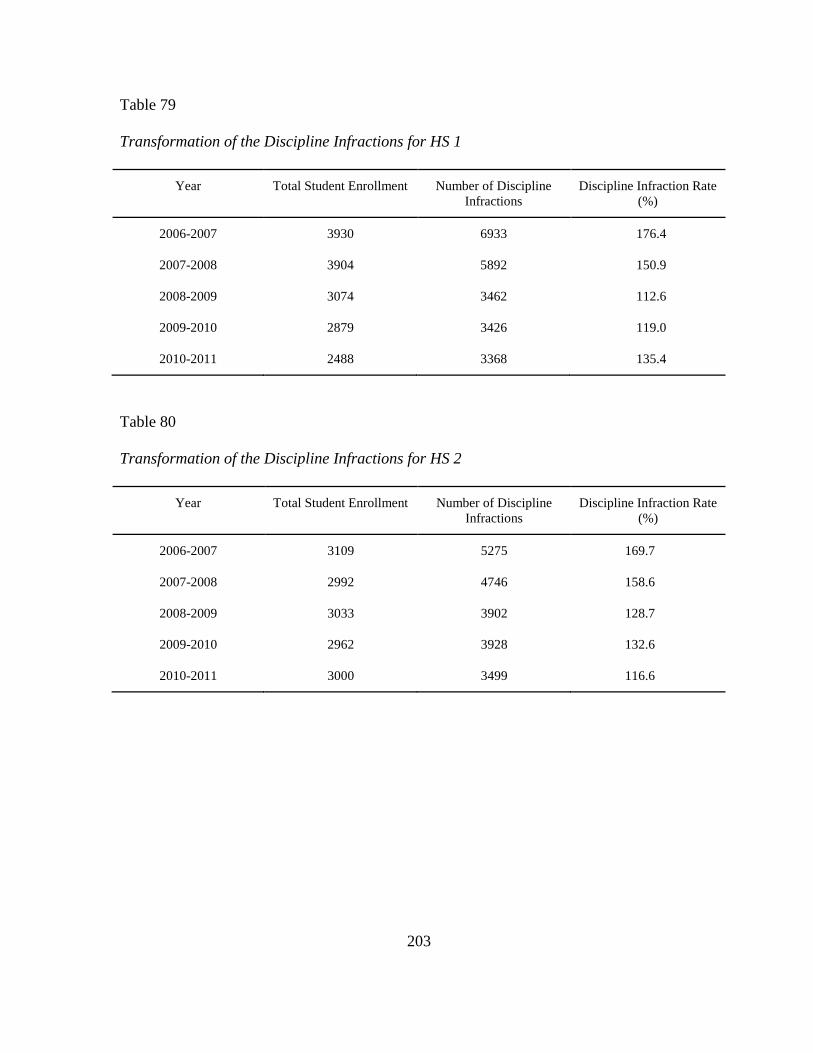
203
Table 79
Transformation of the Discipline Infractions for HS 1
Year Total Student Enrollment Number of Discipline
Infractions
Discipline Infraction Rate
(%)
2006-2007 3930 6933 176.4
2007-2008 3904 5892 150.9
2008-2009 3074 3462 112.6
2009-2010 2879 3426 119.0
2010-2011 2488 3368 135.4
Table 80
Transformation of the Discipline Infractions for HS 2
Year Total Student Enrollment Number of Discipline
Infractions
Discipline Infraction Rate
(%)
2006-2007 3109 5275 169.7
2007-2008 2992 4746 158.6
2008-2009 3033 3902 128.7
2009-2010 2962 3928 132.6
2010-2011 3000 3499 116.6

204
Table 81
Transformation of the Discipline Infractions for HS 3
Year Total Student Enrollment Number of Discipline
Infractions
Discipline Infraction Rate
(%)
2006-2007 3331 3188 95.7
2007-2008 3271 2716 83.0
2008-2009 3071 2247 73.1
2009-2010 3191 2174 68.1
2010-2011 3310 2390 72.2
Table 82
Transformation of the Discipline Infractions for HS 4
Year Total Student Enrollment Number of Discipline
Infractions
Discipline Infraction Rate
(%)
2006-2007 3451 2976 86.2
2007-2008 3569 4153 116.3
2008-2009 3208 3084 96.1
2009-2010 3126 3191 102.1
2010-2011 2908 3108 106.9

205
Table 83
Transformation of the Discipline Infractions for HS 5
Year Total Student Enrollment Number of Discipline
Infractions
Discipline Infraction Rate
(%)
2006-2007 3044 2976 97.8
2007-2008 3127 2727 87.2
2008-2009 3183 3387 106.4
2009-2010 3283 3560 108.4
2010-2011 3297 2712 82.3
Table 84
Transformation of the Discipline Infractions for HS 6
Year Total Student Enrollment Number of Discipline
Infractions
Discipline Infraction Rate
(%)
2006-2007 3417 3644 106.6
2007-2008 3473 4021 115.8
2008-2009 3287 2625 79.9
2009-2010 3347 3459 103.3
2010-2011 3358 3054 90.9

206
Table 85
Transformation of the Discipline Infractions for HS 7
Year Total Student Enrollment Number of Discipline
Infractions
Discipline Infraction Rate
(%)
2006-2007 - - -
2007-2008 - - -
2008-2009 1535 2635 171.7
2009-2010 2389 3960 165.8
2010-2011 3208 4762 148.4
Table 86
Transformation of the Discipline Infractions for HS 8
Year Total Student Enrollment Number of Discipline
Infractions
Discipline Infraction Rate
(%)
2006-2007
2007-2008
2008-2009 836 488 58.4
2009-2010 1498 1002 66.9
2010-2011 2292 1692 74.8

207
Table 87
Transformation of the Discipline Infractions for HS 9
Year Total Student Enrollment Number of Discipline
Infractions
Discipline Infraction Rate
(%)
2006-2007 3172 3744 118.0
2007-2008 3118 3740 119.9
2008-2009 2984 2621 88.5
2009-2010 2953 2773 93.9
2010-2011 3149 2582 82.0
Table 88
Transformation of the Discipline Infractions for HS 10
Year Total Student Enrollment Number of Discipline
Infractions
Discipline Infraction Rate
(%)
2006-2007 2114 1876 88.7
2007-2008 3201 2956 92.3
2008-2009 3479 1892 54.4
2009-2010 3153 1850 58.7
2010-2011 2681 1617 60.3

208
APPENDIX H
A DECRIPTION OF THE MATH AND READING TAKS PASS RATE
FIGURES 17 - 26

209
Figure 17. The Math & Reading TAKS Pass Rates for HS 1
Figure 18. The Math & Reading TAKS Pass Rates for HS 2
0
20
40
60
80
100
Math & Reading TAKS for HS 1
TAXS Math % Pass Rate All Students
TAKS Reading % Pass Rate ALL students
0
20
40
60
80
100
Math & Reading TAKS for HS 2
TAXS Math % Pass Rate All Students
TAKS Reading % Pass Rate ALL students
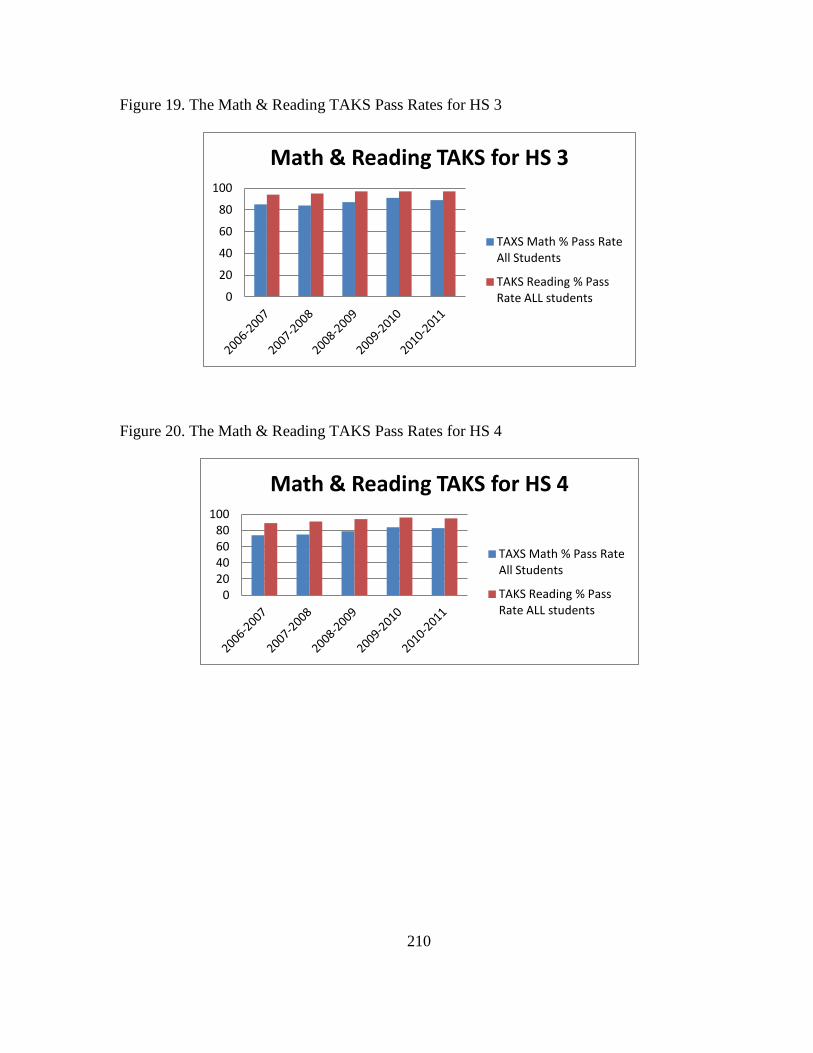
210
Figure 19. The Math & Reading TAKS Pass Rates for HS 3
Figure 20. The Math & Reading TAKS Pass Rates for HS 4
0
20
40
60
80
100
Math & Reading TAKS for HS 3
TAXS Math % Pass Rate All Students
TAKS Reading % Pass Rate ALL students
0 20 40 60 80
100
Math & Reading TAKS for HS 4
TAXS Math % Pass Rate All Students
TAKS Reading % Pass Rate ALL students

211
Figure 21. The Math & Reading TAKS Pass Rates for HS 5
Figure 22. The Math & Reading TAKS Pass Rates for HS 6
0
20
40
60
80
100
Math and Reading TAKS for HS 5
TAXS Math % Pass Rate All Students
TAKS Reading % Pass Rate ALL students
0
20
40
60
80
100
Math & Reading TAKS for HS 6
TAXS Math % Pass Rate All Students
TAKS Reading % Pass Rate ALL students

212
Figure 23. The Math & Reading TAKS Pass Rates for HS 7
Figure 24. The Math & Reading TAKS Pass Rates for HS 8
0
20
40
60
80
100
2008-2009 2009-2010 2010-2011
Math & Reading TAKS for HS 7
TAXS Math % Pass Rate All Students - -
TAKS Reading % Pass Rate ALL students - -
0
20
40
60
80
100
2008-2009 2009-2010 2010-2011
Math & Reading TAKS HS 8
TAXS Math % Pass Rate All Students - -
TAKS Reading % Pass Rate ALL students - -
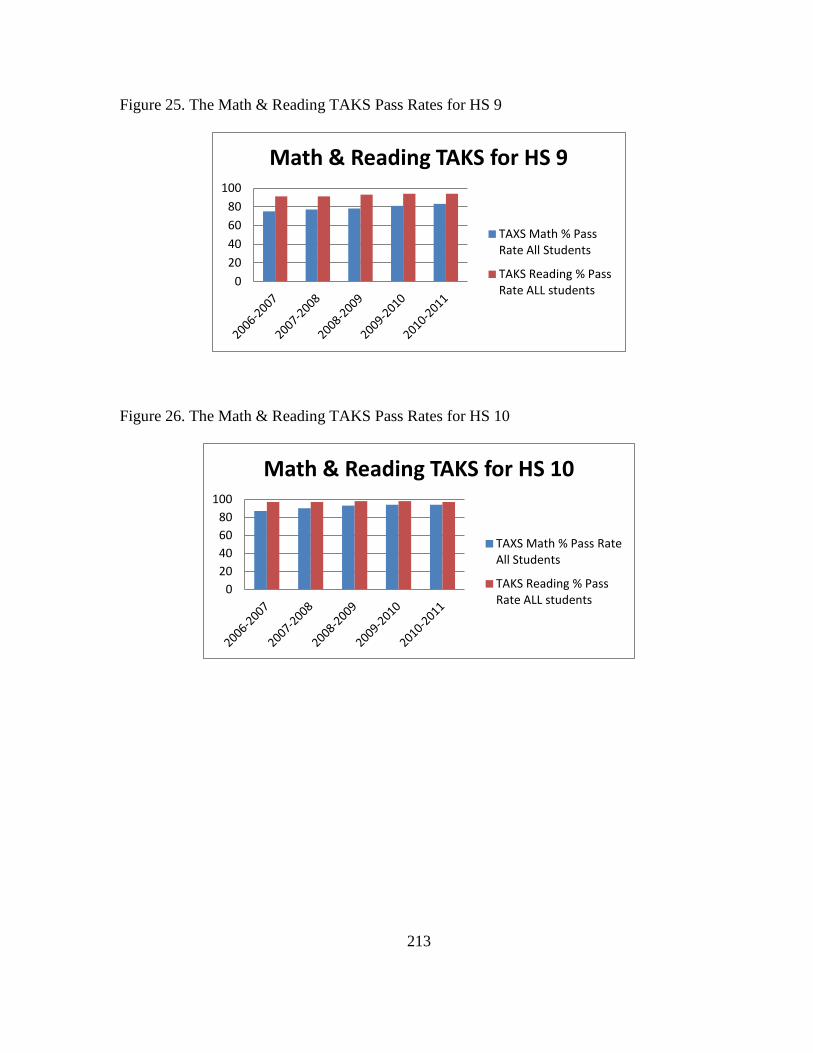
213
Figure 25. The Math & Reading TAKS Pass Rates for HS 9
Figure 26. The Math & Reading TAKS Pass Rates for HS 10
0
20
40
60
80
100
Math & Reading TAKS for HS 9
TAXS Math % Pass Rate All Students
TAKS Reading % Pass Rate ALL students
0
20
40
60
80
100
Math & Reading TAKS for HS 10
TAXS Math % Pass Rate All Students
TAKS Reading % Pass Rate ALL students

214
APPENDIX I
A DESCRIPTION OF THE ATTENDANCE RATES OF HIGH SCHOOLS
FIGURES 27 – 36

215
Figure 27. The Attendance Rate for HS 1
Figure 28. The Attendance Rate for HS 2
0
20
40
60
80
100
Attendance Rate for HS 1
Attendance Rate (%)
0
20
40
60
80
100
Attendance Rate for HS 2
Attendance Rate (%)
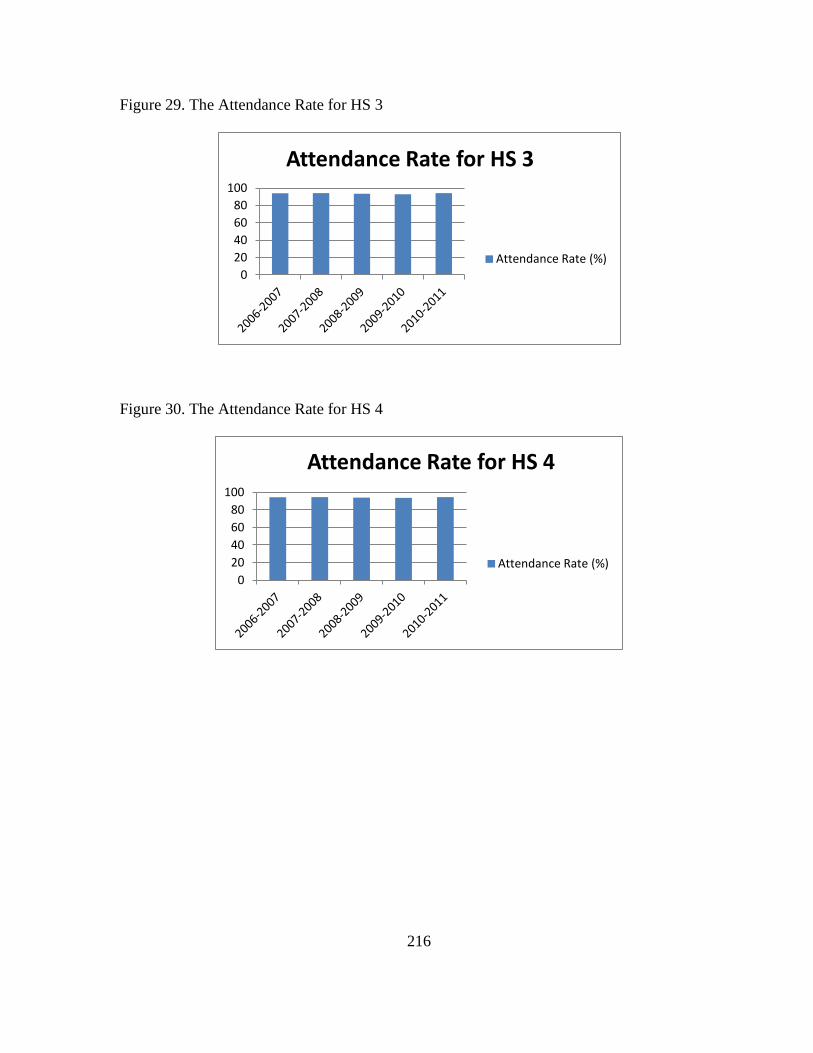
216
Figure 29. The Attendance Rate for HS 3
Figure 30. The Attendance Rate for HS 4
0
20
40
60
80
100
Attendance Rate for HS 3
Attendance Rate (%)
0
20
40
60
80
100
Attendance Rate for HS 4
Attendance Rate (%)

217
Figure 31. The Attendance Rate for HS 5
Figure 32. The Attendance Rate for HS 6
0
20
40
60
80
100
Attendance Rate for HS 5
Attendance Rate (%)
0
20
40
60
80
100
Attendance Rate for HS 6
Attendance Rate (%)

218
Figure 33. The Attendance Rate for HS 7
Figure 34. The Attendance Rate for HS 8
0
20
40
60
80
100
Attendance Rate for HS 7
Attendance Rate (%)
0
20
40
60
80
100
Attendance Rate for HS 8
Attendance Rate (%)
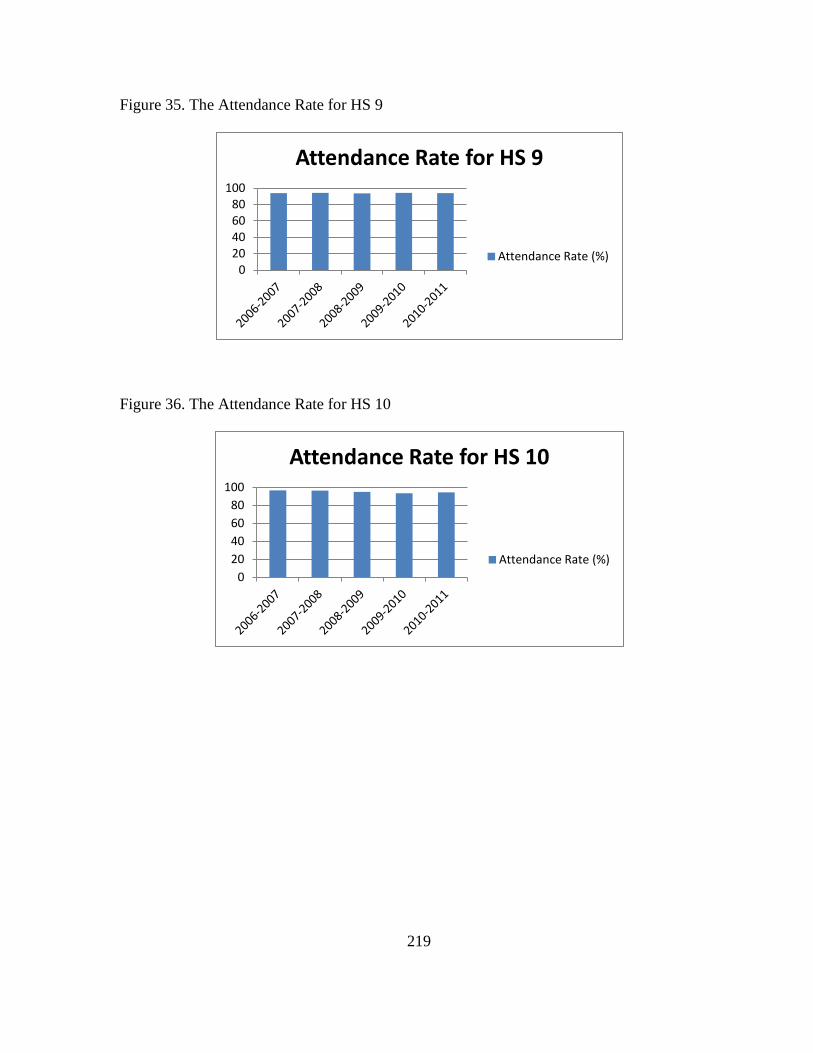
219
Figure 35. The Attendance Rate for HS 9
Figure 36. The Attendance Rate for HS 10
0 20 40 60 80
100
Attendance Rate for HS 9
Attendance Rate (%)
0
20
40
60
80
100
Attendance Rate for HS 10
Attendance Rate (%)

220
APPENDIX J
A DESCRIPTION OF THE DROPOUT RATES FOR HIGH SCHOOLS 1-10
FIGURES 37 – 46

221
Figure 37. The Dropout Rate for HS 1
Figure 38. The Dropout Rate for HS 2
0
0.5
1
1.5
2
2.5
The Dropout Rate for HS 1
Annual Drop Out Rate (%)
0
0.5
1
1.5
2
2.5
The Dropout Rate for HS 2
Annual Drop Out Rate (%)
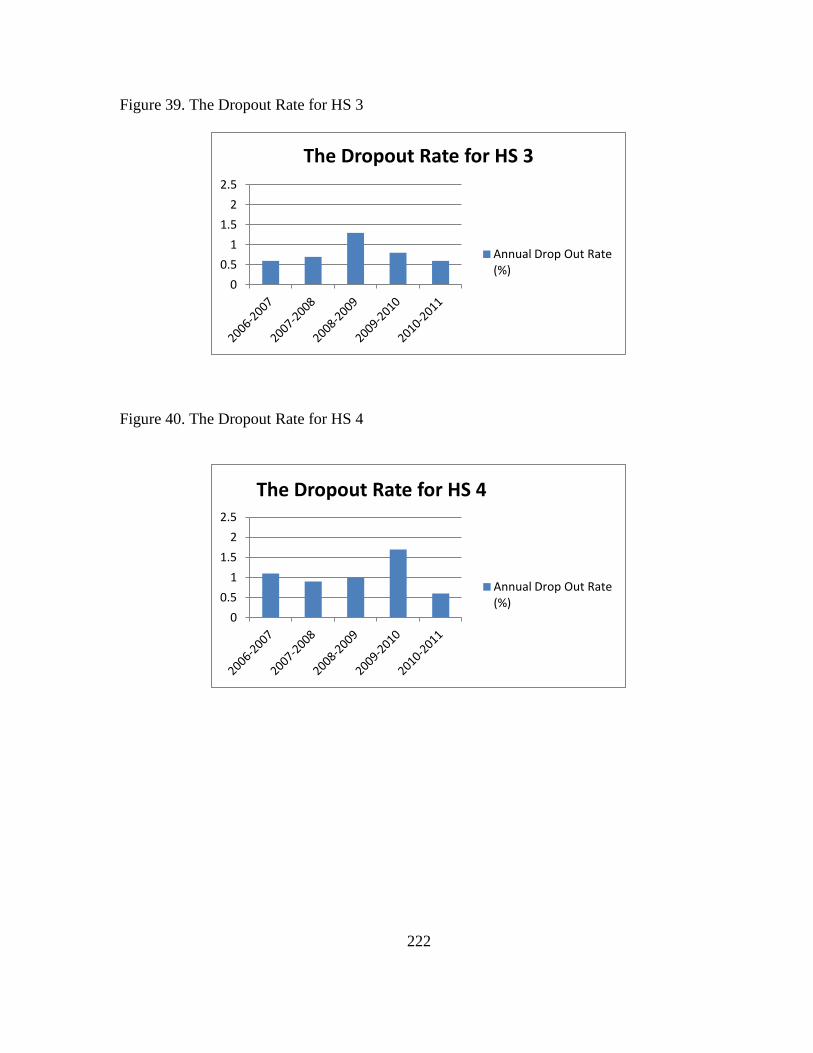
222
Figure 39. The Dropout Rate for HS 3
Figure 40. The Dropout Rate for HS 4
0
0.5
1
1.5
2
2.5
The Dropout Rate for HS 3
Annual Drop Out Rate (%)
0
0.5
1
1.5
2
2.5
The Dropout Rate for HS 4
Annual Drop Out Rate (%)

223
Figure 41. The Dropout Rate for HS 5
Figure 42. The Dropout Rate for HS 6
0
0.5
1
1.5
2
2.5
The Dropout Rate for HS 5
Annual Drop Out Rate (%)
0
0.5
1
1.5
2
2.5
The Dropout Rate for HS 6
Annual Drop Out Rate (%)

224
Figure 43. The Dropout Rate for HS 7
Figure 44. The Dropout Rate for HS 8
0
0.5
1
1.5
2
2.5
The Dropout Rate for HS 7
Annual Drop Out Rate (%)
0
0.5
1
1.5
2
2.5
The Dropout Rate for HS 8
Annual Drop Out Rate (%)
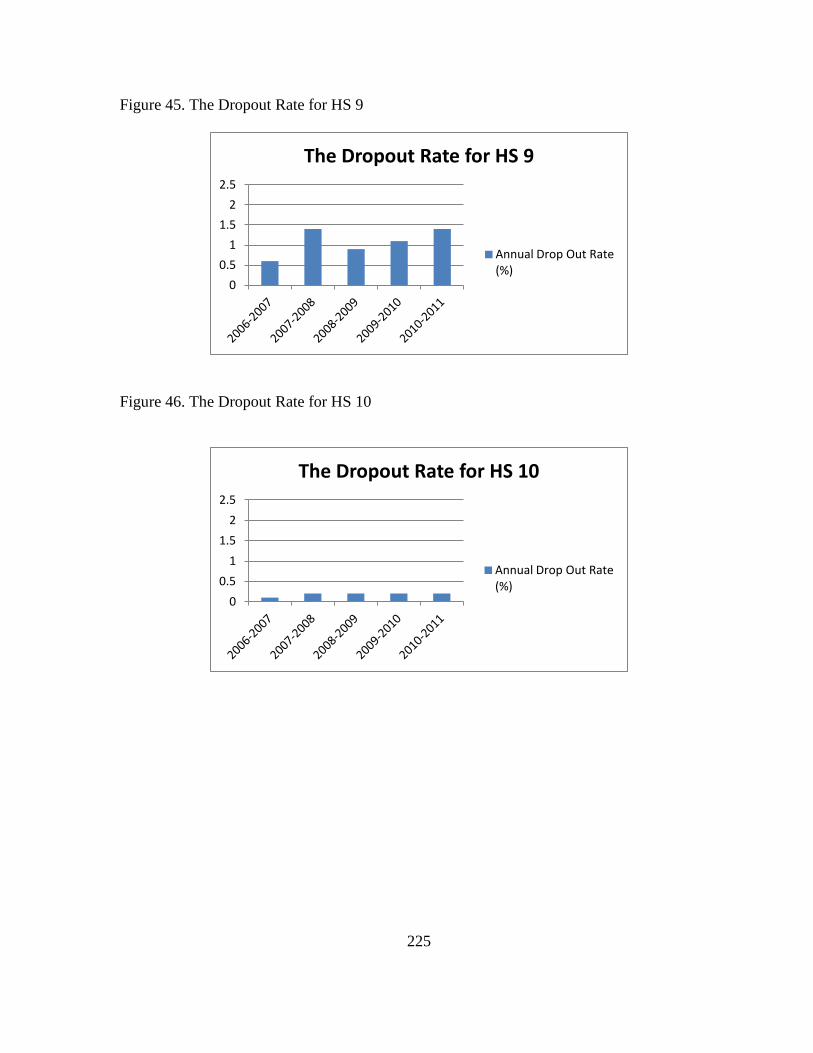
225
Figure 45. The Dropout Rate for HS 9
Figure 46. The Dropout Rate for HS 10
0
0.5
1
1.5
2
2.5
The Dropout Rate for HS 9
Annual Drop Out Rate (%)
0
0.5
1
1.5
2
2.5
The Dropout Rate for HS 10
Annual Drop Out Rate (%)

226
APPENDIX K
A DESCRIPTION OF THE GRADUATION RATES FOR HIGH SCHOOLS 1-10
FIGURES 47-54

227
Figure 47. The Graduation Rate for HS 1
Figure 48. The Graduation Rate for HS 2
0
20
40
60
80
100
The Graduation Rate for HS 1
Graduation Rate (%)
0
20
40
60
80
100
The Graduation Rate for HS 2
Graduation Rate (%)
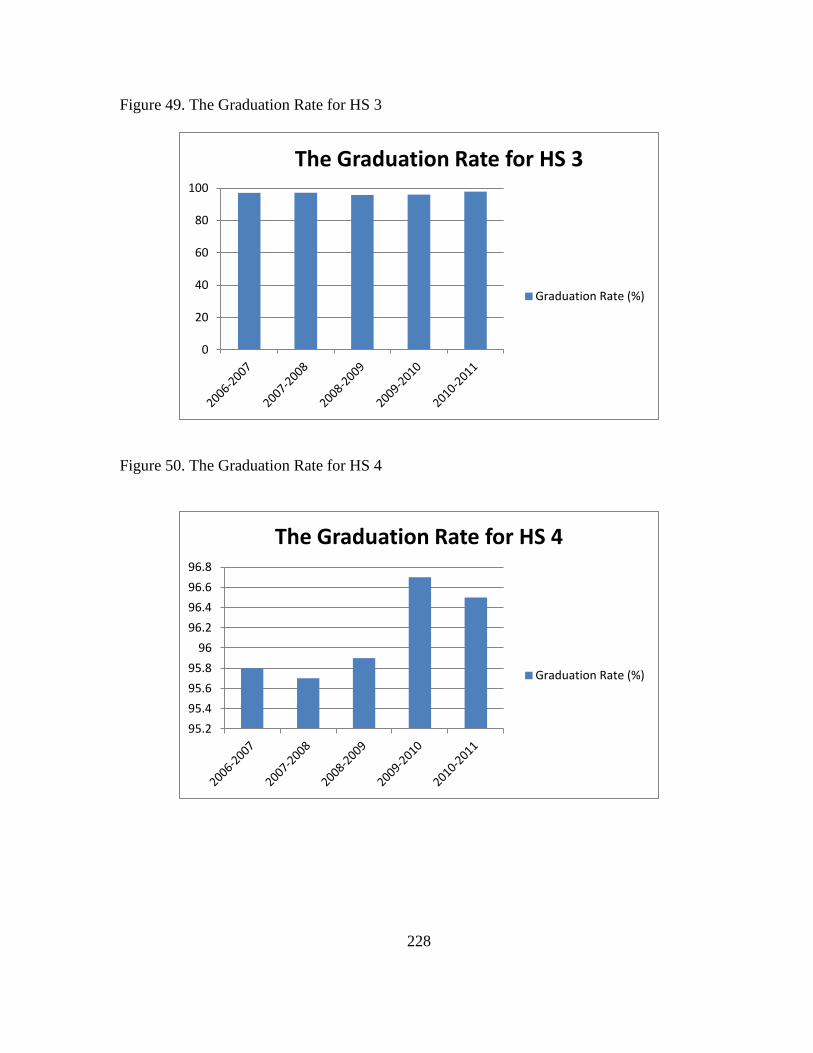
228
Figure 49. The Graduation Rate for HS 3
Figure 50. The Graduation Rate for HS 4
0
20
40
60
80
100
The Graduation Rate for HS 3
Graduation Rate (%)
95.2
95.4
95.6
95.8
96
96.2
96.4
96.6
96.8
The Graduation Rate for HS 4
Graduation Rate (%)
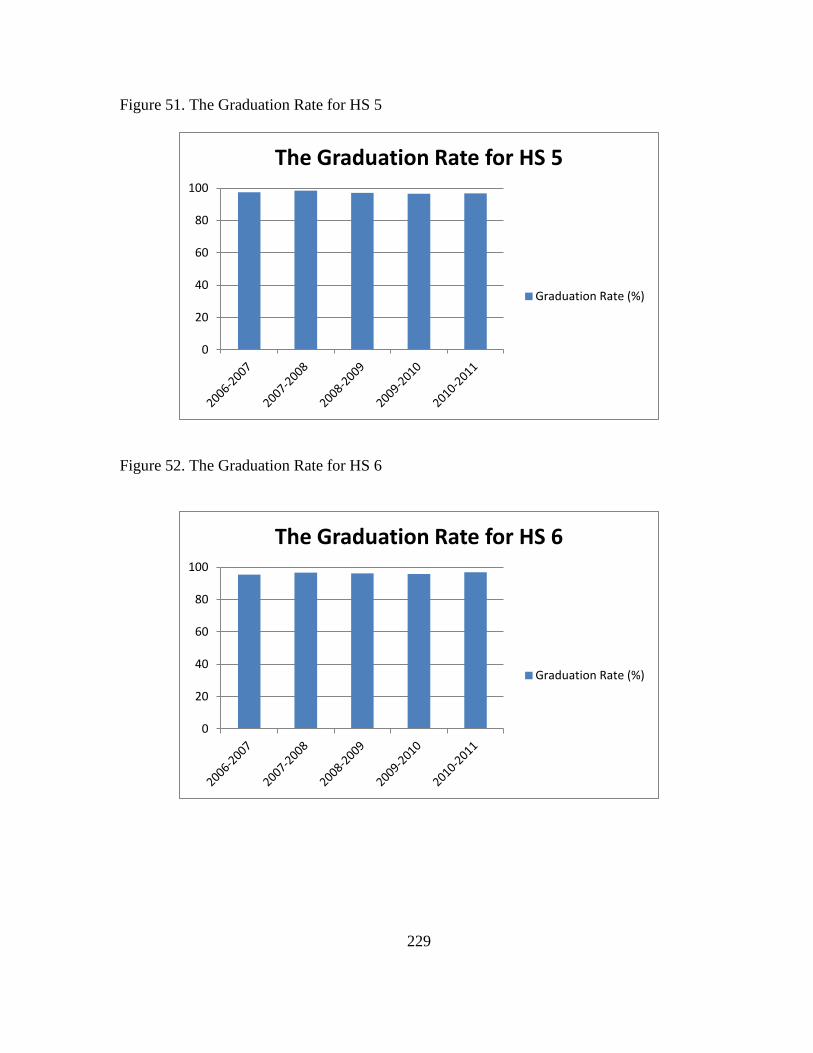
229
Figure 51. The Graduation Rate for HS 5
Figure 52. The Graduation Rate for HS 6
0
20
40
60
80
100
The Graduation Rate for HS 5
Graduation Rate (%)
0
20
40
60
80
100
The Graduation Rate for HS 6
Graduation Rate (%)
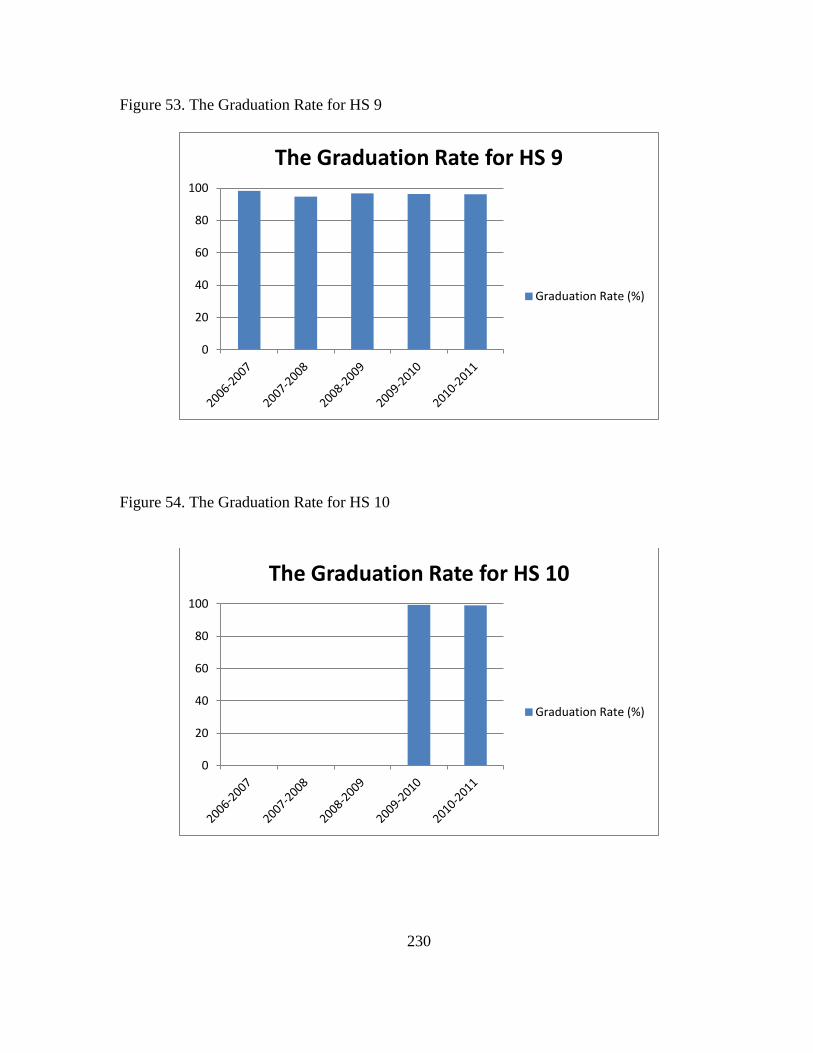
230
Figure 53. The Graduation Rate for HS 9
Figure 54. The Graduation Rate for HS 10
0
20
40
60
80
100
The Graduation Rate for HS 9
Graduation Rate (%)
0
20
40
60
80
100
The Graduation Rate for HS 10
Graduation Rate (%)