Embed Size (px)
Citation preview
ANALYSIS OF PCBs IN WATER USING HIGH RESOLUTION GASCHROMATOGRAPHY/HIGH RESOLUTION MASS SPECTROMETRY
Jakal M. Amin (Under direction of J. Ronald Hass, Ph.D.)
Polychlorinated biphenyls (PCBs) in water samples aregenerally analyzed by high resolution gas chromatography/lowresolution mass spectrometry (HRGC/LRMS) or high resolutiongas chromatography with electron capture detection (HRGC/ECD).The detection limits reported using these techniques are onthe order of 50-500 parts per trillion (ppt) per sample forthe Mono-Deca PCBs (HRGC/LRMS).
High resolution gas chromatography/high resolution massspectrometry (HRGC/HRMS) is routinely used for the analysis ofpolychlorinated dibenzodioxins and dibenzofurans (PCDDs/PCDFs)in water samples, with detection limits as low as 10 parts perquadrillion (ppq). This HRGC/HRMS technique has been utilizedfor the analysis of PCBs in water/wastewater samples and theresults indicate that the detection limits of these speciesare at least two orders of magnitude lower (100 ppq range)than achieved using the low resolution mass spectrometrictechnique. Using this technique, PCBs are reported as totalsfor each isomer group as well as isomer specific analysis foreleven isomers, seven of which are quantified by isotopedilution mass spectrometry. The technique was validated usingblank reagent water samples and then it was applied to measurePCBs concentration in samples collected from a river.
TABLE OF CONTENTS
LIST OF TABLES................... XV
LIST OF FIGURES................... viLIST OF ABBREVIATIONS................ vii
Chapter £aae
I. Literature Review .............. 1
A. Introduction .............. 1
B. Chemical, Environmental, and
Biological Properties .......... 4C. Environmental Occurrence ........ 7
D. Toxicological Effects.......... 8
II. Method Development.............. 14
A. Introduction.............. 14
B. The Isotope Dilution Technique ..... 17C. Objectives of Proposed Method ...... 18
III. Experimental Section............. 22
A. Materials................ 22
B. Solutions................ 22
C. Water Sample Extraction Procedure .... 27D. Water Sample Cleanup Procedure ..... 27E. Cape Fear River Water Samples...... 30F. GC/MS Analytical Conditions ....... 32G. Quality Control Criteria and Calculations 41H. Analyte Identification Criteria ..... 42I. Analyte Relative Response Factor .... 43J. Initial Calibration Mean RRF...... 44
K. Continuing Calibration Delta RRF .... 44L. Analyte Concentration .......... 45M. Detection Limit ............. 46
11

IV. Results and Discussion........... 52
A. Calibration............... 52
B. Results of Method Performance ...... 55
C. Cape Fear River Water Samples...... 63D. The Contribution Problem........ 70
E. Conclusion............... 78
F. Recommendation for Further Analysis ... 80
iix

ACKNOWT.EDGEMENT
I wish to thank all the employees (past and present) ofTriangle Laboratories,Inc. of R.T.P. for assisting me throughthe development of the method. I would especially like tothank Carol Ritsher for giving me a spare space to do theextraction of samples whenever I needed to in a short amountof time. I would also like to thank Dave Minser, Vijay
Chhabra, and Dave Barrow for assisting me in analyzing the
samples. I would also like to thank Ed Marti, Dean Marbury,Don Harvan, Yves Tondeur, Mick Chu, and Ron Hass for providing
the guidance I needed in developing the method. I would also
like to thank Jim Jersey assisting me in reviewing the Thesis.Finally, I would like to thank my father, Manhar R. Amin, andmother, Vanlila M. Amin, for supporting me through the goodand bad times while I attended the Graduate School.
IV

LIST OF ABBREVIATIONS
ACS American Chemical Society
CIL Cambridge Isotope Laboratories
CONCAL Continuing Calibration
DL Detection Limit
EMPC Estimated Maximum Possible Concentration
eV Electron Volts
GC/ECD Gas Chromatography/Electron Capture Detector
GC/FID Gas Chromatography/Flame Ionization Detector
GC/MS Gas Chromatography/Mass Spectrometry
GC/TCD Gas Chromatography/Thermal Conductivity Detector
HPLC High Performance Liquid Chromatography
HRGC/HRMS High Resolution Gas Chromatography/High ResolutionMass Spectrometry
ICAL
K-D
LCD
LOQ
mA
Initial Calibration
Kuderna-Danish
Limit of Detection
Limit of Quantitation
milli-Ampere
Vll
"T^^SK^^-. ^Bffr^*'jg?-'g;>'^^.gjiaw';i;ftg^^j!jfe!H..a«g^
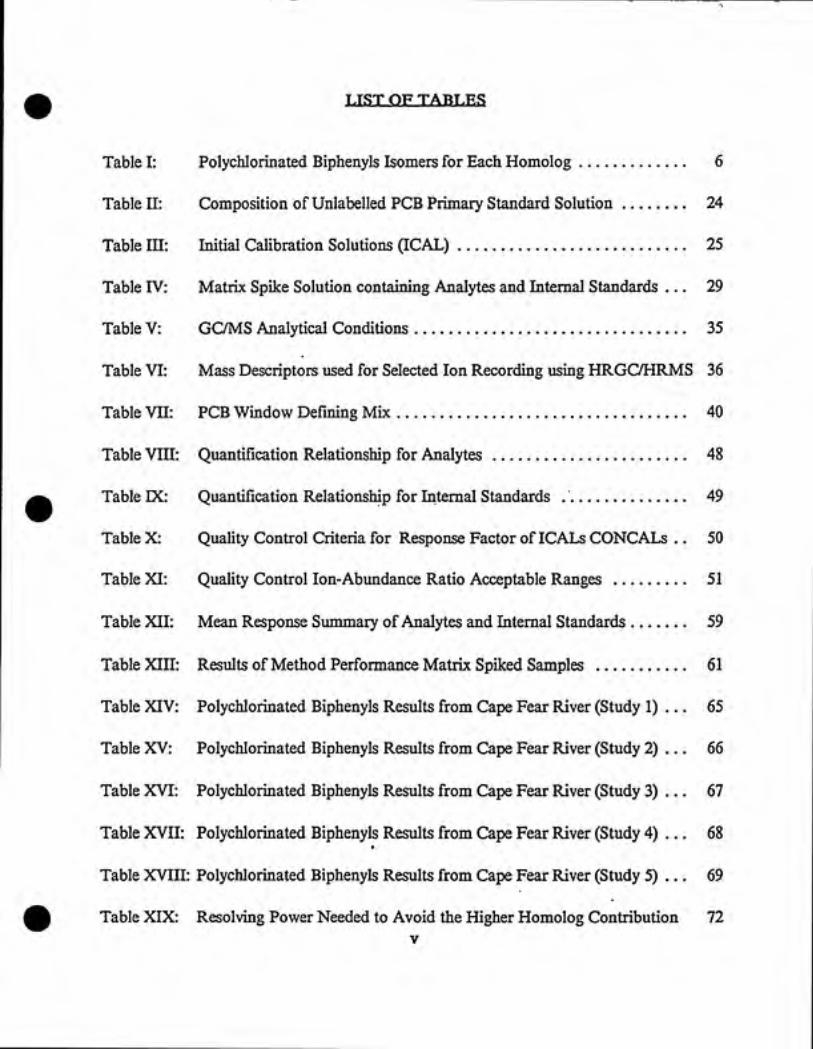
T JST OF TABT.RS
Table I: Polychlorinated Biphenyls Isomers for Each Homolog............. 6
Table II: Composition of Unlabelled PCB Primary Standard Solution........ 24
Table III: Initial Calibration Solutions (ICAL)........................... 25
Table IV: Matrix Spike Solution containing Analytes and Internal Standards ... 29
Table V: GC/MS Analytical Conditions................................ 35
Table VI: Mass Descriptors used for Selected Ion Recording using HRGC/HRMS 36
Table VII: PCB Window Defining Mix.................................. 40
Table VIII: Quantification Relationship for Analytes....................... 48
Table IX: Quantification Relationship for Internal Standards............... 49
Table X: Quality Control Criteria for Response Factor of ICALs CONCALs . . 50
Table XI: Quality Control Ion-Abundance Ratio Acceptable Ranges ......... 51
Table XII: Mean Response Summary of Analytes and Internal Standards....... 59
Table XIII: Results of Method Performance Matrix Spiked Samples ........... 61
Table XIV: Polychlorinated Biphenyls Results from Cape Fear River (Study 1) ... 65
Table XV: Polychlorinated Biphenyls Results from Cape Fear River (Study 2) .. . 66
Table XVI: Polychlorinated Biphenyls Results from Cape Fear River (Study 3) ... 67
Table XVII: Polychlorinated Biphenyls Results from Cape Fear River (Study 4) ... 68
Table XVIII: Polychlorinated Biphenyls Results from Cape Fear River (Study 5) ... 69
Table XIX: Resolving Power Needed to Avoid the Higher Homolog Contribution 72V

Table XX: M-1 and M-2 Masses for each Homolog........................ 74
Table XXI: Polychlorinated Biphenyls Analysis of Aroclor 1232............... 75
Table XXII: Polychlorinated Biphenyls Analysis of Aroclor 1254............... 76
Table XXIII: Polychlorinated Biphenyls Analysis of Aroclor 1248............... 77
VI
MDL Method Detection Limit
MFO Mixed-Function Oxidase
PCBs Polychlorinated Biphenyls
PCDDs Polychlorinated Dibenzodioxins
PCDFs Polychlorinated Dibenzofurans
PFK Perfluorokerosene
PFTBA Perfluorotributyl amine
QC Quality Control
RRF Relative Response Factor
RPD Relative Percent Deviation
RSD Relative Standard Deviation
RTCHK Retention Window Check
SD Standard Deviation
SIR Selected Ion Recording
TLC Thin Layered Chromatography
TSCA Toxic Substances Control Act
USEPA United States Protection Agency
vxii
LIST OF FIGURES
Figure I: Air Sample Analyzed by LRGC/LRMS ... 20
Figure II: Air Sample Analyzed by HRGC/HRMS ... 21
Figure III: Water Sample Sites in Cape Fear River 31
IX
I. Literature Review
A. Introduction:
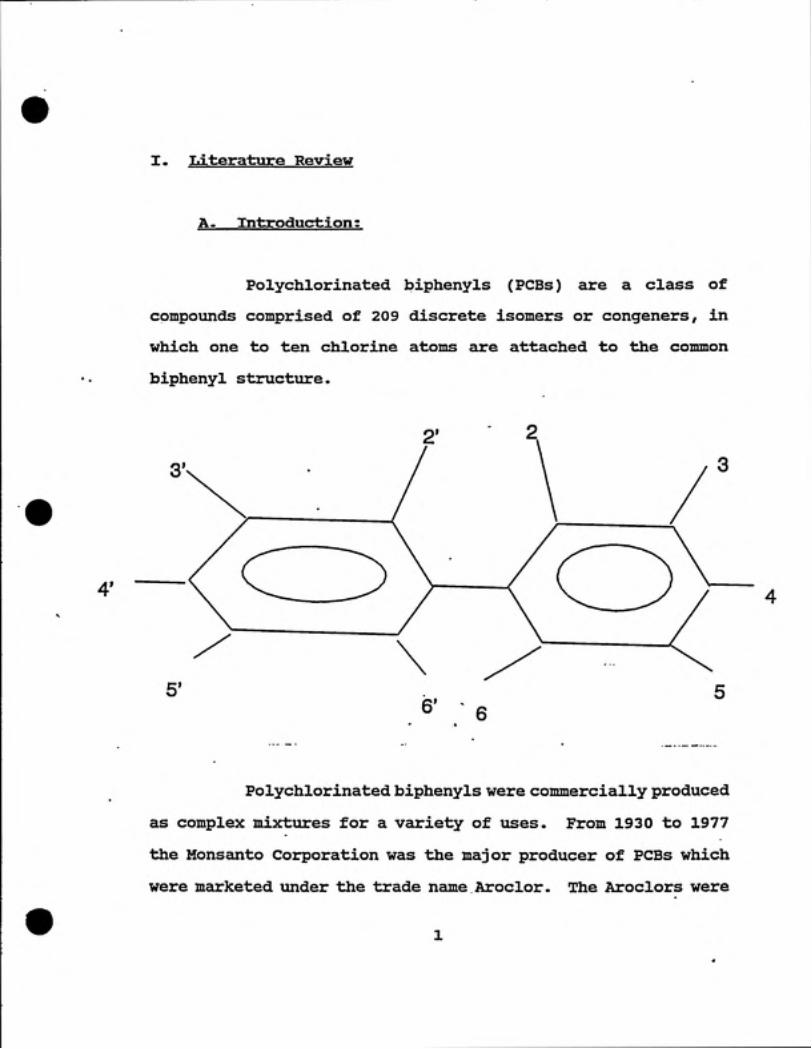
Polychlorinated biphenyls (PCBs) are a class of
compounds comprised of 209 discrete isomers or congeners, in
which one to ten chlorine atoms are attached to the common
biphenyl structure.
4'
Polychlorinated biphenyls were commercially produced
as complex mixtures for a variety of uses. From 1930 to 1977
the Monsanto Corporation was the major producer of PCBs which
were marketed under the trade name Aroclor. The Aroclors were
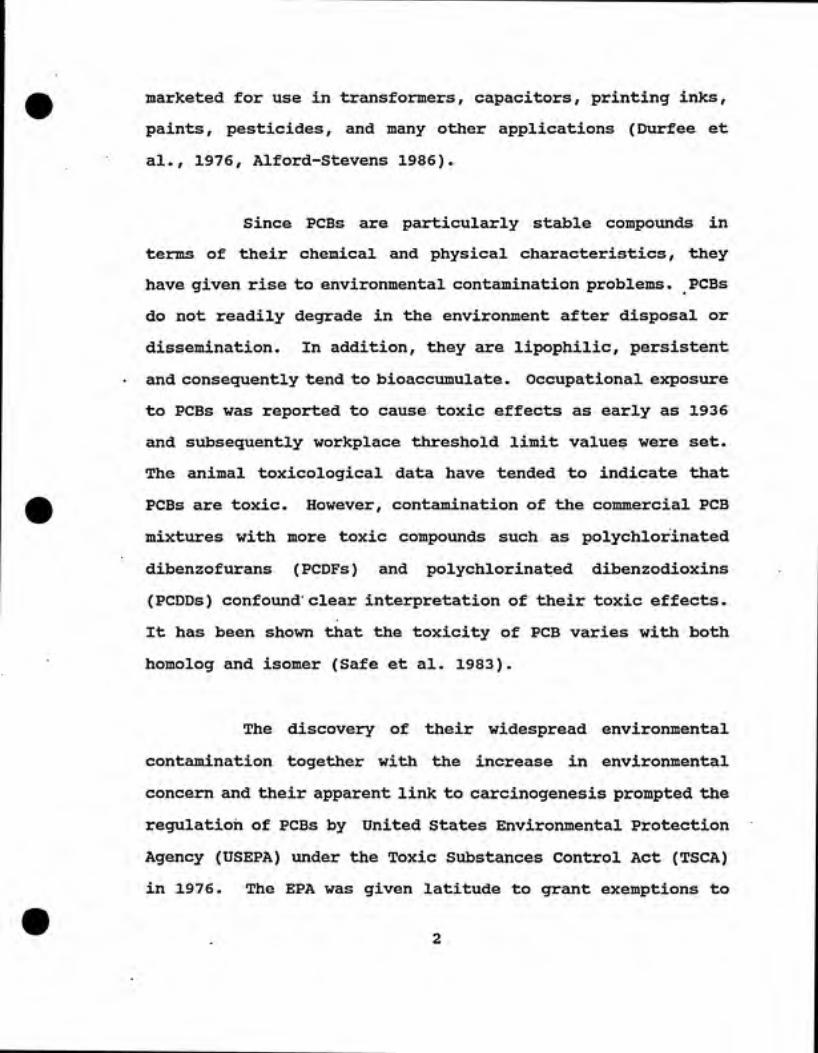
marketed for use in transformers, capacitors, printing inks,
paints, pesticides, and many other applications (Durfee et
al., 1976, Alford-Stevens 1986).
Since PCBs are particularly stable compounds in
terms of their chemical and physical characteristics, they
have given rise to environmental contamination problems. PCBs
do not readily degrade in the environment after disposal or
dissemination. In addition, they are lipophilic, persistent
and consequently tend to bioaccumulate. Occupational exposure
to PCBs was reported to cause toxic effects as early as 1936
and subsequently workplace threshold limit values were set.
The animal toxicological data have tended to indicate that
PCBs are toxic. However, contamination of the commercial PCB
mixtures with more toxic compounds such as polychlorinated
dibenzofurans (PCDFs) and polychlorinated dibenzodioxins
(PCDDs) confound clear interpretation of their toxic effects.
It has been shown that the toxicity of PCB varies with both
homolog and isomer (Safe et al. 1983).
The discovery of their widespread environmental
contamination together with the increase in environmental
concern and their apparent link to carcinogenesis prompted the
regulation of PCBs by United States Environmental Protection
Agency (USEPA) under the Toxic Substances Control Act (TSCA)
in 1976. The EPA was given latitude to grant exemptions to
the ban under TSCA if the manufacture, processing, and
commercial distribution were enclosed or if it did not
present an unreasonable risk of injury to human or the
environment. The USEPA has subsequently promulgated a series
of rules with respect to PCBs under various guidelines of
TSCA.
The disposal of PCBs has been a major concern since
the imposed restriction upon PCBs use in the United States and
other countries. Large quantities of PCBs-containing products
such as transformer oils and capacitors are being removed from
service and they must be disposed of properly. In 1979, USEPA
set disposal guidelines that were dependent on the
concentration and matrix in which the PCBs existed. For
example, if the PCBs concentration was 500 ppm or greater,
disposal in a high efficiency incinerator was stipulated
(Erickson, 1989). If the concentration of PCBs was found to be
between 50 and 500 ppm and they were in a liquid matrix such
as a mineral oil dielectric fluid, then incinerators,
landfills, or high efficiency boilers were allowed to be used
for disposal. Alternate methods of disposal were also allowed
if they were shown to be equivalent.
•jW«*i;',^jy5a!a.^jJ^p^iJiJl-WMfty" Wjllg^jln?jWag5BJS"''^^
B. Chemical. Environmental. and Biological Properties i
PCB Nomenclature
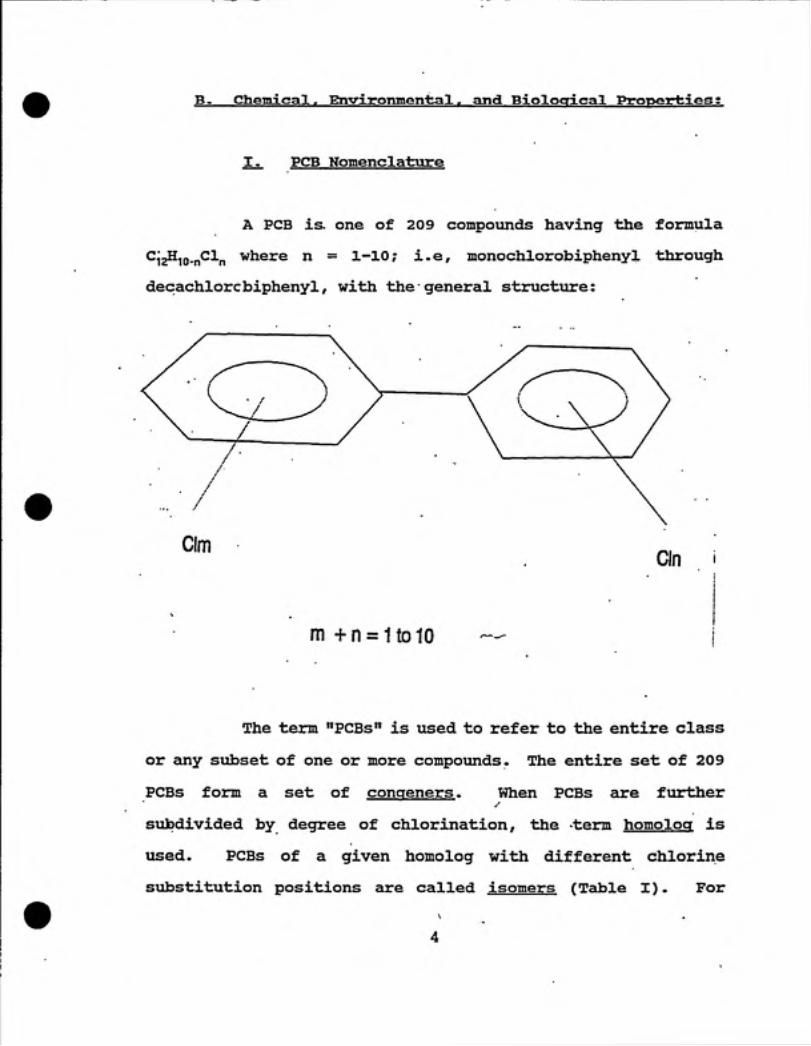
A PCB is. one of 209 compounds having the formula
monochlorobiphenyl through
decachlorc biphenyl, with the general structxire:
^ia^io-n^-'-n where n = 1-10; i.e
CImCIn
m +n = 1to10
The term "PCBs" is used to refer to the entire class
or any subset of one or more compounds. The entire set of 209
PCBs form a set of congeners. When PCBs are further
subdivided by degree of chlorination, the term homolog is
used. PCBs of a given homo log with different chlorine
substitution positions are called isomers (Table 1). For
example, 2,3,4-trichlorobiphenyl and 3,3',5-trichlorobiphenyl
are two of the twelve possible trichlorobiphenyl isomers.

PART.p; T; POLYCHLORTNATED ISOMTgPS FOR EACH HOMOLOG
Homo log _____Molecular Formula No. of Isomers
Monochlrobiphenyls C,2H9C1 3Dichlorobiphenyls C^gHgClj 12Trichlorobiphenyls C^jH^Clj 24Tetrachlorobiphenyls C^jH^Cl^ 42Pentachlorobiphenyls C^gHjClg 46Hexachlorobiphenyls C^2H4Clg 42Heptachlorobiphenyls C^j^sCl^ 24Octachlorobiphenyls C^^H^'^^a ^^Nonachlorobiphenyls C^j^Cl, 3Decachlorobiphenyl C^jCI^q 1
Total 209

C. Environmental Occturrence
Polychlorinated biphenyls may be consideredubiquitous pollutants. They have been found in nearly allplant and animal species including fish, mammals, birds, birdeggs, and humans. The environmental transport of PCBs iscomplex and global. Polychlorinated biphenyls are transportedby air, water, fish, birds, and other routes. They aredeposited from air by rain, snow, dry fall-out, and vapor-deposition. Since . PCBs have high lipid-water partitionratios, they tend to accumulate in fatty tissues and thusbiomagnify in the food chain. The long-term distribution inadipose tissue is adipose > skin > liver > muscle > blood(Safe, 1980).
PCBs are very stable compounds; however, undercertain conditions, they may be destroyed by chemical,thermal, and biochemical processes. The degradation processesusually require high temperatures or catalysis. Environmentaland metabolic degradation generally proceed quite slowlyrelative to degradation of most other compounds. Theirdestruction has generally been limited to incineration,although some chemical degradation processes such asdechlorination with metallic sodixom are permitted in theUnited States and other coiintries. Several nonthermalprocesses for PCBs destruction are being used, investigated.
and developed. The chemical techniques include adsorption,
catalytic de-hydrochlorination, ozonation, photolytic
degradation, wet air oxidation (Ackerman, et al., 1981).
In the environment, photolysis is the only
significant chemical degradation process (Hutzinger et al.,
1972). The half-lives for atmospheric photodegradation are
dependent upon the degree of chlorination. The half-lives of
the monochlobiphenyls range from 0.62 to 1.4 days, while
pentachlorobiphenyls have a half life of 67 days (Billing et
al., 1983). The microbial degradation of PCBs depends upon
the degree of chlorination and the position of the chlorine
atom on the biphenyl molecule. Lower chlorinated homologs are
readily transformed by bacteria, but the higher chlorinated
homologs are not (Moolenaar, 1983). Ortho substitution
generally decreases the rate of their degradation by microbes.
The major by-products of microbial degradation of PCBs are
conjugated and/or free hydroxychlorobiphenyls (Messier et.
al., 1983). Furiikawa et al. (1978) found that PCBs with a
nonchlorinated ring degraded faster, with preferential fission
of the unsubstituted benzene rings.
D. Toxicoloqical Effects
The PCB congeners that bioaccximulate have five to
8

seven chlorine atoms per molecule. These chlorinated isomer
groups (penta-, hexa-, and hepta-chlorinated biphenyls)
contain 112 of the 209 possible PCB configurations. They were
synthesized in high proportions in many Aroclor formulations
and thus are likely to be prevalent in environmental matrices
(Alford-Stevens, 1986, Hutzinger, et al., 1974). The
chlorinated isomer groups also contain most of the mixed
function oxidase (MFO)-inducing congeners. The more highly
chlorinated congeners are generally less bioavailable because
they are more tightly bound to .soils and sediments and because
they usually are present in lower quantities in the
environment. Congeners with less chlorination are more
readily metabolized and eliminated and consequently tend to
bio-accumulate less (Goldstein, et al., 1977); Safe, et al.,
1982; Bush, et al., 1985).
PCBs are not acutely toxic to aquatic bio-organisms
in the natural environment. The USEPA water quality criteria
docviment for PCBs noted that problems possibly could exist
with the validity of acute toxicity tests because of the low
solubility of PCBs in water and because the solubilities of
PCBs are less than their acute toxicities (USEPA, 1980). The
toxic potency of individual congeners vary by as much as six
orders of magnitude (Storm, J. E.; et al. 1981). Experiments
which involved exposing saturated aqueous solutions of pure
individual PCB congeners to Daphnia maana and Artemia salina
for 48 to 96 hrs. resulted in no mortalities that were
attributable to PCB toxicity (McFarland, et al. 1989). These
results are consistent with the work of other researchers who
found that water solubility was the primary determinant of
acute toxicity of a series of hydrocarbons and
chlorohydrocarbons to Daphnia macma and Artemia salina
(Abernethy, et al. 1986). The researchers also noted that
since there is a trend for larger molecules to be less soliible
in octanol. They also may be less soluble in the lipids of
organisms. Such large molecules (e.g. PCBs) may conseguently
partition less readily into sites of toxic action within
cells. Kinetic factors also influence acute toxicity, and
larger molecules may take longer to establish concentrations
necessary to produce toxic manifestations due to their lower
diffusivity in water and lipid phases (Abernethy, et al.
1986).
Toxic effects of aquatic environmental PCB
contamination appear most likely to be sublethal and chronic.
Physiological fxonctions that are controlled by steroid
hormones may be altered by exposure of organisms to PCBs
(Matthews, et al. 1978; Fries, et al. 1984). The primary
functions which are affected are growth, molting, and
reproduction. The ability of organisms to eliminate foreign
organic compounds or endogenous waste products also may
affected. Steroid biosynthesis and the degradation and
10

biotransformation of foreign compounds are metabolicactivities in both fish and higher vertebrates that arestrongly influenced by terminal oxidase activities of themicrosomal cytochrome P-450 systems (referred to also asmixed-function oxidase (MFO) systems). Some, although notall, PCB congeners are MFO inducers in fish, mammals, andbirds, and to a lesser extent in aquatic invertebrates(McFarland, et al. 1989).
The potency and specificity of MFO induction by
individual PCB congeners can be directly related to howclosely they approach the molecular spatial configuration anddistribution of forces of 2,3,7,8-tetrachlorodibenzo-p-dioxin(2,3,7,8-TCDD). Isomers that are similar in structure are thenon-, mono-, and some di-ortho-substituted PCBs (Williams, L.L., et al. 1992). 2,3,7,8-TCDD is generally considered to bethe most potent synthetic environmental toxicant and thus isregarded as a standard for comparison for other organictoxicants that are more or less isoteric, including some ofthe PCBs (Kociba, et al. 1985; Safe, et al. 1985; Safe, et al.1987). Dioxins are chlorinated aromatic molecules that forma planar volvime in the form of a box or rectangle occupyingabout 3 by 10 Angstrom (McKinney, et al. 1981). The cytosolicreceptor that binds 2,3,7,8-TCDD or its isosteres to the Ahreceptor is facilitated by coplanarity of the phenyl ringswithin the 3 by 10 Angstrom dimensions. Other factors such as
11
the polarizability of the lateral chlorines may be important
in determining the strength of binding to the receptor (Albro,
et al. 1981). Translocation of the inducer-receptor complex
to the nuclear Ah locus is thought to initiate the synthesis
of AHH, EROD, and related enzymes that may be involved in
either biotransformation, conjugation and removal, or the
bioactivation of certain planar lipophilic foreign compounds
to toxic intermediates (Nebert, et al. 1979; Safe, et al.
1983; Roberts, et al. 1985).
The most toxicologically active PCB congeners are
those having chlorine svibstitution at the para (4 and 4') and
at least two meta (3,3',5 and 5') positions on the biphenyl
rings, but no ortho (2,2',6 and 6') siobstitutions (Safe, et
al. 1985). Since the phenyl rings of a biphenyl nucleus are
linked by a single carbon-carbon bond, the two rings have
relatively unconstrained rotational freedom. Unlike dioxins
or dibenzof urans, the phenyl rings of PCBs are not rigidly
bound in the same plane. X-ray crystallographic analyses
indicate that the preferred conformation for all PCBs,
including those without ortho-substituents, is noncoplanar
(McKinney, et al. 1981). The proportion of molecules of a
particular congener assuming a coplanar configuration becomes
increasingly small as the energetic cost of conforming
increases (McKinney, et al. 1981). Since chlorines are bulky
atoms, the svibstitution of a chlorine at certain positions on
12
the biphenyl rings inflicts constraints on rotational freedom.
The greatest effect is exerted by substitution of at least two
opposing ortho-substituted chlorines on opposite rings.
Increasing the number of chlorine ate tis at the ortho positions
increases steric hindrance to rotation (Lau S. et al. 1981;
Boon, J. P. et al. 1987).
PCBs have been shown to cause reproductive toxicity,
birth defects, and behavioral changes in aquarian animals
(Levin, E. D., et al. 1988; Tilson, H. A., et al. 1979) and
they have also been associated with low birth weights and
learning and behavioral deficits in children of women who
consumed large (>50 meals/yr. 100-g meals) quantities of fish
from the Great Lakes (Williams, L. L. et al. 1992). The toxic
potencies of PCB mixtures are dependent upon the relative
concentrations of individual congeners. It has been shown
that the most potent PCB congeners are also some of the
congeners most resistent to degradation and metabolism
(Tanabe, S. et al. 1987). As a result, there has been concern
that risk assessments based on total concentrations of PCBs
are inaccurate because measurement of total concentrations of
PCBs may not reflect the potency of the PCB mixture to cause
toxic effects (Williams, L. L. et al. 1992).
13
II. Method Development:
A. Introduction:
Over the past twenty years, environmental analysis
has grown tremendously due to technical advances made in the
instrumental analysis. The major techniques which are used to
determine the amoiint of pollutants present in the environment
are GC/ECD (Gas chromatography/electron capture detector),
GC/FID (Gas Chromatography/Flame Ionization detector), HPLC
(High Performance Liquid Chromatography, and TLC (Thin Layer
Chromatogrpahy) and GC/MS (Gas Chromatography/Mass
Spectrometry). Two methods by which the environmental
analysis are performed in GC/MS are the full scan analysis and
the SIR (Selected Ion Recording). The full scan analyses are
primary used in GC/MS with quandrupoles. Since many USEPA
methods require analysis of many compounds in a single GC/MS
run, full scan analyses offer the most quick and the cost
effective way of analyzing environmental polluntants. Another
way in which the environmental compounds are being determined
is the SIR. SIR analysis involves the analysis of compounds
with known molecular weights. It is more sensitive than the
full scan +analysis due to its high selectivity. Depending on
the selectivity and sensitivity requirements one can use
14

ii*9t^L\tsr.r;rrif^iM!atl^imiSfim^ »i»llMilHjSJ.J .f!B^
either full scan or SIR analyes.
There are basically seven factors which have to be
considered where the analysis of PCB is concerned: 1) limit
of detection required, 2) anticipated number, level, and type
of interferences, 3) resolution needed 4) qualitative
discrimination power, 5) quantitative accuracy and precision,
6) availability of instrumentation, and 7) analysis time and
cost (Erickson, 1986). There is no technique that best
satisfies the above criteria. The extraction, cleanup, and
determination technique are all interrelated and must be
considered in the development of the method. The qualitative
discrimination power of a detector plays a major role in
selection of the measurement technique. For example, if the
concentrations of PCBs are high enough and the interferences
are minimal, a low resolution detector such as GC/FID or
GC/TCD (Gas Chromatography/Thermal Conductivity Detector) may
be appropriate. If additional discrimination power is
required and there are few non-electron capturing compounds in
the matrix, then GC/ECD may be appropriate. In all of these
cases above, PCB mixtures are identified by pattern
recognition. When visual pattern recognition cannot be used
and the interferences are too complex or when higher
15
qualitative confidence is required a more discriminatingtechnique such as HRGC/HRMS (High Resolution GasChromatography/High Resolution Mass Spectrometry) must beemployed.
Today one of the most widely used instrument for the
analysis of pollutants in the environment is GC/MS. There arebasically two types of GC/MS instrumentation available:Quadrupole and the Magnetic Sector. GC coupled withquadrupole mass spectrometry is the most widely usedinstrument for environmental analysis due to its low operatingcosts and the ease of its use. Over the past ten years,HRGC/HRMS has started to play a major role in theenvironmental industry due to increasing demands for the highsensitivity and selectivity it can provide. The USEPA hasimplemented many low resolution methods such as Method 680,Method 8080, Method 608, etc. for the analysis of PCBs. Asdiscussed above, depending on the type of matrix and theinterferences present, different methods may have to be usedto determine the concentration of PCBs in a given matrix.Another problem is that quantification of PCB analytes in aparticular matrix is done using compounds which are not PCBs(Alford-Stevens, et al. 1985; Hernandez, et al. 1987). For
example Method 680 involves the use of chrysene-d^j ornapthalene-dg as the internal standard in order to quantifytotal PCBs concentration. Since chrysene-d^g ^^^ napthalene-dg
16

and PCBs are not similar compounds, the extraction and thecleanup procedures do not affect the PCBs and the internalstandards in a similar manner. As a result, data may beskewed in quantifying the analytes depending on whether theinternal standards were affected in the same manner as theanalyte during the extraction and the cleanup procedures.
B. The Isotope Dilution Technique;
Over the past 20 years, the technique of isotopedilution has revolutionized environmental analyses. Thegrowth of environmental analyses has been partially due to theincreasing availability of compounds labeled with stableisotopes and the advances in instrumentation for isotope ratiomeasurement (Pickup, J. et al. 1976). Although the generalprinciples of the isotope dilution technique are generallyagreed upon (Colby, et al. 1979), there is basically noguidance available to the analyst on the theory behind stableisotope dilution assays when applied to organic analysis(Schoeller, D. A. (1976); Matthews, D. E. et al. (1976);Colby, et al. 1981). Pickup and McPherson explained thefundamental theory of isotope dilution mass spectrometry inorganic analysis using the binomial probability theory toevaluate the effect of changing isotopic abiindance on the massspectra of individual ions (Pickup et al. 1976).
17

stable isotope dilution analysis can be viewed as a
special case of internal standardization in which the internalstandards mimic the target analyte behavior as closely aspossible. In the isotope dilution technique, the onlydifference between the analyte and the internal standard is asmall difference in the molecular mass. The analyte andinternal standards are thus chemically and physicallyequivalent, an ideal situation from an analytical standpoint.Processes and factors affecting the analyte similarly affectthe internal, standards. As a result, the "internalstandard/analyte ratio" is an isotope ratio that must bemeasured by mass spectrometry. The technique involvesperturbing the normal isotopic composition of the sample byadding a known quantity of an isotopically enriched analog ofthe material being determined. The assumption is made thatextraction technigue and the GC/MS analysis will affect theanalyte and the internal standard in a similar manner. Theisotopically labelled compounds serve to correct thevariability in the method which may be caused by failures ofthe internal standards to exactly mimic analyte behavior(USEPA 1985, Erickson, M. D., et al. 1988).
C; Objectives of the Protxased Method
As discussed above, the low resolution GC/MS methods
are cost effective but they are not highly selective and
18

sensitive. On page 20, there is an illustration of
tetrachloro PCBs channel of an air sample which was analyzed
by HRGC/LRMS (Trio-1) (Figure I). The sample was analyzed by
SIR at a approximate resolution of 1,000. On page 21, Figure
II shows the same sample that was analyzed by HRGC/HRMS at
resolving power of 10,000. From two figures it can be
oberseved that Figure I show very few detected peaks of
tetrachloro PCBs. On the other hand. Figure II shows many
peaks which were detected as tetrachloro PCBs. The figures
illustrate that bias (false negatives) in the results can
occur depending on what kind of method is being used to
analyze the environmental saamples. As a result, development
of a new method of analysis of selected toxic PCBs in water
using the HRGC/HRMS has been designed to quantify PCBs with
high sensitivity and selectivity using isotope dilution
technique. The method has been designed to accurately
quantify specific PCBs in water to parts per quadrillion (ppq)
levels with high precision and accuracy and to determine thetotal concentration of PCBs without bias.
19

FIGDRE I. AIR SJ^MPLE ANALYZED BY LRGC/URMS
17-NOM-92 19:49 Triangle Laboratories of RIP, l«c.<^,^y^^ . MM.q-2 22055ftGK83a Tetra CI PCB
(919) 544-5729Instruwent G
26.12- 75584
lee-i
i>!FSi
24.15 24
21.31
867fi822,96
IBBi
22,31
21.66
nn "•" °^ ^^-^
20

HfflBtJi^^i^§aiE.8^Hsi''^^saJX-Bse.
Pile:J{g2iaai #l-8fi7 Acq: 5-N6V-19g2 22:17:32 (SC El+ Voltage SIR AutoSpec---------------289.9224 F:2 Exp:CO-PCB
San^letl Text:MM5-2 TLI# 22055A File Text:TRIANGLE LABORATORIES,INC. OF RTP::DB5100^ 25 0890J80.
70.
60J50J40j30j20J
10.
0.rrr. -r I I I I I I
19:001 1 I I I I20:00
] -i I' [' I t
21:00
26:2424:45
23:52 25:48
17:00 18:00
File:X921881 #1-867 Acq: 5-NOV-1992 22:17:32 GC EI+ Voltage SIR AutoSpec291.9194 F:2 Exp:CO-PCB
San5>le#l Text:MM5-2 TLI# 22055A File Text:TRIANGLE LABORATORIES,INC. OF RTF:100 25 0890Jaoi
70.
S0450.
40J
30J20J
lOj0
27:40
iiI I 1 I I I ! I I I 1 i "^ ''Oi 1^1 I / Vi'' 1^ I r i')"^ T 'i ^ I ? r r I" H"i'Ti22:00 23:00 24:00 25:00 26:00 27:00 28:00
.1.3E6
.1.1E6
.1.0E6
.8. 8E5
;DB5
i 1 I I I -I 'i I r I I I17:00 18:00 19:00
I'll'20:00
23:52 24:4£26:25
21:00 22:00 23:00 24:00
25:47
25;Oo"6:00 1 i 9 1' I27:00
27:41
ii28:00
6ES
3E5
0E5
8E5
5ES
3E5
O.OEOTIME
.1.6E6
.1.4E6
.1.3E6
.1.1E6
.9.6E5
.8.0ES
.6.4E5
.4.8E5
.3.2E5
.1.6E5
.O.OEOTIME
21

III. Experimental Section:
A. Materials:
All compounds used in this study were the highestpurity available. Individual PCB isomers and theircorresponding carbon-labelled internal standards were obtainedfrom Cambridge Isotope Laboratories (CIL) (Woburn, MA).Reagents such as hexane, nonane, acetone, methylene chloride,sulfuric acid, potassium hydroxide, and HPLC graded water wereobtained from Fisher Scientific (Fair Lawn, NJ).
B. Solutions:
A stock solution of analytes was prepared in nonaneat 1 ug/mL, 2 ug/mL, 3 ug/mL, and 5 ug/mL (Table II). Thesolution was then diluted to appropriate amount for particularmatrix spike study. A stock solution of carbon-labelledstandards was prepared at 1 ug/mL in nonane and appropriatedilutions were made for the matrix spike study. Aliquots ofanalyte and internal standard stock solutions were combinedand diluted in acetone to provide the desired concentrationswhen adding 100 uL of the resulting solution to 1-L water
22

KS^SP^^**!:
samples.
The initial calibration solutions were prepared at
0.5, 5.0, 10.0, 50.0, and 100.0 pg/uL from the primary stock
solution. These concentrations doubled for each Cl^ - Clj PCB
congener, tripled for each Cl^ - Clg PCB congener, and
quintupled for each CI9 - CI^q PCB congener (Table III). The
solutions 1 through 5 contained 100 pg/uL, 100 pg/uL, and 200
pg/uL each of internal standards, surrogate and alternate
standards, and recovery standards, respectively. The
alternate and surrogate standards were spiked in the extract
before the cleanup procedure and the recovery standards were
spiked in extract before GC/MS analysis.
23
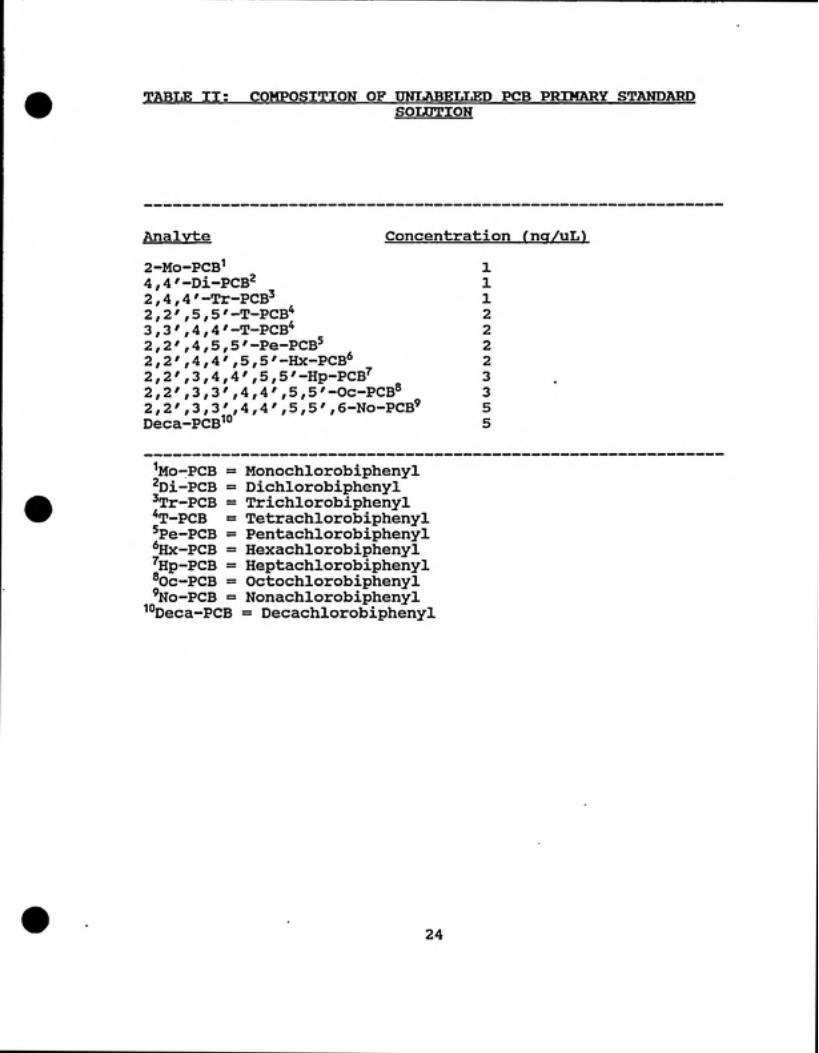
TABLE II: COMPOSITION OF UNLABELLED PCB PRIMARY STANDARDSOLOTION
Analyte Concentration fng/uL)
2-Mo-PCBi
4,4'-Di-PCB^2,4,4'-Tr-PCB^2, 2 ' , 5 , 5 ' -T-PCB"^3 , 3 ' , 4 ,4 '-T-PCB*2 , 2',4,5,5'-Pe-PCB^2,2',4,4',5,5' -Hx-PCB'^2, 2 ' , 3 ,4 ,4 ' , 5 ,5'-Hp-PCB^'2,2',3,3',4,4',5,5'-Oc-PCB^2,2',3,3',4,4',5,5',6-No-PCB'Deca-PCB^°
1
1
1
2
2
2
2
3
3
5
5
^MO-PCB =^Di-PCB =^Tr-PCB =*T-PCB =5pe-PCB =•^Hx-PCB =^Hp-PCB =^Oc-PCB ='No-PCB =Deca-PCB10
MonochlorobiphenylDichlorobiphenylTrichlorobiphenylTetrachlorobiphenylPentachlorobiphenylHexachlorobiphenylHeptachlorobiphenylOctochlorobiphenylNonachlorobiphenyl= Decachlorobiphenyl
24

TABLE III: INITIAL CALIBRATION SOLDTIONS fICAL)
Solution Number
Analvtes
2-Mo-PCB
4,4'-Di-PCB2,4,4'-Tr-PCB2 , 2',5,5'-T-PCB3 , 3',4,4'-T-PCB2,2',4,5,5'-Pe-PCB2,2',4,4',5,5'-Hx-PCB2,2',3,4,4'5,5'-Hp-PCB2,2',3,3',4,4',5,5'-Oc-PCB2,2',3,3',4,4',5,5',6-No-PCBDeca-PCB
(pg/uL)
0.5 5 10 50 100
0.5 5 10 50 100
0.5 5 10 50 100
1.0 10 20 100 200
1.0 10 20 100 200
1.0 10 20 100 200
1.0 10 20 . 100 200
1.5 15 30 150 300
1.5 15 30 150 300
2.5 25 50 250 500
2.5 25 50 250 500
Internal Standards fCctrbon-Labeled^
4-Mo-PCB^4,4'-Di-PCB2,4,4'-Tr-PCB3,3',4,4'-T-PCB2,2',4,5,5'-Pe-PCB2,2',4,4',5,5'-Hx-PCB2,2',3,4,4',5,5'-Hp-PCB2,2',3,3',4,4',5,5'-Oc-PCB^Deca-PCB
100 100 100 100 100
100 100 100 100 100
100 100 100 100 100
100 100 100 100 100
100 100 100 100 100
100 100 100 100 100
100 100 100 100 100
100 100 100 100 100
100 100 100 100 100
Surrogate Standards (Carbon-Labeled)
3,3',5,5'-T-PCB3,3,M,4',5-Pe-PCB2,2',3,4,4',5'-Hx-PCB2,2',3,3',5,5',6,6'-Oc-PCB
100 100 100 100 100100 100 100 100 100100 100 100 100 100100 100 100 100 100
Alternate Stemdard (Cctrbon-Labeled)
2,2',3,3',4,4'-Hx-PCB 100 100 100 100 100
Recovery Standard Solution (Carbon-Labeled)
2,2',5,5'-T-PCB3,3',4,4',5,5'-Hx-PCB
200 200 200 200 200200 200 200 200 200
25

Tctble III: Continued
^The Mo-PCB Internal Standard is "c^ and not a ^^C^g-^The Oc-PCB (Carbon-Labelled) is used to compute responsefactors of unlabelled No-PCBs.
26

C. Water Sample Extraction Procediure:
To each 1-L water sample (adjusted to pH = 7.0) ina 2-L separatory funnel 100 uL, (Pipet delivery) of thematrix spike solution containing unlabeled analytes wasadded (Table IV). After spiking unlabelled PCBs, eachseparatory funnel was spiked with 100 uL of the acetonesolution containing carbon-labeled internal standards (TableIV). The sample was then shaken rigorously for two minutes,and allowed to stand for at least thirty minutes to allowequilibrium of the spiked compounds with the matrix. Each1-L fortified water sample was then extracted with threesequential 60-mL portions of methylene chloride.
After the extraction was completed, each extractwas dried by filtering through anhydrous sodium sulfateusing a glass funnel with glasswool. The extract wasconcentrated to approximately 5.0 mL using a Kuderna-Danish(K-D) apparatus. To each extract 40.0 mL of hexane wasadded and it was again concentrated to approximately 5.0 mLusing the K-D apparatus. Each extract was then stored inthe refrigerator at 4 °C until cleanup procedures wereperformed.
D. Water Sample Cleanup Procedure:
27
The final extract in hexane was transferred
(Pasteur Pipet) to a 200 mL separatory flannel. It was thenspiked with 100 uL (eppendorf) of an acetone solutioncontaining carbon-labeled surrogate and alternate standards(Table IV). The contents of the separatoiry funnel were thenrinsed with three sequential 40 mL portions of sulfuric acidand 40 mL portions of HPLC graded water. The hexane extractresidue was rinsed with 40 mL of 20% (by weight) potassiximhydroxide solution and 40 mL of HPLC graded water. Theextract was then transferred to a K-D apparatus andconcentrated to an approximately 10.0 mL voliime. Theextract was then finally transferred to 13 mL test tubes andit was blown down to 100 uL before GC/MS analysis.
28
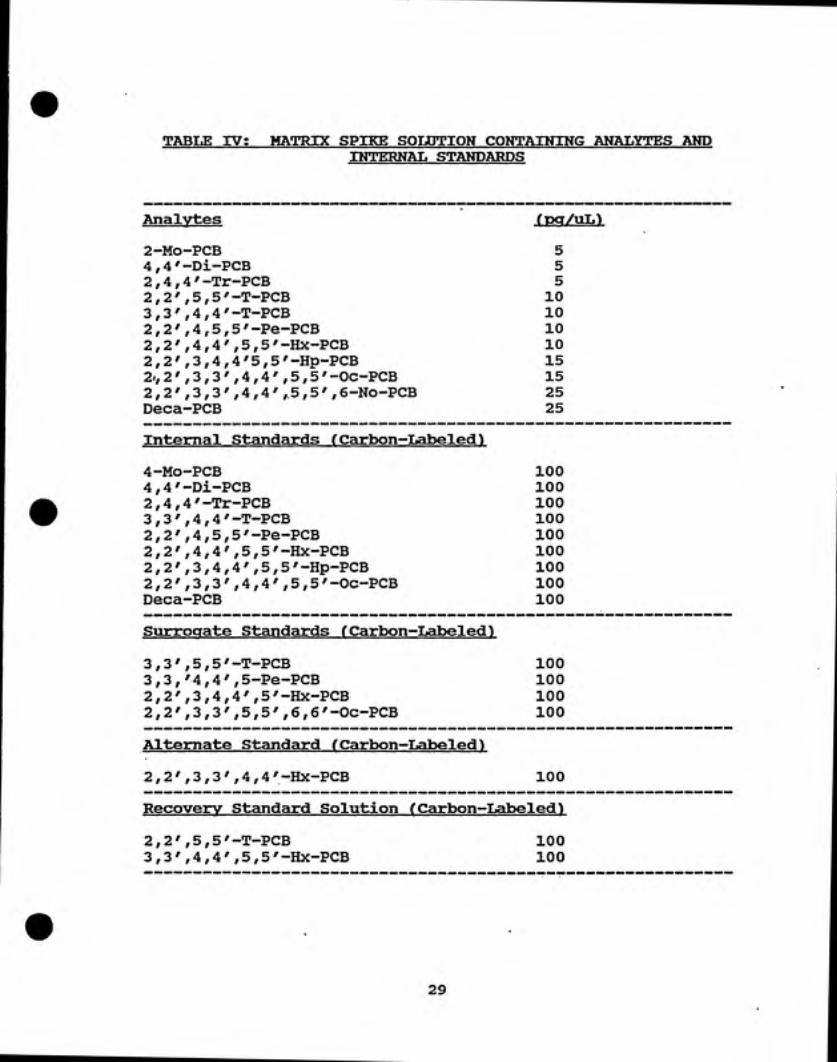
TABLE IV: MATRIX SPIKE SOLDTION CONTAINING ANALYTES ANDINTERNAL STANDARDS
Analvtes
2-Mo-PCB
4,4'-Di-PCB2,4,4'-Tr-PCB2,2',5,5'-T-PCB3,3',4,4'-T-PCB2,2',4,5,5'-Pe-PCB2,2',4,4',5,5'-Hx-PCB2,2',3,4,4'5,5'-Hp-PCB2,2',3,3',4,4',5,5'-Oc-PCB2,2',3,3',4,4',5,5',6-No-PCBDeca-PCB
(pq/uL)
55
510
10
10
10
15
15
25
25
Internal Standards (Carbon-Labeled)
4-Mo-PCB 1004,4'-Di-PCB 1002,4,4'-Tr-PCB 1003,3',4,4'-T-PCB 1002,2',4,5,5'-Pe-PCB 1002,2',4,4',5,5'-Hx-PCB 1002,2',3,4,4',5,5'-Hp-PCB 1002,2',3,3',4,4',5,5'-Oc-PCB 100Deca-PCB 100
Surxoqate Standards (Carbon-Labeled)
3,3',5,5'-T-PCB 1003,3,'4,4',5-Pe-PCB 1002,2',3,4,4',5'-Hx-PCB 1002,2',3,3',5,5',6,6'-Oc-PCB 100
Alternate Standcurd (Ccurbon-Labeled)
2,2',3,3',4,4'-Hx-PCB 100
Recovery Stcundctrd Solution (Czirbon-Lctbeled)2,2',5,5'-T-PCB3,3',4,4',5,5'-Hx-PCB
100100
29

E. Cape Fear River Water Sainpl (Ps ;
Cape Fear River water samples were collected froma boat dock located 20 miles North East of the city ofSanford, N.C. (See Figure I). The water grab sample wascollected by dipping a 1500 mL glass jar in the river. Twoduplicate samples were collected from each of four places(Places A, B, C, and D in Figure I). An effort was made tocollect the water samples near the wastes discharged by thepulp industry and the electrical plants located along theCape Fear river. After the samples were collected, theywere stored in the refrigerator at 4 °C for one day beforeextraction and the cleanup procedures. Prior to extraction,the glass jars were shaken vigorously for approximately twominutes to resuspend any solid before the water samples weretransferred to the separatory funnels. The pH of thesamples was then measured. The pH was adjusted to 7.0 usingsulfuric acid prior to extraction if necessary. To theseparatory fxonnel, 500 mL of the water samples weretransferred from the glass jars and the sample extractionand cleanup procedures were followed as the fortified asdescribed previously.
30

FIGURE III; WATER SAMPLE SITES IN CAPE FEAR RIVER
31

F. GC/MS ANALYTICAL CONDITIONS;
Table V illustrates the GC/MS conditions which
were used to analyze the PCB isomers. The separation of PCBisomers were accomplished with a 60 m x 0.25 i.d. fusedsilica capillary column coated with a 0.25 um film of cross-linked phenylmethylsilicone (Durabond-5, J and W Scientific,Folsom, CA). The HP 5890 Series II GC was interfaced withVG 250-S Mass Spectrometer equipped with a VAX based datasystem. Using the splitless injector, the syringecontaining 2 uL of sample was inserted manually in theinjector at temperature of 250 °C. The sample was injectedduring period of approximately 1 s after the insertion. Thesyringe was removed 10 s after the injection. The purgevent was maintained in the off position for 30 s after theinjection. The oven temperature was maintained at 100 °Cfor 2.5 min and then was raised to 150 °C at a rate of 50
"C/min and held for zero minutes. Afterwards, the
temperature was raised isothermally to 300 °C at 4 °C/minwhere it was maintained for 10 minutes.
The mass spectrometer was tuned at an electron
energy of 70.0 eV and calibrated for five SIR descriptors
(Table VI) at resolving power of 10,000 (at 5% valley) usingthe PFK (Perfluorokerosene) compoxind. After calibration,the PFK was drained from the septum reservoir and Heptacosa
32

(Perfluorotributyl amine [PFTBA]) was introduced in to the
septum reservoir. Ions from PFTBA were used as lock-massand QC (Quality Control) ions to monitor the performance ofmass spectrometer during the course of analysis (TABLE VI).
After the mass spectrometer and the GC were
checked (e.g. GC leaks or arching), a solution of RetentionWindow Check (RTCHK) (Cambridge Isotope Laboratories, MA)
[Table VII] was injected to define the GC window of each PCBisomer group. Acquisition times were adjusted if the properacquisition windows were not defined, and the RTCHK was
reinjected accordingly.
Once the GC elution of PCB isomers was defined,
five pt. ICAL solutions were (Table III) injected to
determine the response factors of PCB isomers and thus
the response of the GC/MS. Once the ICAL passed QualityControl (QC) criteria (discussed in a later section), thesample extracts were analyzed on GC/MS. A Continuing
Calibration Solution (CQNCAL) was injected every twelvehours to check the performance of GC/MS by comparing the
CONCAL and ICAL response factors. If CONCAL response
factors did not meet the QC criteria, a new ICAL was done
and the next set of samples were analyzed.
A VAX data system was used to acquire and
33

manipulate GC/MS data. Special software (dBASE IV) wasdeveloped for automated data interpretation of samples aswell as the calculation of ICAL and CONCAL response factors.The mass spectral data was integrated using the Peak Detectprogram available on the VAX data system. Using the dBASEIV software, the PCBs were automatically identified by levelof chlorination. The calculations and QC criteria used toidentified PCBs are discussed in a later section of this
report. A preliminary data report was generated for eachsample indicating the peaks that passed all initial criteriaand were identified as PCBs, and listed the reasons somepeaks were rejected, and subjected to further testing.Extensive data review was then performed to check theintegration of peaks in the chromatograms as well asperfonnance of the dBASE IV software. Once the data reviewwas completed, a final report of the sample was generatedwhich provided the concentrations of the specific congeners(Table II) monitored as well as the total concentration ofeach PCB isomer group. The report also provided EMPC(Estimated Maximum Possible Concentration) for peaksdetected but did not pass the quality control criteria dueto the possible matrix interferences or instrumentvariances.
34

TABLE V: GC/MS ANALYTICAI. CONDITIONS
Temp #1 (°C)--------> 100.0
Time #1 (min)-------> 2.5
Rate #1 (°C/min)----> 50.0
Temp #2 (°C)--------> 150.0
Rate #2 (°C/min)----> 0.0
Temp #3 (°C)--------> 300.0
Time #3 (min)-------> 10.0
Injector Temp (°C)—> 250.0
Purge Off (min)-----> 0.5
Head Pressure-------> 25.0 psi
Injection-----------> Splitless
Carrier Gas---------> Helium
Source Temp (°C)----> 270.0
Mass Spectrometer Resolving Power---------> 10,000
Mass Spectrometer Ionization Energy-------> 70.0 eV
Mass Spectrometer Filament Trap Current---> 0.60 mA
35

^SItW>v-'»i.
TABLE VIt MASS DESCRIPTORS USED FOR SELECTED ION RECORDINGUSING HRGC/HRMS
Group Ion Accurate Elemental Analyte
1 Lock 175.9935 PFTBA
QC 180.9888 PFTBA
M 188.0392 ^12"9 ^ '• Mo-PCB
M+2 190.0363 CijHg^Cl
M 194.0594 Cg^CgH^^^ciMO-PCB
M+2 196.0565 Ce'^CfiH^^Cl
2 QC 219.9847 PFTBA
M 222.0003 CijHg CI2 Di-PCB
M+2 223.9974 Ci2H83^Cl3''ci
Lock 230.9856 PFTBA
M 234.0406 CijHg CI2Di-PCB
M+2 236.0376 "Ci2Hg"Cl"Cl
M 255.9613 C12H7 CI3 Tr-PCB
M+2 257.9584 Ci2H7'5cVci
M 268.0016 l^Ci2H7^^Cl3Tr-PCB
M+2 269.9986 "Ci2H73^Cl2"Cl
M 289.9223 C12H6 C14 T-PCB
M+2 291.9194 CijHg^'Cls^'Cl
M 301.9626 ^^C,2He^^Cl4 13p _
T-PCB
36

TABLE VI; CONTINUED
M+2 303.9597 "CijHg^^Cls^Cl
M 323.8833 Cn^s^'Cls Pe-PCB
M+2 325.8804 Ci^Hj^^cV^Clj
M 335.9236 "C12H535CI5 13p _^12Pe-PCB
M+2 337.9207 i^CizHs'^cV'Cl
3 M 289.9223 ^n^6 CI4 T-PCB
M+2 291.9194 Ci2H,35ci^37ci
M 301.9626 "Ci2He^^Cl4 13p _
T-PCB
M+2 303.9597 "CijHfi^^Cls^Cl
Lock 313.9839 PFTBA
M 323.8833 CijH/^Clj Pe-PCB
M+2 325.8804 12^5 ^-^4 ^-^5
QC 325.9839 PFTBA
M 335.9236 "C,,Hs''Cl, 13p _
Pe-PCB
M+2 337.9207 i^CijHs^^cVci
M+2 359.8415 Ci2H435cij37ci Hx-PCB
M+4 361.8385 C,2H435C14"C12
M+2 371.8817 i'Ci2H43^Cl53''ci 13/-. _
Hx-PCB
M+4 373.8788 13Ci2H43'Cl4"Cl2
4 M 323.8833 CijHj CI5 Pe-PCB
M+2 325.8804 Ci2H535cl^37cl
M 335.9236 "C.2H5^^Cl5 13o _
Pe-PCB
37

TABLE VI; CONTINUED
M+2 337.9207 "CijHs^^ci^sVci
M+2 359.8415 Ci^H^^^Clj^cl Hx-PCB
M+4 361.8385 12"4 *^4 ^-^2
M+2 371.8817 "Ci2H435ci53''Cl 13p _*-12Hx-PCB
M+4 373.8788 "Ci2H43^Cl43''Cl2
M+2 393.8025 CijHs^^Clg^Cl Hp-PCB
M+4 395.7995 C12H335CI337CI2
M+2 405.8427 "Ci2H335ci6"ci *-12Hp-PCB
M+4 407.8398 "Ci2H3^5Cl5"Cl2
Lock 413.9775 '• PFTBA
QC 425.9775 PFTBA
M+2 427.7635 Ci2H2^^Cl7"Cl Oc-PCB
M+4 429.7606 Ci2H2 Clg CI2
M+2 439.8038 "Ci2H2^^Cl7"Cl 13p _L.12Oc-PCB
M+4 441.8008 "Ci2H2^^cVci2
M+2 393.8025 CijHj^'Clg^Cl Hp-PCB
M+4 395.7995 Ci2H3^^Cl5"Cl2
M+2 405.8427 "Ci2H3^5ci6^''Cl ^^Cjj-Hp-PCB
M+4 407.8398 "Ci2H3^^Cl5"Cl2
Lock 413.9775 PFTBA
QC 425.9775 PFTBA
38

TABLE VI; CONTINUED
M+2 427.7635 CijHj^'cV'Cl Oc-PCB
M+4 429.7606 CiaH/^Cl^^Clj
M+2 439.8038 "CijHj^^cV'Cl (-12-Oc-PCB
M+4 441.8008 "Ci^H^^^Cls^'cl^
M+2 461.7245 Ci2Hi^^Cl8"Cl No-PCB
M+4 463.7216 C,2Hi^5Cl7"Cl2
M+4 497.6826 Ci/5C1,^'C12 Deca-PCB
M+6 499.6797 Ci2^^cV'ci3
M+4 509.7229 "C,,35C1«"C1,Deca-PCB
M+6 511.7199 13Ci2'5Cl7^'Cl3
The following nuclidic masses were used:
H = 1.007825 Lock = Lock-mass ionC = 12.000000 QC = Quality Control Ion13C = 13.00335535C1 = 34.96885337C1 = 36.965903
39

TABLE VIIt; PCB WINDOW DEFINING MIX
PCB Isomer Group Number
2-Mo-PCB (F)4-Mo-PCB (L)2,6-Di-PCB (F)4,42,42,33,42,22,33,32,23,32,22,22,23,32,22,22,32,22,22,22,2
-Di-PCB (L)6-Tr-PCB (F)5-Tr-PCB
4'-Tr-PCB (L),6,63'',4-T-PCB,4,4,4,6,4,4,4,4,3,4,3,4,4,4,3,4,3,33',4,3,3,3,3,3,3,3,3
-T-PCB (F)
-T-PCB (L)6',-Pe-PCB (F),5-Pe-PCB (L),6,6'-Hx-PCB (F)4',6-Hx-PCB5,6'-Hx-PCB,5,5'-Hx-PCB (L),5,6,6'-Hp-PCB (F),4,4',5-Hp-PCB4',5,5'-Hp-PCB (L),5,5',6,6'-Oc-PCB (F),4,4',5,5'-Oc-PCB (L),4,5,5',6,5'-No-PCB (F),4,4',5,5',6-No-PCB (L)
Dec-PCB
1
12
2
22
2
22
32
4
33
4
44554
55
55
Note: The letter "F" implies the first eluter and the letter"L" implies the last eluter.
*The retention time of PCB analytes were determinedusing the PCB analyte elution order in SE-54 column(Mullin, et. al 1984).
40

G. Quality Control Criteria and Calculations;
The MS response to each analyte and internal
standard were computed using the formulas described below.
The analytes were quantified against their corresponding
internal standards while the internal standards were
quantified against their respective recovery standards (Table
VIII and Table IX; respectively). Mono through Penta PCB
internal standard isomers were quantified against the ^^C-
2,2',5,5'-T-PCB recovery standard while the Hexa through Deca
PCB internal standards were quantified against the "c-
3,3',4,4',5,5'-Hx-PCB recovery standard (Table IX). Table IX
also specifies the quantification relationship for the
surrogate and alternate standards, each of which were
quantified against their appropriate internal standards. The
mean response factor and the relative standard deviation
(%RSD) were calculated for each analyte and the internal
standard from the five point initial calibration (ICAL)
solutions. Every twelve hours RTCHK was analyzed to verify
that no retention window shift which may have occurred during
the past twelve hours. If the retention windows had shifted,
the acquisition windows were adjusted and the RTCHK was
reanalyzed to confirm its correctness. The continuing
calibration solution (CONCAL) was analyzed every 12 hours to
demonstrate the acceptable GC/MS performance in terms of
response factors. Table X lists the quality control criteria
41

which were used to assess ICAL and CONCAL performance. Table
XI lists the criteria for chlorine abundance ratios which were
used to monitor proper GC/MS performance. These ratios are
derived from known isotopic abundances. Samples were not
analyzed until both the ICAL and CONCAL had passed the QC
criteria listed in Tables X and XI.
H. Analyte Identification Criteria
The positive identification criteria used for the
characterization of the target analytes were as follows:
1) The integrated ion-abundance ratio for the
analytes (M/M+2, M+2/M+4, M+4/M+6) must be within 15 percent
of the theoretical value (Table XI).
2) For those target analytes with an analogue
carbon-labeled standard, the retention time of the analyte
must be within +3 seconds. The retention times of the non-
target analytes for which carbon-labeled analogues were
available in the ICAL/CONCAL must also be within +3 seconds of
the analogous carbon-labeled standard. For those target
analytes which did not have an analogous carbon-labeled
standard available in the ICAL/CONCAL, the analyte relative
retention time (RRT) must be within 0.005 retention time units
of the corresponding RRTs obtained from the Continuing
Calibration or the Initial Calibration, as applicable. The
RRTs were determined for each analyte with the corresponding
42

carbon-labeled internal standard using the following formula;
Ana ly t Bj^^^on ^e(j)RRTg^iyte
Internal Standard,^^^ ^„ (,)
3) The monitored ions must maximize within 2 s ofeach other
4) The Signal/Noise for all monitored ions must begreater than 2.5:1 (greater than 10 for the labeledstandards).
I« Analyte Relative Response Factor (RRF);
The response factors of analyte standards were
calculated from GC/MS calibration analyses (either CONCAL orICAL as applicable) by the following expression:
Aa * QiRRF (a) = -------
Qa * Ai
where
Aa and Qi are the integrated ion current of the ion(s) characteristic of the analyte and the internal standard,respectively;
43
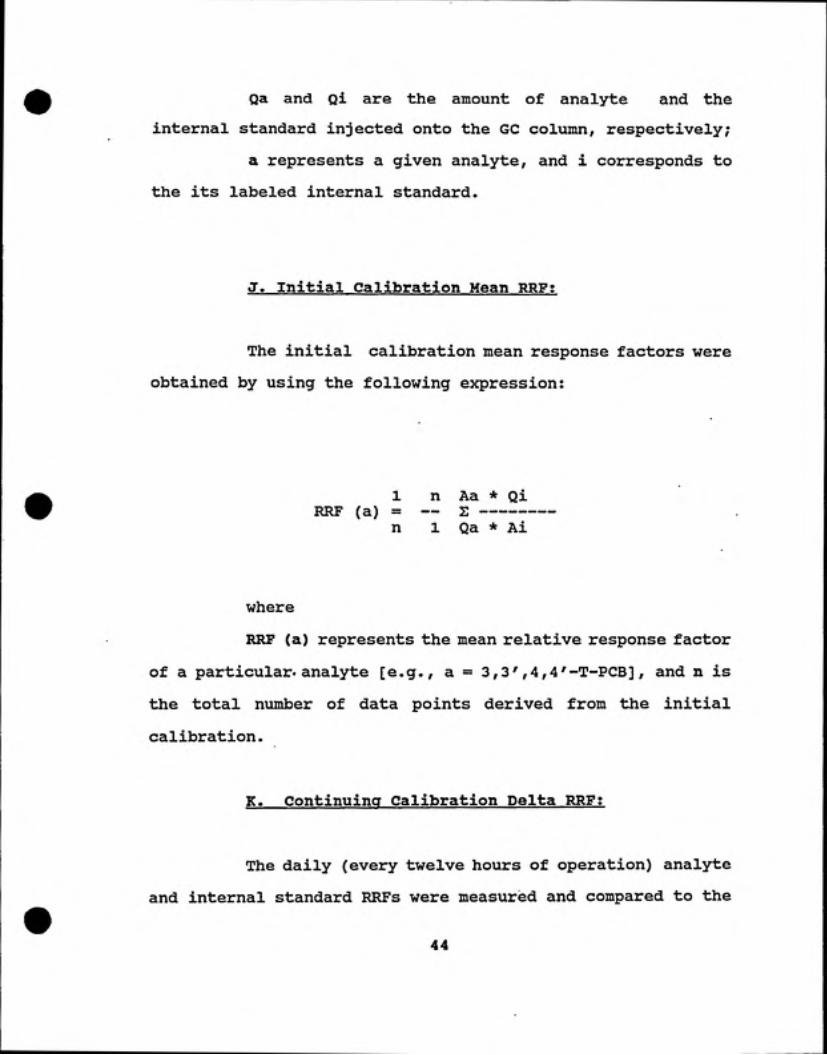
Qa and Qi are the amount of analyte and the
internal standard injected onto the GC column, respectively;
a represents a given analyte, and i corresponds to
the its labeled internal standard.
J. Initial Calibration Mean RRFt
The initial calibration mean response factors were
obtained by using the following expression:
1 n Aa * QiRRF (a) = — S-----
n 1 Qa * Ai
where
RRP (a) represents the mean relative response factor
of a particular, analyte [e.g., a = 3,3',4,4'-T-PCB], and n is
the total number of data points derived from the initial
calibration.
K. Continuing Calibration Delta RRF;
The daily (every twelve hours of operation) analyte
and internal standard RRFs were measured and compared to the
44

initial calibration mean RRFs. The percent delta RRF was
calculated as follows:
[RRFcoNCAL ~ RRF^ean]%a =--------------------------* 100
RRF__
where
RRPcoNCAL represents the continuing calibration RRF
of a given analyte, and
RRF^e^ was the calculated mean RRF from the initial
calibration.
L. Analyte Concentration;
The concentration of any analyte was calculated
using the following expression:
Aa * Qi
C(a) = ---------------------Ai * RRFmean(a) * W
where
45

JiHPWy*^. JJ'i,?'5«?=Kr^-*s.¥5^s^'
C(a) is the concentration of a given analyte (e.g.,a = 3,3',4,4'-T-PCB),
Aa is the integrated ion current for the ion(s)characteristic of the analyte,
Ai is the integrated current of the ion(s)characteristic of the corresponding internal standard,
Qi represents the amount of internal standard addedto the sample before the extraction,
RRFmean(a) is the mean analyte relative responsefactor as determined from the initial calibration, and
W is the sample weight or volume as appropriate.
M. Detection Limits (PL);
The detection limits of the analytes were computedwhen a given peak was not detected during the GC/MS analysiseither due to the absence of the analyte or inadequateinstrument sensitivity. The detection limits were calculatedby using the expression below where the area of the analytewas replaced by the noise level measured at the correspondingm/z in a region of the chromatograms clear of genuine GCsignals. The DL is the detection limit for samples presentingan analyte response that is less than 2.5 times the backgroundlevel.
46

2.5 * Ha * QiDL (a) = ---------------
Hi * RRF(a) * W
where
DL (a) is the estimated detection limit for a
particular analyte.
Ha is the estimated height of the noise in an ionchannel representative of the analyte.
Hi is the height of the ion characteristic of the
corresponding internal standard,
Qi represents the amount of internal standard added
to the sample before the extraction,
RRFmean is the analyte mean relative response factoras determined from the Initial Calibration, and
W is the sample weight.
47

TABLE VIII; OUJ^NTIFICATION RELATIONSHIP FOR ANALYTES
Analyte Internal standards ( Ci;)
2-Mono-PCBTotal Mono-PCB
4,4'-Di-PCBTotal Di-PCB
2,4,4'-Tr-PCBTotal Tr-PCB
2,2',5,5'-T-PCB3,3',4,4'-T-PCBTotal T-PCB ^
2,2',4,5,5'-Pe-PCBTotal Pe-PCB
2,2',4,4',5,5'-Hx-PCBTotal Hx-PCB
2,2',3,4,4',5,5'-Hp-PCBTotal Hp-PCB
2,2',3,3',4,4',5,5'-Oc-PCBTotal Oc-PCB
2,2',3,3',4,4',5,5',6-No-PCBTotal No-PCB
"C6-4-Mono-PCB*"C6-4-Mono-PCB*
4,44,4
2,42,4
3,33,33,3
2,22,2
2,22,2
2,22,2
2,22,2
2,22,2
-Di-PCB-Di-PCB
4'-Tr-PCB
4'-Tr-PCB
4,44,44,4
4,54,5
4,44,4
3,43,4
3,33,3
3,33,3
-T-PCB
-T-PCB
-T-PCB
5'-Pe-PCB
5'-Pe-PCB
,5,5'-Hx-PCB,5,5'-Hx-PCB
4',5,5'-Hp-PCB4',5,5'-Hp-PCB
,4,4',5,5'-Oc-PCB,4,4',5,5'-Oc-PCB
,4,4',5,5'-Oc-PCB,4,4',5,5'-Oc-PCB
Deca-PCB Deca-PCB
'Note: Mo-PCB internal standard is a "Cg and not "Cjj-substituted isomer.
48
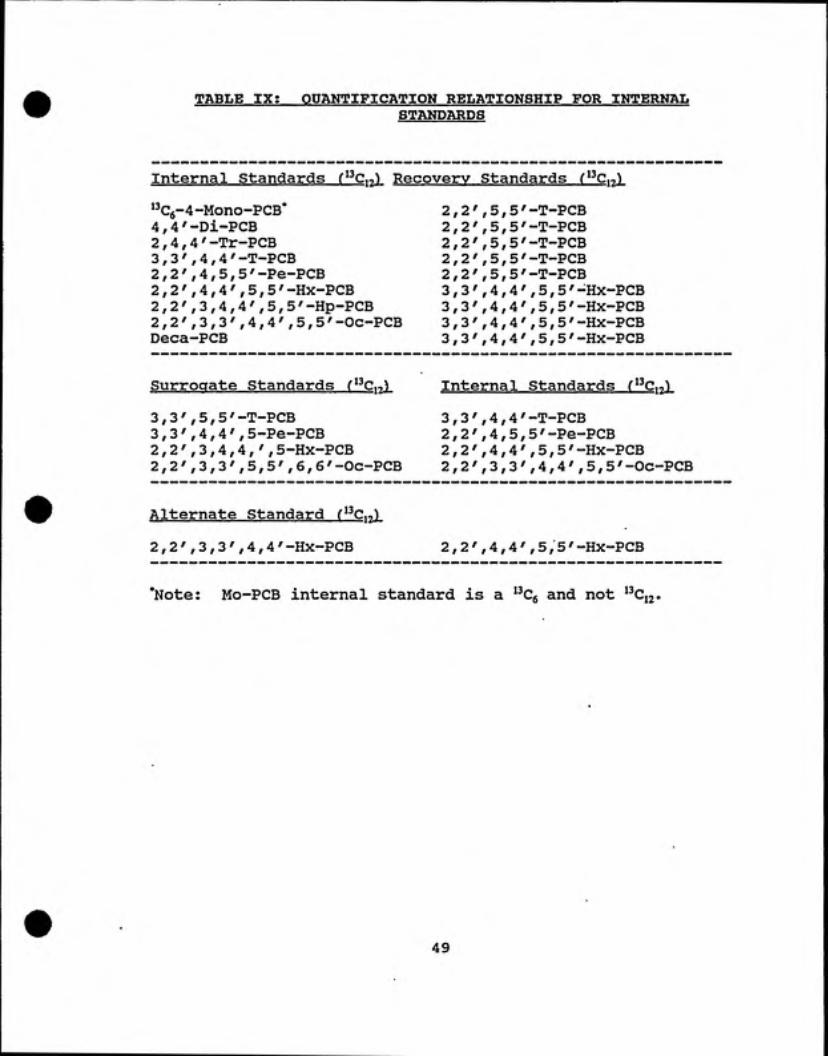
TABLE IX; QUANTIFICATION RELATIONSHIP FOR INTERNALSTANDARDS
Internal Standards (^^C^^) Recovery Standards f^^Cj-,)
"C6-4-Mono-PCB* 2, 2',5, 54,4'-Di-PCB 2,2',5,52,4,4'-Tr-PCB 2,2',5,53,3',4,4'-T-PCB 2,2',5,52,2',4,5,5'-Pe-PCB 2,2',5,52,2',4,4',5,5'-Hx-PCB 3,3',4,42,2',3,4,4',5,5'-Hp-PCB 3,3',4,42,2',3,3',4,4',5,5'-Oc-PCB 3,3 ' ,4,4Deca-PCB 3,3',4,4
-T-PCB
-T-PCB
-T-PCB-T-PCB-T-PCB
,5,5'-Hx-PCB,5,5'-Hx-PCB,5,5'-Hx-PCB,5,5'-Hx-PCB
Surrogate Standards ( Cj^)
3,3',5,5'-T-PCB3,3',4,4',5-Pe-PCB2,2',3,4,4,',5-Hx-PCB2,2',3,3',5,5',6,6'-Oc-PCB
Internal Standards ("Ci;)
3 , 3 ',4,4'-T-PCB2 ,2 ',4,5,5'-Pe-PCB2,2',4,4',5,5'-Hx-PCB2,2',3,3',4,4',5,5'-Oc-PCB
Alternate Standard ("Ci^)
2,2',3,3',4,4'-Hx-PCB 2,2',4,4',5,5'-Hx-PCB
'Note: Mo-PCB internal standard is a ^^C« and not ^^C12'
49

TABLE X; QUALITY CONTROL CRITERIA FOR RESPONSE FACTOR OFICALS and CONCJUJs
Analyte ICAL f%RSD> CONCAL (^a)
2-Mo-PCB 304,4''-Di-PCB 252 , 4,4'-Tr-PCB 252,2',5,5'-T-PCB 303,3',4,4'-T-PCB 252,2',4,5,5'-Pe-PCB 302,2',4,4',5,5'-Hx-PCB 302,2',3,4,4',5,5'-Hp-PCB 252,2',3,3',4,4',5,5'-Oc-PCB 252,2',3,3',4,4',5,5',6-No-PCB 25Deca-PCB 25
3025
25
3025
30
30
25
2525
25
Surrogate Standards (^^Cto)
3,3',5,5'-T-PCB 253,3',4,4',5-Pe-PCB 252,2',3,4,4,',5-Hx-PCB 252,2',3,3',5,5',6,6'-Oc-PCB 25
2525
25
25
Alternate Standard f^^Ci,)
2,2',3,3',4,4'-Hx-PCB 25 25
Internal Standards ("Ci^)
"C<i-4-Mono-PCB' 304,4'-Di-PCB 302,4,4'-Tr-PCB 303,3',4,4'-T-PCB 252,2',4,5,5'-Pe-PCB 302,2',4,4',5,5'-Hx-PCB 302,2',3,4,4',5,5'-Hp-PCB 302,2',3,3',4,4',5,5'-Oc-PCB 25Deca-PCB 30
30
30
30
25
30
30
30
25
30
"Mo-PCB internal standard is a "Cg and not "Cij.
50
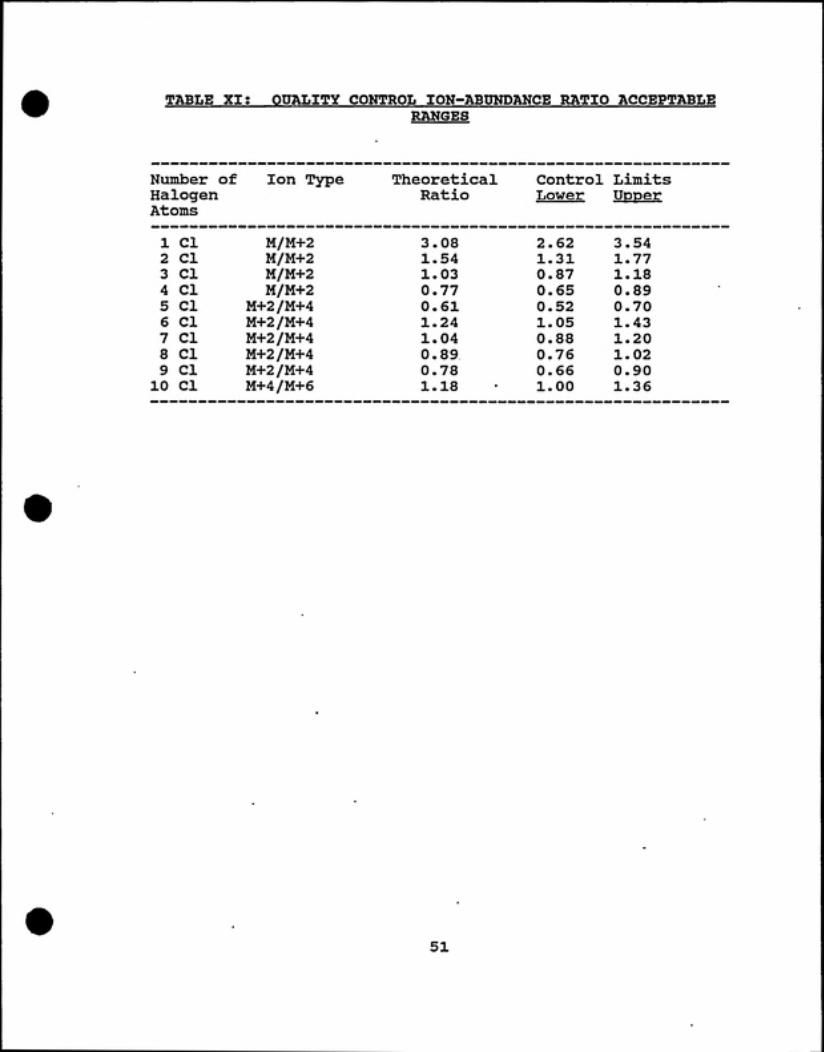
TABLE XI: QUALITY CONTROL ION-ABUNDANCE RATIC1 ACCEPTABLERANGES
Number of Ion Type Theoretical Control Limits
Halogen Ratio Lower UpperAtoms
1 CI M/M+2 3.08 2.62 3.54
2 CI M/M+2 1.54 1.31 1.77
3 CI M/M+2 1.03 0.87 1.18
4 CI M/M+2 0.77 0.65 0.89
5 CI M+2/M+4 0.61 0.52 0.70
6 CI M+2/M+4 1.24 1.05 1.43
7 CI M+2/M+4 1.04 0.88 1.20
8 CI M+2/M+4 0.89 0.76 1.02
9 CI M+2/M+4 0.78 0.66 0.90
10 CI M+4/M+6 1.18 1.00 1.36
51

IV. Results and Discussion;
A. Calibration Data;
Once the PCB-RTCHK was analyzed and the
acquisition windows were correctly set, 2 uL of each initial
calibration solutions was injected into the- GC/MS and the
mean RRF of the analytes, internal standards, surrogate
standards, and alternate standards were determined. The
results are shown in Table XII. It is generally accepted by
environmental analysts that there is no single definition of
adequate linearity of detector response with varying
concentration (Alford-Stevens, et al. 1985).
For the analyte, in this work the mean RRF ranged
from 0.843 for Mo-PCB to 3.247 for Hp-PCB. For the
Surrogates and the Alternate Standards, the mean RRF ranged
from a low of 0.541 for "Cj2-2,2'3,3'5,5'6,6'-Oc-PCB to a
high of 4.756 for '^Ci2-3,3M,4'5,5'-Pe. For the InternalStandards, the mean RRF ranged from 0.222 for '^Cjj-
2, 2'3, 4, 4'55'-Hp-PCB to 2.065 for "Ci2-2 , 4, 4'-Tr-PCB. The
%RSD for the analyte, RRFs from the initial calibration,
ranged from 3% for Mo-PCB to 15% for Di-PCB. The overall
52
mean RSD was 8.7% for all the analyte. The %RSD for the
surrogate and alternate standards ranged from 3% for ^'Cij-
3,3',5,5'-T-PCB to 9% for "Ci2-2 , 2 ' , 3 , 3 , 5, 5', 6, 6'-Oc-PCB.
The overall mean RSD was 5.6% for the surrogate and
alternate standards. For the internal standards, the %RSD
ranged from 3% for ^^Ci2-2,4,4'-Tr-PCB to 12% for '^Cij-Deca-PCB. The overall mean RSD was 6.4% for the internal
standards. The mean response factor of the
2,2',3,4,4',5,5'-Hp was high (3.247) and its corresponding
internal standard, ^^Ci2-2,2',3,4,4',5,5'-Hp-PCB had low
response factor (0.222) due to the incorrect concentration
of primary solution supplied by the Vendor (CIL). The %RSDs
were well within the criteria given in Table X.
The ability of the RRFs to be reproduced over a
period of time was also an issue of concern in this work.
After performing analyses for approximately 12 months, the
RRFs of analytes and internal standards have been relatively
consistent with those shown in Table XII. It should be
noted, however, that if GC leaks are present, the RRFs of
internal standards may. The RRFs are affected by settings
of the electron energy and repeller, thus tuning the mass
spectrometer may also have effects upon RRFs.
During analyses, it was discovered that one of the
PFK ions, interfered with ion channel monitoring Di-PCB and
53

the "Ci2-Tr-PCB. The PFK ion with a mass of 223.9872
interfered with Di-PCB (M+2) ion of 223.9974. A mass
spectrometer resolution of 22000 was required to resolve
these two masses. A PFK ion also interfered with the
Internal Standard ion (268.0016) of Tr-PCB. In this case a
mass spectrometer resolution of 33 000 was required to
separate the ^^Cjj-Tr-PCB and PFK ion of 267.9934. Since mass
spectrometer sensitivity decreases as the resolution
increases, a resolving power of 10,000 was chosen as a
compromise. At this resolving power, one can still achieve
the detection limit of 500 femptogram using (10:1 at a S:N
ratio of 10:1).
In order to alleviate chemical interferences from
the reference compound PFK, Perfluorotributylamine (PFTBA)
was chosen as an alternate reference compound. Even though
the reference compound reservoir was cleaned very well using
solvents such as Methylene Chloride or Toluene, the problem
of PFK interference was not totally alleviated since most
GC/MS systems use PFK as the reference compound on an
ongoing basis. The alternative reference compound itself
(PFTBA), with the residue of PFK, also interfered with
detection of Di-PCB. The interference of mass 222.0000 of
PFTBA to Di-PCB was most prevalent at low concentration of
Di-PCB. When 500 femptogram of Di-PCB was injected into the
GC/MS, the highest signal to noise observed was
54
approximately 8/1 and the lowest signal to noise observedwas approximately 2/1. During the analysis of lowest ICALpoint, the level of PFTBA was kept to a minimum level asallowed by the mass spectrometer without compromising theintensity of other lock-mass ions for different SIR groups.
B. Results of Method Performance!
The data obtained by the fortification of five
replicate HPLC water samples provided information regardingmethod performance in terms of precision, bias ofconcentration, and the efficiency of the extraction andcleanup procedures. The five reagent water samples werefortified at concentration of 0.50 ng/L (see Table III).The results are shown in Table XIII. The mean %RSDs rangedfrom 3.51% for 2,2',3,4,4',5-Hp-PCB to 18.18% for 2,2',5,5'-T-PCB. The relative percent deviation (%RPD) ranged from —1.8% for 2,2',5,5'-T-PCB to 23.6% for 2,4,4'-Tr-PCB. The
mean percent accuracy ranged from 94.8% for 2-Mo-PCB to123.2% for 2,4,4'-Tr-PCB. Excellent precision was achievedfor 2,2',3,3',4,4',5,5',6-No-PCB and Deca-PCB with %RPD of0.0%.
The %recoveries of carbon labelled internal
standards ranged form 43.0% for ^^Ci2-4-Mo-PCB to 77.0% for"Ci2-2,2',4,5,5'-Pe-PCB. The %RSD ranged from 13.0% for "Cij-
55

2 , 4, 4'-Tr-PCB to 25.0% for ^^Ci2-4-Mo-PCB. The recoveries ofinternal standards are not necessarily representative of theefficiency of extraction and cleanup procedures since theyare not quantified using the isotope dilution technique.The recoveries of internal standards can be affected by howwell the GC/MS was tuned and whether or not they were anyleaks present. They do, however, indicate whether anyproblems which may have occurred during the extractionand/or cleanup and during the GC/MS analysis. For example,the recovery of ^^Ci2-4-Mo-PCB always proved less than otherinternal standards. It was discovered that part of the Mo-PCB was being evaporated during the concentration procedureusing Nj for the final extract volume since Mo-PCBs havelower boiling points than other homologs. The concentrationprocedure was kept as gentle as possible to minimize theevaporation of analyte.
The %recoveries of the carbon-labelled alternate
and surrogate standards were also determined. They rangedfrom 65.0% for "Ci2-2,2',3,3',4,4'-Hx-PCB to 119.0% for ^^Cij"3,3',5,5'-T-PCB. There was not a wide distribution ofrecoveries of the surrogates and alternate standardsobserved since they are quantified against the internalstandards and they are added prior to cleanup procedures.Again, the recoveries of surrogate and alternate standardsare not truly representative of the efficiency of the
56

extraction and cleanup procedures since they are not
quantified using the isotope dilution technique. During the
development of the method, it was discovered that one
surrogate compound, "Ci2-2,2',3,3',5,5',6-Hp-PCB coeluted
with another surrogate, ^^Ci2-3 , 3', 4,4', 5-Pe-PCB. As a
result, high recoveries were observed for ^^Cij-Pe-PCB
surrogate since ^^Cij-Hp-PCB contributed to the Pe-PCB channelby the loss of two chlorines. Since ^^Cij-Hp-PCB was not
considered as toxic as the "Cij-Pe-PCB, it was taken out fromthe experimental analysis of samples and ICALS.
The data acquired with these extracts was also
used to estimate the detection limits and quantitation
limits for PCB analytes. The American Chemical Society
(ACS) committee guidelines define the limit of detection
(LOD) as three times the standard deviation (SD) of
replicate measurements and limit of quantitation (LOQ) as
ten times the SD (Alford-Stevens et. al 1986, ACS 1983).
The LOD is essentially equal to a method detection limit
(MDL), which is calculated with an equation relating the
standard deviation of replicate measurements and student's t
value for a one-tailed test at the 99% confidence level with
n-1 degrees of freedom. The MDL is defined as the minimumconcentration that can be measured and reported with 99%
confidence that the value is above zero (Alford Stevens, et
al. 1986). The MDL ranged from 0.0014 ng/L for 2-Mo-PCB to
57

0.0067 ng/L for 2,2',5,5'-T-PCB. The LOQ ranged from 0.0039(ng/L) for 2-Mo-PCB to 1.87 (ng/L) for
2,2',3,3',4,4',5,5',6-No-PCB. The LOD ranged from 0.0012(ng/L) for 2-Mo-PCB to 0.0056 (ng/L) for2,2',3,3',4,4',5,5',6-No-PCB. The values of MDL were
computed to be higher than the lowest point of calibrationstandards. The reason is that the reagent water extractswere spiked at higher amount (5 ng/L and greater). Itshould be noted however the LODs, MDLs, and LOQs are onlystatistical estimates and they are not absolute values.
58

TABLE XII: MEAN RESPONSE SUMMARY OF 2^ALYTES 3^ND INTERNALSTANDARDS
Analytes
2-Mo-PCB
4,4'-Di-PCB2,4,4'-Tr-PCB2,2',5,5'-T-PCB3,3',4,4'-T-PCB2,2',4,5,5'-Pe-PCB2,2',4,4',5,5'-Hx-PCB2,2',3,4,4'5,5'-Hp-PCB2,2',3,3',4,4',5,5'-Oc-PCB2,2',3,3',4,4',5,5',6-No-PCBDeca-PCB
Mean RRF %RSD
0.843 3
1.321 15
1.649 6
1.037 3
1.181 7
1.158 7
1.213 7
3.247 8
1.583 11
0.868 11
1.642 13
Internal Standards (Carbon-Labeled)
4-Mo-PCBi4,4'-Di-PCB2,4,4'-Tr-PCB3,3',4,4'-T-PCB2,2',4,5,5'-Pe-PCB2,2',4,4',5,5'-Hx-PCB2,2',3,4,4',5,5'-Hp-PCB2,2',3,3',4,4',5,5'-Oc-PCB^Deca-PCB
1.333 7
1.720 4
2.065 3
1.334 4
0.489 7
1.125 6
0.222 8
0.893 7
0.590 12
Surrogate standards (Carbon-Labeled)
3,3',5,5'-T-PCB 0.9823,3,'4,4',5-Pe-PCB 4.7562,2',3,4,4',5'-Hx-PCB 0.7812,2',3,3',5,5',6,6'-Oc-PCB 0.561
3
8
4
9
Alternate Standard (Carbon-Labeled)
2, 2',3,3',4,4'-Hx-PCB 0.306
Recovery Standard Solution (Carbon-Labeled)
2,2',5,5'-T-PCB3,3',4,4',5,5'-Hx-PCB
1.0001.000
00
59
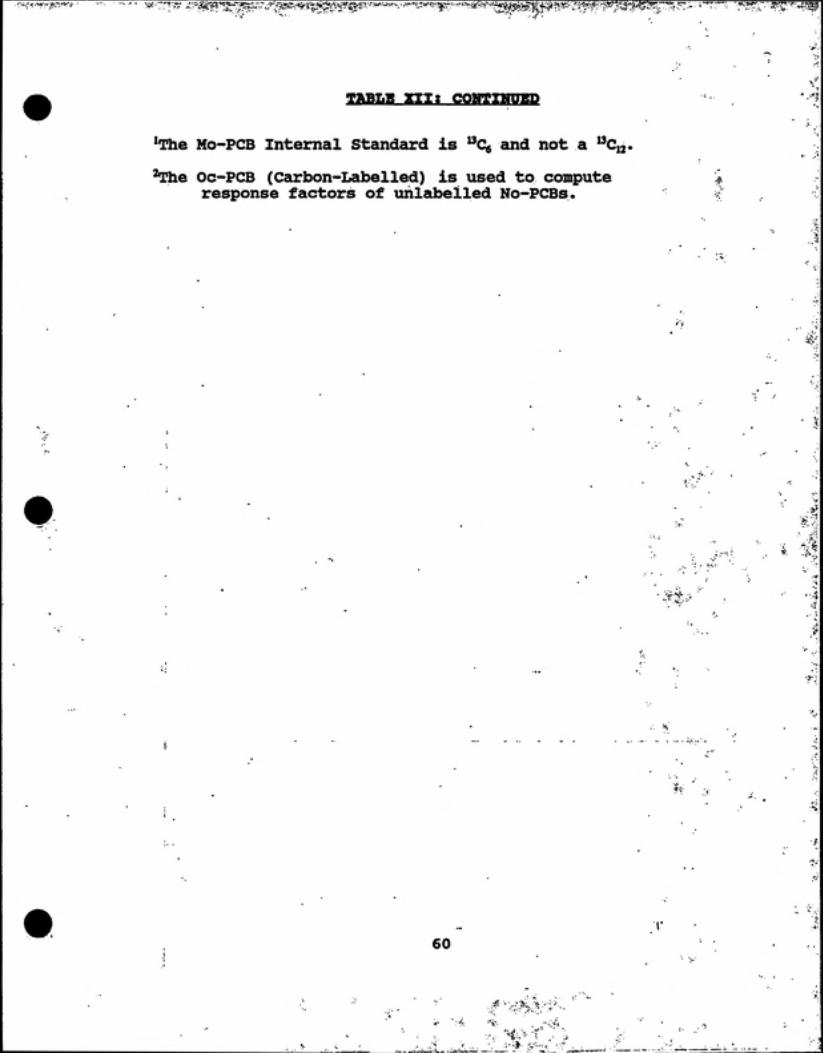
TABLE XII; CONTINUED
'The Mo-PCB Internal Standard is '^Cg and not a "Cj.^The Oc-PCB (Carbon-Labelled) is used to compute
response factors of unlabelled No-PCBs.
60
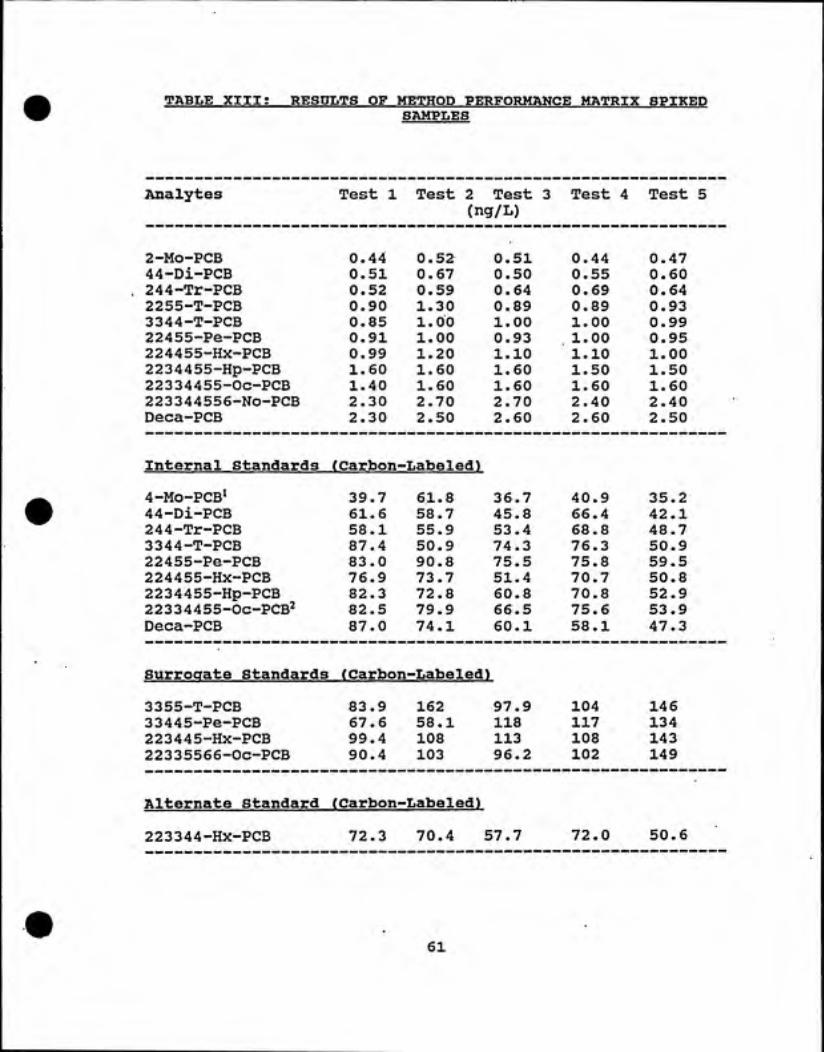
TABLE XIII! RESULTS OF METHOD PERFORMANCE MATRIX SPIKEDSAMPLES
Analytes Test 1 Test 2 Test 3 Test 4 Test 5
(ng/L)
2-Mo-PCB 0.44 0.52 0.51 0.44 0.47
44-Di-PCB 0.51 0.67 0.50 0.55 0.60
244-Tr-PCB 0.52 0.59 0.64 0.69 0.64
2255-T-PCB 0.90 1.30 0.89 0.89 0.93
3344-T-PCB 0.85 1.00 1.00 1.00 0.99
22455-Pe-PCB 0.91 1.00 0.93 1.00 0.95
224455-Hx-PCB 0.99 1.20 1.10 1.10 1.00
2234455-Hp-PCB 1.60 1.60 1.60 1.50 1.50
22334455-Oc-PCB 1.40 1.60 1.60 1.60 1.60
223344556-No-PCB 2.30 2.70 2.70 2.40 2.40
Deca-PCB 2.30 2.50 2.60 2.60 2.50
Internal Standards (Carbon--Labeled)
36.7 40.94-Mo-PCB^ 39.7 61.8 35.2
44-Di-PCB 61.6 58.7 45.8 66.4 42.1
244-Tr-PCB 58.1 55.9 53.4 68.8 48.7
3344-T-PCB 87.4 50.9 74.3 76.3 50.9
22455-Pe-PCB 83.0 90.8 75.5 75.8 59.5
224455-Hx-PCB 76.9 73.7 51.4 70.7 50.8
2234455-Hp-PCB 82.3 72.8 60.8 70.8 52.9
22334455-OC-PCB2 82.5 79.9 66.5 75.6 53.9
Deca-PCB 87.0 74.1 60.1 58.1 47.3
Surrogate Standards (Carbon-LabeledI
97.9 1043355-T-PCB 83.9 162 146
33445-Pe-PCB 67.6 58.1 118 117 134
223445-Hx-PCB 99.4 108 113 108 143
22335566-Oc-PCB 90.4 103 96.2 102 149
Alternate Standard (Carbon--Labeled)
57.7 72.0223344-Hx-PCB 72.3 70.4 50.6
61

TABLE XIII CONTINUED; RESULTS OF METHOD PERFORMANCE MATRIXSPIKED SAMPLES CONTINUED
Analytes Mean SD %RSD %RPD %Accuracy MDL
(ng/L) (ng/L)
0.47 0.038 8.12 -5.2 94.8 0.144
0.57 0.070 12.41 13.2 113.2 0.263
0.62 0.064 10.43 23.2 123.2 0.241
0.98 0.179 18.18 -1.8 98.2 0.669
0.97 0.066 6.83 -3.2 96.8 0.248
0.96 0.041 4.27 -4.2 95.8 0.153
1.08 0.086 7.99 7.8 107.8 0.323
1.56 0.055 3.51 4.0 104.0 0.205
1.56 0.089 5.73 4.0 104.0 0.335
2.50 0.187 7.48 0.0 100.0 0.701
2.50 0.122 4.90 0.0 100.0 0.459
2-Mo-PCB
44-Di-PCB244-Tr-PCB
2255-T-PCB3344-T-PCB
22455-Pe-PCB
224455-Hx-PCB
2234455-Hp-PCB223344550C-PCB
223344556NO-PCB2.50Deca-PCB
Internal Standards (Carbon-Labeled)
Mean SD_____%RSD
4-Mo-PCB'44-Di-PCB244-Tr-PCB
3344-T-PCB
22455-Pe-PCB
224455-Hx-PCB
2234455-Hp-PCB223344550C-PCB2Deca-PCB
(ng/L)
42.86 10 83 25 27
54.92 10 47 19 .06
56.98 7 48 13 .12
67.96 16 .35 24 .06
76.9 11 .58 15 .05
64.7 12 .61 19 .49
67.9 11 35 16 .71
71.68 11. 65 16 .25
65.32 15 42 23 .61
Surrogate standards (Carbon-Labeled)
3355-T-PCB
33445-Pe-PCB
223445-Hx-PCB22335566-Oc-PCB
119 33.47 28.18
98.9 33.80 34.16
114 16.80 14.69
108 23.40 21.65
Alternate standard (Carbon-Labeled)
223344-Hx-PCB 64.6 9.89 15.31
62
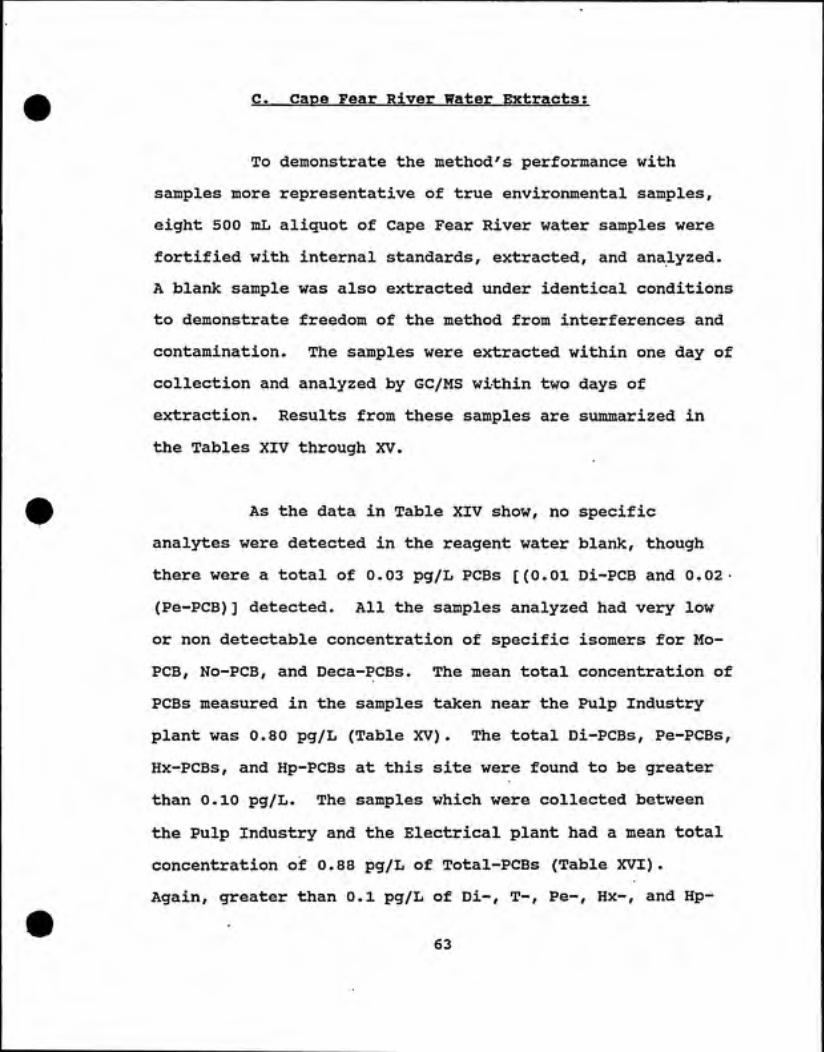
C. Cape Fear River Water Extracts;
To demonstrate the method's performance with
samples more representative of true environmental samples,
eight 500 mL aliquot of Cape Fear River water samples were
fortified with internal standards, extracted, and analyzed.
A blank sample was also extracted under identical conditions
to demonstrate freedom of the method from interferences and
contamination. The samples were extracted within one day of
collection and analyzed by GC/MS within two days of
extraction. Results from these samples are summarized in
the Tables XIV through XV.
As the data in Table XIV show, no specific
analytes were detected in the reagent water blank, though
there were a total of 0.03 pg/L PCBs [(O.Ol Di-PCB and 0.02
(Pe-PCB)] detected. All the samples analyzed had very low
or non detectable concentration of specific isomers for Mo-
PCB, No-PCB, and Deca-PCBs. The mean total concentration of
PCBs measured in the samples taken near the Pulp Industry
plant was 0.80 pg/L (Table XV). The total Di-PCBs, Pe-PCBs,
Hx-PCBs, and Hp-PCBs at this site were found to be greater
than 0.10 pg/L. The samples which were collected between
the Pulp Industry and the Electrical plant had a mean total
concentration of 0.88 pg/L of Total-PCBs (Table XVI).
Again, greater than 0.1 pg/L of Di-, T-, Pe-, Hx-, and Hp-
63

PCBs were found for the two duplicate samples. There wasnot any significant increase in the concentration of PCBsnear the waste dump area as compared to the samplescollected from the farthest point downstream. The TablesXVII and XVIII show data from samples collected near the
waste dump area near the electrical plant and approximatelyfive miles away from the dumping site; respectively. Themean total concentration of PCBs found near the waste dumparea was 3.20 pg/L (Table XVII). There were no detectableamounts found for Oc-PCBs and No-PCBs. The-samples whichwere collected downstream from the dump site had a meantotal PCB concentration of 1.60 pg/L (Table XVIII). Thedecrease in going downstream unexpected since PCBs are non-polar compounds and they tend to settle to the bottom of theriver as the waste water became diluted with the river
water.
64
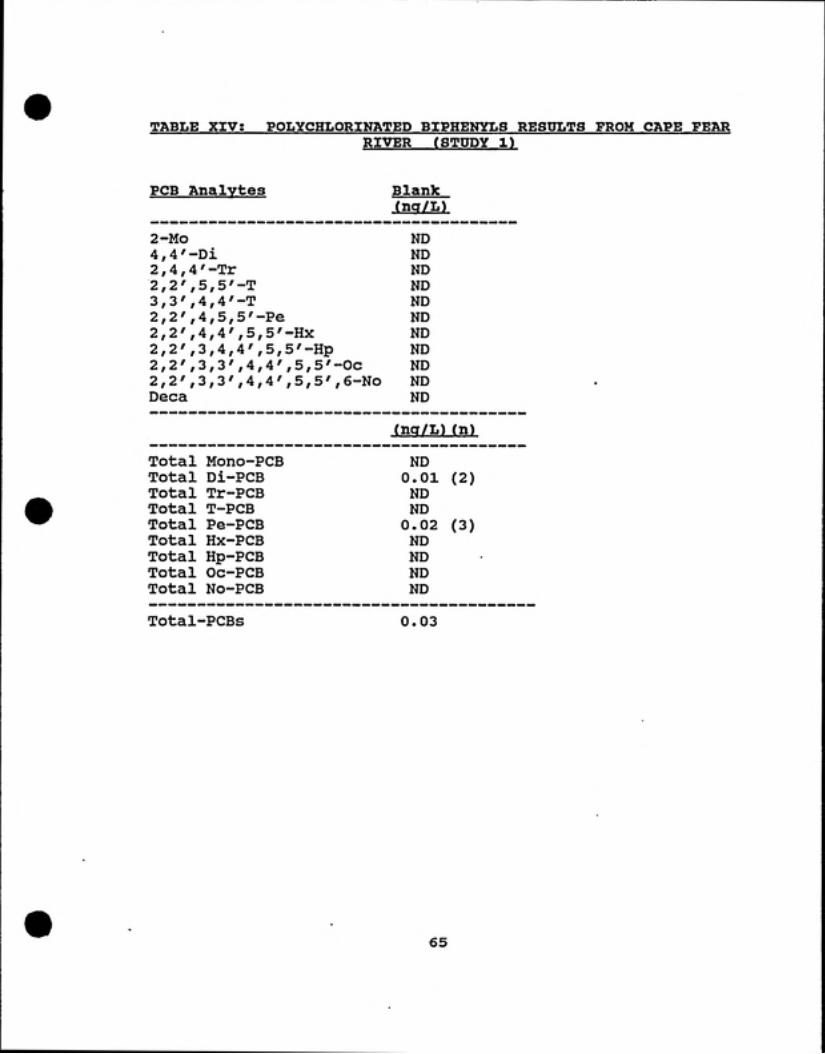
TABLE XIV; POLYCHLORINATED BIPHENYLS RESULTS FROM CAPE FEARRIVER (STUDY 1)
PCB Analvtes Blank
tnq/L)
ND
ND
ND
ND
ND
ND
ND
ND
ND
ND
ND
(nq/L) (n)
TotalTotalTotalTotalTotalTotalTotalTotalTotal
Mono-PCB
Di-PCBTr-PCB
T-PCB
Pe-PCB
Hx-PCB
Hp-PCBOc-PCB
No-PCB
ND
0.01 (2)ND
ND
0.02 (3)ND
ND
NDND
Total-PCBs 0.03
65

TABLE XV; POLYCHLORINATED BIPHENYLS RESULTS FROM CAFE FEARRIVER (STUDY 2)
PCB Analvtes Setmp. #1(ng/L) PL
Samp. #1 (Pup.)(ng/L) PL
2-Mo
44'-Di244'-Tr
2255'-T
33M4'-T
22'455'-Pe22M4'55'-HX
22'344'55'-Hp22'33'44'55'-Oc22'33M4'55'6-NoDeca
ND
0.040.02
0.03
ND
ND
0.050.05
ND
ND
ND
0.02
0.02
0.03
0.02
0.03
0.02
ND 0.03
0.04 —
0.02 —
0.05 —
ND 0.04
ND 0.04
0.07 —
0.06 —
ND 0.06
ND 0.07
ND 0.02
(n)ND
0.15 (4)0.06 (3)0.12 (8)0.16 (5)0.19 (8)0.11 (3)ND
ND
TotalTotalTotalTotal
TotalTotalTotal
TotalTotal
Mono-PCB
Di-PCBTr-PCB
T-PCB
Pe-PCB
Hx-PCB
Hp-PCBOc-PCB
No-PCB
0.
0.
0.
0.
0.
02
19
05
11
14
0.230.14
ND
ND
(n)(1)(5)(3)(8)(3)
(10)(8)
Total-PCBs 0.88 0.79
66
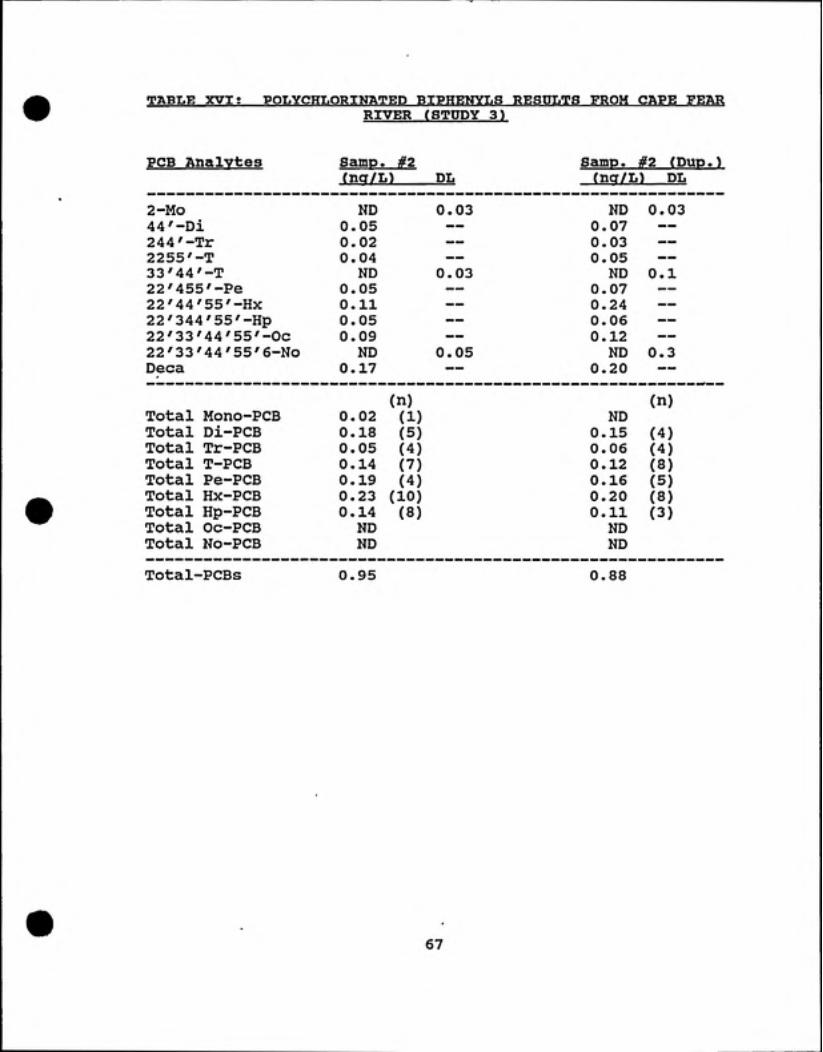
TABLE XVIt POLYCHLORINATED BIPHENYLS RESULTS FROM CAPE FEAR
RIVER (STUDY 3)
PCB Analvtes Saunp. #2 Seunp. #2 (Dup.)(nq/L) DL (na/L) DL
2-Mo ND 0.03 ND 0.03
44'-Di 0.05 —. 0.07 —
244/-Tr 0.02 — 0.03 —
2255'-T 0.04 ~ 0.05 —
33M4'-T ND 0.03 ND 0.1
22'455'-Pe 0.05 — 0.07 —
22M4'55'-Hx 0.11 — 0.24 —
22'344'55'-Hp 0.05 — 0.06 —
22'33M4'55'-Oc 0.09 — 0.12 —
22'33M4'55'6-No ND 0.05 ND 0.3
Deca 0.17 — 0.20 —
(n) (n)Total Mono-PCB 0.02 (1) ND
Total Di-PCB 0.18 (5) 0.15 (4)Total Tr-PCB 0.05 (4) 0.06 (4)Total T-PCB 0.14 (7) 0.12 (8)Total Pe-PCB 0.19 (4) 0.16 (5)Total Hx-PCB 0.23 (10) 0.20 (8)Total Hp-PCB 0.14 (8) 0.11 (3)Total Oc-PCB ND ND
Total No-PCB ND ND
Total-PCBs 0.95 0.88
67

TABLE XVII; POLYCHLORINATED BIPHENYLS RESULTS FROM CAPEFEAR RIVER (STUDY 4)
PCB Analytes Samp. #3 Samp. #3 (Dup.)(na/L) DL (nq/L) DL
2-Mo ND 0.03 ND 0.04
44'-Di 0.05 — 0.04 —
244'-Tr 0.02 — 0.02 —
2255'-T 0.03 — 0.04 —
33M4'-T ND 0.02 ND 0.0422M55'-Pe 0.10 — 0.05 —
22M4'55'-Hx 0.38 — 0.29 —
22'344'55'-Hp 0.47 — 0.43 —
22'33M4'55'-Oc ND 0.03 ND 0.06
22'33M4'55'6-No 0.02 — ND 0.08Deca 0.01 — 0.02 —
(n) (n)Total Mono-PCB 0.03 (1) NDTotal Di-PCB 0.21 (5) 0.13 (4)Total Tr-PCB 0.06 (7) 0.04 (V)Total T-PCB 0.19 (11) 0.12 (8)Total Pe-PCB 0.56 (4) 0.49 (5)Total Hx-PCB 1.10 (18) 1.12 (19)Total Hp-PCB 1.10 (15) 1.16 (16)Total Oc-PCB ND NDTotal No-PCB ND ND
Total-PCBs 3.30 3.10
68

TABLE XVIII; POLYCHLORINATED BIPHENYLS RESULTS FROM CAPEFEAR RIVER (STUDY 5)
PCB Analytes Seunp. #4 Samp. #4 (Dup.)(na/L) DL (nq/L) DL
2-Mo ND 0.03 ND 0.01
44'-Di 0.04 — 0.05 —
244'-Tr 0.02 — 0.04 —
2255'-T 0.04 — 0.05 —
33M4'-T ND 0.02 ND 0.01
22M55'-Pe 0.09 — 0.10 —
22M4'55'-Hx 0.09 — 0.12 —
22'344'55'-Hp 0.09 — 0.08 —
22'33'44'55'-Oc ND 0.04 ND 0.02
22'33'44'55'6-No ND 0.05 ND 0.03
Deca ND 0.03 ND 0.02
(n) (n)Total Mono-PCB 0.02 (1) 0.03 (2)Total Di-PCB 0.28 (6) 0.23 (6)Total Tr-PCB 0.07 (9) 0.10 (8)Total T-PCB 0.20 (13) 0.29 (13)Total Pe-PCB 0.31 (5) 0.36 (5)Total Hx-PCB 0.34 (10) 0.37 (13)Total Hp-PCB 0.30 (12) 0.34 (13)Total Oc-PCB ND ND
Total No-PCB ND ND
Total-PCBs 1.50 1.70
69

D. The Contribution Problemt
One of the fundamental problems which was expected
to occur during the development of the method was described
here the contribution of higher homolog channels into the
lower homolog channels by the fragmentation of ions,
particularly the from loss of chlorines. It is well known
that chlorinated compounds such as PCBs will loose chlorine
very easily during the electron ionization due to their high
electronegativity and the fact that Clj heat of formation is
more favorable. Since PCB homologs overlapped during their
elution from the GC Column, the problem of overestimation of
specific homolog totals had to be addressed. Table XIX
shows the resolving power needed to separate the loss of
chlorines from higher homologs into the lower homologs. For
example, for T-PCB (289.9224), the resolving power needed to
separate the chlorine loss from Pe-PCB was 300.0. The
theoretical abundance of ^^C also has to factored in the
fragmentation. So for example, if the "C-Pe-PCB lost
chlorine at the same time, than the resolving power needed
to separate the T-PCB from ^^C-Pe-PCB-Cl was 64,000. The
Table XIX also shows the theoretical abundance of 10.37% for
"C-Pe-PCB-Cl. The problem is compounded when the "c-Hx-PCB-
Clj also contributes to the T-PCB. The resolving power
needed to separate the T-PCB from Hx-PCB is 16,000.
70

An experiment was conducted to monitor the loss of
chlorines from higher homologs into the lower homologs by
the SIR analysis of Aroclors 1254, 1248, and 1232. An
assumption was made that the Aroclors would represent the
worst case scenario for analysis of PCBs as far as the
totals were concerned and if there were high homolog
contributions into the lower homolog. In such a case the
amount calculated could be significantly overestimated for
the lower homolog. Three solutions of Aroclors at
concentration of 30 ng/L were analyzed. The results are
shown in Tables XXI through XXIII. After extensive data
review, the Aroclors 1232, 1254, and 1248 were determined to
have the Total-PCB recovery of 88%, 109%, and 90%;
respectively. The results indicated that even though there
is a significant overlap in the retention time of the each
homolog, the fragmentation contribution did not affect
significantly the computed concentration of analytes. It
must be emphasize that M-1 and M-2 (Table XX) masses were
also monitored to confirm the HCL or Clj losses and avoid
the false identification of each analyte contribution from
higher homologs into the lower homologs. The method was
designed to determine accurately the concentration of the
toxic PCBs in the matrix and it estimated the total PCB
amount as closely as possible to the actual amount.
71

TABLE XIX; RESOLVING POWER NEEDED TO AVOID THE HIGHERHOMOLOG CONTRIBUTION
Homolog(Mass)[Ions]
M-Cl
(Abundance)[RP Needed]
T-PCB
"C(M)-C1(Abundance)[RP Needed]
Pe-PCB
i^C (M) -CI2(Abundance)[RP Needed]
Tr-Cl255.9613
[M]
254.9535
(100.00)[254]
255.9569
(13.35)[58173]
255.9428
(96.75)[13836]
Pe-PCB Hx-PCB
Homolog(Mass)[Ions]
M-Cl
(Abundance)[RP Needed]
i^C(M)-Cl(Abundance)[RP Needed]
'3C(M)-Cl2(Abundance)[RP Needed]
T-PCB
289.9224
[M]
288.9145
(78.18)[288]
289.9179
(10.37)[64427]
289.9038
(100.00)[15587]
Hx-PCB Hp-PCB
Homolog(Mass)[Ions]
M-Cl
(Abundance)[RP Needed]
"C(M)-C1(Abundance)[RP Needed]
"C (M) -CI2(Abundance)[RP Needed]
Pe-PCB
323.8834
[M]322.8756
(62.54)[321]
323.8789
(8.30)[71974]
323.8648
(100.00)[17413]
Hp-PCB OC-PCB
Homolog(Mass)[Ions]
M-Cl
(Abundance)[RP Needed]
13C(M)-C1(Abundance)[RP Needed]
13C(M)-Cl2(Abundance)[RP Needed]
Hx-PCB359.8415
CM+2]358.8336
(100.00)[357]
359.8370
(13.31)[79965]
359.8230
(80.42)[19451]
72

TABLE XIX; CONTINUED
Homolog(Mass)[Ions]
Hp-PCB393.8025
[M+2]
OC-PCB
M-Cl
(Abundance)[RP Needed]
392.7947
(100.00)[391]
"C(M)-C1(Abundance)[RP Needed]
393.7980
(13.31)[87512]
•
Homolog(Mass)[Ions]
Oc-PCB
427.7635
[M+2]
NO-PCB
M-Cl
(Abundance)[RP Needed]
428.7527
(100.00)[432]
"C(M)-C1(Abundance)[RP Needed]
727.7591
(11.85)[97219]
73

•*ga!!jjWi'j"vj!e8W!S''y-**ia!''S'^»giSl^"
TABLE XX! M-1 AND M-2 MASSES FOR EACH HOMOLOG
Homolog M-1 M-2(Mass) flon Loss) (Ion Loss)
Tr-PCB
(255.9613)[M]
254.9535
(T-Cl)253.9457
(Pe-Clj)
T-PCB
(289.9224)[M]
288.9145
(Pe-Cl)287.9067
(HX-CI2)
Pe-PCB
(323.8834)[M]
322.8756
(Hx-Cl)321.8677
(HP-CI2)
Hx-PCB
(359.8415)[M+2]
356.8366
(Hp-Cl)355.8288
(OC-CI2)
Hp-PCB(393.8025)[M+2]
389.7898
(Oc-HCl)
—
OC-PCB
(427.7635)(M+2)
423.7508
(No-HCl)
—
74

•* ^•Mi'giiif!i0H^iii^!^}m.mism»i^!gi^''!t!i!r'''^':'V'!f'^.
Table XXI! Polychlorinated Biphenvls Analysis of Aroclor1232
PCB Analytes Concentration(nq/L) DL
2-Mo 6.40 —
44'-Di 0.49 —
244/-Tr 0.75 —
2255'--T 0.64 —
33M4 r_T 0.04 —
22M55'-Pe 0.22 —
22M4 '55'-Hx 0.05 —
22'344'55'-Hp 0.03 —
22'33 '44'55'-Oc 0.006 ~-
22^33 '44'55'6-No 0.02 —
Deca 2.10 —
( n)Total Mono-PCB 10 .00 (3)Total Di-PCB 4.21 (7)Total Tr-PCB 3.70 (11)Total T-PCB 3.30 (19)Total Pe-PCB 0.99 (13)Total Hx-PCB 0.13 (7)Total Hp-PCB 0.08 (7)Total Oc-PCB 0.03 (2)Total No-PCB 1.10 (2)
Total PCBs 26 .00
75

Table XXII; Polvchlorinated Biphenyls Analysis of Aroclor1254
PCB Analvtes Concentration
(nq/L) DL
2-Mo 0.005 ^_
44'-Di 0.01 —
244'-Tr 0.03 —
2255'--T 1.70 —
33'44 '-T 0.04 —
22'455'-Pe 3.80 —
22M4 '55'-Hx 1.40 —
22'344'55'-Hp 0.31 —
22'33 '44'55'-0c 0.04 —
22'33 '44'55'6-No 0.03 —
Deca 2.50 —
(n)Total Mono-PCB 0.005 (1)Total Di-PCB 0.05 (2)Total Tr-PCB 0.05 (2)Total T-PCB 3.10 ( 19)Total Pe-PCB 17 .70 (17)Total Hx-PCB 6.40 ( 20)Total Hp-PCB 1.20 (12)Total Oc-PCB 0.16 (5)Total No-PCB 1.20 (2)
Total PCBs 33 .00
76

Table XXIII; Polvchlorinated Biphenvls Analysis of Aroclor1248
PCB Analytes Concentration(na/L) DL
2-Mo ND 0.001
44'-Di 0.05 —
244'-Tr 1.30 —
2255'--T 2.10 —
33M4 '-T 0.18 —
22M55'-Pe 0.77 —
22M4 '55'-Hx 0.09 ~
22'344'55'-Hp 0.10 —
22'33 '44'55'-Oc 0.04 —
22'33 '44'55'6-No 0.02 —
Deca 2.20 —
(n)Total Mono-PCB 0.003 (1)Total Di-PCB 0.19 (4)Total Tr-PCB 3.90 (12)Total T-PCB 12.00 (23)Total Pe-PCB 5.10 (17)Total Hx-PCB 0.31 (11)Total Hp-PCB 0.27 (8)Total Oc-PCB 0.11 (4)Total No-PCB 1.20 (3)
Total PCBs 27.00
77

E. Conclusion:
A method of PCB analysis was developed using the
HRGC/HRMS SIR. In the method developed. Water samples were
spiked with known amounts of internal standards before the
extraction procedure was performed. Prior to the cleanup
procedure, carbon-labelled surrogate and alternate standards
were spiked to the extract in order to monitor potential
losses during the cleanup procedure. Prior to the GC/MS
analysis, the extract was spiked with known amounts of
carbon-labelled recovery standards to quantify recoveries
the loss of internal standards from the extraction and
cleanup procedures. A five-point initial calibration curve
was generated once the acquisition windows were defined by
analyzing the retention window check solution. The mean
RRFs ranged from 0.843 to 3.247 for analytes in the ICAL.
For the surrogates and alternate standards, the mean RRFs
ranged from 0.541 to 4.756 while internal standard mean RRFs
ranged from 0.222 to 2.065. For the matrix spiked samples
the %RSD for quantified analytes ranged from 0.0% to 26.24%
for analytes. The mean percent accuracy ranged from 92.6%
to 123.6%. The recoveries of the carbon-labelled internal
standards ranged from 43% to 77.0%. The %RSD for internal
standard recoveries ranged from 13.0% to 25.0%. It must be
noted the percent recoveries of internal standards are not
true representative of efficiency of extraction and cleanup
78

procedures since they are not quantified using the isotope
dilution technique. The %recoveries of the carbon-labelled
alternate and surrogate standards ranged from 64.6% to
118.0%. The MDL ranged from 0.14 ng/L for 2-Mo-PCB to 0.67
ng/L for 2,2',5,5'-T-PCB. The LOQ ranged from 0.39 ng/L to
1.87 ng/L. Higher values for MDL and LOQ were observed
since the water samples spiked at higher amount than
required.
In order to apply the method to true environmental
samples, water samples from Cape Fear river were collected
and analyzed. The total concentration of PCBs determined
from the samples near the Pulp Industry plant was 0.8 pg/L.
The samples which were collected from waste sewage from the
Electrical Plant had mean concentration 3.0 pg/L of total
PCBs. The samples which were collected from the dumping
site had 1.60 pg/L concentration of total PCBs.
An Aroclor study was initiated to study the
overestimation of PCB analytes due to contribution from
higher homologs into the lower ones. Using M-1 and M-2 as
the confirmation ions of -CI, -Clj, and -HCl losses, the
total recovery of PCB analytes was determined to be 88%,
109%, and 90% for the Aroclors 1232, 1254, and 1248;
respectively. Even though the method was design to monitor
specific toxic analytes, it also determined the total PCB
79

concentration in a given matrix with very high accuracy.
F. Recommendation for further analysis;
Over the past three years, USEPA has started to
emphasize the measurements of specific toxic PCB isomers
rather than concentration of total PCBs in a given matrix.
The environmental industry has started to focus on the
analysis of co-planar PCBs such as 3,3',4,4'-T-PCB;
2,3,3',4,4'-Pe-PCB; 3,3',4,4',5-Pe-PCB; and 3,3',4,4',5,5'-
Hx-PCB since they are considered to be most toxic to the
bio-organisms. Therefore, it is recommended matrices such
as fish adipose, sediments, air sample, etc. should be
^H monitored for the presence of the most toxic PCB isomers.It would involve the modification of the extraction and
cleanup procedures in order to remove matrix related
interferences.
80

REFERENCES
Abernethy, S.; Bobra, A. M.; Shiu, W. Y.; Wells, P. G.;Mackey, D. Aquat. Toxicol., 1986, 8, 163-174.
Ackerman, D. G.; Scinto, L. L.; Bakshi, P. S.; Delumyea,R. G.; Johnson, R. J.; Richard, G.; Takata, A. M. "Guidelinesfor the Disposal of PCBs and PCB items by Thermal Destruction"USEPA, EPA-600/2-81-022, 1981.
Albro, P. W.; McKinney, J. D. Chem. Biol. Interact. 1981,34, 373-378.
Alford-Stevens, A. L. ; Budde, W. L. ; Bellar, T. A. Anal.Chem. 1985 57 2452-2457.
Alford-Stevens, A. L.; Bellar, T. A.; Eichelberger, J.W.; Budde, W. L. Anal. Chem. 1986 58 2022-2029.
Alford-Stevens, A. L.; Bellar, T. A.; Eichelberger, J.W.; Budde, W. L. Anal. Chem. 1986 58 2014-2022.
Alford-Stevens, A. L. ES&T, 1986, 20(12), 1194-1199.
American Chemical Society 1983 55 2210-2218.
Boon, J. P.; Reijnder, P. J. H.; Dols, J.; Wensvoort, P.;Hillebrand M. T. J. Aguat. Toxicol., 1987, 10, 307-324.
Bush, B.; Simpson, K. W. ; Shane, L. ; Koblintz, R. R.Bull. Environ. Contam. Toxicol., 1985, 34, 96-105.
Colby, B. N.; McCaman, M. W. Biom. Mass Spect. 1979 6 (6)225-230.
Colby, B. N.; Rosecrance, A. E.; Colby, M. E.; Anal.Chem. 1981 53 1907-1911.
Dining, W. L.; Miracle, G. E.; Boggs, G. U. "OrganicPhotochemistry. XVIII. Tropospheric Phototrans formation Ratesof 2-, 3- and 4-chlorobiphenyl" American Chemical SocietyNational Meeting, Washington, D. C. 343-346, 1983.
Durfee, R. L.; G. Contos, F. C.; Whitmore, J. D.; Barden,E. E.; Hackman, III; Westin, R. A. "PCBs in the United States- Industrial Use and Environmental Distributions" Prepared forthe U, S. Environmental Protection Agency, Office of ToxicSubstances, Report No. EPA 560/6-86-005 1976.
81

Erickson, M. D. Analytical Chemistry of PCBs Stoneham,MA: Butterworth Publishers, 1986.
Erickson, M. D.; Stanley, J. S.; Turman, J. K; Going, J.E. ; Redford, D. P.; Heggem, D. T. Environ. Sci. Technol.1988, 22, 71-76.
Fries, C. R. ; Lee, R. F. Marine Biol., 1984, 79, 187-193.
Furukawa, K.; Tonomura, K.; Kamibayashi, A. Appl.Environ. Microbiol. 1978 35 (2): 223-227.
Goldstein, J. A. ; Hickman, P.; Bergman, H.; McKinney, J.D.; Walker, M. P. Chem. Biol. Interact., 1977, 17, 69-87.
Hernandez, H. F.; Francisco, J. L. B.; Escriche, J. M.;Ubeda, J. C. B. J. Assoc. Off. Anal. Chem. 1987, 70 (4) 727-733.
Hutzinger, 0.; Safe, S.; Zitko, V. Environ. HealthPerspec. 1972 1(1) 15-20.
Hutzinger, O.; Safe, S.; Zitko, V. The Chemistry of PCBs,CRC Press, Cleveland, OH 1974.
Kociba, R. J.; Cabey, 0. Chemosphere, 1985, 14(6/7) 649-660.
Lau, S.; Zannoni, V. G. Mol. Pharmacol., 1981, 20, 234-235.
Levin, E. D.; Schantz, S. L.; Bovnnan, R. E.; Arch.Toxicol. 1988, 62, 267-273.
Matthews, D. E.; Hayes, J. M. Anal. Chem. 1976 48 (9)1375-1382.
Matthews, H.; Fries, G.; Gardner, A.; Garthoff, L.,;Goldstein, J.; Ku, Y.; Moore, J. Environ. Health Perspect.,1978, 24, 147-155.
McFarland, Clarke; Clarke, J. U. Environ. HealthPerspect. 1989, 81, 225-239.
McKinney, J. D.; Singh, P. Chem. Biol. Interact. 1981,33, 271-283.
Messier, F.; Levesque, M-F.; Masse, R. Abstract from the31st Annual Conference on Mass Spectrometry and Allied Topics,American Society for Mass Spectrometry 1983 p 225.
Moolenaar, R. J. Advances in Exposure, Health and
82

Environmental Effects Studies of PCBs: Symposium Proceedings.USEPA Washington, D. C. ; Report No. LSI-TR-507-137B, NTIS No.PB84-135771 1983.
Mullin, M. D.; Pochini, C. M.; McCrindle, S.; Romkes, M.;Safe, S. H.; Safe, L. M. ES&T 1984 18 468-476.
Nebert, D. W.; Jensen, N. M. Crit. Rev. Biochem. 1979,6(4), 401-437.
Pickup J. F.; McPherson, K. Anal. Chem. 1976 48 (13)1885-1890.
Roberts, E. A.; Shear, N. H.; Okey, A. B. Chejnosphere,1985, 14(6/7), 661-674.
Safe, S.; Wyndham, C; Parkinson, A.; Purdy, R.;Crawford, A. Hydrocarbons and Halogenated Hydrocarbons in theAquatic Environment, N. Y., N. Y.: Plenum Press, 1980.
Safe, S. Chemosphere, 1983, 12(4/5), 447-451.
Safe, S.; Sawyer, T.; Mason, G.; Bandiera, S.; Keys, B.;Romkes, M.; Piskorska-Pliszczynska, J.; Zmudzka, B.; Safe, L.Chemosphere, 1985, 14(6/7), 675-683.
Safe, S. Chemosphere, 1987, 16(4), 791-802.
Safe, S.; Parkinson, A.; Robertson, L.; Sawyer, T.;Bandiera, S.; Safe, L.; Campbell M. A.; Mullin M. "PCBs:Structure-Activity Relationships," Advances in Exposure,Health, and Environmental Effects of PCBs: SymposiumProceedings. Office of Toxic Substances, U. S. EnvironmentalProtection Agency, Report No. LSI-TR-507-137B; NTIS No. PB-84-135771 1983.
Safe, S.; Parkinson, A.; Robertson, L.; Cockerline, R.;Safe, L.; Bandiera, S.; Okey, A. PCBs as AHH inducers In:Chlorinated Dioxins and Related Compounds, Pergamon Press, NewYork, 1982, 383-392.
Schoeller, D. A. Biomed. Mass Spect. 1976 3 265-271.
Storm, J. E.; Hart, J. L.; Smith, R. F. Neurobehav.Toxicol. Teratol. 1981, 3, 5-9.
Tanabe, S.; Kannan, N.; Subramanian, A.; Watanabe, S.;Tatsukawa, R. Environ. Pollut. 1987, 47, 147-163.
Tilson, H. A.; Davis, G. J.; McLaubhlan, J. A.; Lucier,G. W. Environ Res. 1979, 18, 466-474.
83
U. S. Environmental Protection Agency. Ambient WaterQuality Criteria for Polychlorinated Biphenyls, Report No.EPA-440/5-80-068, National Technical Information Services,Springfield, VA, 1980.
U. S. Environmental Protection Agency. Method 1624Revision B. and Method 1625 Revision B. Office of WaterRegulations and Standards Industrial Technoloby Division Jan.1985.
Williams, L. L.; Glesy, J. P.; DeGalan, N.; Verbrugge, D.A.; Tillitt, D. E.; Ankley, G. T.; Welch, R. L; ES&T 1992, 26,1151-1159.
84