Embed Size (px)
Citation preview

Analysis of physical properties of soil samples from test sites for landmine detection in Mozambique
prepared for the Joint Research Centre (JRC) Ispra, Italy
H. Preetz, J. Igel
Hannover, April 2006 Leibniz Institute for Applied Geosciences (GGA) Stilleweg 2 30165 Hannover, Germany www.gga-hannover.de
1
Content Page 1. Introduction 2
2. Material and Methods of Investigation 2
2.1 Soil Sampling 2
2.2 Methods of Investigation 3
3. Experimental Results 4
3.1 Soil physical and chemical properties 4
3.2 Physical Specification 7
4. Summary 19
6. Appendix
A Multi frequency complex magnetic susceptibility 20
B Total substance contents analysed by X-ray fluorescence 22 spectroscopy
2
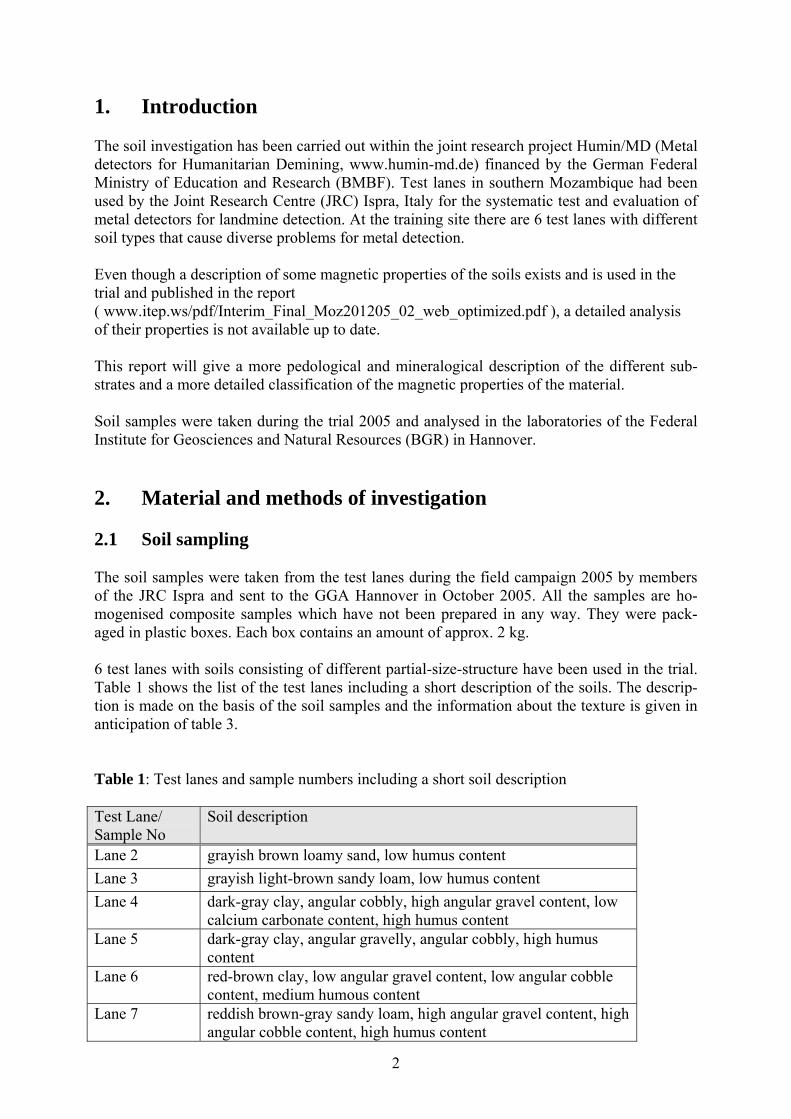
1. Introduction The soil investigation has been carried out within the joint research project Humin/MD (Metal detectors for Humanitarian Demining, www.humin-md.de) financed by the German Federal Ministry of Education and Research (BMBF). Test lanes in southern Mozambique had been used by the Joint Research Centre (JRC) Ispra, Italy for the systematic test and evaluation of metal detectors for landmine detection. At the training site there are 6 test lanes with different soil types that cause diverse problems for metal detection. Even though a description of some magnetic properties of the soils exists and is used in the trial and published in the report ( www.itep.ws/pdf/Interim_Final_Moz201205_02_web_optimized.pdf ), a detailed analysis of their properties is not available up to date. This report will give a more pedological and mineralogical description of the different sub-strates and a more detailed classification of the magnetic properties of the material. Soil samples were taken during the trial 2005 and analysed in the laboratories of the Federal Institute for Geosciences and Natural Resources (BGR) in Hannover. 2. Material and methods of investigation 2.1 Soil sampling The soil samples were taken from the test lanes during the field campaign 2005 by members of the JRC Ispra and sent to the GGA Hannover in October 2005. All the samples are ho-mogenised composite samples which have not been prepared in any way. They were pack-aged in plastic boxes. Each box contains an amount of approx. 2 kg. 6 test lanes with soils consisting of different partial-size-structure have been used in the trial. Table 1 shows the list of the test lanes including a short description of the soils. The descrip-tion is made on the basis of the soil samples and the information about the texture is given in anticipation of table 3. Table 1: Test lanes and sample numbers including a short soil description Test Lane/ Sample No
Soil description
Lane 2 grayish brown loamy sand, low humus content Lane 3 grayish light-brown sandy loam, low humus content Lane 4 dark-gray clay, angular cobbly, high angular gravel content, low
calcium carbonate content, high humus content Lane 5 dark-gray clay, angular gravelly, angular cobbly, high humus
content Lane 6 red-brown clay, low angular gravel content, low angular cobble
content, medium humous content Lane 7 reddish brown-gray sandy loam, high angular gravel content, high
angular cobble content, high humus content
3
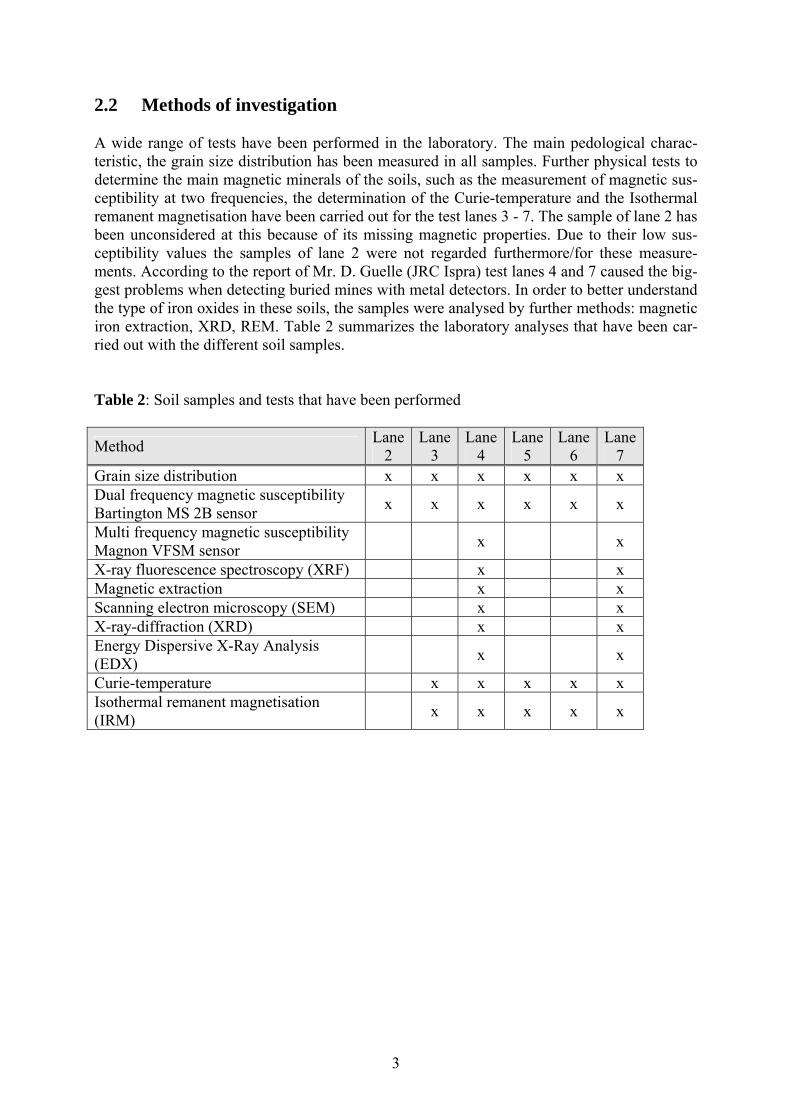
2.2 Methods of investigation A wide range of tests have been performed in the laboratory. The main pedological charac-teristic, the grain size distribution has been measured in all samples. Further physical tests to determine the main magnetic minerals of the soils, such as the measurement of magnetic sus-ceptibility at two frequencies, the determination of the Curie-temperature and the Isothermal remanent magnetisation have been carried out for the test lanes 3 - 7. The sample of lane 2 has been unconsidered at this because of its missing magnetic properties. Due to their low sus-ceptibility values the samples of lane 2 were not regarded furthermore/for these measure-ments. According to the report of Mr. D. Guelle (JRC Ispra) test lanes 4 and 7 caused the big-gest problems when detecting buried mines with metal detectors. In order to better understand the type of iron oxides in these soils, the samples were analysed by further methods: magnetic iron extraction, XRD, REM. Table 2 summarizes the laboratory analyses that have been car-ried out with the different soil samples. Table 2: Soil samples and tests that have been performed
Method Lane2
Lane 3
Lane 4
Lane 5
Lane 6
Lane 7
Grain size distribution x x x x x x Dual frequency magnetic susceptibility Bartington MS 2B sensor x x x x x x
Multi frequency magnetic susceptibility Magnon VFSM sensor x x
X-ray fluorescence spectroscopy (XRF) x x Magnetic extraction x x Scanning electron microscopy (SEM) x x X-ray-diffraction (XRD) x x Energy Dispersive X-Ray Analysis (EDX) x x
Curie-temperature x x x x x Isothermal remanent magnetisation (IRM) x x x x x
4
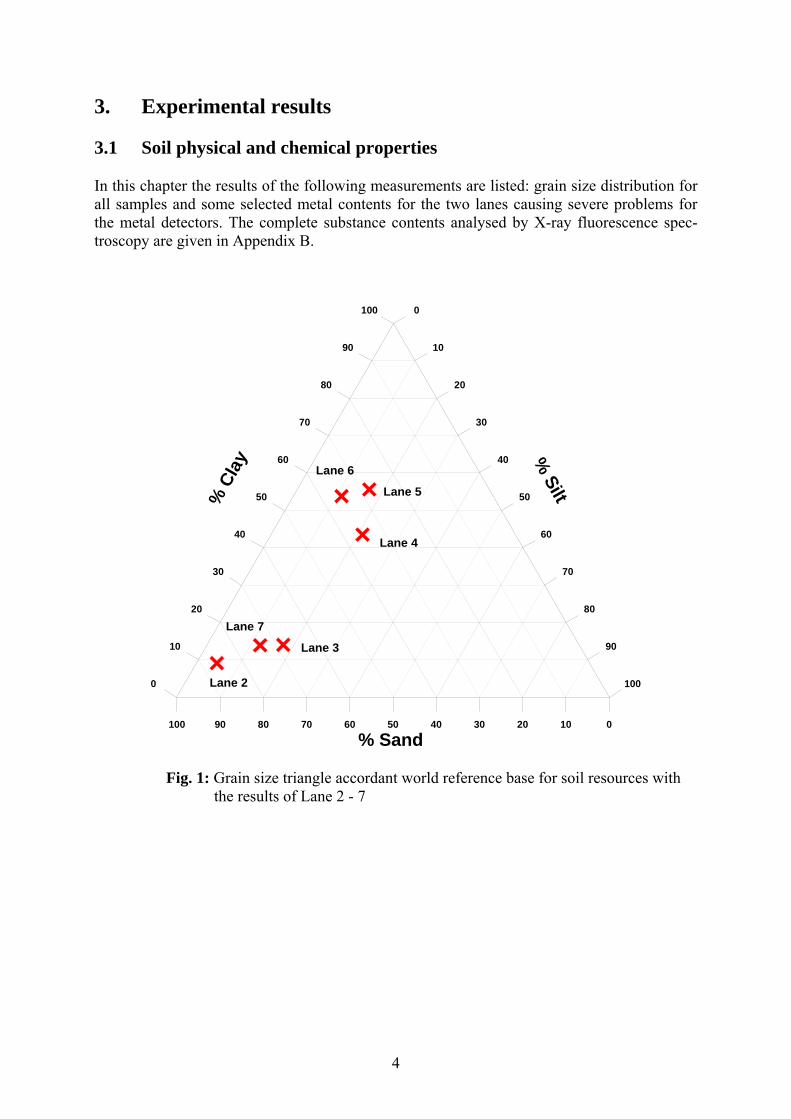
3. Experimental results 3.1 Soil physical and chemical properties In this chapter the results of the following measurements are listed: grain size distribution for all samples and some selected metal contents for the two lanes causing severe problems for the metal detectors. The complete substance contents analysed by X-ray fluorescence spec-troscopy are given in Appendix B.
100 80 60 40 20 090 70 50 30 10
% Sand
0
20
40
60
80
100
10
30
50
70
90
% Silt
0
20
40
60
80
100
10
30
50
70
90
% C
lay
Lane 6
Lane 5
Lane 4
Lane 3
Lane 7
Lane 2
Fig. 1: Grain size triangle accordant world reference base for soil resources with the results of Lane 2 - 7
5
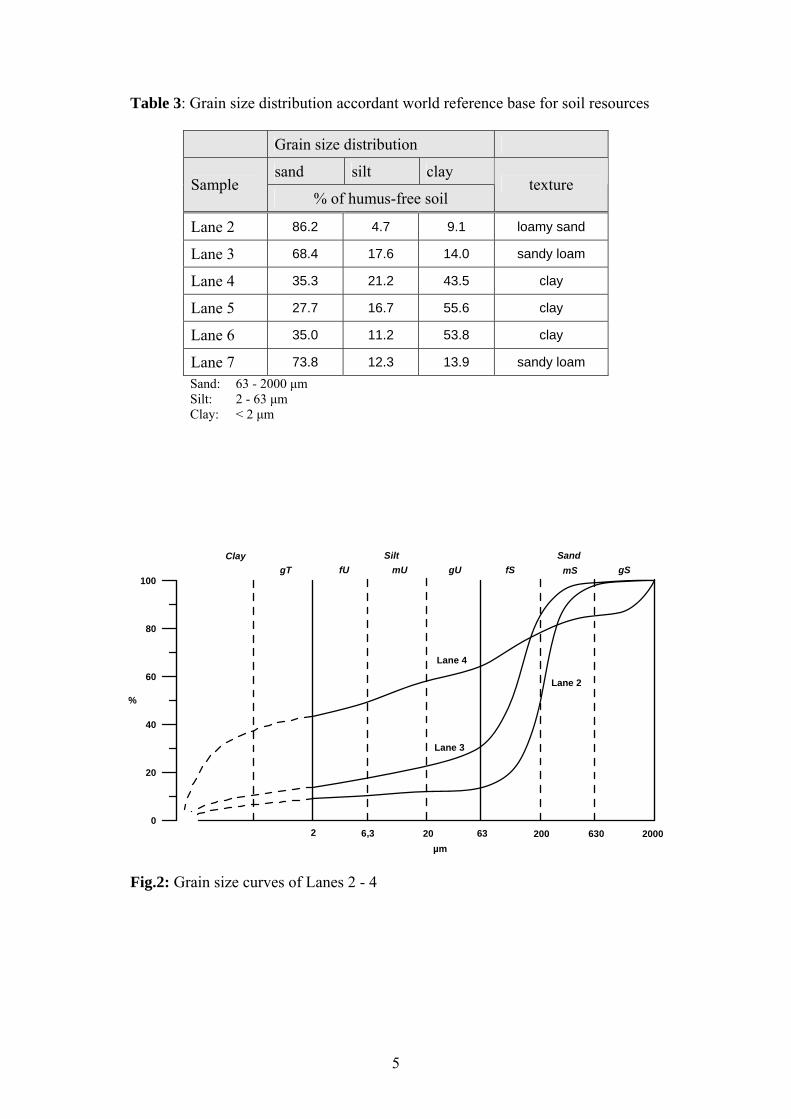
Table 3: Grain size distribution accordant world reference base for soil resources
Grain size distribution
sand silt clay Sample
% of humus-free soil texture
Lane 2 86.2 4.7 9.1 loamy sand
Lane 3 68.4 17.6 14.0 sandy loam
Lane 4 35.3 21.2 43.5 clay
Lane 5 27.7 16.7 55.6 clay
Lane 6 35.0 11.2 53.8 clay
Lane 7 73.8 12.3 13.9 sandy loam Sand: 63 - 2000 μm Silt: 2 - 63 μm Clay: < 2 μm
0
20
40
60
80
100
%
2 6,3 20 63 200 630 2000
Clay Silt SandgT fU mU gU fS mS gS
µm
Lane 2
Lane 3
Lane 4
Fig.2: Grain size curves of Lanes 2 - 4
6
0
20
40
60
80
100
%
2 6,3 20 63 200 630 2000
Clay Silt SandgT fU mU gU fS mS gS
µm
Lane 5 Lane 6
Lane 7
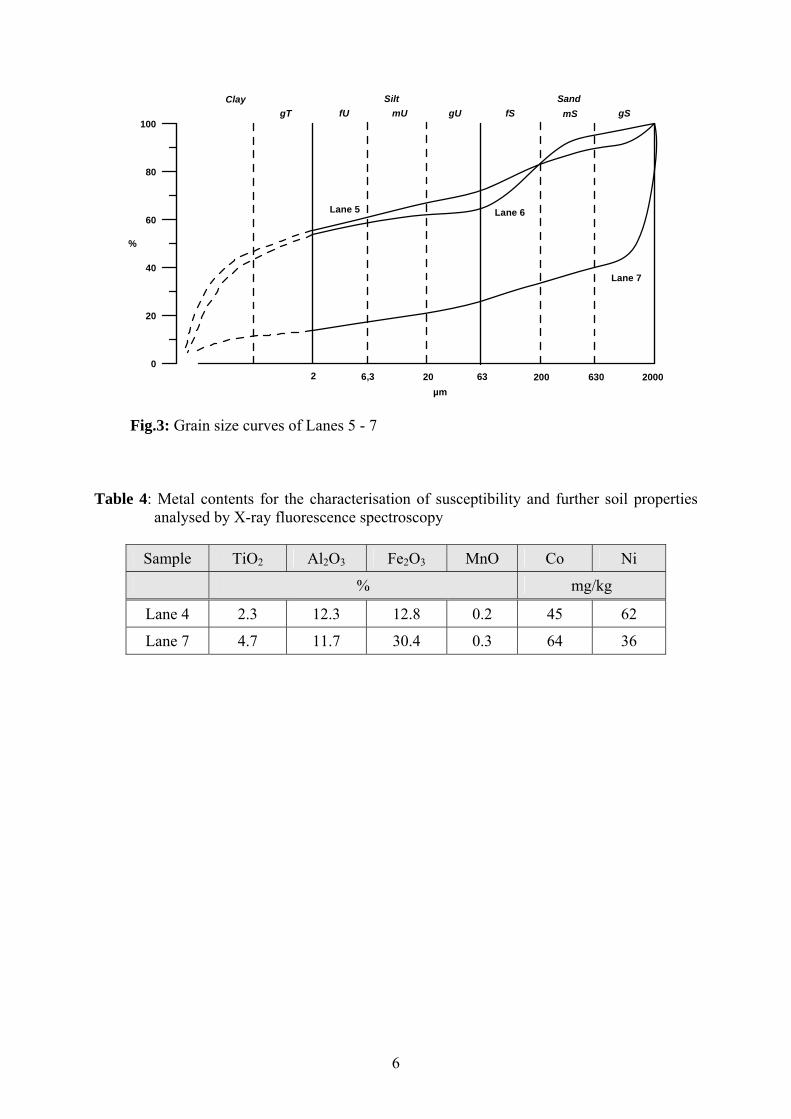
Fig.3: Grain size curves of Lanes 5 - 7 Table 4: Metal contents for the characterisation of susceptibility and further soil properties
analysed by X-ray fluorescence spectroscopy
Sample TiO2 Al2O3 Fe2O3 MnO Co Ni
% mg/kg
Lane 4 2.3 12.3 12.8 0.2 45 62
Lane 7 4.7 11.7 30.4 0.3 64 36

7
3.2 Physical specification The most important parameter affecting the detection of landmines with metal detectors ad-versely is the magnetic susceptibility and its frequency dependence. It has been measured with the well-known dual frequency kappa meter MS 2B from Bartington Instruments. The results are shown in table 5. Additionally a more sophisticated measurement had been carried out with the multi frequency magnetic susceptibility sensor Magnon SM200. With this device the real part of the magnetic susceptibility and the imaginary part as well have been measured at 12 frequencies. This more time consuming measurements have been carried out only with the samples containing a noticeable frequency effect and with those soils influencing the metal detectors adversely. These are the soils from the test lanes 3, 4, 6 and 7. The results are depicted in figure 4 – 7 as well as in the table of appendix A. Table 5: Dual frequency magnetic susceptibility (Bartington MS 2B sensor)
LF (465 Hz) HF (4650 Hz)Sample SI * 10-6
frequency effect [%] (LF-HF)/LF*100
difference LF - HF
Lane 2 133 130 - * 3 Lane 3 1110 1060 4.5 50 Lane 4 11240 10980 2.3 260 Lane 5 11770 11470 2,6 300 Lane 6 5610 5180 7.7 430 Lane 7 27740 27280 1.7 460
* Values of susceptibility too low for reliable determination
10 100 1000 10000frequency [Hz]
0
200
400
600
800
1000
1200
1400
Sus
rea
l par
t [10
-6 S
I]
0
100
200
300
400
500
600
Sus
imag
inar
y pa
rt [1
0-6
SI]
Mocambique, Moamba, Lane 3(H = 161 A/m)
real partimaginary part
8
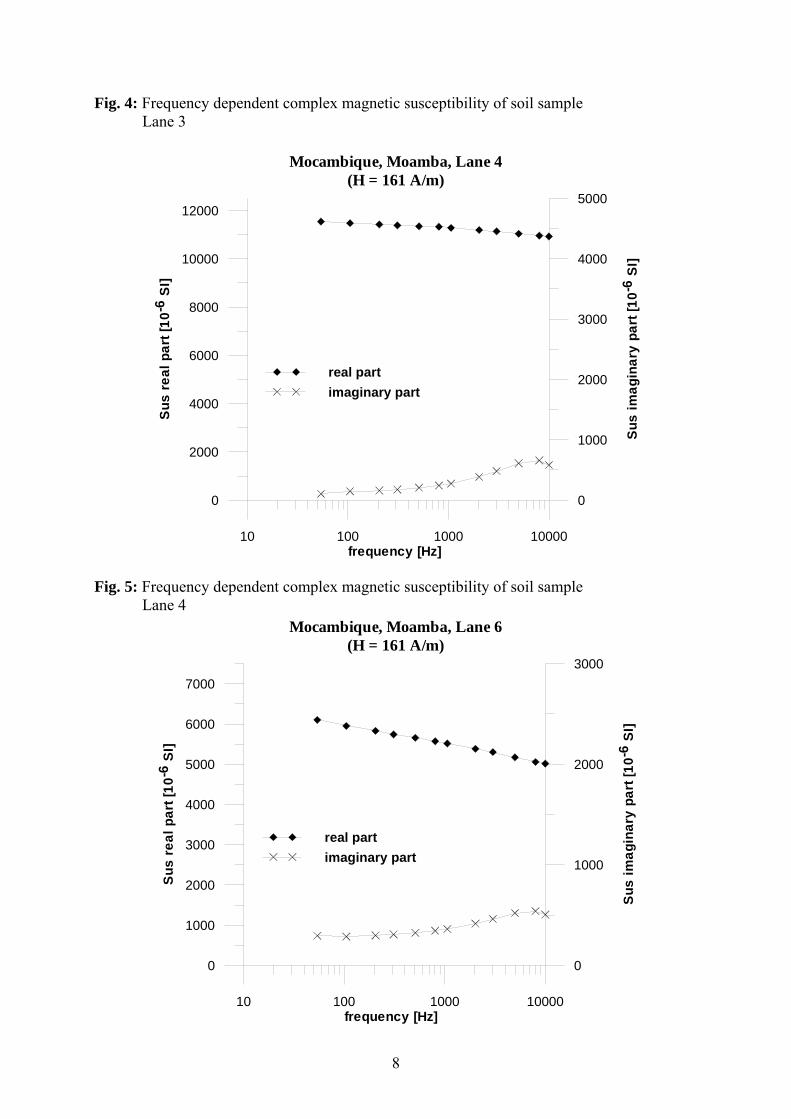
Fig. 4: Frequency dependent complex magnetic susceptibility of soil sample Lane 3
10 100 1000 10000frequency [Hz]
0
2000
4000
6000
8000
10000
12000
Sus
rea
l par
t [10
-6 S
I]
0
1000
2000
3000
4000
5000
Sus
imag
inar
y pa
rt [1
0-6
SI]
Mocambique, Moamba, Lane 4(H = 161 A/m)
real partimaginary part
Fig. 5: Frequency dependent complex magnetic susceptibility of soil sample
Lane 4
10 100 1000 10000frequency [Hz]
0
1000
2000
3000
4000
5000
6000
7000
Sus
rea
l par
t [10
-6 S
I]
0
1000
2000
3000
Sus
imag
inar
y pa
rt [1
0-6
SI]
Mocambique, Moamba, Lane 6(H = 161 A/m)
real partimaginary part
9
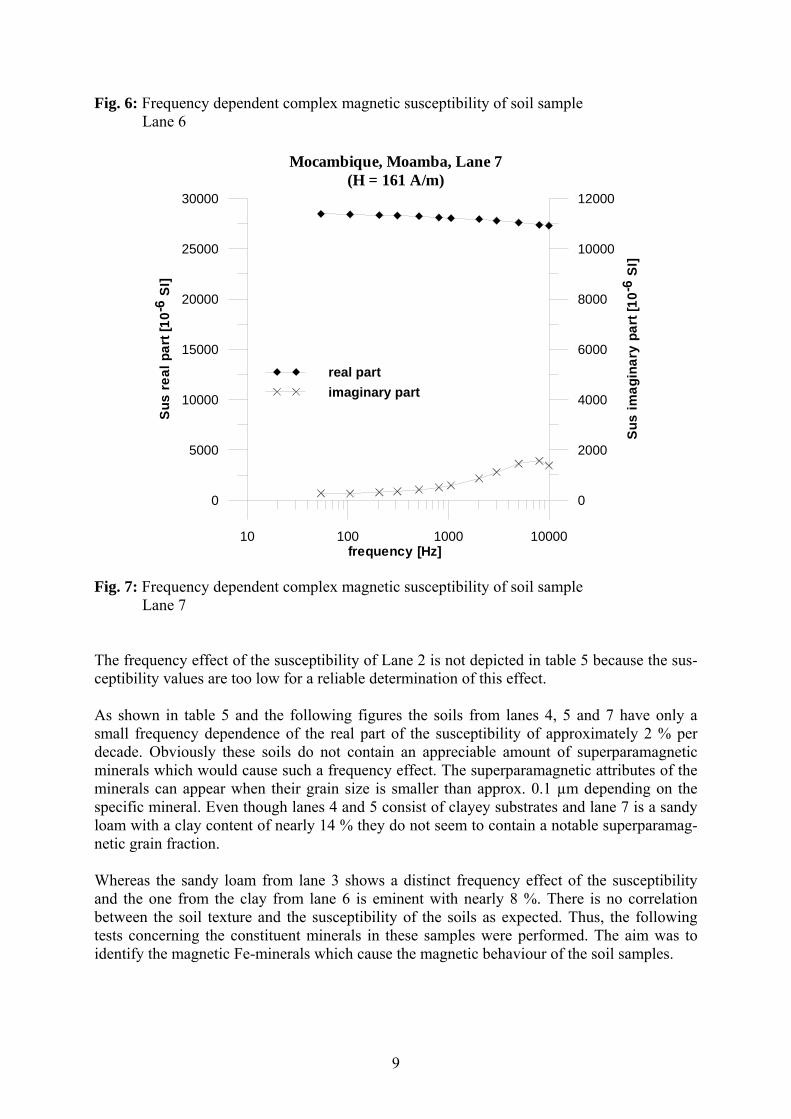
Fig. 6: Frequency dependent complex magnetic susceptibility of soil sample Lane 6
10 100 1000 10000frequency [Hz]
0
5000
10000
15000
20000
25000
30000
Sus
rea
l par
t [10
-6 S
I]
0
2000
4000
6000
8000
10000
12000
Sus
imag
inar
y pa
rt [1
0-6
SI]
Mocambique, Moamba, Lane 7(H = 161 A/m)
real partimaginary part
Fig. 7: Frequency dependent complex magnetic susceptibility of soil sample
Lane 7 The frequency effect of the susceptibility of Lane 2 is not depicted in table 5 because the sus-ceptibility values are too low for a reliable determination of this effect. As shown in table 5 and the following figures the soils from lanes 4, 5 and 7 have only a small frequency dependence of the real part of the susceptibility of approximately 2 % per decade. Obviously these soils do not contain an appreciable amount of superparamagnetic minerals which would cause such a frequency effect. The superparamagnetic attributes of the minerals can appear when their grain size is smaller than approx. 0.1 µm depending on the specific mineral. Even though lanes 4 and 5 consist of clayey substrates and lane 7 is a sandy loam with a clay content of nearly 14 % they do not seem to contain a notable superparamag-netic grain fraction. Whereas the sandy loam from lane 3 shows a distinct frequency effect of the susceptibility and the one from the clay from lane 6 is eminent with nearly 8 %. There is no correlation between the soil texture and the susceptibility of the soils as expected. Thus, the following tests concerning the constituent minerals in these samples were performed. The aim was to identify the magnetic Fe-minerals which cause the magnetic behaviour of the soil samples.

10
Fig. 8: X-Ray diffractogram of the soil sample from Lane 4.
Fig. 9: X-Ray diffractogram of the soil sample from Lane 7.

11
The X-Ray diffractogram of lane 4 is displaying the clay mineral smectite as the main com-ponent whereas the one of lane 7 is quartz. Both samples are containing feldspar and quartz. The secondary component in lane 4 is augite which is a prevalent mineral in igneous rocks. The secondary components in lane 7 are hematite and goethite. The first of them is causing the reddish colour of the soil and the result correlates with the very high iron content of 30 % of that soil (table 4). But due to their relative low susceptibility values none of these minerals is making a contribution to the high value of susceptibility of the soil. Finally the magnetic Fe-minerals could not be identified with the help of X-Ray diffraction in both untreated soil samples. This means that their content is lower than about 2 %.
0 1000 2000 3000B[mT]
0
0.2
0.4
0.6
0.8
1
IRM
nor
m [
]
Lanes 3, 4
Lane 3
Lane 4
Fig. 10: Isothermal remanent magnetisation of Lane 3 and Lane 4: the normalised magneti-
sation is plotted versus the applied outer magnetic field.

12
0 1000 2000 3000B[mT]
0
0.2
0.4
0.6
0.8
1
IRM
nor
m [
]
Lanes 5, 6, 7
Lane 5
Lane 6
Lane 7
Fig. 11: Isothermal remanent magnetisation of Lanes 5, 6 and 7: the normalised magneti-
sation is plotted versus the applied outer magnetic field. The determination of the isothermal remanent magnetisation (IRM) can be used to distinguish between high coercitive minerals (hematite, goethite) and low coercitive minerals (magnetite, titanomagnetite). The latter are magnetised readily when applying an outer magnetic field. Thus, their magnetisation rises steeply and reaches a saturation plateau at relatively low mag-netic fields. As both figures show such a behaviour the magnetic properties of lanes 3, 4, 5 and 7 are caused by low coercitive minerals, most likely magnetite and titanomagnetite. The curve of lane 6 is also showing the steep rise of the coercitive minerals but there is also a flattening at about 500 mT and an even rise from this point. This is a clue for the active pres-ence of high coercitive minerals.

13
0 100 200 300 400 500 600T [°C]
-0.8
-0.6
-0.4
-0.2
0
0.2
0.4
0.6
0.8
1
Mre
l [ ]
Lanes 3, 4, 5
Lane 3 Lane 4
Lane 5
Fig. 12: Determination of the Curie-temperature of Lanes 3, 4 and 5: the normalised
magnetisation is plotted versus the temperature.
0 100 200 300 400 500 600T [°C]
-0.6
-0.4
-0.2
0
0.2
0.4
0.6
0.8
1
Mre
l [ ]
Lanes 6, 7
Lane 7Lane 6
Fig. 13: Determination of the Curie-temperature of Lanes 6 and 7: the normalised magneti-
sation is plotted versus the temperature.
14
The Curie temperature is the temperature where ferrimagnetic minerals lose their ferrimag-netic behaviour and become paramagnetic. For the determination of this point the samples are heated up in an outer magnetic field and the magnetisation is measured. The curves of thermal demagnetisation of the samples from lanes 3 - 7 are shown in fig. 12 and 13. The curves of lanes 3 and 6 are looking similar. Their demagnetisation does not have a distinct attribution to a specific mineral. Both seem to have a very low ferromagnetic phase. Whereas the susceptibility of lane 6 is not really low, it is supposed to contain a certain amount of ferromagnetic minerals. Thus the reduce of weight of the sample during the measurement can be the result of the evaporation of residual water. The evaporation of resid-ual water during the temperature rise will cause a reduction of the weight of the sample and thus a decrease of the apparent magnetisation. In this case a specific curie temperature ac-cording to a specific mineral can not be determined. A Curie temperature is not for reading in these two samples. The curves of lanes 4, 5 and 7 differ from the two others. They show a decline in the range of 500 °C which is near the Curie-temperature of magnetite. The run of the curve indicates also the possibility of several ferromagnetic phases. From there the presence of maghemite is pos-sible. The attenuation of the signal in the further run is an indicator for a paramagnetic phase. However magnetite and perhaps titanomagnetite seem to be the main cause for the magnetic properties of these samples.
15
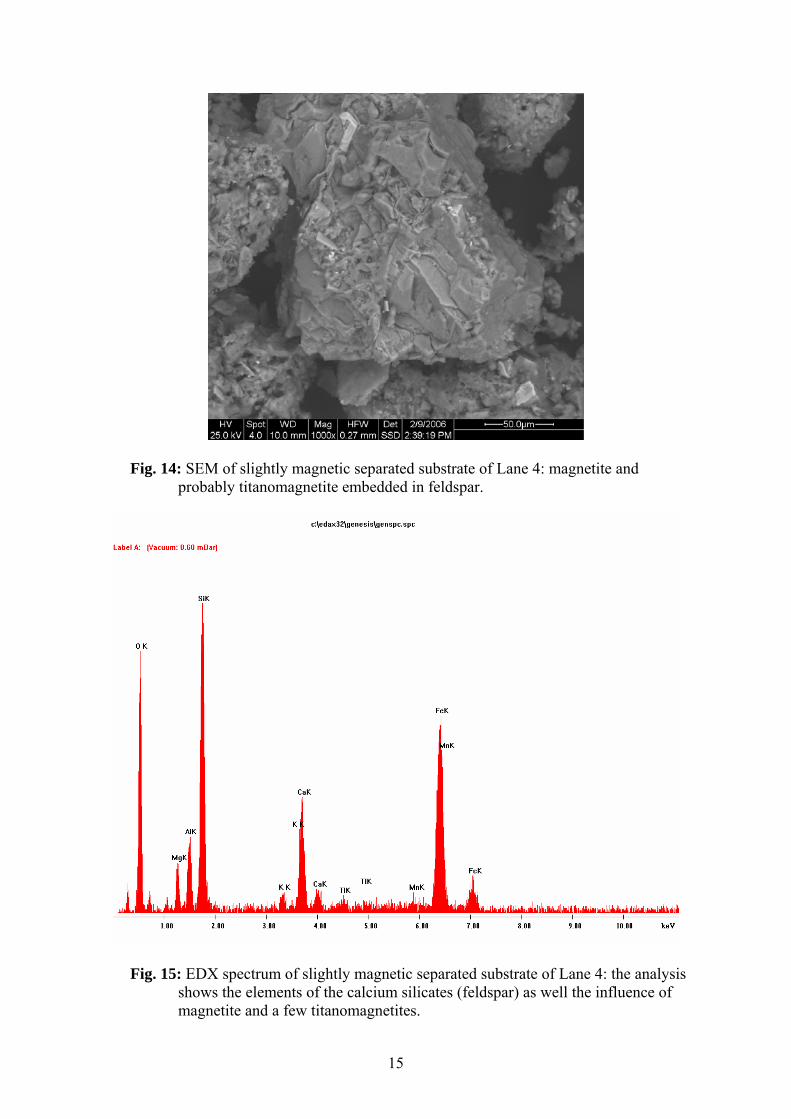
Fig. 14: SEM of slightly magnetic separated substrate of Lane 4: magnetite and probably titanomagnetite embedded in feldspar.
Fig. 15: EDX spectrum of slightly magnetic separated substrate of Lane 4: the analysis shows the elements of the calcium silicates (feldspar) as well the influence of magnetite and a few titanomagnetites.
16
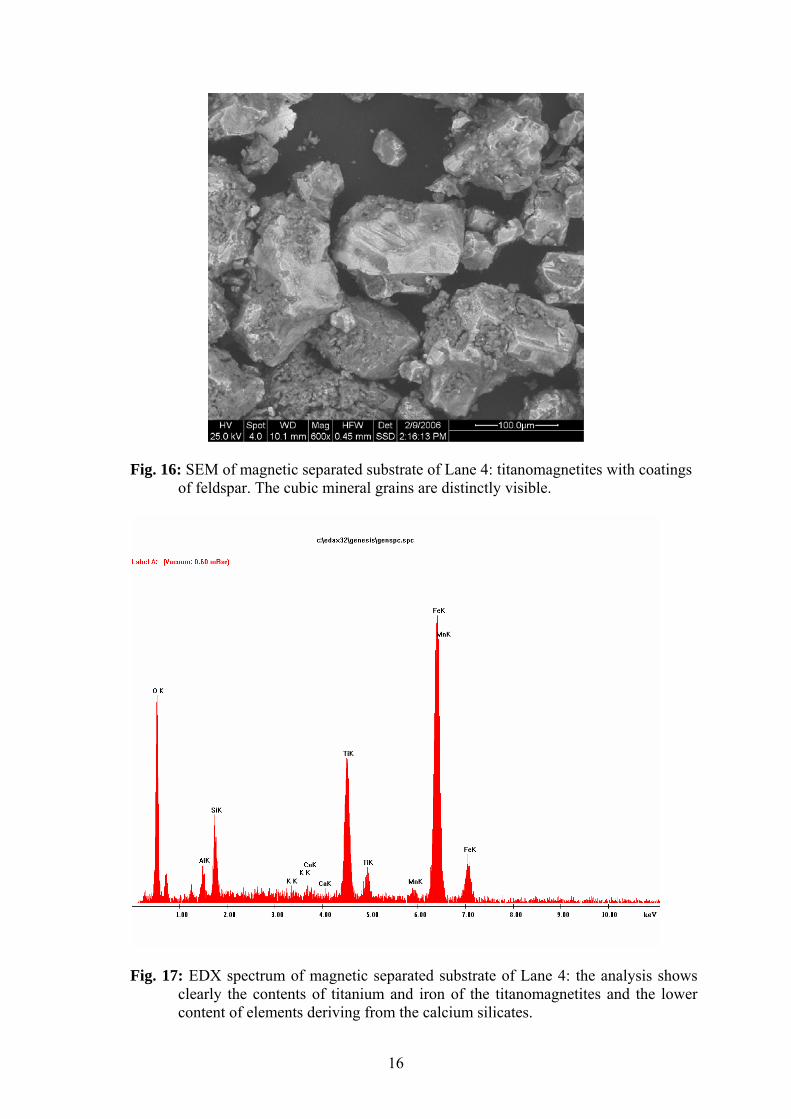
Fig. 16: SEM of magnetic separated substrate of Lane 4: titanomagnetites with coatings of feldspar. The cubic mineral grains are distinctly visible.
Fig. 17: EDX spectrum of magnetic separated substrate of Lane 4: the analysis shows clearly the contents of titanium and iron of the titanomagnetites and the lower content of elements deriving from the calcium silicates.
17
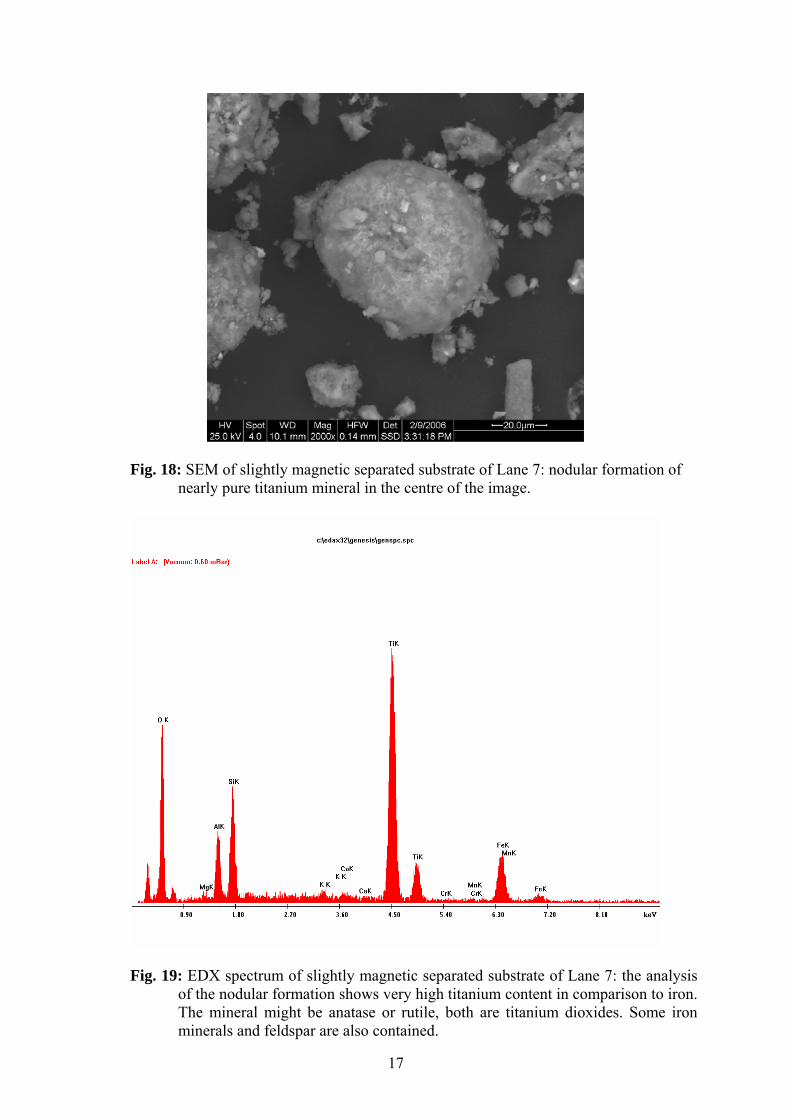
Fig. 18: SEM of slightly magnetic separated substrate of Lane 7: nodular formation of nearly pure titanium mineral in the centre of the image.
Fig. 19: EDX spectrum of slightly magnetic separated substrate of Lane 7: the analysis of the nodular formation shows very high titanium content in comparison to iron. The mineral might be anatase or rutile, both are titanium dioxides. Some iron minerals and feldspar are also contained.

18
Fig. 20: SEM of magnetic separated (Magnet 10 mm) substrate of Lane 7: titanomag-netites embedded in silicates, mainly feldspar. The shape of the titanomagnetite is still visible.
Fig. 21: EDX spectrum of magnetic separated substrate of Lane 7: the analysis of the cubic mineral in fig. 20 shows high titanium content and a small influence of the silicates in the surounding.

19
4. Summary The soils from Lane 4 and 7 are those generating the biggest problems for landmine detection. Both have a high magnetic susceptibility which is up to 11000 and 27000 * 10-6 SI units respectively. The frequency effect is low for both samples. It is 2.3 and accordingly 1.7 %. The absolute differences between the values measured at low and high frequencies are 260 and 460 * 10-6 SI units. This might be a contribution for the problems of the metal detectors. The geophysical laboratory measurements (IRM and Curie temperature) provide indications about the mineral compound causing the susceptibility. Hereafter magnetite and titanomag-netite in both samples are responsible for the magnetic behaviour of the soils. These minerals become clearly visible in the images made with the electron microscopy. Especially in lane 7 the contingent of titanomagnetite seems to be very high. This result is correlating with the high titanium content (4.7 % TiO2, see table 4) of that sample. Both minerals are common accessory minerals in igneous rocks and vulcanites. These results show that the soil com-pounds causing the magnetic properties in lanes 4 and 7 derive mainly from the parent mate-rial of the soil. Unfortunately we do not have any information about the geology of the origin of the soils but they are supposed to have some igneous rocks and lane 7 some volcanic rock as parent material. The results of the chemical analyses (table 4 and appendix B) show high Ti- and Fe- contents in lane 4 and very high contents of these residual accumulated metals in lane 7. This is the result of the long and intense weathering of these soils in a tropical climate. The low ratio of SiO2/(Al2O3 + Fe2O3) especially in lane 7 is demonstrating this as well. Thus we can expect the additional presence of maghemite, a ferromagnetic mineral which is con-nected to the soil development. It is formed by the weathering or oxidation of minerals in the soil containing ferrous iron. Common sources for this are magnetite and titanomagnetite. The measurement of the Curie temperature is indicating the influence of maghemite contingently. This would be a further contribution to the magnetic properties of the soils. The other soils are characterised as follows: Lane 2 has a low susceptibility and no frequency effect due to the absence of ferromagnetic minerals. The soil from lane 3 has a noticeable susceptibility and frequency effect as well but a low absolute difference between the low and the high frequency. Lane 5 has a high susceptibility, a low frequency effect and a high absolute difference between both frequencies. Whereas lane 6 is remarkable because of its high susceptibility and frequency effect and absolute dif-ference as well. The identification of minerals with IRM in lane 3 and 5 yields similar results as for lanes 4 and 7. The soils are containing amounts of the coercitive minerals magnetite and titanomag-netite. Lane 6 has the same compound, but additionally there is some influence of high coer-citive minerals like the numerous hematite and goethite. With the determination of the Curie temperature a further statement is possible for lane 5: The similarity of the ferromagnetic mineral compound to lane 4 and 7 is approved. But additionally maghemite as a product of soil development is possibly influencing the magnetic soil properties.

20
Appendix A Table I: Multi frequency complex magnetic susceptibility (Magnon sensor)
Real part X'
Imaginary part X''
Sample f [Hz] H [A/m]
SI * 10-6 Lane 3 54 161 1164 55 Lane 3 105 161 1146 23 Lane 3 205 161 1137 36 Lane 3 310 161 1124 31 Lane 3 510 161 1115 33 Lane 3 804 161 1108 39 Lane 3 1060 161 1101 42 Lane 3 2020 161 1086 53 Lane 3 3013 161 1076 62 Lane 3 4993 161 1062 75 Lane 3 7991 161 1050 79 Lane 3 9991 161 1046 72 Lane 4 54 161 11540 104 Lane 4 105 161 11477 149 Lane 4 205 161 11424 160 Lane 4 310 161 11386 176 Lane 4 510 161 11347 205 Lane 4 804 161 11326 242 Lane 4 1060 161 11281 274 Lane 4 2020 161 11193 385 Lane 4 3013 161 11141 482 Lane 4 4993 161 11038 612 Lane 4 7991 161 10959 658 Lane 4 9991 161 10926 583

21
Table I: continued
Real part X'
Imaginary part X''
Sample f [Hz] H [A/m]
SI * 10-6 Lane 6 54 161 6101 295 Lane 6 105 161 5951 287 Lane 6 205 161 5829 298 Lane 6 310 161 5743 309 Lane 6 510 161 5658 324 Lane 6 804 161 5573 344 Lane 6 1060 161 5517 361 Lane 6 2020 161 5384 415 Lane 6 3013 161 5303 461 Lane 6 4993 161 5173 520 Lane 6 7991 161 5056 540 Lane 6 9991 161 5016 505 Lane 7 54 161 28467 266 Lane 7 105 161 28467 277 Lane 7 205 161 28412 261 Lane 7 310 161 28342 315 Lane 7 510 161 28302 350 Lane 7 804 161 28241 415 Lane 7 1060 161 28107 509 Lane 7 2020 161 28039 590 Lane 7 3013 161 27945 872 Lane 7 4993 161 27785 1114 Lane 7 7991 161 27599 1444 Lane 7 9991 161 27366 1559
22
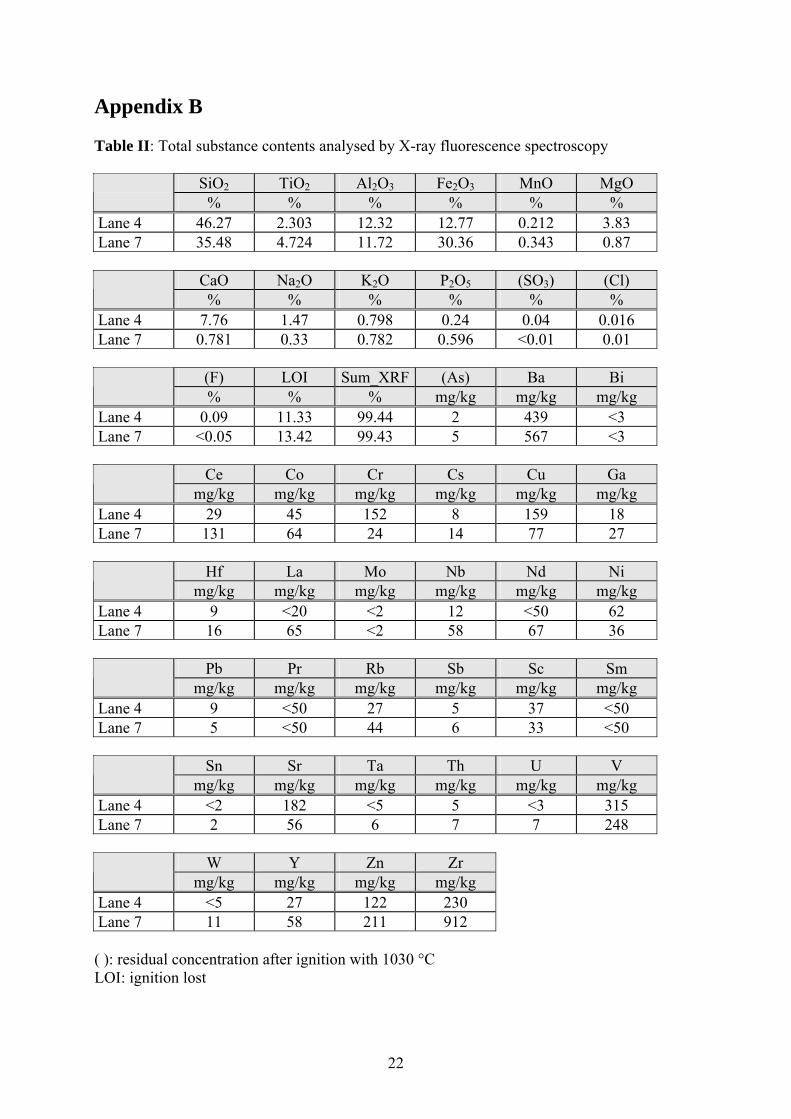
Appendix B Table II: Total substance contents analysed by X-ray fluorescence spectroscopy
SiO2 TiO2 Al2O3 Fe2O3 MnO MgO % % % % % %
Lane 4 46.27 2.303 12.32 12.77 0.212 3.83 Lane 7 35.48 4.724 11.72 30.36 0.343 0.87
CaO Na2O K2O P2O5 (SO3) (Cl) % % % % % %
Lane 4 7.76 1.47 0.798 0.24 0.04 0.016 Lane 7 0.781 0.33 0.782 0.596 <0.01 0.01
(F) LOI Sum_XRF (As) Ba Bi % % % mg/kg mg/kg mg/kg
Lane 4 0.09 11.33 99.44 2 439 <3 Lane 7 <0.05 13.42 99.43 5 567 <3
Ce Co Cr Cs Cu Ga mg/kg mg/kg mg/kg mg/kg mg/kg mg/kg
Lane 4 29 45 152 8 159 18 Lane 7 131 64 24 14 77 27
Hf La Mo Nb Nd Ni mg/kg mg/kg mg/kg mg/kg mg/kg mg/kg
Lane 4 9 <20 <2 12 <50 62 Lane 7 16 65 <2 58 67 36
Pb Pr Rb Sb Sc Sm mg/kg mg/kg mg/kg mg/kg mg/kg mg/kg
Lane 4 9 <50 27 5 37 <50 Lane 7 5 <50 44 6 33 <50
Sn Sr Ta Th U V mg/kg mg/kg mg/kg mg/kg mg/kg mg/kg
Lane 4 <2 182 <5 5 <3 315 Lane 7 2 56 6 7 7 248
W Y Zn Zr mg/kg mg/kg mg/kg mg/kg
Lane 4 <5 27 122 230 Lane 7 11 58 211 912 ( ): residual concentration after ignition with 1030 °C LOI: ignition lost